")
Back to Journals » International Journal of Nanomedicine » Volume 13
Copolymer micelles function as pH-responsive nanocarriers to enhance the cytotoxicity of a HER2 aptamer in HER2-positive breast cancer cells
Authors Shen Y, Zhang J, Hao W, Wang T, Liu J, Xie Y, Xu S, Liu H
Received 25 August 2017
Accepted for publication 22 October 2017
Published 25 January 2018 Volume 2018:13 Pages 537—553
DOI https://doi.org/10.2147/IJN.S149942
Checked for plagiarism Yes
Review by Single anonymous peer review
Peer reviewer comments 2
Editor who approved publication: Professor Lei Yang
Yinxing Shen,1,2,* Junqi Zhang,2,* Weiju Hao,1 Tong Wang,1 Jing Liu,2 Youhua Xie,2 Shouhong Xu,1 Honglai Liu1
1State Key Laboratory for Advanced Materials, School of Chemistry and Molecular Engineering, East China University of Science and Technology, 2Department of Medical Microbiology and Parasitology, Key Laboratory of Medical Molecular Virology of MOE/MOH, School of Basic Medical Sciences, Fudan University, Shanghai, People’s Republic of China
*These authors contributed equally to this work
Abstract: Efficient delivery of nucleic acids into target cells is crucial for nucleic acid-based therapies. Various nucleic acid delivery systems have been developed, each with its own advantages and limitations. We previously developed a nanoparticle-based delivery system for small chemical drugs using pH-responsive PEG8-PDPA100-PEG8 polymer micelles as carriers. In this study, we extend the application of these pH-responsive micelle-like nanoparticles (MNPs) to deliver oligonucleotides. We demonstrate that the MNPs efficiently encapsulate and deliver oligonucleotides of different lengths (20–100 nt) into cells. The cargo oligonucleotides are rapidly released at pH 5.0. We prepared MNPs carrying a Texas red-fluorescently labeled anti-human epidermal growth factor receptor 2 (HER2) aptamer (HApt). Compared to free HApt, the HApt-MNPs resulted in significantly better cellular uptake, reduced cell viability, and increased apoptosis in SKBR3 breast cancer cells, which overexpress HER2. Moreover, HApt-MNPs were significantly less cytotoxic to MCF7 breast cancer cells, which express low levels of HER2. After cellular uptake, HApt-MNPs mainly accumulated in lysosomes; inhibition of lysosomal activity using bafilomycin A1 and LysoTracker Red staining confirmed that lysosomal activity and low pH were required for HApt-MNP accumulation and release. Furthermore, HER2 protein expression declined significantly following treatment with HApt-MNPs in SKBR3 cells, indicating that HApt-induced translocation of HER2 to lysosomes exerted a potent cytotoxic effect by altering signaling downstream of HER2. In conclusion, this pH-responsive and lysosome-targeting nanoparticle system can efficiently deliver oligonucleotides to specific target cells and has significant potential for nucleic acid-based cancer therapies.
Keywords: pH-responsive micelle-like nanoparticles, nucleic acid delivery, HER2-targeted therapy
Introduction
In recent decades, nucleic acid-based therapeutic agents have been developed and used in the clinic to treat multiple diseases, including cancer,1–4 diabetes,4–6 cardiovascular diseases,7,8 and infectious diseases.9–11 However, the large size, high anionic charge density, and hydrophilic properties of DNA and RNA molecules significantly limit their cellular uptake.12–15 Hence, a plethora of nucleic acid carriers have been developed in an attempt to overcome these barriers.
In general, nucleic acid delivery systems can be classified into two major groups: viral and nonviral.16–19 Viral vectors, such as retrovirus or adenovirus-based systems, have high transduction efficiencies. However, their application is limited by high production costs and biosafety and immunogenicity concerns.18,20,21 Nonviral systems, such as lipid- or polymer-based approaches, have gained much attention due to their low cytotoxicity, weak or lack of immunogenicity, and ease of production.22–26 Among the nonviral delivery systems, polymeric nanoparticles are an attractive option for gene therapy due to their unique properties including self-assembly behavior, ability to condense and protect nucleic acids, cell association, efficient cell transfection, and low cytotoxicity.23,25–28 Recently, the addition of stimuli-sensitive functions has enabled polymeric nanoparticles to specifically respond to pathological or externally applied “triggers” (eg, temperature, pH, enzymatic catalysis, and light or magnetic fields) and further extended their potential applications.29–32 For example, pH-responsive polymeric nanoparticles capable of protecting nucleic acids in the blood circulation and actively releasing their cargo in the tumor microenvironment and/or inside the target tumor cells have received overwhelming interest in the context of cancer therapy.
We previously developed a novel pH-responsive delivery system for small chemical anticancer drugs from amphiphilic triblock copolymers composed of poly[2-(diisopropylamino)ethyl methacrylate] (PDPA) and methoxy-poly(ethyleneglycol) segments (PEG8-PDPAn-PEG8; n=30, 50, or 100).29,33 The PEG shell of the micelle-like nanoparticles (MNPs) prolongs the circulation of MNPs in the blood by reducing nonspecific associations with plasma proteins and tissues.34,35 The PDPA core serves as a pH sensor, which is hydrophobic at physiological pH (pH >7.4) and becomes hydrophilic at acidic conditions due to protonation of di-isopropylamin.36,37 Thus, the pH-responsive MNPs are stable at pH 7.4 but swell and disaggregate at a pH <6.0. MNPs composed of PEG8-PDPA100-PEG8 have been proven to possess a range of desirable properties, such as low cytotoxicity, superior efficiency to deliver small chemical drugs, and considerable lysosomal accumulation after cellular uptake.29
Human epidermal growth factor receptor 2 (HER2), a member of the epidermal growth factor-related protein (ErbB) family of receptor tyrosine kinases, is overexpressed on the plasma membranes of tumor cells in a variety of cancers compared to normal cells. Overexpression of HER2 is associated with the development and progression of a multitude of malignancies and is a major therapeutic target in several cancers.38 Downregulation of HER-2 expression attenuates HER2 signaling and promotes cell cycle arrest and apoptosis by altering a number of downstream signaling pathways.39,42,43 Recently, a 42 nucleotide (nt) trimeric anti-HER2 aptamer (HApt) derived from degradation of HER2 in lysosomes was reported to kill HER2-overexpressing N87 gastric cancer cells and SKBR3 breast cancer cells.40,41 The anti-HApt exerts a cytotoxic effect by inducing cross-linking of HER2 on the cell surface, which results in the translocation of HER2 from the plasma membrane to cytoplasmic vesicles (mainly in lysosomes), where HER2 is thought to be degraded by proteases.41
In this study, we extended the application of our PEG8-PDPA100-PEG8 MNPs to the delivery of oligonucleotides. The MNPs could efficiently package oligonucleotides of varied lengths (20–100 nt) and release them in a pH-dependent manner. We prepared MNPs encapsulating fluorescently labeled HApt and demonstrated that, compared to the free HApt, HApt encapsulated within MNPs was more efficiently taken-up and exerted more potent cytotoxic effects in SKBR3 breast cancer cells, which overexpress HER2.
Materials and methods
Synthesis of oligonucleotides
HApt (42 nt) is a trimeric concatenation of the 14 nt HApt (5′-GCAGCGGTGTGGGG-3′). HER2-negative control aptamer (NCApt) is a trimeric concatenation of a negative control oligonucleotide (5′-AGATTGCACTTACTATCT-3′).40,41 high performance liquid chromatography-purified HApt, NCApt, and other oligonucleotides (between 20 and 100 nt) (Table 1) were commercially synthesized (Sangon Biotech Co., Ltd., Shanghai, People’s Republic of China). The dye Texas red was conjugated to the 5′-end of each oligonucleotide to enable fluorescent detection.
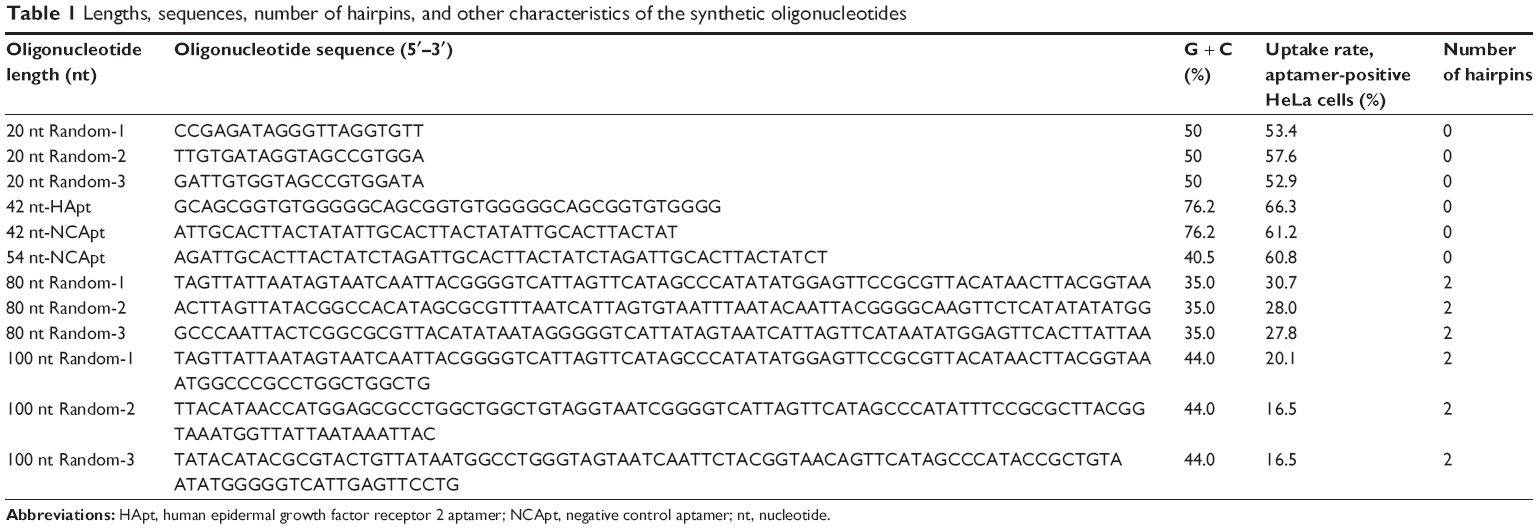 | Table 1 Lengths, sequences, number of hairpins, and other characteristics of the synthetic oligonucleotides |
Synthesis of PEG8-PDPA100-PEG8 triblock copolymers
PEG8-PDPA100-PEG8 triblock copolymers were synthesized according to the method described previously.29 The pH sensitivity of PEG8-PDPA100-PEG8 was assessed using dynamic light scattering (DLS; Zetasizer Nano ZS; Malvern Instruments, Malvern, UK) and UV–vis spectroscopy (UV-2450; Shimadzu, Kyoto, Japan).
Preparation of polymeric PEG8-PDPA100-PEG8 MNPs
MNPs without oligonucleotides (unloaded MNPs) were prepared using a solvent evaporation method, as described previously.29 Briefly, 3 mg of copolymer was dissolved in 1 mL of tetrahydrofuran (THF). Phosphate-buffered saline (PBS, 1 mM, pH 7.4) was added dropwise under high-speed stirring, and polymeric micelles were obtained after complete evaporation of THF. The final concentration of copolymer was adjusted to 0.3 mg/mL. Oligonucleotide-loaded MNPs (oligo-MNPs) were prepared by adding oligonucleotides dissolved in PBS in a dropwise manner to polymeric PEG8-PDPA100-PEG8 THF solution under high-speed stirring. The final concentration of oligonucleotides was adjusted to 500 nmol/L. The oligo-MNPs were transferred into dialysis tubing (molecular weight cutoff, 50,000 g/mol) and dialyzed against PBS to remove free oligonucleotides. The size and morphology of the MNPs were examined by DLS and transmission electron microscopy (TEM; JEM-1400; JEOL, Tokyo, Japan).
Circular dichroism analysis
Free and MNP-encapsulated HApt (1 μM) in PBS were analyzed using a Chirascan spectrometer (Chirascan; Applied Photophysics Ltd, Surrey, UK). Circular dichroism (CD) spectra were obtained from 300 to 200 nm using a 2 mm quartz cuvette at 25°C. The background CD spectrum of unloaded MNPs was obtained and subtracted from the CD spectrum of the HApt-MNPs.
Rates of pH-dependent release of HApt from micelles
The release profile of HApt from HApt-MNPs was studied at various pH values using a fluorescence spectrophotometer (F-4500; Hitachi, Tokyo, Japan) at 610 nm. Briefly, 2 mL of Texas red-labeled HApt-loaded micelles was sealed in a dialysis tube (molecular weight cutoff, 50,000 g/mol), placed in a beaker containing 50 mL of PBS (10 mmol/L, pH =5.0, 6.5, or 7.4) at 37°C, and the concentration of fluorescent HApt in the PBS solution was measured after different time points.
Accumulative HApt release rate (%) was calculated using A1/A2×100, where A1 is the absorption intensity of Texas red-labeled HApt at different time points and A2 is the intensity of the total amount of Texas red-labeled HApt (including free and encapsulated HApt).
Quantification of MNP uptake by HeLa cells
Human cervical carcinoma Hela cells were plated in 24-well plates (106 cells/well) and incubated for 24 h at 37°C in a 5% CO2 atmosphere. MNPs containing Texas red-labeled oligonucleotides (500 nM) were added to each well and incubated for 8 h, and then, cells were washed twice with ice cold PBS to remove excess MNPs, harvested, and resuspended in PBS. Flow cytometry was performed on a fluorescence activated cell sorting (FACS) Calibur flow cytometer (BD Biosciences, San Jose, CA, USA), and data were analyzed using FlowJo 7.6.1. Uptake of fluorescent oligonucleotides by HeLa cells was also observed using fluorescence microscopy (AMG EVOS, Mill Creek, WA, USA).
Cell viability assays
Human breast cancer cell lines MCF7 and SKBR3 and human cervical carcinoma cell line Hela were obtained from American Type Culture Collection (Manassas, VA, USA). SKBR3 cells were maintained in McCoy’s 5A medium (Thermo Fisher Scientific, Waltham, MA, USA), and HeLa cells and MCF7 cells were maintained in Dulbecco’s Modified Eagle’s Medium (DMEM; Thermo Fisher Scientific); both media were supplemented with 100 U/mL penicillin G/streptomycin sulfate and 15% (v/v) fetal bovine serum (FBS) (Thermo Fisher Scientific), and cells were cultured at 37°C in a 5% CO2 atmosphere.
Cells were seeded into collagen-coated 96-well plates (104 cells/well), incubated for 24 h, and then incubated with different concentrations of unloaded MNPs for 8 h, followed fresh complete media for 16 h. Cell viability was measured using the Cell Counting Kit-8 (CCK-8; Dojindo, Kumamoto, Japan).
To assess aptamer-mediated killing of breast cancer cells, SKBR3 or MCF7 cells were incubated in 24-well plates with free HApt or HApt-MNPs at an aptamer concentration of 100, 125, or 150 nmol/L containing McCoy’s 5A or DMEM without FBS for 8 h. Next, cells were cultured in fresh complete media for 16 h and then stained with 2 μM calcein acetoxy-methylester and 4 μM propidium iodide (PI) (Beyotime Biotechnology Co., Ltd., Nantong, People’s Republic of China) for 30 min. Cells were observed under a fluorescence microscope; live cells were stained green, and dead cells were stained red.
Apoptosis assays
An Annexin V-PI apoptosis detection kit (Signalway Antibody Co., Ltd., College Park, MD, USA) was used to assess apoptosis. SKBR3 cells cultured in 12-well plates were treated with free HApt, MNP-encapsulated HApt, or NCApt (125 nmol/L HApt or NCApt) for 8 h and then incubated in fresh complete media for 16 h. Cell apoptosis was analyzed using the FACSCalibur flow cytometry.
Confocal imaging of HApt-MNPs in SKBR3 cells
SKBR3 cells were incubated with Texas red-labeled HApt-MNPs for 8 h (HApt concentration of 125 nM), followed by fresh complete media for 16 h. Cells were washed three times with PBS, fixed in 3.7% paraformaldehyde in PBS for 15 min at room temperature, washed, permeabilized with 0.5% Triton X-100 in PBS, washed, and then incubated in 1% bovine serum albumin in PBST for 30 min at room temperature. Nuclei were counterstained with 4,6-diamidino-2-phenylindole (Sigma-Aldrich Co., St Louis, MO, USA) or Hoechst 33342 (Sigma-Aldrich Co.) for 10 min at room temperature. HApt fluorescence was examined by confocal microscopy (TCS SP8; Leica Microsystems, Wetzlar, Germany). Texas red fluorescence intensity was measured by calculating the corrected total cell fluorescence (CTCF) using ImageJ.44,45
|
HER2 immunoblotting
SKBR3 or MCF7 cells were cultured in six-well plates (106 cells/well) in complete media for 24 h. Free HApt or HApt-MNPs were added (HApt concentration of 125 nM) and incubated for 24 h, and then, cells were collected, transferred to microcentrifuge tubes, and lysed in RIPA buffer (Pierce, Appleton, WI, USA) for 30 min on ice; protein concentrations were estimated using the bicinchoninic acid (BCA) assay (Bio-Rad Laboratories Inc., Hercules, CA, USA). An equal volume of sample buffer (125 mM Tris, pH 6.8, 4% sodium dodecyl sulfate (SDS), 10% glycerol, 0.006% bromophenol blue, and 1.8% β-mercaptoethanol) was added to each sample and boiled for 35 min. Samples (15 μg total protein) were loaded onto protein precast gels (Bio-Rad Laboratories Inc.) and electrophoresed at 120 V for 90 min, and proteins were transferred to polyvinylidene fluoride (PVDF) membranes at 300 mA for 115 min in transfer buffer. The membrane was immediately placed into blocking buffer (5% nonfat dry milk, 10 mM Tris, pH 7.5, 100 mM NaCl, 0.1% Tween 20) for 1 h at room temperature and then incubated with primary anti-HER2 (rabbit; 1:10,000) or anti-β actin (rabbit; 1:5,000) antibodies (Abcam, Cambridge, UK) overnight at 4°C. The membrane was washed twice in washing buffer (10 mM Tris, pH 7.5, 100 mM NaCl, 0.1% Tween 20) and then incubated with alkaline phosphatase-conjugated antirabbit IgG secondary antibody (1:3,000; Abcam) diluted in 5% nonfat dry milk solution at room temperature. The membrane was washed three times, and protein signals were developed using enhanced chemifluorescence substrate (EMD Millipore, Billerica, MA, USA) and visualized using a Tanon 5500 (Tanon Science & Technology Co., Ltd., Shanghai, People’s Republic of China). The relative amounts of each protein were determined by quantification of the band density values using ImageJ.
Statistical analysis
The Student’s t-test was used to compare data; P-values <0.05 were considered statistically significant.
Results
Physicochemical properties and encapsulation efficiency of oligo-MNPs
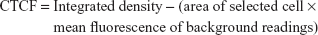
The physicochemical properties of the oligo-MNPs are summarized in Table 2. The diameter of the oligo-MNPs decreased as the length of encapsulated oligonucleotide increased. Encapsulation efficiency increased as oligonucleotide length increased from 20 to 80 nt. The polydispersity index values obtained using DLS revealed the size uniformity of the oligo-MNPs. At pH 7.4, the oligo-MNPs were negatively charged and their zeta potentials exhibited small fluctuations between −32.1 and −40.1 mV, suggesting that the oligo-MNPs are electrically stabilized by forming colloidal dispersions at pH 7.4 in PBS. In acidic solution (pH <6.0), the PEG8-PDPA100-PEG8 copolymers were positively charged due to protonation of the tertiary amine groups on the PDPA residues. However, the zeta potentials became negative when the pH was changed from acidic to alkaline (starting at pH ~6.5) due to deprotonation of the PDPA residues.29 Since both the empty MNPs and oligo-MNPs were prepared in PBS at pH 7.4, they were expected to display a negative surface charge and the MNPs exhibited a more negative charge after oligonucleotide encapsulation. We were unable to determine exactly how the MNPs encapsulate oligonucleotides, though the hydrophobic interactions between nucleic acids and PDPA may play a major role.
 | Table 2 Properties of MNPs containing oligonucleotides of different lengths |
MNP-encapsulated HApt is structurally similar to free HApt
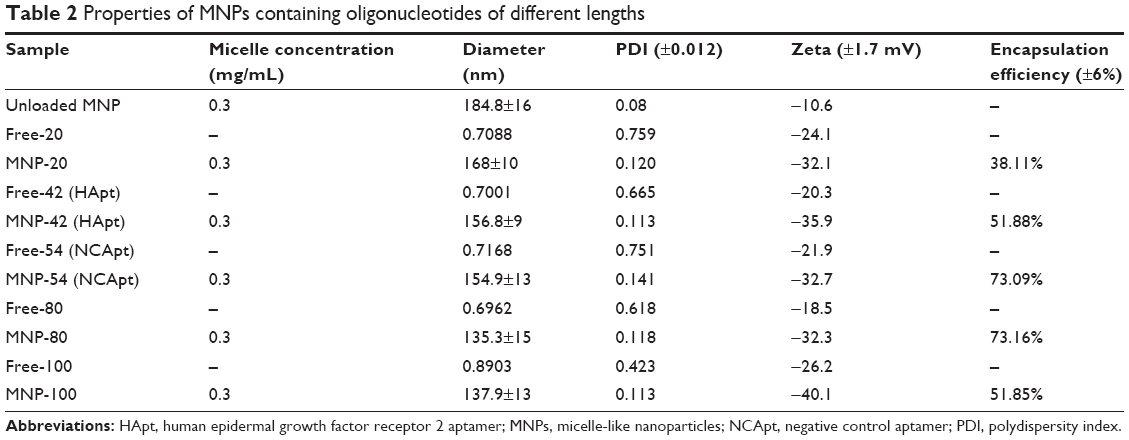
The diameter and charge of HApt-MNPs in pH 7.4 PBS were 156.8±9 nm and −35.9 mV, compared to 184.8±16 nm and −10.6 mV for unloaded MNPs (Table 2). TEM showed that the HApt-MNPs had a regular round shape and were uniformly dispersed (Figure 1A).
 | Figure 1 Characterization of the structure of HApt-MNPs. |
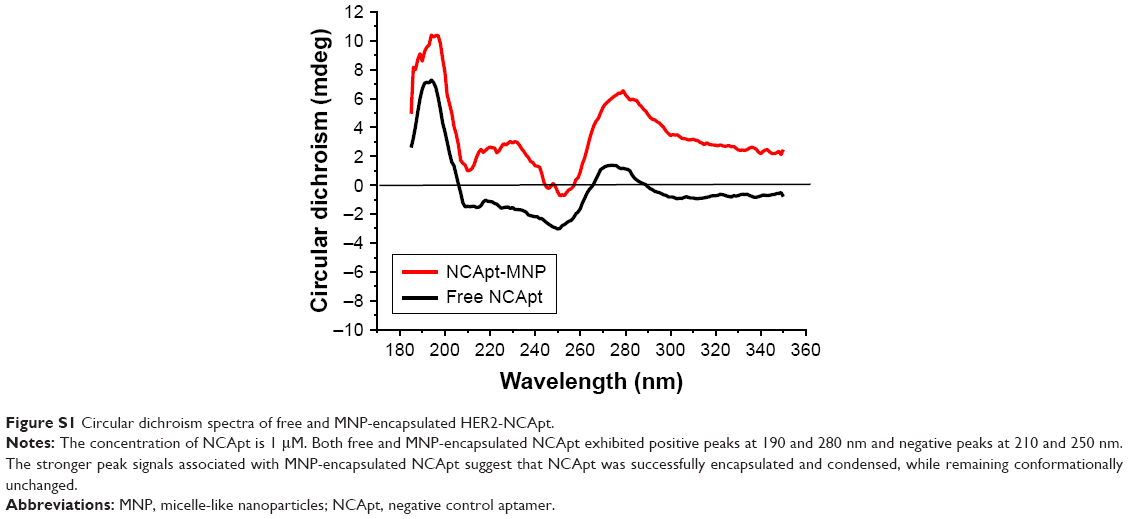
We used CD spectroscopy to investigate the structural integrity of HApt in HApt-MNPs; structural integrity is thought to be required for HApt to bind to HER2 expressed on the cell membrane.41 CD spectra of free HApt and HApt-MNPs (both at 1 μM HApt) were obtained from 300 to 200 nm. The CD spectrum of empty MNPs was subtracted from the CD spectrum of HApt-MNPs. Both free HApt and MNP-encapsulated HApt exhibited positive peaks at 265 and 210 nm and a negative peak at 245 nm (Figure 1B). The similarity of the CD spectra for free HApt and HApt-MNPs suggests that the conformation of HApt was preserved after encapsulation. Furthermore, the peak values were much larger for HApt-MNPs than free HApt. Since the same concentrations of HApt were analyzed for free HApt and HApt-MNPs, the larger peak values for HApt-MNPs may be caused by condensation of HApt within the MNPs.46–48 The CD spectra of the free and MNP-encapsulated NCApt were similar (Figure S1).
The rate of oligo-MNPs uptake is influenced by the length of oligonucleotide encapsulated
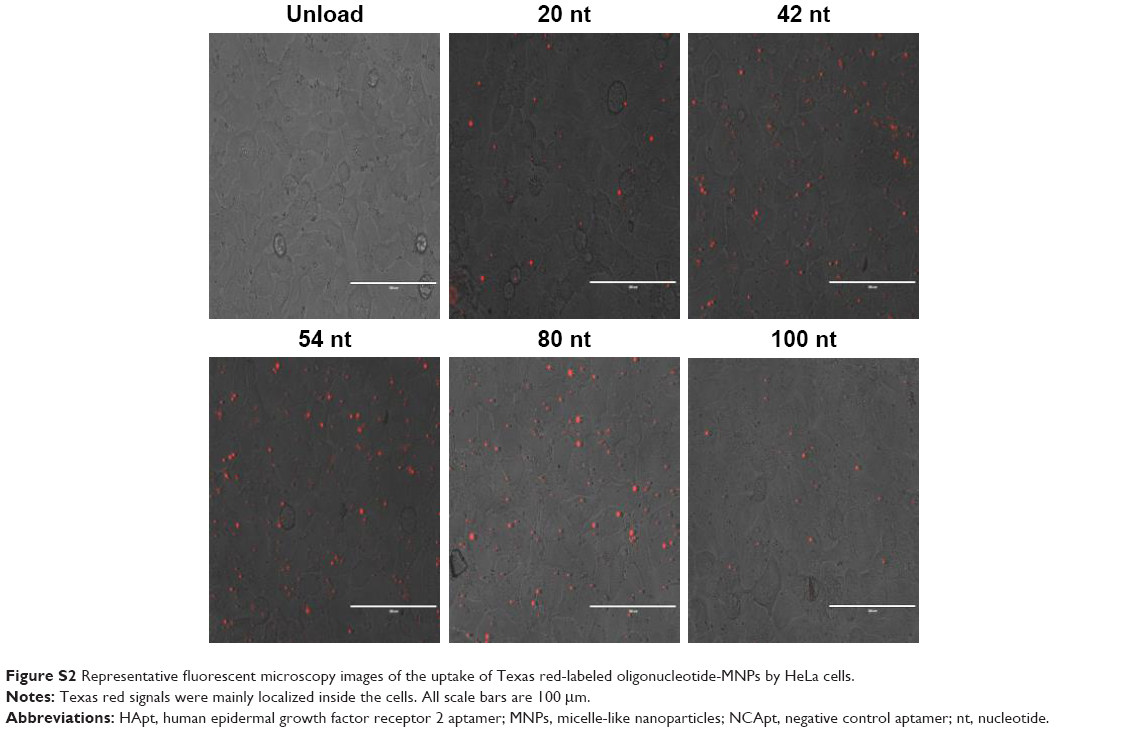
To assess the cellular uptake of oligo-MNPs, we incubated HeLa cells with Texas red-labeled oligo-MNPs (0.15 mg/mL MNPs, equivalent to 125 nM oligonucleotide). After the encapsulation reaction, the oligo-MNPs were purified to remove free oligonucleotides. Cellular uptake of the fluorescently labeled oligonucleotides was determined by flow cytometry. Oligonucleotides of the same length with different sequences exhibited comparable cellular uptake rates (Table 1), suggesting that oligonucleotide sequence does not have a major impact on the cellular uptake of oligo-MNPs. However, as shown in Table 1, the uptake rate declined as the oligonucleotide length increased >80 nt, suggesting that longer oligonucleotides (>80 nt) negatively affect the uptake of oligo-MNPs. The fluorescent signals were mainly localized inside the cells (Figure S2). We suspect that larger portions of longer oligonucleotides will be exposed to the outside of the micelles, which may prevent oligonucleotide condensation and limit cellular uptake.
HApt is rapidly released from HApt-MNPs at pH values under pH 5.0
The cumulative levels of Texas red-labeled oligonucleotide were measured in vitro under different pH conditions at 37°C to examine pH-responsive release of oligonucleotides from oligo-MNPs. Under mildly alkaline conditions (pH 7.4), HApt was released slowly from HApt-MNPs, which reached 9.7%±5.0% after 47 h. Under weakly acidic conditions (pH 6.5), the release rate increased to 27%±4.0% after 47 h. However, at pH 5.0, HApt was rapidly released from as early as 12 h incubation and the level of fluorescence was nearly 60% after 26 h (Figure 2). These results confirm that HApt is released from HApt-MNPs in a pH-responsive manner. HApt was not fully released at pH 5.0, consistent with our previous study.29 The hydrophobic PDPA core may become gradually protonated and became swollen but not collapse under acid conditions, trapping some HApt with the core. At the same time, small amounts of HApt release may also partly explain the absorption of HApt on the dialysis tubing.
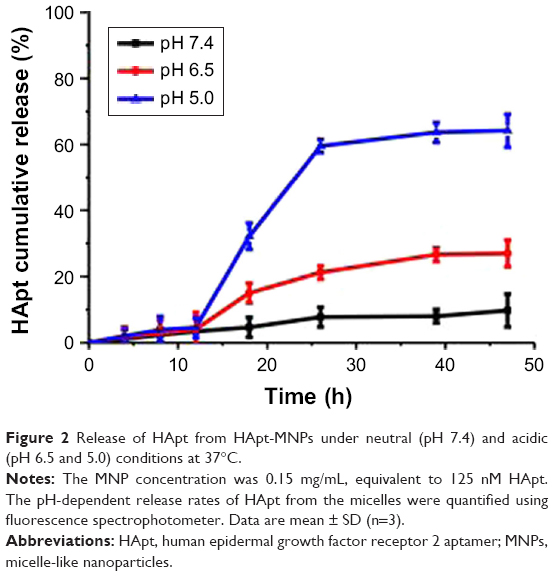 | Figure 2 Release of HApt from HApt-MNPs under neutral (pH 7.4) and acidic (pH 6.5 and 5.0) conditions at 37°C. |
HApt-MNPs are more efficiently taken up by SKBR3 cells than free HApt
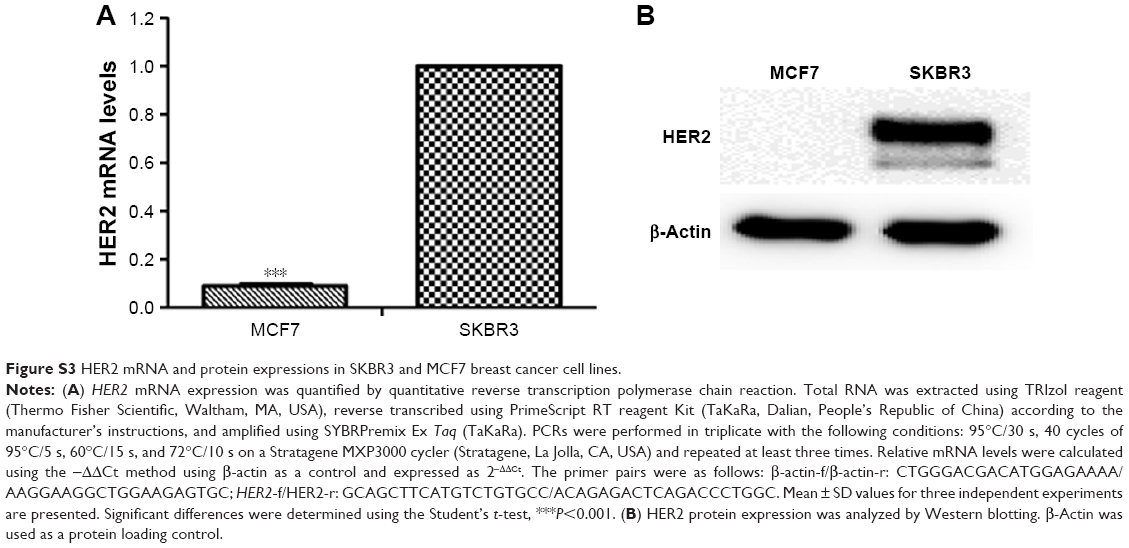
We used SKBR3 breast cancer cells as a cellular model of HER2 overexpression and MCF7 cells as a model of normal/low HER2 expression.49 HER2 mRNA and protein levels were examined using quantitative real-time polymerase chain reaction and Western blotting, respectively. HER2 mRNA expression was 11.3-fold higher in SKBR3 cells than in MCF7 cells (Figure S3A). Accordingly, HER2 protein was abundantly expressed in SKBR3 cells but barely detectable in MCF7 cells (Figure S3B).
SKBR3 cells were incubated with the same aptamer concentration (125 nM) of free HApt or HApt-MNPs. Confocal fluorescence microscopy showed the Texas red signals were much stronger in SKBR3 cells incubated with HApt-MNPs than free HApt at 8 h (Figure 3). Moreover, after 16 h incubation, fluorescent signals were observed in distinct clusters in SKBR3 cells incubated with HApt-MNPs compared to the weaker, diffuse signals in cells incubated with free HApt. This clustering pattern suggests that the HApt-MNPs were taken up into vesicular compartments after binding to HER2 on the cell membrane.38,41
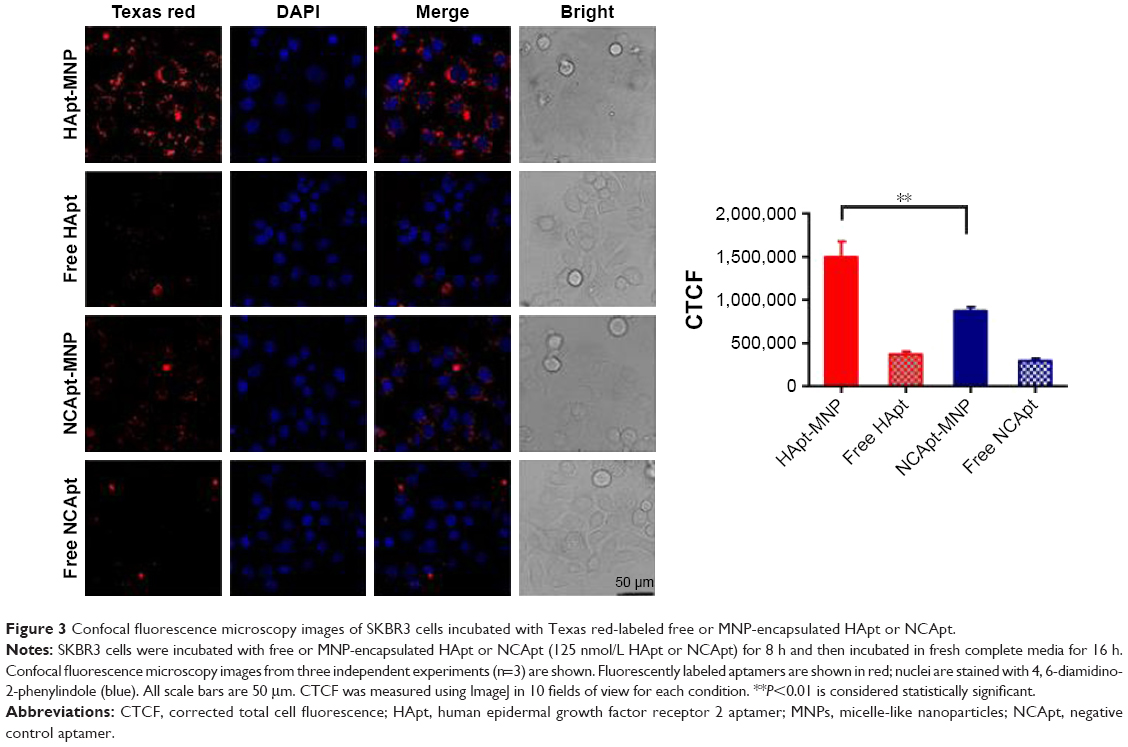 | Figure 3 Confocal fluorescence microscopy images of SKBR3 cells incubated with Texas red-labeled free or MNP-encapsulated HApt or NCApt. |
The intensity of the cellular fluorescent signals was 1.72-fold higher in SKBR3 cells incubated with HApt-MNPs (CTCF =1,497,627.0) than cells incubated with control NCApt-MNPs (CTCF =871,819.2) at the same aptamer concentration (125 nM), suggesting that cellular uptake of the HApt-MNPs partially depends on HER2-mediated endocytosis. As nanoparticles up to several hundred nanometers can enter cells via endocytosis in membrane-bound vesicles, a certain amount of HApt-MNPs and NCApt-MNPs must also have been taken up by SKBR3 cells via HER2-independent endocytosis (Figure 3).
The importance of the HApt-HER2 interaction on the uptake of HApt-MNPs was also supported by flow cytometry analysis of SKBR3 and MCF7 cells. After incubation with HApt-MNPs, a lower percentage of MCF7 cells, which express low levels of HER2, was fluorescent (29.1%) compared to HER2-overexpressing SKBR3 cells (56.8%; Figure S4).
Moreover, we performed competitive assays of HApt-MNP uptake and cell viability. After 24 h preincubation of SKBR3 cells with free HApt (0.5 or 1.0 μM), the media were refreshed and the cells were incubated with HApt-MNPs (containing 100 nM HApt) for 24 h. Pretreatment with free HApt significantly decreased the efficiency of HApt-MNP uptake (Figure S5A) as well as the mortality of the cell compared to cells treated with only HApt-MNPs (Figure S5B). Preincubation with the control NCApt had no apparent effect on HApt-MNP uptake or cell viability (Figure S5A and B). These results indicate that the uptake of HApt-MNPs and the resulting cell death are, at least to some extent, dependent on the HApt-HER2 interaction.
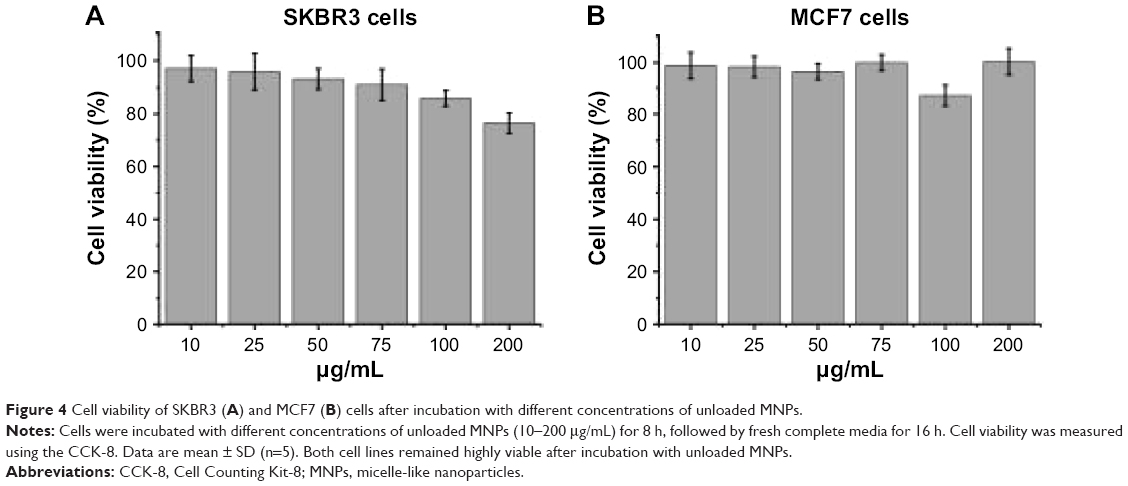
Unloaded MNPs exhibit low cytotoxicity toward breast cancer cell lines
To evaluate the cytotoxicity of the unloaded MNPs toward breast cancer cells, HER2-overexpressing SKBR3 cells and HER2-underexpressing MCF7 cells were incubated with different concentrations (10–200 μg/mL) of unloaded MNPs for 8 h, followed by fresh complete media for 16 h. The CCK-8 assay showed that both cell lines remained highly viable. The percentages of viable SKBR3 and MCF7 cells were ~75 and >85%, respectively, even when incubated with the highest concentration of unloaded MNPs (200 μg/mL; Figure 4A and B).
 | Figure 4 Cell viability of SKBR3 (A) and MCF7 (B) cells after incubation with different concentrations of unloaded MNPs. |
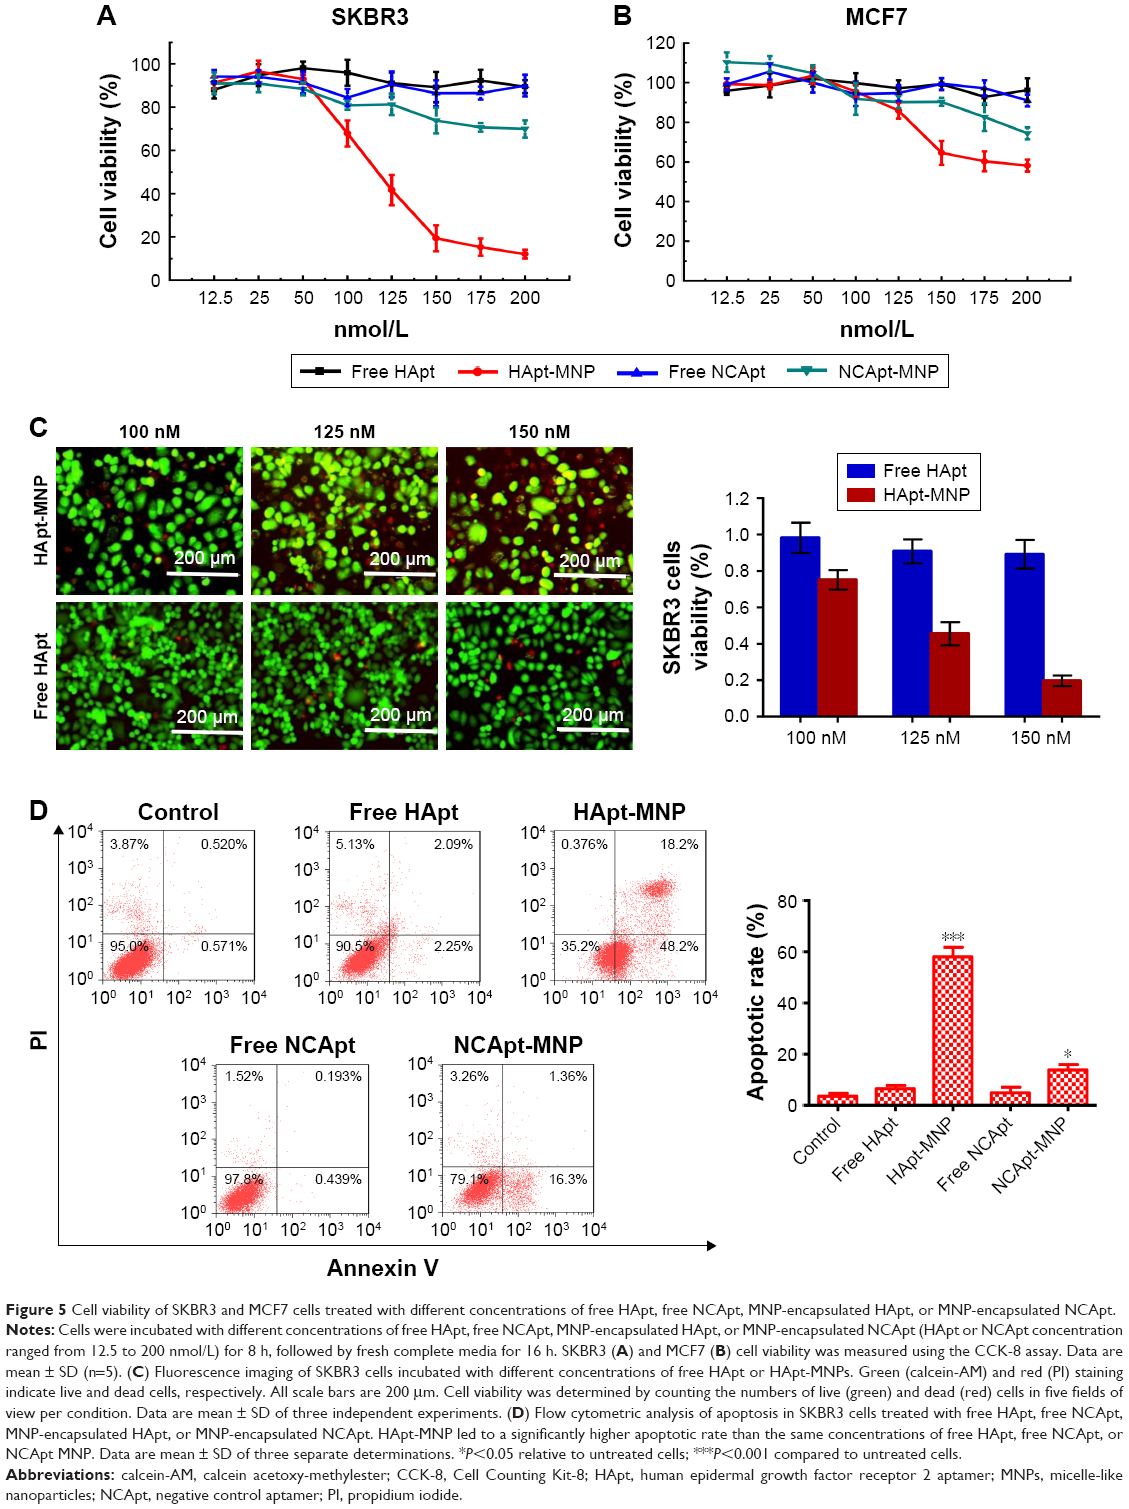
HApt-MNPs exert a potent cytotoxic effect in HER2-overexpressing SKBR3 cells
Next, we evaluated the cytotoxicity of HApt-MNPs in SKBR3 and MCF7 cells. In the CCK-8 assay, no significant cytotoxicity was observed in either SKBR3 or MCF7 cells treated with MNPs carrying the control NCApt (Figure 5A and B) or unloaded MNPs (Figure 4A and B). In contrast, when the aptamer concentration was ≥125 nM, at least 60% of HER2-overexpressing SKBR3 cells were killed by HApt-MNPs, whereas only 10% of MCF7 cells were killed (Figure 5A and B). This suggested that the cytotoxicity of HApt-MNPs depends on the expression of HER2 in the target cells and was confirmed by live-dead cell staining of SKBR3 cells treated with free HApt or HApt-MNPs (Figure 5C) and apoptosis assays of SKBR3 cells incubated with free or MNP-encapsulated HApt or NCApt (Figure 5D). The LD50 of HApt-MNPs in SKBR3 cells was 115 nM, while the LD50 of free HApt was >5 μM (Figure S6). These data indicate that the interaction between HER2 and HApt enables HApt-MNPs to exert a specific cytotoxic effect in HER2-overexpressing cells.
 | Figure 5 Cell viability of SKBR3 and MCF7 cells treated with different concentrations of free HApt, free NCApt, MNP-encapsulated HApt, or MNP-encapsulated NCApt. |
HApt-MNPs accumulate in lysosomes and induce degradation of HER2
To demonstrate the HApt-MNPs primarily accumulate in lysosomes after cellular uptake, a lysosome tracker (LysoTracker Green) was used to stain SKBR3 cells. The cells were cultured with Texas red-labeled HApt-MNPs or free HApt for 8 h at the same HApt concentration (125 nM), followed by fresh complete media for 16 h, and then stained. The cellular Texas red signals were much stronger for HApt-MNPs (Figure 6A, top panel) than free HApt (Figure 6A, bottom panel). HApt-MNPs appeared to be distributed in a clustered pattern within SKBR3 cells, suggesting that the nanoparticles were located in the vesicular compartments after uptake. Merging the Texas red and LysoTracker signals indicated that the nanoparticles were colocalized to lysosomes. Furthermore, stronger lysosomal signals were observed in cells incubated with HApt-MNPs, suggesting more lysosomes accumulated after cellular uptake of HApt-MNPs. These results demonstrate that HApt-MNPs were more efficiently delivered to lysosomes than free HApt.
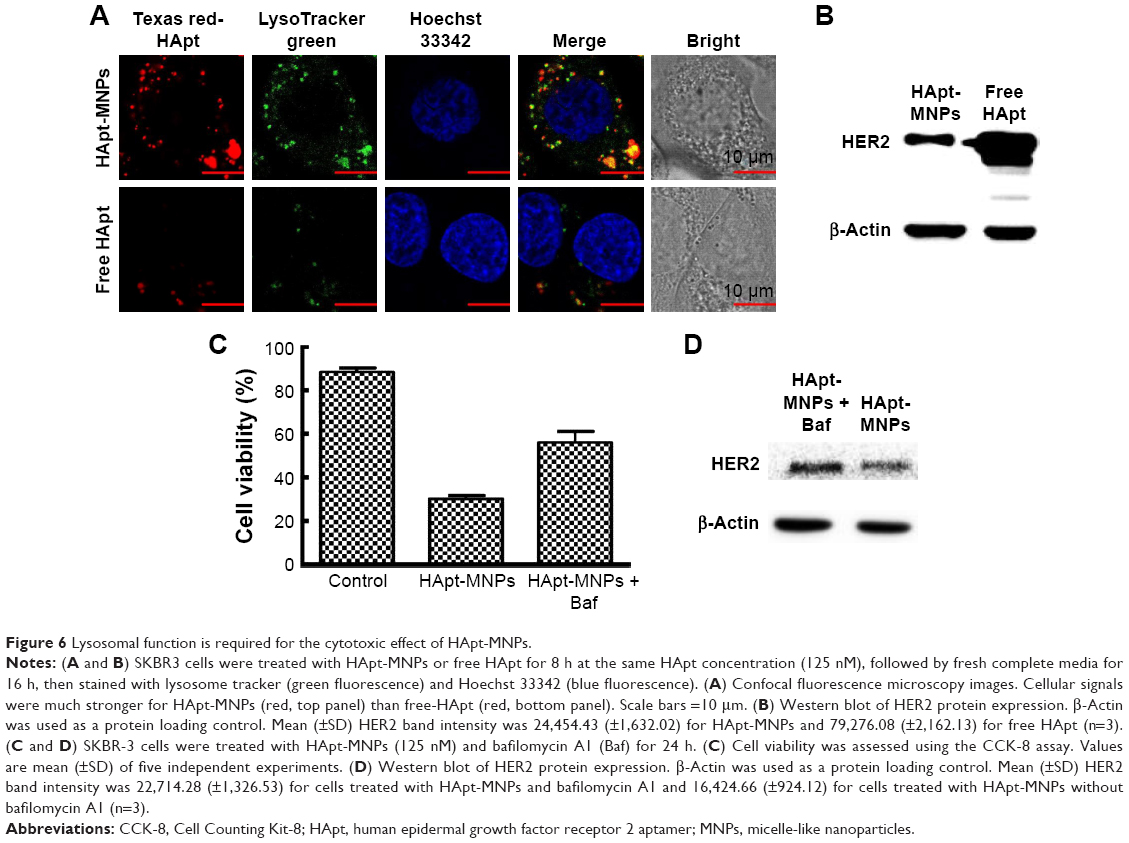 | Figure 6 Lysosomal function is required for the cytotoxic effect of HApt-MNPs. |
HER2 protein expression was quantified by Western blotting in cells treated for 24 h with HApt-MNPs or free HApt (Figure 6B). HER2 protein expression significantly decreased in cells treated with HApt-MNPs (24,454.43±1,632.02) compared to cells treated with free HApt (79,276.08±2,162.13), suggesting HApt-MNPs efficiently direct HER2 to lysosomes for degradation in HER2-overexpressing SKBR3 cells.
To determine whether the increased HER2 degradation and cytotoxic effects observed in SKBR3 cells treated with HApt-MNPs can be attributed to altered lysosomal activity, we examined whether cell viability and HER2 protein expression were affected when lysosomal function was compromised using bafilomycin A1, a macrolide antibiotic that passively permeates into lysosomes and increases lysosomal pH, which disrupts lysosomal activity.50,51 Figure 6C indicates that pretreatment with bafilomycin A1 followed by co-incubation with HApt-MNPs increased cell viability (by ~25%) and upregulated HER2 (by ~38%) compared to cells treated with the same concentration of HApt-MNPs without bafilomycin A1 to block lysosomal function (Figure 6D). The increase in pH inside cells treated with bafilomycin A1 was confirmed by LysoTracker Red staining (Figure S7). Together, these results confirm that HApt-MNPs were released inside lysosomes at low pH.
Discussion
HER2, a member of the epidermal growth factor-related protein (ErbB) family, is commonly overexpressed on the plasma membrane in a variety of tumors, including gastric and breast cancers, mainly due to amplification of the erbB2 gene. Overexpression of HER2 on the cell surface promotes tumor progression and metastasis. Monoclonal antibodies targeting HER2 (eg, Herceptin/Trastuzumab) are clinically used to treat HER2-overexpressing metastatic gastric and breast cancers. Stimulation of the immune system (eg, ADCC) is critical for the cytotoxic of monoclonal antibodies. However, the resulting immune reactions also lead to several side effects.52
The trimeric version of the HApt used in this study was initially developed by Mahlknecht et al,41 who demonstrated that HApt promoted translocation of HER2 from the cell surface to the cytoplasm in HER2-overexpressing N87 gastric cancer cells, which was associated with lysosome-dependent clearance of HER2 protein. Lee et al40 reported that HApt exerted a cytotoxic effect in HER2-overexpressing SKBR3 breast cancer cells. HApt has been shown to induce cross-linking of HER2 on the cell surface, resulting in the translocation of HER2 to cytoplasmic vesicles for lysosomal degradation. Furthermore, HApt-mediated HER2 degradation triggered G0/G1 phase cell cycle arrest and cell death in SKBR3 cells.40,41 Therefore, HApt does not exert a cytotoxic effect by directly stimulating the immune system.
Based on these previous reports, we hypothesized that our previously reported pH-responsive nanocarrier29 would be ideally suited to deliver HApt to HER2-overexpressing cells. The MNPs are pH-responsive nanocarriers that encapsulate nucleic acids, which could facilitate cross-linking and thus internalization of HER2, and disassemble under acidic conditions, which may increase targeted degradation of HER2 in lysosomes. In this study, we confirmed that compared to free HApt, HApt-carrying nanoparticles (HApt-MNPs) increased HApt uptake and lysosomal transport in HER2-overexpressing SKBR3 cells (Figures 3 and 6A). Endogenous HER2 protein expression decreased significantly in cells treated with HApt-MNPs compared to cells treated with free HApt (Figure 6B). When lysosome activity was blocked, cell viability and HER2 protein expression increased in cells treated with HApt-MNPs compared to cells treated with the same concentration of HApt-MNPs alone (Figure 6C and D). Cell viability and apoptosis assays showed that HApt-MNPs exerted a more potent cytotoxic effect in SKBR3 cells than free HApt (Figure 5A, C, and D). Collectively, these data demonstrate that HApt-MNPs exert a specific cytotoxic effect in HER2-overexpressing SKBR3 cells.
Several factors may contribute to the more potent cytotoxic effects of HApt-MNPs than free HApt. First, the MNP nanoparticles increased the delivery of HApt into HER2-overexpressing cells compared to free HApt. Second, the pH-responsive release property of HApt-MNPs ensured that the encapsulated HApt cargo was released in endosomes/lysosomes. Third, the MNPs increase the local concentration of HApt: aggregation of HApt on MNPs would increase the ability of HApt to cross-link to HER2 on the cell surface.
The ability of MNPs to remain stable at normal physiological pH is beneficial, as it prolongs their retention time in the blood circulation and thereby greatly reduces the adverse effects of the drug cargo in normal tissues.37,39 Moreover, pH-sensitive release of HApt from MNPs in the endosomal or lysosomal compartments (pH 4.0–6.5) would result in rapid intracellular release of HApt in the target cells.53,54 Our lysosome activity inhibition experiments confirmed that the release of HApt inside the cell was dependent on low lysosomal pH. Furthermore, HApt must maintain the correct structure during loading and unloading within MNPs to retain its cytotoxic activity. We used CD spectroscopy to show that the conformation of HApt is likely to be preserved after encapsulation within MNPs. Together these properties indicate that MNPs are a promising candidate for effective delivery of HApt to HER2-overexpressing cancer cells. Further studies are needed to evaluate the cytotoxic effect of HApt-MNPs in vivo.
These findings also indicate that MNPs could be used for the delivery of a range of oligonucleotides. Oligonucleotides ranging in length from 20 to 100 nt were efficiently encapsulated, with optimal encapsulation at 50 to 80 nt. The size of the MNPs declined as the length of encapsulated oligonucleotide increased. This indicates large single-stranded nucleic acids coil back on themselves due to complementary base pairing (hairpin structure) to form highly compacted supercoiled molecules.55,56 Further studies are necessary to determine whether supercoiling of long oligonucleotides suppresses the cellular uptake of oligo-MNPs.
Conclusion
Our pH-responsive and lysosome-targeting nanoparticle system can efficiently deliver a therapeutic oligonucleotide in vitro. The HApt-MNPs were translocated to lysosomes, where HApt was rapidly released at low pH. Therefore, MNPs may have the potential to improve the delivery and efficacy of nucleic acid-based cancer therapies.
Acknowledgments
Financial support for this work was provided by the National Natural Science Foundation of China (nos 31400123 and 21276074) and Research Funds from Shanghai Municipal Commission of Health and Family Planning (no 201440567).
Author contributions
All authors contributed toward data analysis, drafting and critically revising the paper and agree to be accountable for all aspects of the work.
Disclosure
The authors report no conflicts of interest in this work.
References
Adair JE, Beard BC, Trobridge GD, et al. Extended survival of glioblastoma patients after chemoprotective HSC gene therapy. Sci Transl Med. 2012;4(133):133ra57. | ||
Morgan RA, Dudley ME, Wunderlich JR, et al. Cancer regression in patients after transfer of genetically engineered lymphocytes. Science. 2006;314(5796):126–129. | ||
Robbins PF, Morgan RA, Feldman SA, et al. Tumor regression in patients with metastatic synovial cell sarcoma and melanoma using genetically engineered lymphocytes reactive with NY-ESO-1. J Clin Oncol. 2011;29(7):917–924. | ||
Ginn SL, Alexander IE, Edelstein ML, Abedi MR, Wixon J. Gene therapy clinical trials worldwide to 2012 – an update. J Gene Med. 2013;15(2):65–77. | ||
Li R, Buras E, Lee J, et al. Gene therapy with neurogenin3, betacellulin and SOCS1 reverses diabetes in NOD mice. Gene Ther. 2015;22(11):876–882. | ||
Li C, Zhang L, Chen Y, Lin X, Li T. Protective role of adenovirus vector-mediated interleukin-10 gene therapy on endogenous islet β-cells in recent-onset type 1 diabetes in NOD mice. Exp Ther Med. 2016;11(5):1625–1632. | ||
Stewart DJ, Hilton JD, Arnold JM, et al. Angiogenic gene therapy in patients with nonrevascularizable ischemic heart disease: a phase 2 randomized, controlled trial of AdVEGF(121) (AdVEGF121) versus maximum medical treatment. Gene Ther. 2006;13(21):1503–1511. | ||
Sundararaman S, Miller TJ, Pastore JM, Kiedrowski M, Aras R, Penn MS. Plasmid-based transient human stromal cell-derived factor-1 gene transfer improves cardiac function in chronic heart failure. Gene Ther. 2011;18(9):867–873. | ||
Bunnell BA, Morgan RA. Gene therapy for infectious diseases. Clin Microbiol Rev. 1998;11(1):42–56. | ||
Hashiba T, Suzuki M, Nagashima Y, et al. Adenovirus-mediated transfer of heme oxygenase-1 cDNA attenuates severe lung injury induced by the influenza virus in mice. Gene Ther. 2001;8(19):1499–1507. | ||
Ivacik D, Ely A, Ferry N, Arbuthnot P. Sustained inhibition of hepatitis B virus replication in vivo using RNAi-activating lentiviruses. Gene Ther. 2015;22(2):163–171. | ||
Whitehead KA, Langer R, Anderson DG. Knocking down barriers: advances in siRNA delivery. Nat Rev Drug Discov. 2009;8(2):129–138. | ||
Soutschek J, Akinc A, Bramlage B, et al. Therapeutic silencing of an endogenous gene by systemic administration of modified siRNAs. Nature. 2004;432(7014):173–178. | ||
Gao S, Dagnaes-Hansen F, Nielsen EJ, et al. The effect of chemical modification and nanoparticle formulation on stability and biodistribution of siRNA in mice. Mol Ther. 2009;17(7):1225–1233. | ||
Kawabata K, Takakura Y, Hashida M. The fate of plasmid DNA after intravenous injection in mice: involvement of scavenger receptors in its hepatic uptake. Pharm Res. 1995;12(6):825–830. | ||
Jafari M, Soltani M, Naahidi S, Karunaratne DN, Chen P. Nonviral approach for targeted nucleic acid delivery. Curr Med Chem. 2012;19(2):197–208. | ||
Mellott AJ, Forrest ML, Detamore MS. Physical non-viral gene delivery methods for tissue engineering. Ann Biomed Eng. 2013;41(3):446–468. | ||
Giacca M, Zacchigna S. Virus-mediated gene delivery for human gene therapy. J Control Release. 2012;161(2):377–388. | ||
Atkinson H, Chalmers R. Delivering the goods: viral and non-viral gene therapy systems and the inherent limits on cargo DNA and internal sequences. Genetica. 2010;138(5):485–498. | ||
Duan D. Systemic delivery of adeno-associated viral vectors. Curr Opin Virol. 2016;21:16–25. | ||
Chailertvanitkul VA, Pouton CW. Adenovirus: a blueprint for non-viral gene delivery. Curr Opin Biotechnol. 2010;21(5):627–632. | ||
Zhi D, Zhang S, Wang B, Zhao Y, Yang B, Yu S. Transfection efficiency of cationic lipids with different hydrophobic domains in gene delivery. Bioconjug Chem. 2010;21(4):563–577. | ||
Rudzinski WE, Aminabhavi TM. Chitosan as a carrier for targeted delivery of small interfering RNA. Int J Pharm. 2010;399(1):1–11. | ||
Elzoghby AO, Samy WM, Elgindy NA. Protein-based nanocarriers as promising drug and gene delivery systems. J Control Release. 2012;161(1):38–49. | ||
Yin L, Song Z, Kim KH, et al. Reconfiguring the architectures of cationic helical polypeptides to control non-viral gene delivery. Biomaterials. 2013;34(9):2340–2349. | ||
Sun X, Zhang N. Cationic polymer optimization for efficient gene delivery. Mini Rev Med Chem. 2010;10(2):108–125. | ||
Dandekar P, Jain R, Keil M, et al. Cellular delivery of polynucleotides by cationic cyclodextrin polyrotaxanes. J Control Release. 2012;164(3):387–393. | ||
Yamada H, Loretz B, Lehr CM. Design of starch-graft-PEI polymers: an effective and biodegradable gene delivery platform. Biomacromolecules. 2014;15(5):1753–1761. | ||
Hao W, Liu D, Shang Y, Zhang J, Xu S, Liu H. pH-Triggered copolymer micelles as drug nanocarriers for intracellular delivery. RSC Adv. 2016;6(35):29149–29158. | ||
Wang S, Shen Y, Zhang J, Xu S, Liu H. A designed lipopeptide with a leucine zipper as an imbedded on/off switch for lipid bilayers. Phys Chem Chem Phys. 2016;18(15):10129–10137. | ||
Lajunen T, Nurmi R, Kontturi L, et al. Light activated liposomes: functionality and prospects in ocular drug delivery. J Control Release. 2016;244(pt B):157–166. | ||
Mi Y, Wolfram J, Mu C, et al. Enzyme-responsive multistage vector for drug delivery to tumor tissue. Pharmacol Res. 2016;113(pt A):92–99. | ||
Hao W, Han X, Shang Y, Xu S, Liu H. Insertion of pH-sensitive bola-type copolymer into liposome as a “stability anchor” for control of drug release. Colloids Surf B Biointerfaces. 2015;136:809–816. | ||
Needham D, McIntosh TJ, Lasic DD. Repulsive interactions and mechanical stability of polymer-grafted lipid membranes. Biochim Biophys Acta. 1992;1108(1):40–48. | ||
Torchilin VP, Omelyanenko VG, Papisov MI, et al. Poly(ethylene glycol) on the liposome surface: on the mechanism of polymer-coated liposome longevity. Biochim Biophys Acta. 1994;1195(1):11–20. | ||
Cheng R, Meng F, Deng C, Klok HA, Zhong Z. Dual and multi-stimuli responsive polymeric nanoparticles for programmed site-specific drug delivery. Biomaterials. 2013;34(14):3647–3657. | ||
Navarro G, Pan J, Torchilin VP. Micelle-like nanoparticles as carriers for DNA and siRNA. Mol Pharm. 2015;12(2):301–313. | ||
Vivek R, Thangam R, NipunBabu V, et al. Multifunctional HER2-antibody conjugated polymeric nanocarrier- based drug delivery system for multi-drug-resistant breast cancer therapy. ACS Appl Mater Interfaces. 2014;6(9):6469–6480. | ||
Münster PN, Marchion DC, Basso AD, Rosen N. Degradation of HER2 by ansamycins induces growth arrest and apoptosis in cells with HER2 overexpression via a HER3, phosphatidylinositol 30-kinase-AKT-dependent pathway. Cancer Res. 2002;62(11):3132–3137. | ||
Lee H, Dam DH, Ha JW, Yue J, Odom TW. Enhanced human epidermal growth factor receptor 2 degradation in breast cancer cells by lysosome-targeting gold nanoconstructs. ACS Nano. 2015;9(10):9859–9867. | ||
Mahlknecht G, Maron R, Mancini M, Schechter B, Sela M, Yarden Y. Aptamer to ErbB-2/HER2 enhances degradation of the target and inhibits tumorigenic growth. Proc Natl Acad Sci U S A. 2013;110(20):8170–8175. | ||
Roh H, Pippin J, Drebin JA. Down-regulation of HER2/neu expression induces apoptosis in human cancer cells that overexpress HER2/neu. Cancer Res. 2000;60(3):560–565. | ||
Yarden Y, Sliwkowski MX. Untangling the ErbB signalling network. Nat Rev Mol Cell Biol. 2001;2(2):127–137. | ||
McCloy RA, Rogers S, Caldon CE, Lorca T, Castro A, Burgess A. Partial inhibition of Cdk1 in G 2 phase overrides the SAC and decouples mitotic events. Cell Cycle. 2014;13(9):1400–1412. | ||
Burgess A, Vigneron S, Brioudes E, Labbé JC, Lorca T, Castro A. Loss of human Greatwall results in G2 arrest and multiple mitotic defects due to deregulation of the cyclin B-Cdc2/PP2A balance. Proc Natl Acad Sci U S A. 2010;107(28):12564–12569. | ||
Fasman GD. Circular dichroism and the conformational analysis of biomolecules. Plenum. 1996;72(1):52–57. | ||
Lin PH, Yen SL, Lin MS, et al. Microcalorimetrics studies of the thermodynamics and binding mechanism between L-tyrosinamide and aptamer. J Phys Chem B. 2008;112(21):6665–6673. | ||
Nagatoishi S, Tanaka Y, Tsumoto K. Circular dichroism spectra demonstrate formation of the thrombin-binding DNA aptamer G-quadruplex under stabilizing-cation-deficient conditions. Biochem Biophys Res Commun. 2007;352(3):812–817. | ||
Neve RM, Chin K, Fridlyand J, et al. A collection of breast cancer cell lines for the study of functionally distinct cancer subtypes. Cancer Cell. 2006;10(6):515–527. | ||
Yoshimori T, Yamamoto A, Moriyama Y, Futai M, Tashiro Y. Bafilomycin A1, a specific inhibitor of vacuolar-type H(+)-ATPase, inhibits acidification and protein degradation in lysosomes of cultured cells. J Biol Chem. 1991;266(26):17707–17719. | ||
Dragowska WH, Weppler SA, Wang JC, et al. Induction of autophagy is an early response to gefitinib and a potential therapeutic target in breast cancer. PLoS One. 2013;8(10):e76503. | ||
Nahta R, Esteva FJ. Herceptin: mechanisms of action and resistance. Cancer Lett. 2006;232(2):123–138. | ||
Meng F, Zhong Y, Cheng R, Deng C, Zhong Z. pH-sensitive polymeric nanoparticles for tumor-targeting doxorubicin delivery: concept and recent advances. Nanomedicine (Lond). 2014;9(3):487–499. | ||
Lee ES, Gao Z, You HB. Recent progress in tumor pH targeting nanotechnology. J Control Release. 2008;132(3):164–170. | ||
Higgs PG. RNA secondary structure: physical and computational aspects. Q Rev Biophys. 2000;33(2000):199–253. | ||
Miyoshi D, Sugimoto N. Molecular crowding effects on structure and stability of DNA. Biochimie. 2008;90(7):1040–1051. |
Supplementary materials
 | Figure S1 Circular dichroism spectra of free and MNP-encapsulated HER2-NCApt. |
 | Figure S2 Representative fluorescent microscopy images of the uptake of Texas red-labeled oligonucleotide-MNPs by HeLa cells. |
 | Figure S3 HER2 mRNA and protein expressions in SKBR3 and MCF7 breast cancer cell lines. |
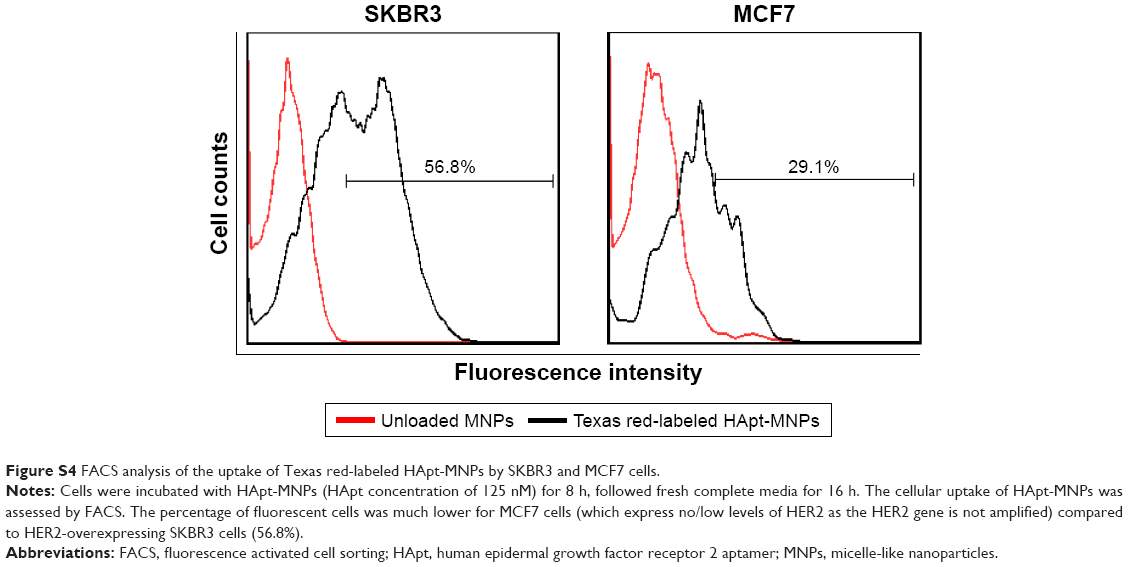 | Figure S4 FACS analysis of the uptake of Texas red-labeled HApt-MNPs by SKBR3 and MCF7 cells. |
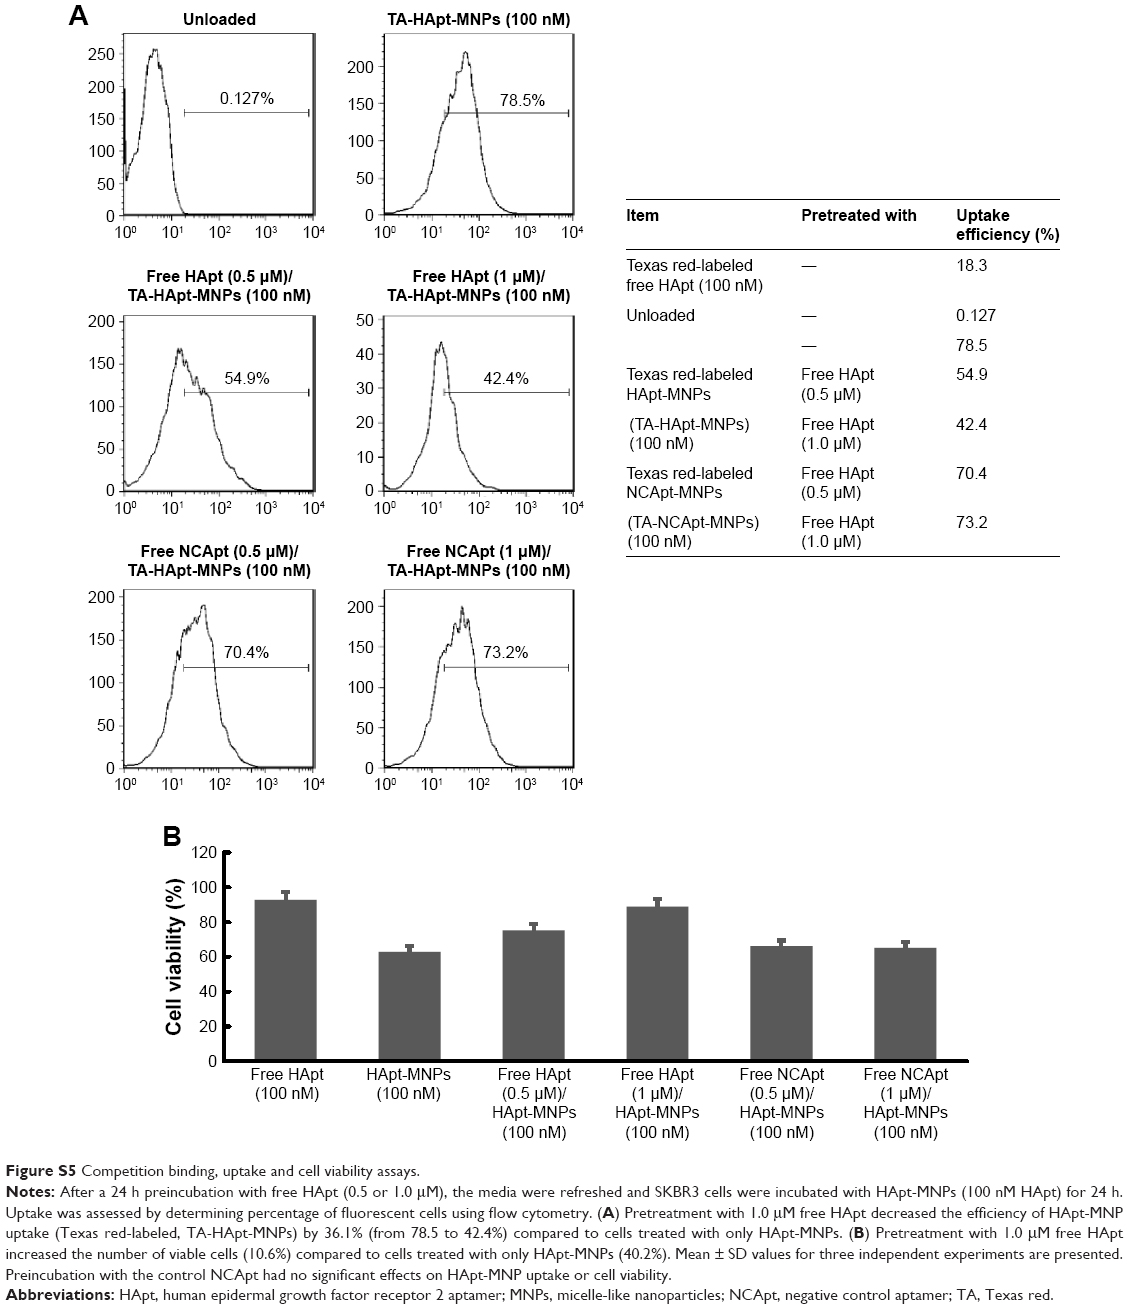 | Figure S5 Competition binding, uptake and cell viability assays. |
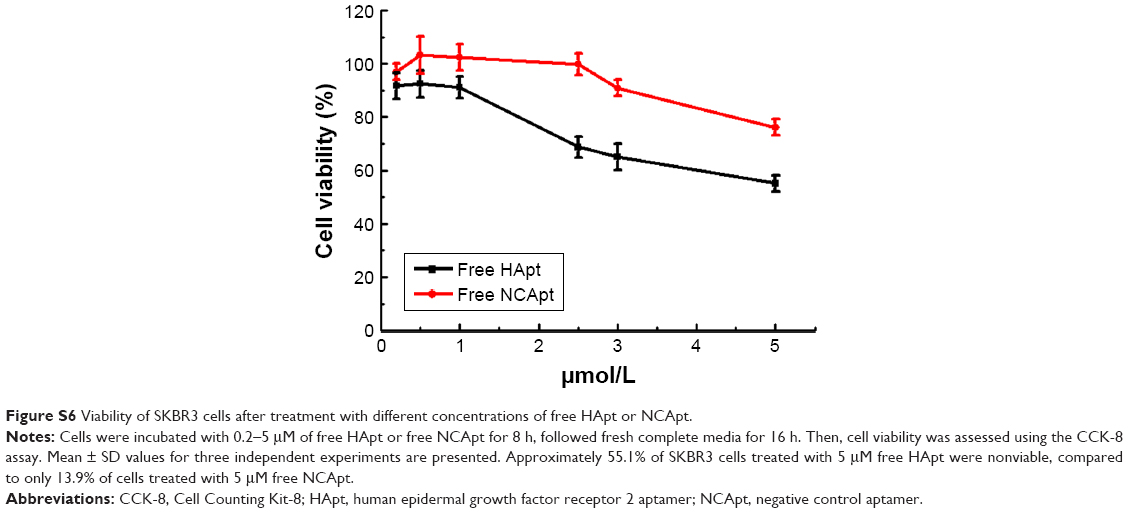 | Figure S6 Viability of SKBR3 cells after treatment with different concentrations of free HApt or NCApt. |
 | Figure S7 LysoTracker Red staining of bafilomycin Al-treated cells. |
 © 2018 The Author(s). This work is published and licensed by Dove Medical Press Limited. The full terms of this license are available at https://www.dovepress.com/terms.php and incorporate the Creative Commons Attribution - Non Commercial (unported, v3.0) License.
By accessing the work you hereby accept the Terms. Non-commercial uses of the work are permitted without any further permission from Dove Medical Press Limited, provided the work is properly attributed. For permission for commercial use of this work, please see paragraphs 4.2 and 5 of our Terms.
© 2018 The Author(s). This work is published and licensed by Dove Medical Press Limited. The full terms of this license are available at https://www.dovepress.com/terms.php and incorporate the Creative Commons Attribution - Non Commercial (unported, v3.0) License.
By accessing the work you hereby accept the Terms. Non-commercial uses of the work are permitted without any further permission from Dove Medical Press Limited, provided the work is properly attributed. For permission for commercial use of this work, please see paragraphs 4.2 and 5 of our Terms.