")
Back to Journals » Diabetes, Metabolic Syndrome and Obesity » Volume 14
Contribution of Different Phenotypes of Obesity to Metabolic Abnormalities from a Cross-Sectional Study in the Northwest China
Authors Lu X , Wang Q, Liang H, Xu L, Sha L, Wu Y, Ma L, Yang P, Lei H
Received 9 April 2021
Accepted for publication 16 June 2021
Published 7 July 2021 Volume 2021:14 Pages 3111—3121
DOI https://doi.org/10.2147/DMSO.S314935
Checked for plagiarism Yes
Review by Single anonymous peer review
Peer reviewer comments 3
Editor who approved publication: Dr Konstantinos Tziomalos
Xixuan Lu,1,* Qiang Wang,2,* Haiyan Liang,1 Li Xu,3 Liping Sha,1 Yuemei Wu,1 Liting Ma,1 Ping Yang,1 Hong Lei1
1Department of Endocrinology, Cardiovascular and Cerebrovascular Disease Hospital, Ningxia Medical University General Hospital, Yinchuan, Ningxia, People’s Republic of China; 2Department of Medical Office, People’s Hospital of Ningxia Hui Autonomous Region, Yinchuan, Ningxia, People’s Republic of China; 3Department of Radiology, People’s Liberation Army’s Joint Service for the 942nd Hospital, Yinchuan, Ningxia, People’s Republic of China
*These authors contributed equally to this work
Correspondence: Xixuan Lu
Department of Endocrinology, Cardiovascular and Cerebrovascular Disease Hospital, Ningxia Medical University General Hospital, No. 804, Shengli South Street, Xingqing District, Yinchuan, 750004, Ningxia, People’s Republic of China
Tel +860951-6746645
Email [email protected]
Background: This study has been conducted to explore the correlation between phenotypes of obesity and metabolic comorbidities.
Methods: This cross-sectional study recruited 14,724 adults aged ≥ 18 years with a randomized stratified sampling strategy. Obesity was classified into four types according to body mass index (BMI) and waist-to-height ratio (WHtR): normal weight with central obesity (NWCO) and without (NW) CO, and obese or overweight with (OBCO) and without (OB) central obesity. Uric acid (UA), fasting blood glucose (FBG), and lipid profile were measured.
Results: The prevalence of hyperuricemia in the 4 groups (NW, NWCO, OB and OBCO) was 3.7%, 5.6%, 8.7% and 12.4%, whilst the prevalence of hypertriglyceridemia was 13.4%, 27.4%, 30.3% and 43.7%, separately. The prevalence of hypo-high-density lipoprotein cholesterolemia (hypo-HDL emia) was 20.1%, 21.4%, 30.8% and 27.9%, while the prevalence of hyper-low-density lipoprotein cholesterolemia (hyper-LDL emia) was 9.8%, 24.4%, 12.3% and 27.9%. The prevalence of hypercholesterolemia was 11.2%, 23.5%, 14.7%, 28.5% and the prevalence of hyperglycemia was 9.7%, 22.6%, 18.5%, and 27.0%, respectively. The prevalence of hypertension was 6.9%, 13.1%, 14.7%, and 20.6%. For various metabolic abnormalities, OBCO have the highest risks compared with NW (hyperuricemia: adjusted OR (aOR)= 2.60; hypertriglyceridemia: aOR= 3.19; hypercholesterolemia: aOR= 1.48; hyper LDLemia: aOR= 2.21; hypo HDLemia: aOR= 1.42; hyperglycemia: aOR= 1.95; hypertension: aOR= 2.16). The risk of hyper LDLemia, hypercholesterolemia and hyperglycemia in the NWCO group was higher than that in the OB group (hyperLDLemia: aOR: 1.69 vs 0.97; hypercholesterolemia: aOR: 1.27 vs 1.24; hyperglycemia: aOR: 1.62 vs 1.28).
Conclusion: Different phenotypes of obesity are significantly associated with metabolic abnormalities. NWCO is more closely associated with hypercholesterolemia, hyperglycemia and hyper LDLemia. General obesity and central obesity have a synergistic effect on the diseases.
Keywords: obesity, central obesity, metabolic abnormalities, BMI, WHtR
Introduction
Obesity (OB) is a chronic disease caused by multiplex reasons including genetics, lifestyle and dysfunctional neurohormonal systems that manifested as excess weight and adiposopathy. According to WHO, the prevalence of obesity has tripled since 1975 with 1.9 billion overweight adults and 650 million obese adults.1 The increasing trend in obesity prevalence has put a heavy burden on health care economics, increasing risks for plenty of comorbidities such as cardiovascular disease (CVD),2 heart failure,3 liver disease, type 2 diabetes4 and specific cancers.5 The diagnosis of obesity is achieved by anthropometric methods, where waist circumference (WC) and waist/hip circumference ratio have been used as indicators of central obesity (CO), and body mass index (kg/m2) (BMI) has been used as general obesity Indicators.6 Recently, several studies indicated that waist-to-height Ratio (WHtR), as a new indicator of central obesity, is better and more effective to identify health risks in the overall population.7,8 Considerable evidences showed that both BMI and WHtR were closely correlated to various kinds of metabolic abnormalities, including diabetes,9–11 hypertension,12 dyslipidemia13 and hyperuricemia.14 However, researches that comprehensively analyze the effects of different phenotypes of obesity on metabolic disorders are rare. In this study, we investigated the association between phenotypes of obesity and the metabolic comorbidities and evaluate the independent effects of obesity on different metabolic disorders in a large sample size of a northwest population from 2014 to 2017.
Methods
Subjects
This study was conducted in Northwest china including six provinces (Ningxia, Shanxi, Gansu, Xinjiang, Qinghai, Mongolia) between 2014–2017 by using a whole cluster stratified random sampling design. Subjects selected for inclusion: age 18 and above; local residence for at least 5 years; non-pregnant women. The study was approved by the Ethics Committee of Ningxia Medical University General Hospital and all procedures were performed in accordance with the ethical standards of the Committee and with the 1964 Helsinki declaration and its later amendments (The ethical approval code:2,014,121). Participants were provided written informed consent after a detailed explanation. A total of 14,724 people were enrolled in this study. The sample screening process was illustrated in Figure 1.
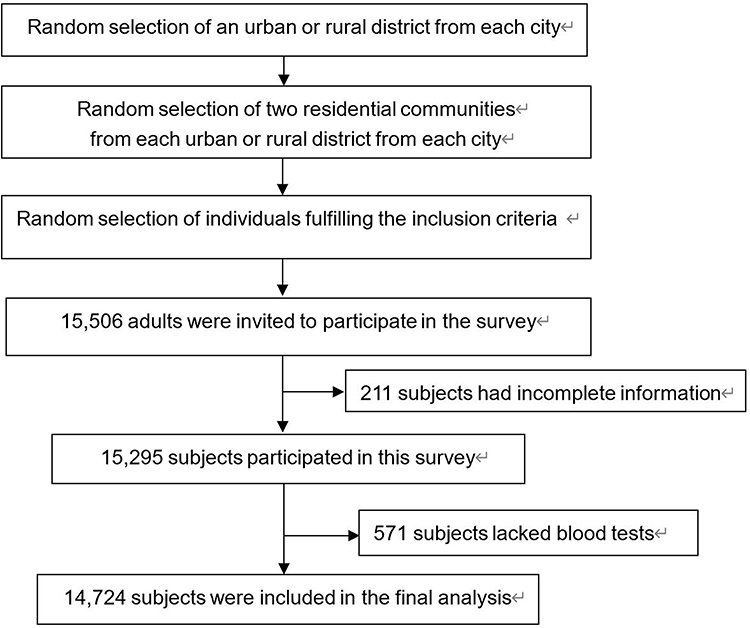 |
Figure 1 The sample screening process. |
Data Collection and Anthropometry
A standardized questionnaire was conducted by professionally trained workers to collect the data, including sociodemographic data, regional location, lifestyle, and medical history. Physical examination and blood pressure were operated by doctors or medical students. Body mass index was calculated as weight in kilograms divided by the square of the height in meters. Waist-to-height ratio was calculated by dividing the WC by the subject’s height. Blood pressure (BP) was measured three times after a resting period of at least 10 minutes, and the averages of three times were taken as the final value.
Laboratory Measurements and Anthropometry
Participants were asked to fast for 8 hours overnight before venipuncture. The blood specimens were centrifuged, separated, and stored at 4 °C, and then transported to the Laboratory of General Hospital of Ningxia Medical University to process the laboratory assays. Uric acid (UA), fasting blood glucose (FBG), and lipid profile were quantified using routine laboratory analysis (Konelab, Espoo, Finland). Wight was measured when subject was minimally clothed without shoes using digital scales and recorded to the nearest 100g. Height was measured in a standing position, without shoes, using tape meter, while the shoulders were in a normal position. BMI was calculated as weight in kilograms divided by height in meters squared. WC was measured at the narrowest level and that of hip at the maximal level over light clothing, using unstretched tape meter, without any pressure to body surface, and was recorded to the nearest 0.1cm. WHtR was calculated as WC divided by height.
Definitions of Obesity and Other Variables
Obesity is generally defined as a BMI ≥30 kg/m2, though a BMI ≥ 27.5 kg/m2 defines obesity in Asian populations.15 Based on the expert consensus on prevention and treatment of adult obesity in China, obesity is defined as a BMI ≥ 28kg/m2 which is closer to China’s national conditions. Taking into account the different definitions of obesity, we divided the study population into overweight and obese people (BMI≥24) and normal weight people (BMI<24).16 Central obesity was defined as WHtR ≥ 0.5.7 The phenotype of obesity was classified into the following four types according to general overweight or obesity and central obesity status: Normal weight with (NWCO) and without (NW) CO, and obese or overweight with (OBCO) and without (OB) central obesity. Definitions for metabolic abnormalities were listed as followings: hyperglycemia: fasting blood glucose (FBG) ≥ 6.1 mmol/L (110 mg/dL) and/or receiving current medication for this condition; hypertension: systolic blood pressure ≥ 140mmHg and/or diastolic blood pressure ≥ 90mmHg and/or currently being on antihypertensive medications; hypertriglyceridemia (HTG): serum triglyceride ≥ 1.7mmol/L (150 mg/dL) and/or receiving current medication; hypercholesterolemia (HC): serum cholesterol ≥ 5.2mmol/L (200 mg/dL) and/or receiving current medication; hypo-high-density lipoprotein cholesterolemia (hypo HDLemia): serum HDL cholesterol < 1.0mmol/L (40 mg/dL) in men and < 1.3mmol/L (50mg/dL) in women; hyper-low-density lipoprotein cholesterolemia (hyper LDLemia): serum LDL-C ≥3.4mmol/L (130 mg/dL); hyperuricemia (HUA): serum urate level ≥420 μmol/L (7.0 mg/dl) in males and ≥360 μmol/L (6.0 mg/dl) in females.17 Smoking status was classified as regular heavy smoker (having smoked at least 100 cigarettes in one’s lifetime and smoke ≥ 20 cigarettes/day), regular moderate smoker (having smoked at least 100 cigarettes in one’s lifetime and smoke < 20 cigarettes/day) and nonsmoker.18 The location was divided into an urban or rural area. Income was divided into low, medium, and high levels with the average annual income of < 10,000, < 50,000 and ≥ 50,000 Yuan separately. Educational attainment was classified as elementary school and below, junior high school and above and college and above. Salt intake was classified as high (>10.0 g/day), medium (6.0–10.0 g/day), and low (<6.0 g/day).
Statistical Analysis
All statistical analyses were performed using SPSS 22.0 software (SPSS Inc., Chicago, IL, USA). The measurement data in this article can be approximated as normal distributed, and therefore are expressed as means ± Standard deviation (Means ± SDs). One-way analysis of variance (ANOVA) was used for the comparison of continuous variables amongst all groups, and the Post Hoc multiple comparison was further applied to obtain the difference between the other three obese groups and NW. A chi-square test was performed to investigate the distributions (%) and the association between obesity and possible associated factors. Variables that were significantly associated or known a priori from the literature were considered as covariance in subsequent analyses. Odds ratios (ORs) and 95% confidence intervals (CI) were calculated by univariable and multivariable logistic regression to examine the association between obesity and metabolic disorders in a stepwise manner. For all measures, Two-tailed p < 0.05 was considered as statistically significant.
Results
The Basic Characteristics of the Studied Population
The study included a total of 14,724 people from six provinces of the northwest China. Based on BMI and WHtR, participants were divided into NW (n = 6018), NWCO (n = 1614), OB (n = 1118) and OBCO (n = 5974). The prevalence of NWCO, OB and OBCO were 11.0%, 7.6%, and 40.6%, respectively. NW subjects were more likely to be young, well-educated, and have higher income. The participants in the NWCO group were more likely to be females, older, poorly educated and nonsmokers. Subjects in the OB group were more likely to be males, live in rural areas, have lower salt intake and insufficient income. OBCO participants were more likely to live in urban areas, have medium-high salt intake and smoke cigarettes heavily. Tibetans accounted for a higher proportion of OBCO, while Hui and Han people accounted for a large proportion of NWCO and OB, separately. The sociodemographic and lifestyle characteristics of all participants categorized by the patterns of obesity are presented in Table 1.
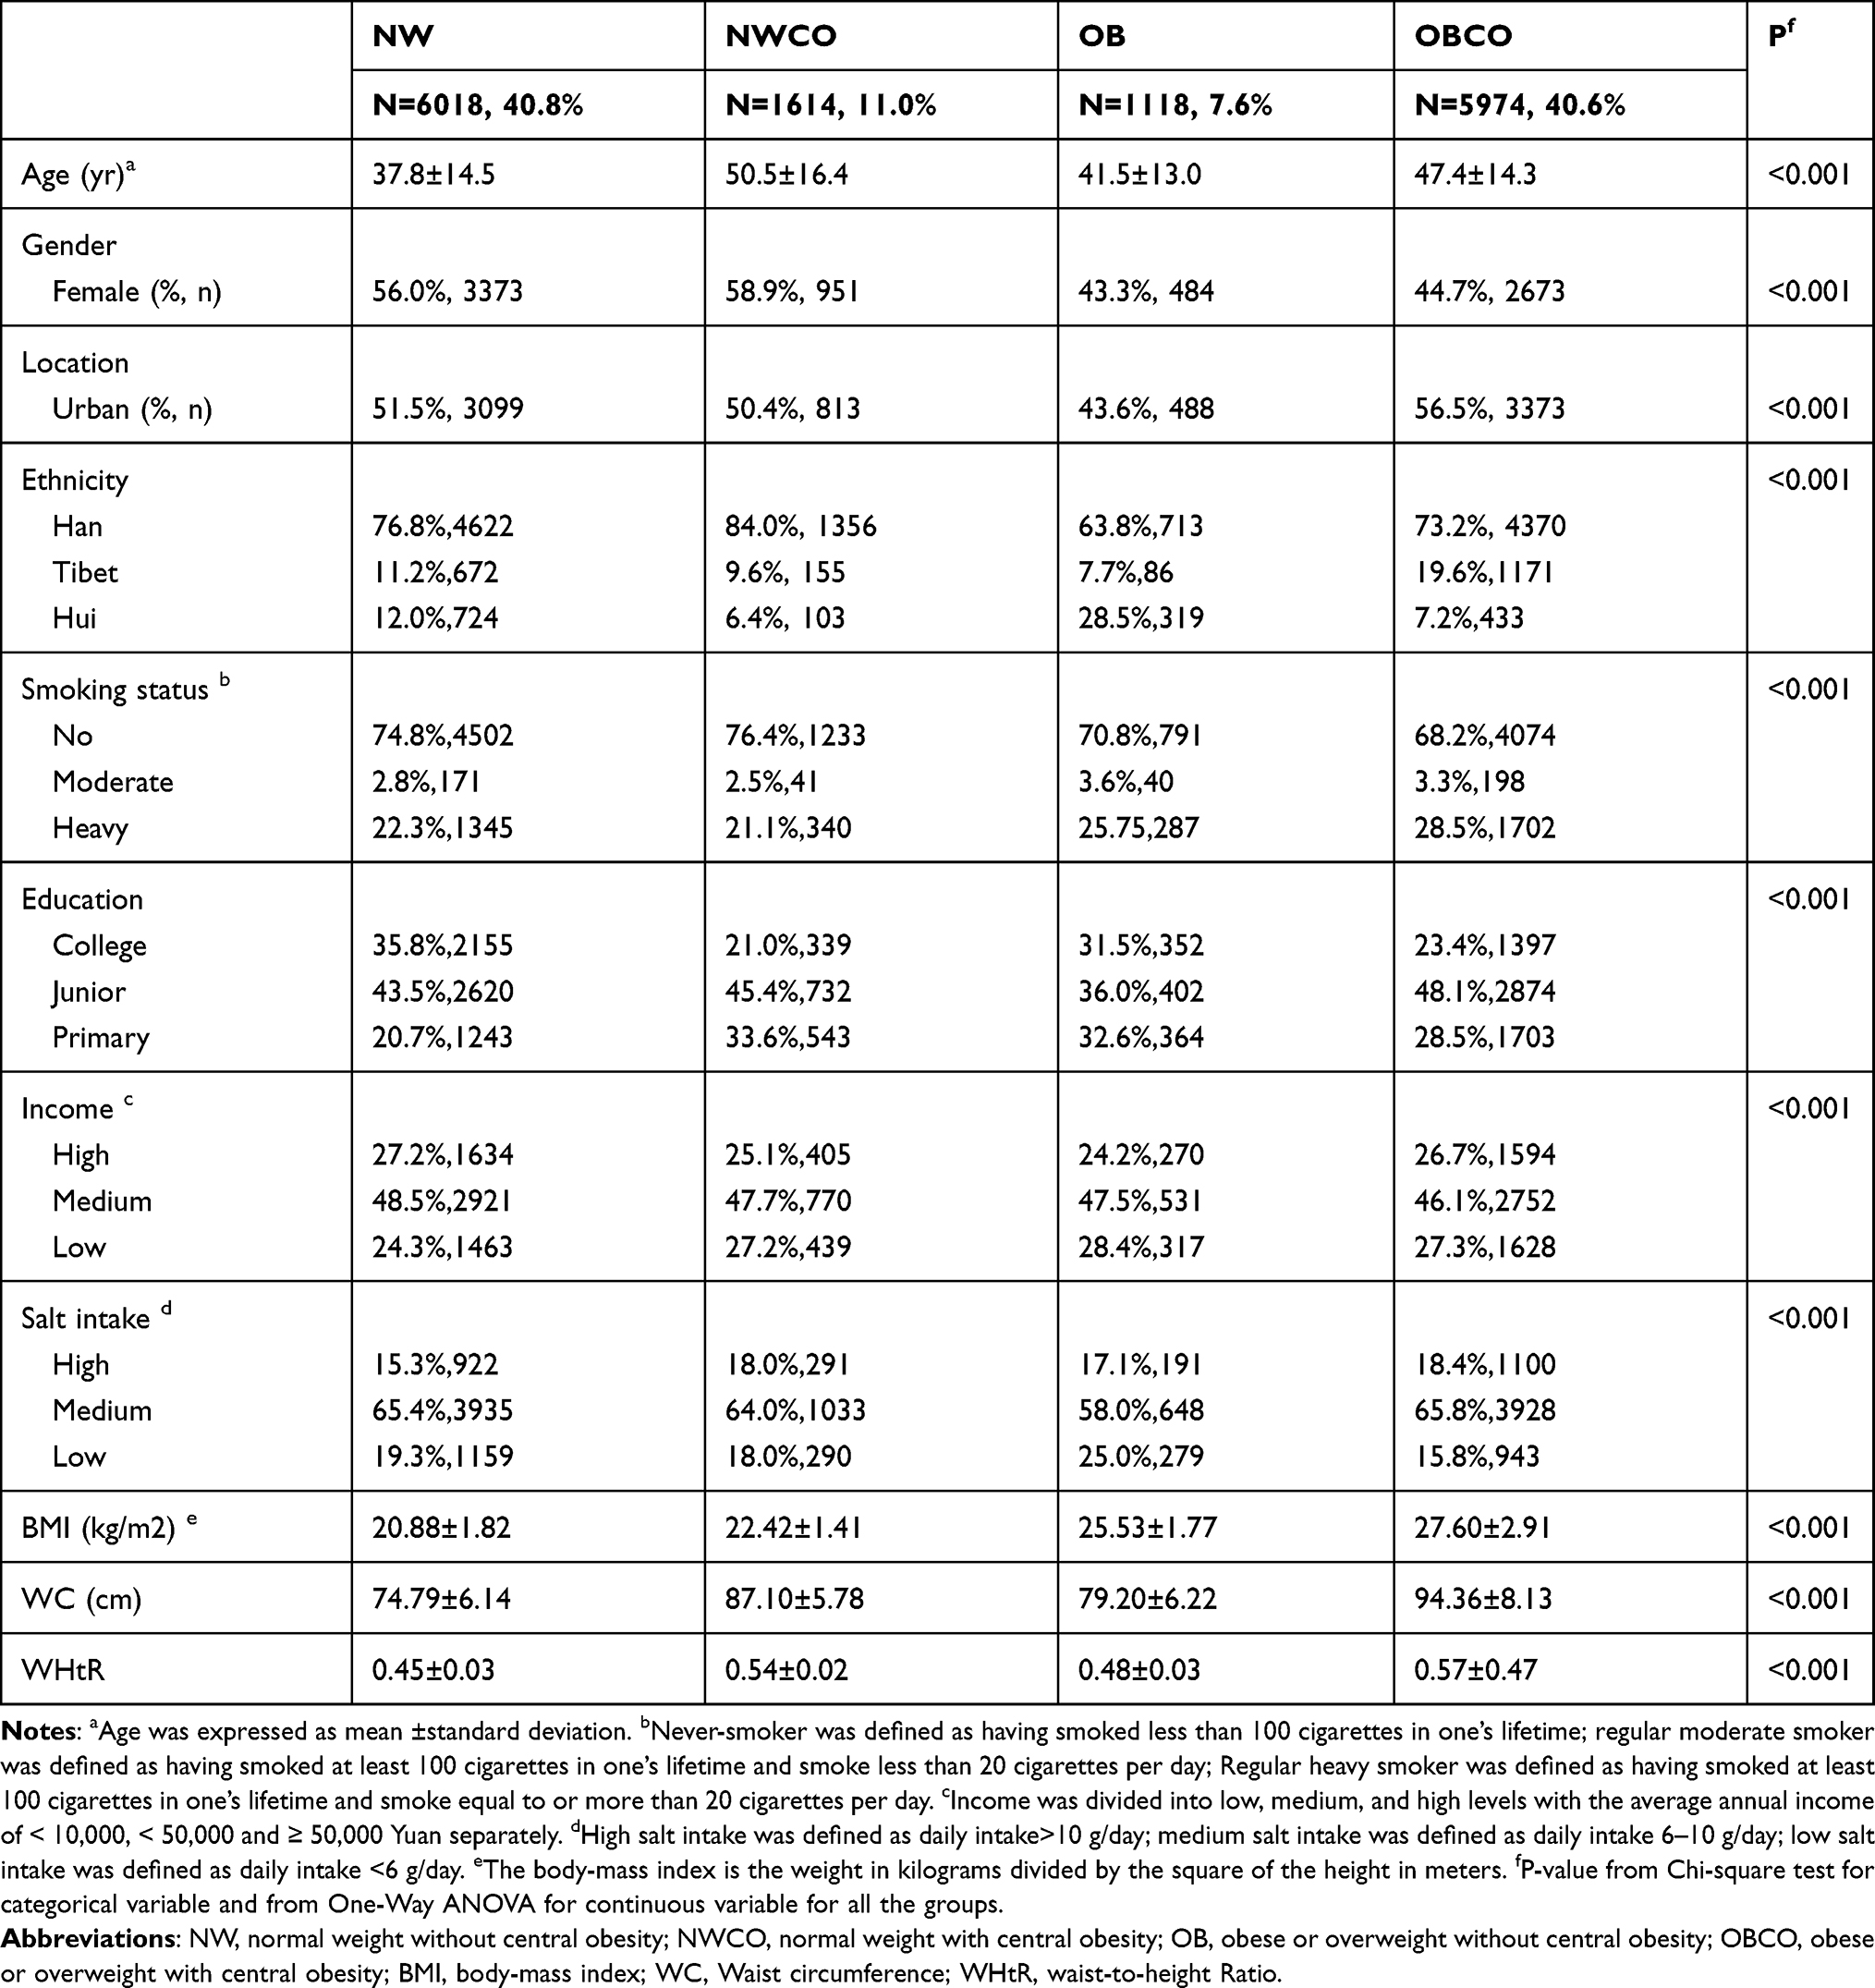 |
Table 1 The Basic Characteristics of Studied Participants (n=14,724) |
The Prevalence of Metabolic Abnormalities and Serological Metabolic Indexes in Different Obese Phenotypes
As shown in Table 2, the prevalence of hyperuricemia in the 4 groups (NW, NWCO, OB, and OBCO) was 3.7%, 5.6%, 8.7%, and 12.4%, respectively. The prevalence of HUA in OBCO group was significantly higher than that of the NW group (p<0.001). The prevalence of hypertriglyceridemia was 13.4%, 27.4%, 30.3% and, 43.7% respectively. The prevalence of hypo-HDLemia was 20.1%, 21.4%, 27.9% and 30.8%, while the prevalence of hyper-LDLemia was 9.8%, 24.4%, 12.3% and 27.9%. The prevalence of hypercholesterolemia was 11.2%, 23.5%, 14.7% and 28.5%. In addition, the prevalence of hyperglycemia in the four groups was 9.7%, 22.6%, 18.5%, and 27.0% whilst the prevalence of hypertension was 6.9%,13.1%, 14.7%, and 20.6%. It is found that the prevalence of metabolic abnormalities was remarkably higher in the other three groups than the NW group (p<0.05), with the highest occurrence in the OBCO group. Hyperuricemia, hypertriglyceridemia, hypertension, and hypo HDLemia seem to be more prevalent in OB group compared with NWCO. Hypercholesterolemia, hyper LDLemia and hyperglycemia was more epidemic in NWCO compared with OB. The serum uric acid level and blood lipid level showed a consistent trend in each group.
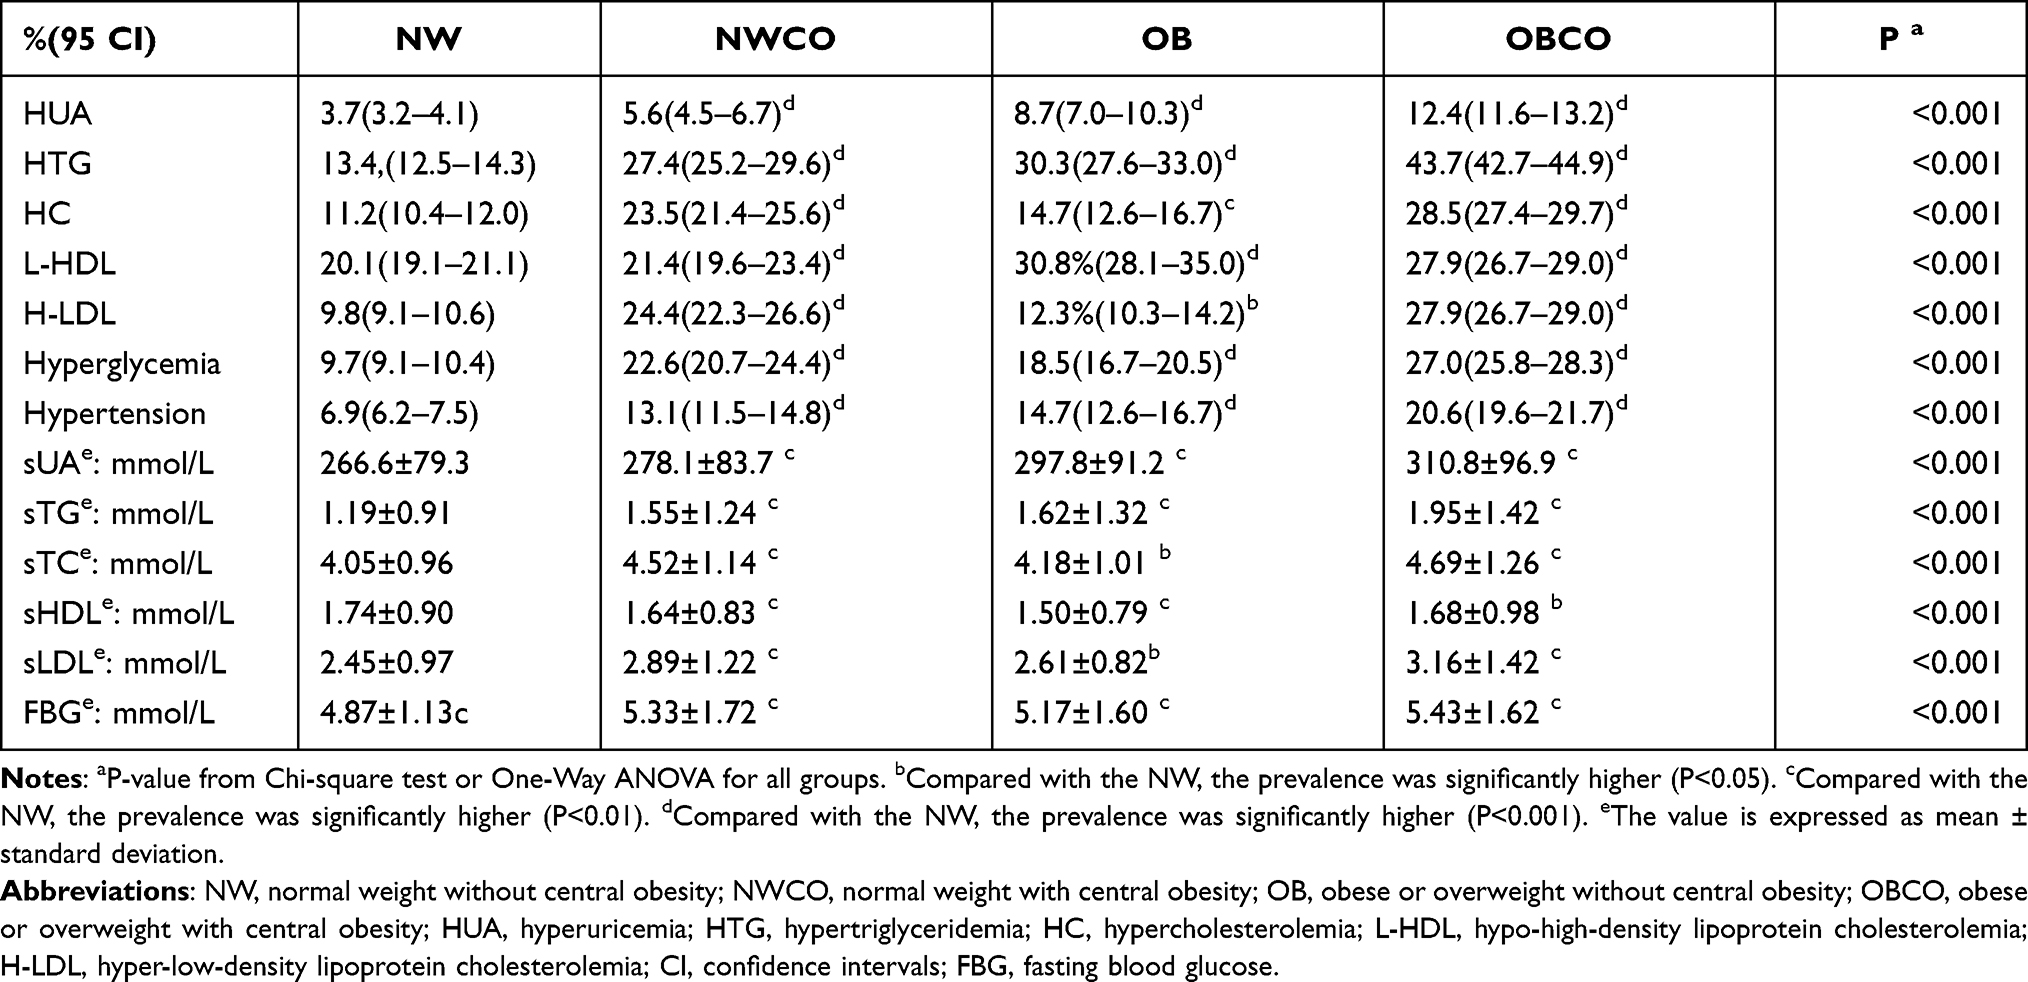 |
Table 2 The Prevalence of Metabolic Abnormalities and Serological Metabolic Indexes in Obese Phenotypes |
Association of Obesity Patterns with Different Metabolic Abnormalities
We then carried out stepwise logistic regression through different models to assess the risk of different obesity types for metabolic abnormalities. After univariate logistic regression, we analyzed a variety of influencing factors, including age, nationality, education, income, geographic region, lifestyle (smoking, salt intake), comorbidities (hyperglycemia, hyperuricemia, hypertension and dyslipidemia) and all the above factors were adjusted. For various metabolic abnormalities, people in the OBCO group have the highest risks without exception compared with the NW group (HUA: aOR= 2.60; HTG: aOR= 3.19, p<0.001; HC: aOR= 1.48, p<0.001; hyper LDLemia: aOR= 2.21, p<0.001; hypo HDLemia: aOR= 1.42, p<0.01; hyperglycemia: aOR= 1.95, p<0.001; hypertension: aOR= 2.16, p<0.001). However, the two different obesity phenotypes in the NWCO and OB groups have different contributions to the risk of metabolic abnormalities. The risk of hyper LDLemia, HC and hyperglycemia in the NWCO group was significantly higher than that in the OB group (hyper LDLemia: aOR:1.69 Vs 0.97; HC: aOR:1.27 Vs 1.24; hyperglycemia: aOR:1.62 Vs 1.28). Individuals of OB group had increased risks of HUA, HTG, hypo HDLemia, and hypertension as compared with NWCO group (HUA: aOR:2.24 Vs 1.61; HTG: aOR:2.69 Vs 2.18; hypo HDLemia: aOR:1.32 Vs 1.13; hypertension: aOR:1.78 Vs 1.32), as shown in Table 3.
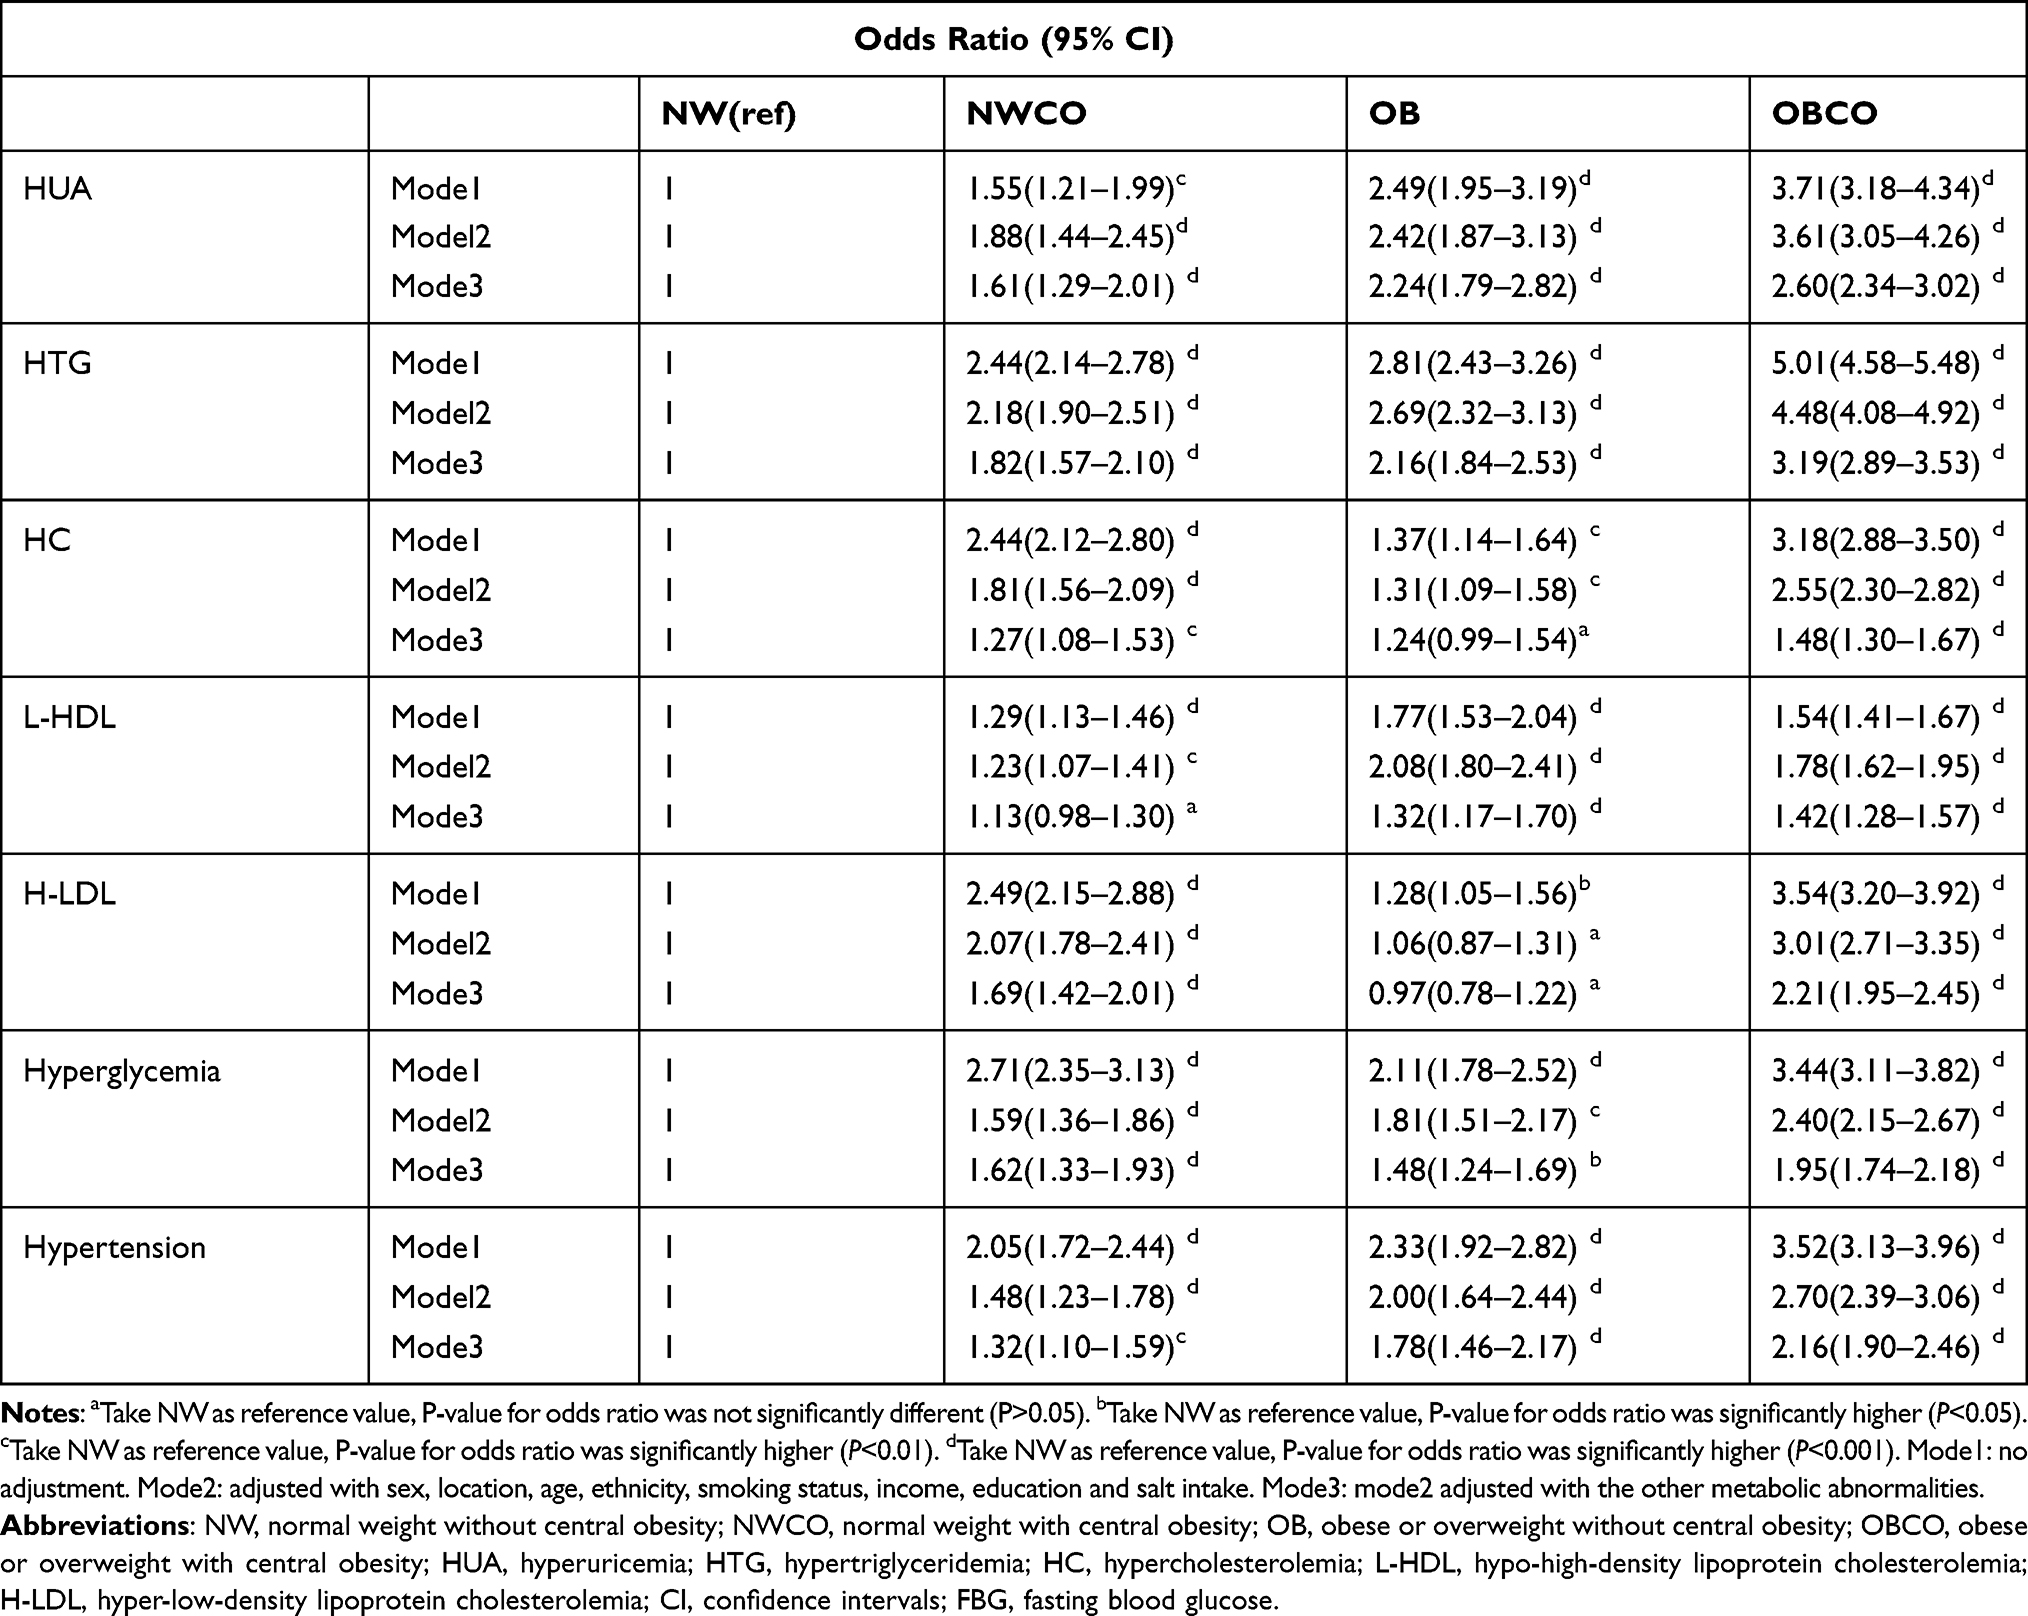 |
Table 3 The Correlation of Obesity Patterns with Different Metabolic Abnormalities |
Discussion
The deleterious effects of obesity on health have been widely acknowledged. Obesity is a major risk factor for cardiovascular diseases, cancer and diabetes mellitus and substantially increases the risk of metabolic diseases.19 In the past, substantive studies have explored the contribution of obesity to diseases by analyzing BMI, waist circumference and waist/hip ratio.20 Research on the obesity phenotypes and metabolic abnormalities is scarce.
Waist circumference was viewed as a better predictor of abdominal visceral fat and used to be a regular measure of central obesity.21 However, the cutoff values are differed by ethnicity, age, and sex.22,23 Waist-to-height ratio is considered to be a more reasonable anthropometric measurement factor for assessing central obesity and is proposed for self-assessment or monitoring of CVD risk factors.24 A systematic review has studied the predictive value of WHtR, WC and BMI for CVD, diabetes and related risk factors, and found that WHtR and WC are more probably reliable predictors than BMI.25
Therefore, we divided the population into different obesity phenotypes by WHtR and BMI, and further discovered the relationships between different phenotypes of obesity and metabolic comorbidities in Chinese adults. We found that all the metabolic comorbidities included was significantly associated with NWCO, OB and OBCO, compared with NW. It has been shown that the OBCO group has the highest risk of suffering from various metabolic abnormalities, suggesting that central obesity and ordinary obesity have a superimposing effect. Compared with OB, NWCO has a relatively higher risk of hyperglycemia, HC and hyper LDLmia, after the adjustment of the sociodemographic factors, lifestyles and abnormal metabolisms.
In the present study, we find that the risk of hyperglycemia in NWCO is higher than that of OB group, which is consistent with the previous results,13,26–28 suggesting that central obesity is more closely related to glucose metabolism. Excessive visceral fat is well known to be related with insulin resistance, dyslipidemia and inflammation.29 A cross-sectional analysis conducted in China suggested that compared with people with normal weight without abdominal obesity, NWCO patients have higher insulin resistance (IR) and decreased insulin sensitivity (DIS).30 Another study in Brazil reported that people with NWCO had a higher risk of IR and DIS.31 Waist circumference was the strongest associated factor and indicator of adipose tissue insulin resistance compared with BMI.32 Previous articles have inferred that obese individuals with normal weight usually have more lean mass, since this is the only way for individuals with large amounts of abdominal fat to keep BMI within the normal range. Therefore, obese people with normal weight not only have too much abdominal fat, but also decrease in muscle mass or muscle quantity, which may cause reduced energy consumption, poor aerobic fitness and metabolic disorders.33
Some previous studies have explored the influence of waist circumference, BMI, and waist circumference-to-height ratio on blood lipid profile.7,34 WHtR has also been suggested to be significantly related to the risk of hyper LDLemia and HC, which supported our results.35 Few articles have yet analyzed the effect of phenotypes of obesity on lipid in details. We found that the risk of hyper LDLemia is also significantly higher in the NWCO group than in the OB group. This result is in line with another study which found that abdominal obesity is the main driving factor of the secretion of hepatic VLDL particles, and therefore causes a significant increase in plasma VLDL concentration in women.36 The results of another study on abdominal obesity suggest that central obesity is not related to LDL which is different from our results. It can be attributed to the different adjustments of the confounding factors and the geographical discrepancy of the included population.
Previous studies have confirmed that abdominal fat accumulation is associated with liver fat,37 excessive production of very low-density lipoprotein (VLDL) in the liver, and decreased catabolism of apolipoprotein (apo) B in men.38 The impaired catabolism of VLDL1-triglyceride is the most important determinant of the plasma triglyceride concentration in people with central obesity.39 The specific molecular mechanism of abdominal obesity and hyper-LDLemia remains to be elucidated. LDL concentrations in abdominal obesity populations should be given more attention as the reduction in mortality was mainly achieved by successful reduction of LDL-cholesterol.40
Lipid metabolism is very dynamic and depends on many factors, including concentrations of TG-rich lipoproteins, levels and function of HDL, energy expenditure, insulin levels and sensitivity and function of adipose tissues. The most significant contributing factor for obesity-related dyslipidemia is likely uncontrolled fatty acid released from adipose tissue, especially visceral adipose tissue, through lipolysis, which causes increased delivery of fatty acids to the liver and synthesis of very-low-density lipoprotein (VLDL).41 We hypothesize that different obesity phenotypes may cause different lipid metabolism abnormalities due to the following factors: I. Different degrees of insulin resistance. Central obesity and hyperinsulinemia accompanying insulin resistance cause an excess production of VLDL, which is triglyceride-rich in the liver.42 The enhanced lipolytic activity of visceral adipocytes may cause an increased free fatty acid flux to the liver and stimulate VLDL secretion. II. Difference in adipocyte size, white adipose tissue (WAT) and brown adipose tissue (BAT). Enlargement of adipocytes is related with an increase in lipolysis, leading to further increases in levels of circulating free fatty acids and their delivery to the liver to increase triglyceride synthesis.43 The content of visceral adipose tissue is positively correlated with the number of VLDLs and LDLs, even when controlling for BMI and distribution of subcutaneous adipose tissue.44 In addition, cholesterol in WAT was reported to efflux to HDL.45 BAT has been identified as a key player in triglyceride clearance because thermogenesis of BAT consumes large amounts of fatty acids,46 and BAT activation decreases cholesterol levels as well.47 III. Diversity on apolipoprotein (apo) and lipid metabolism. Lipid metabolism is regulated by several enzymes and proteins acting as co-factors. Plasma apo C-III concentrations correlate positively with plasma TG.48 Apoprotein B100 is necessary for the secretion of VLDL, IDL, and LDL.49 Peripheral obesity and central obesity may have an impact on different apolipoproteins and consequently affect the content of various lipid components. Besides, the LDL receptor expression is found to be reduced in central obesity,50 providing clues to the higher concentration of LDL in central obesity. IV. Inflammation and adipokines. Adipose tissue has a major endocrine function secreting multiple adipokines such as tumor necrosis factor-α (TNF-α), interleukin-6 (IL-6), interleukin-1 (IL-1), serum amyloid A (SAA) and adiponectin, and the number of ad macrophages also play an important role in the development of dyslipidemia. levels of plasma TNF-α are reported to be associated with the promotion of hepatic triglyceride synthesis and secretion,51 as well as inhibition of lipoprotein lipase (LPL).52 IL-6 is also related to hypertriglyceridemia.53 Adiponectin have been suggested negatively correlated with triglycerides and positively correlated with HDL cholesterol.54 Despite the above evidence, additional experiments targeting apolipoprotein, LDL-receptor, adipokines and inflammation are required to verify the hypothesis. The specific mechanism of BMI and WC on lipid metabolism needs to be further explored.
In this article, all types of obese patients have increased risks of hypertension and hyperuricemia compared with NW group, which fits well with many previous studies.13,14,55–57 The increase in serum UA in obese individuals may be attributed to two factors: overproduction and poor renal excretion. Most obese patients have excess energy, which may result in over-production of purine. A study has shown that obese patients have reduced urinary urate excretion and clearance.58 Furthermore, the accumulation of visceral fat causes a large quantity of plasma free fatty acids to flow into the liver to stimulate the synthesis of triglycerides, and then induce an associated overvoltage in the production of uric acid by activating the uric acid synthesis.59,60 A Japanese study found that NWCO has a higher risk of hyperuricemia compared with OB.61 Although our research has failed to reach unanimous conclusion, increasing studies suggest that the contribution of NWCO to the severity of certain diseases is even higher than that of ordinary obesity,62,63 especially in cardiovascular disease33,64 and mortality.65,66
The mechanisms of hypertension linked to obesity are complex. Our current understanding of pathophysiology is based on the sympathetic nervous system (SNS), kidney and adrenal function, endothelium, adipokine and insulin resistance. Obese subjects display signs of an augmented sympathetic nerve circulation and an increased rate of norepinephrine overflow.67,68 The increased sympathetic outflow to the kidneys is also responsible for the increased retention of sodium.69 Recent studies suggest that central renin-angiotensin system (RAS) is capable of modulating the effects of leptin on energy expenditure and blood pressure.70 It has also been suggested that adiponectin plays a protective role against hypertension via an endothelium-dependent mechanism.71 The role of insulin-mediated SNS stimulation in the pathogenesis of hypertension is supported by evidence that indicating concomitant decreases in BP and SNS activity when insulin is lowered by low energy diets in obese patients.72 Insulin also acts directly on the kidney to stimulate and enhance sodium reabsorption.73
Several limitations of the study need to be noted. First, the cross-sectional design of the study restricted the interpretation of the observed associations in terms of cause and effect. Second, in our research, we did not evaluate insulin resistance which is a core component of the pathophysiology of metabolic disorders. In addition, there is also a lack of data on physical activity. This may cause bias and weak interpretation of the results. Finally, our study is limited by geography and sample size. More prospective population-based research should be conducted.
In conclusion, we found that different phenotypes of obesity are markedly associated with hyperglycemia, hypertension, hyperuricemia and dyslipidemia. They are all independent risk factors for metabolic abnormalities despite of the phenotypes. Central obesity with normal weight is more closely associated with hypercholesterolemia, hyperglycemia and hyper LDLemia. General obesity and central obesity have a synergistic effect on the diseases.
Funding
This study was supported by the Ningxia Medical University Special Talent Fund (XT2019023) and Ningxia Natural Science Foundation (2020AAC03424).
Disclosure
The authors declare that they have no conflict of interest.
References
1. World Health Organization (WHO). Obesity and overweight. 2018. Available from: https://www.who.int/newsroom/fact-sheets/detail/obesity-and-overweight.
2. Alpert M, Karthikeyan K, Abdullah O, Ghadban R. Obesity and cardiac remodeling in adults: mechanisms and clinical implications. Prog Cardiovasc Dis. 2018;61(2):114–123. doi:10.1016/j.pcad.2018.07.012
3. Pandey A, Patel K, Vaduganathan M, et al. Physical activity, fitness, and obesity in heart failure with preserved ejection fraction. JACC Heart Fail. 2018;6(12):975–982. doi:10.1016/j.jchf.2018.09.006
4. Gastaldelli A, Gaggini M, DeFronzo R. Role of adipose tissue insulin resistance in the natural history of type 2 diabetes: results from the San Antonio Metabolism Study. Diabetes. 2017;66(4):815–822. doi:10.2337/db16-1167
5. Rasha F, Ramalingam L, Gollahon L, et al. Mechanisms linking the renin-angiotensin system, obesity, and breast cancer. Endocr Relat Cancer. 2019;26(12):R653–R672. doi:10.1530/ERC-19-0314
6. Molarius A, Seidell J. Selection of anthropometric indicators for classification of abdominal fatness--a critical review. Int J Obes Relat Metab Disord. 1998;22(8):719–727. doi:10.1038/sj.ijo.0800660
7. Ashwell M, Gunn P, Gibson S. Waist-to-height ratio is a better screening tool than waist circumference and BMI for adult cardiometabolic risk factors: systematic review and meta-analysis. Obes Rev. 2012;13(3):275–286. doi:10.1111/j.1467-789X.2011.00952.x
8. Ashwell M, Hsieh S. Six reasons why the waist-to-height ratio is a rapid and effective global indicator for health risks of obesity and how its use could simplify the international public health message on obesity. Int J Food Sci Nutr. 2005;56(5):303–307. doi:10.1080/09637480500195066
9. Hsieh S, Yoshinaga H, Muto T. Waist-to-height ratio, a simple and practical index for assessing central fat distribution and metabolic risk in Japanese men and women. Int J Obes Relat Metab Disord. 2003;27(5):610–616. doi:10.1038/sj.ijo.0802259
10. Hadaegh F, Zabetian A, Harati H, Azizi F. Waist/height ratio as a better predictor of type 2 diabetes compared to body mass index in Tehranian adult men--a 3.6-year prospective study. Exp Clin Endocrinol Diabetes. 2006;114(6):310–315. doi:10.1055/s-2006-924123
11. Schienkiewitz A, Schulze M, Hoffmann K, Kroke A, Boeing H. Body mass index history and risk of type 2 diabetes: results from the European Prospective Investigation into Cancer and Nutrition (EPIC)-Potsdam Study. Am J Clin Nutr. 2006;84(2):427–433. doi:10.1093/ajcn/84.2.427
12. Redón J, Cea-Calvo L, Moreno B, et al. Independent impact of obesity and fat distribution in hypertension prevalence and control in the elderly. J Hypertens. 2008;26(9):1757–1764. doi:10.1097/HJH.0b013e3283077f03
13. Thaikruea L, Thammasarot J. Prevalence of normal weight central obesity among Thai healthcare providers and their association with CVD risk: a cross-sectional study. Sci Rep. 2016;6(1):37100. doi:10.1038/srep37100
14. Liu F, Du G, Song N, et al. Hyperuricemia and its association with adiposity and dyslipidemia in Northwest China: results from cardiovascular risk survey in Xinjiang (CRS 2008–2012). Lipids Health Dis. 2020;19(1):58. doi:10.1186/s12944-020-01211-z
15. Purnell JQ. Definitions, classification, and epidemiology of obesity. 2018. In: Feingold KR, Anawalt B, Boyce A, et al. editors. Endotext [Internet]. South Dartmouth (MA): MDText.com, Inc.; 2000. Available from: https://www.ncbi.nlm.nih.gov/books/NBK279167/.
16. Expert consensus on prevention and treatment of adult obesity in China[J]. Chinese Journal of Endocrinology and Metabolism. 2011;(09):711–717.
17. Wise CM, Agudelo CA. Gout and hyperuricemia. Curr Opin Rheumatol. 1990;2(5):783–788. doi:10.1097/00002281-199002050-00016
18. Li Y, Teng D, Shi X, et al. Prevalence of diabetes recorded in mainland China using 2018 diagnostic criteria from the American Diabetes Association: national cross sectional study. BMJ. 2020;369:m997. doi:10.1136/bmj.m997
19. Blüher M. Obesity: global epidemiology and pathogenesis. Nat Rev Endocrinol. 2019;15(5):288–298. doi:10.1038/s41574-019-0176-8
20. Vazquez G, Duval S, Jacobs D, Silventoinen K. Comparison of body mass index, waist circumference, and waist/hip ratio in predicting incident diabetes: a meta-analysis. Epidemiol Rev. 2007;29:
21. Matsushita Y, Tomita K, Yokoyama T, Mizoue T. Optimal waist circumference measurement site for assessing the metabolic syndrome. Diabetes Care. 2009;32(6):e70. doi:10.2337/dc09-0190
22. Matsushita Y, Tomita K, Yokoyama T, Mizoue T. Relations between waist circumference at four sites and metabolic risk factors. Obesity. 2010;18(12):2374–2378. doi:10.1038/oby.2010.33
23. Wang Z, Ma J, Si D. Optimal cut-off values and population means of waist circumference in different populations. Nutr Res Rev. 2010;23(2):191–199. doi:10.1017/S0954422410000120
24. Ashwell M, Cole T, Dixon A. Ratio of waist circumference to height is strong predictor of intra-abdominal fat. BMJ. 1996;313(7056):559–560. doi:10.1136/bmj.313.7056.559d
25. Browning L, Hsieh S, Ashwell M. A systematic review of waist-to-height ratio as a screening tool for the prediction of cardiovascular disease and diabetes: 0·5 could be a suitable global boundary value. Nutr Res Rev. 2010;23(2):247–269. doi:10.1017/S0954422410000144
26. Hayashi T, Boyko E, Leonetti D, et al. Visceral adiposity and the risk of impaired glucose tolerance: a prospective study among Japanese Americans. Diabetes Care. 2003;26(3):650–655. doi:10.2337/diacare.26.3.650
27. Du T, Sun X, Huo R, Yu X. Visceral adiposity index, hypertriglyceridemic waist and risk of diabetes: the China Health and Nutrition Survey 2009. Int j Obes. 2014;38(6):840–847. doi:10.1038/ijo.2013.181
28. Mamtani M, Kulkarni H, Dyer T, et al. Waist circumference is genetically correlated with incident type 2 diabetes in Mexican-American families. Diabet Med. 2014;31(1):31–35. doi:10.1111/dme.12266
29. Ebtehaj S, Gruppen E, Parvizi M, Tietge U, Dullaart R. The anti-inflammatory function of HDL is impaired in type 2 diabetes: role of hyperglycemia, paraoxonase-1 and low grade inflammation. Cardiovasc Diabetol. 2017;16(1):132. doi:10.1186/s12933-017-0613-8
30. Song P, Li X, Bu Y, et al. Temporal trends in normal weight central obesity and its associations with cardiometabolic risk among Chinese adults. Sci Rep. 2019;9(1):5411. doi:10.1038/s41598-019-41986-5
31. Madeira F, Silva A, Veloso H, et al. Normal weight obesity is associated with metabolic syndrome and insulin resistance in young adults from a middle-income country. PLoS One. 2013;8(3):e60673. doi:10.1371/journal.pone.0060673
32. Jiang J, Cai X, Pan Y, et al. Relationship of obesity to adipose tissue insulin resistance. BMJ Open Diabetes Res Care. 2020;8(1):e000741. doi:10.1136/bmjdrc-2019-000741
33. Sahakyan K, Somers V, Rodriguez-Escudero J, et al. Normal-weight central obesity: implications for total and cardiovascular mortality. Ann Intern Med. 2015;163(11):827–835. doi:10.7326/M14-2525
34. Guasch-Ferré M, Bulló M, Martínez-González M, et al. Waist-to-height ratio and cardiovascular risk factors in elderly individuals at high cardiovascular risk. PLoS One. 2012;7(8):e43275. doi:10.1371/journal.pone.0043275
35. Bertsias G, Mammas I, Linardakis M, Kafatos A. Overweight and obesity in relation to cardiovascular disease risk factors among medical students in Crete, Greece. BMC Public Health. 2003;3(1):3. doi:10.1186/1471-2458-3-3
36. Hodson L, Banerjee R, Rial B, et al. Menopausal status and abdominal obesity are significant determinants of hepatic lipid metabolism in women. J Am Heart Assoc. 2015;4(10):e002258. doi:10.1161/JAHA.115.002258
37. Kotronen A, Westerbacka J, Bergholm R, Pietiläinen K, Yki-Järvinen H. Liver fat in the metabolic syndrome. J Clin Endocrinol Metab. 2007;92(9):3490–3497. doi:10.1210/jc.2007-0482
38. Chan D, Watts G, Redgrave T, Mori T, Barrett P. Apolipoprotein B-100 kinetics in visceral obesity: associations with plasma apolipoprotein C-III concentration. Metabolism. 2002;51(8):1041–1046. doi:10.1053/meta.2002.33339
39. Björnson E, Adiels M, Taskinen M, Borén J. Kinetics of plasma triglycerides in abdominal obesity. Curr Opin Lipidol. 2017;28(1):11–18. doi:10.1097/MOL.0000000000000375
40. Baigent C, Blackwell L, Emberson J, et al. Efficacy and safety of more intensive lowering of LDL cholesterol: a meta-analysis of data from 170,000 participants in 26 randomised trials. Lancet. 2010;376(9753):1670–1681.
41. Jung U, Choi M. Obesity and its metabolic complications: the role of adipokines and the relationship between obesity, inflammation, insulin resistance, dyslipidemia and nonalcoholic fatty liver disease. Int J Mol Sci. 2014;15(4):6184–6223.
42. Howard BV. Insulin resistance and lipid metabolism. Am J Cardiol. 1999;84(1a):28j–32j. doi:10.1016/S0002-9149(99)00355-0
43. Veilleux A, Caron-Jobin M, Noël S, Laberge P, Tchernof A. Visceral adipocyte hypertrophy is associated with dyslipidemia independent of body composition and fat distribution in women. Diabetes. 2011;60(5):1504–1511. doi:10.2337/db10-1039
44. Sam S, Haffner S, Davidson M, et al. Relationship of abdominal visceral and subcutaneous adipose tissue with lipoprotein particle number and size in type 2 diabetes. Diabetes. 2008;57(8):2022–2027. doi:10.2337/db08-0157
45. Zhang Y, McGillicuddy F, Hinkle C, et al. Adipocyte modulation of high-density lipoprotein cholesterol. Circulation. 2010;121(11):1347–1355. doi:10.1161/CIRCULATIONAHA.109.897330
46. Bartelt A, Bruns O, Reimer R, et al. Brown adipose tissue activity controls triglyceride clearance. Nat Med. 2011;17(2):200–205. doi:10.1038/nm.2297
47. Berbée J, Boon M, Khedoe P, et al. Brown fat activation reduces hypercholesterolaemia and protects from atherosclerosis development. Nat Commun. 2015;6:6356. doi:10.1038/ncomms7356
48. Ooi E, Barrett P, Chan D, Watts G. Apolipoprotein C-III: understanding an emerging cardiovascular risk factor. Clin sci. 2008;114(10):611–624. doi:10.1042/CS20070308
49. Ginsberg HN. Lipoprotein physiology. Endocrinol Metab Clin North Am. 1998;27(3):503–519. doi:10.1016/S0889-8529(05)70023-2
50. Mamo J, Watts G, Barrett P, Smith D, James A, Pal S. Postprandial dyslipidemia in men with visceral obesity: an effect of reduced LDL receptor expression? Am J Physiol Endocrinol Metab. 2001;281(3):E626–E632. doi:10.1152/ajpendo.2001.281.3.E626
51. Feingold K, Serio M, Adi S, Moser A, Grunfeld C. Tumor necrosis factor stimulates hepatic lipid synthesis and secretion. Endocrinology. 1989;124(5):2336–2342. doi:10.1210/endo-124-5-2336
52. Kawakami M, Cerami A. Studies of endotoxin-induced decrease in lipoprotein lipase activity. J Exp Med. 1981;154(3):631–639. doi:10.1084/jem.154.3.631
53. Nappo F, Esposito K, Cioffi M, et al. Postprandial endothelial activation in healthy subjects and in type 2 diabetic patients: role of fat and carbohydrate meals. J Am Coll Cardiol. 2002;39(7):1145–1150. doi:10.1016/S0735-1097(02)01741-2
54. Christou GA, Kiortsis DN. Adiponectin and lipoprotein metabolism. Obes Rev. 2013;14(12):939–949. doi:10.1111/obr.12064
55. Seok Lee H, Park YM, Han K, et al. Obesity-related hypertension: findings from The Korea National Health and Nutrition Examination Survey 2008–2010. PLoS One. 2020;15(4):e0230616. doi:10.1371/journal.pone.0230616
56. Chen Y, Liang X, Zheng S, Wang Y, Lu W. Association of body fat mass and fat distribution with the incidence of hypertension in a population‐based Chinese cohort: a 22‐year follow‐up. J Am Heart Assoc. 2018;7(6):e007153.
57. Chandra A, Neeland IJ, Berry JD, et al. The relationship of body mass and fat distribution with incident hypertension. J Am Coll Cardiol. 2014;64(10):997–1002. doi:10.1016/j.jacc.2014.05.057
58. Matsuura F, Yamashita S, Nakamura T, et al. Effect of visceral fat accumulation on uric acid metabolism in male obese subjects: visceral fat obesity is linked more closely to overproduction of uric acid than subcutaneous fat obesity. Metabolism. 1998;47(8):929–933. doi:10.1016/S0026-0495(98)90346-8
59. Fabregat I, Revilla E, Machado A. Short-term control of the pentose phosphate cycle by insulin could be modulated by the NADPH/NADP ratio in rat adipocytes and hepatocytes. Biochem Biophys Res Commun. 1987;146(2):920–925. doi:10.1016/0006-291X(87)90618-8
60. Tanaka K, Ogata S, Tanaka H, Omura K, Honda C, Hayakawa K. The relationship between body mass index and uric acid: a study on Japanese adult twins. Environ Health Prev Med. 2015;20(5):347–353. doi:10.1007/s12199-015-0473-3
61. Shirasawa T, Ochiai H, Yoshimoto T, et al. Cross-sectional study of associations between normal body weight with central obesity and hyperuricemia in Japan. BMC Endocr Disord. 2020;20(1):2. doi:10.1186/s12902-019-0481-1
62. Ferreira I, Snijder M, Twisk J, et al. Central fat mass versus peripheral fat and lean mass: opposite (adverse versus favorable) associations with arterial stiffness? The Amsterdam Growth and Health Longitudinal Study. J Clin Endocrinol Metab. 2004;89(6):2632–2639. doi:10.1210/jc.2003-031619
63. Wan J, Zhou P, Wang D, et al. Impact of normal weight central obesity on clinical outcomes in male patients with premature acute coronary syndrome. Angiology. 2019;70(10):960–968. doi:10.1177/0003319719835637
64. Sharma S, Batsis J, Coutinho T, et al. Normal-weight central obesity and mortality risk in older adults with coronary artery disease. Mayo Clin Proc. 2016;91(3):343–351. doi:10.1016/j.mayocp.2015.12.007
65. Pischon T, Boeing H, Hoffmann K, et al. General and abdominal adiposity and risk of death in Europe. N Engl J Med. 2008;359(20):2105–2120. doi:10.1056/NEJMoa0801891
66. Sun Y, Liu B, Snetselaar L, et al. Association of normal-weight central obesity with all-cause and cause-specific mortality among postmenopausal women. JAMA Netw Open. 2019;2(7):e197337. doi:10.1001/jamanetworkopen.2019.7337
67. Vaz M, Jennings G, Turner A, Cox H, Lambert G, Esler M. Regional sympathetic nervous activity and oxygen consumption in obese normotensive human subjects. Circulation. 1997;96(10):3423–3429. doi:10.1161/01.CIR.96.10.3423
68. Grassi G, Seravalle G, Cattaneo B, et al. Sympathetic activation in obese normotensive subjects. Hypertension. 1995;25:560–563. doi:10.1161/01.HYP.25.4.560
69. Hall JE, Do Carmo JM, Da silva AA, Wang Z, Hall ME. Obesity-induced hypertension: interaction of neurohumoral and renal mechanisms. Circ Res. 2015;116(6):991–1006. doi:10.1161/CIRCRESAHA.116.305697
70. Mark AL. Selective leptin resistance revisited. Am J Physiol Regul. 2013;305(6):R566–R581. doi:10.1152/ajpregu.00180.2013
71. Yiannikouris F, Gupte M, Putnam K, Cassis L. Adipokines and blood pressure control. Curr Opin Nephrol Hypertens. 2010;19(2):195–200. doi:10.1097/MNH.0b013e3283366cd0
72. Grassi G, Seravalle G, Colombo M, et al. Body weight reduction, sympathetic nerve traffic, and arterial baroreflex in obese normotensive humans. Circulation. 1998;97(20):2037–2042. doi:10.1161/01.CIR.97.20.2037
73. DeFronzo RA. Insulin and renal sodium handling: clinical implications. Int J Obes. 1981;5(suppl 1):93–104.
 © 2021 The Author(s). This work is published and licensed by Dove Medical Press Limited. The full terms of this license are available at https://www.dovepress.com/terms.php and incorporate the Creative Commons Attribution - Non Commercial (unported, v3.0) License.
By accessing the work you hereby accept the Terms. Non-commercial uses of the work are permitted without any further permission from Dove Medical Press Limited, provided the work is properly attributed. For permission for commercial use of this work, please see paragraphs 4.2 and 5 of our Terms.
© 2021 The Author(s). This work is published and licensed by Dove Medical Press Limited. The full terms of this license are available at https://www.dovepress.com/terms.php and incorporate the Creative Commons Attribution - Non Commercial (unported, v3.0) License.
By accessing the work you hereby accept the Terms. Non-commercial uses of the work are permitted without any further permission from Dove Medical Press Limited, provided the work is properly attributed. For permission for commercial use of this work, please see paragraphs 4.2 and 5 of our Terms.