")
Back to Journals » International Journal of General Medicine » Volume 13
Contrast-Enhanced Ultrasound Assessment of Renal Parenchymal Perfusion in Patients with Atherosclerotic Renal Artery Stenosis to Predict Renal Function Improvement After Revascularization
Authors Wang X, Wang S, Pang Y, Jiang T, Yu C, Li Y, Shi B
Received 21 November 2020
Accepted for publication 15 December 2020
Published 31 December 2020 Volume 2020:13 Pages 1713—1721
DOI https://doi.org/10.2147/IJGM.S293316
Checked for plagiarism Yes
Review by Single anonymous peer review
Peer reviewer comments 2
Editor who approved publication: Dr Scott Fraser
Xiuyan Wang,1 Shuo Wang,1 Yan-ping Pang,1 Tian Jiang,1 Chen Yu,2 Yuan Li,1 Baomin Shi3
1Department of Ultrasonography, Tongji Hospital of Tongji University, Shanghai, People’s Republic of China; 2Department of Nephrology, Tongji Hospital of Tongji University, Shanghai, People’s Republic of China; 3Department of General Surgery, Tongji Hospital of Tongji University, Shanghai, People’s Republic of China
Correspondence: Baomin Shi
Department of General Surgery, Tongji Hospital of Tongji University, No. 389, Xincun Road, Putuo District, Shanghai 200065, People’s Republic of China
Tel + 86-15002199639
Email [email protected]
Yuan Li
Department of Ultrasonography, Tongji Hospital of Tongji University, No. 389 Xincun Road, Putuo District, Shanghai 200065, People’s Republic of China
Tel + 86- 13918249006
Email [email protected]
Background: Identifying patients with atherosclerotic renal artery stenosis (ARAS) who will be improved in renal function after percutaneous transluminal renal artery stenting (PTRAS) is crucial since most patients show no worthwhile benefit of PTRAS. Although the assessment of renal parenchymal perfusion is useful for the identification, few studies predict the renal functional improvement by evaluating the characteristics of renal perfusion.
Objective: The aim of this study was to assess the renal parenchymal perfusion in ARAS patients with contrast-enhanced ultrasonography (CEUS) and predict the benefits of renal function after PTRAS utilizing time-intensity curve (TIC) parameters.
Methods: Thirty-eight kidneys in 30 ARAS patients received PTRAS in this study. They were divided into moderate stenosis group (n=25) and severe stenosis group (n=13) and mild dysfunction group (n=14) and moderate dysfunction group (n=24) according to the degree of renal stenosis and radioisotope glomerular filtration rate (rGFR). The baseline assessment of renal function and renal parenchymal perfusion were performed for all patients. rGFR was repeated to evaluate the renal outcome at 4 months after PTRAS. The outcome of PTRAS was classified as improved, stable, or deteriorated compared to the baseline. Time-intensity curve (TIC) parameters obtained from CEUS were analyzed to evaluate the predictive accuracy.
Results: TIC parameters (AUC and PI) were positively correlated with renal function (r=0.617, 0.663; P< 0.05) but weakly and negatively correlated with the stenosis (r=− 0.360, − 0.435; P< 0.05). Baseline rGFR was not accurate in predicting improved renal function after PTRAS (0.670). The accuracy of the combined prediction model of baseline AUC and PI (0.889) was higher than the individual indicators (baseline AUC: 0.855 and PI: 0.782).
Conclusion: CEUS could accurately assess renal parenchymal perfusion and identify ARAS patients with potential benefit after PTRAS. The combination of TIC parameters (AUC and PI) is valuable in the prediction of improved renal function after PTRAS.
Keywords: atherosclerotic renal artery stenosis, percutaneous transluminal renal artery stenting, renal parenchymal perfusion, contrast-enhanced ultrasonography, time-intensity curve, radioisotope glomerular filtration rate
Introduction
The prevalence of atherosclerotic renal artery stenosis (ARAS) is as high as 20% among people with diabetes and secondary hypertension.1 ARAS may result in renovascular hypertension and ischemic nephropathy, both of which are important causes of end-stage renal disease.2 Percutaneous transluminal renal artery stenting (PTRAS) is becoming a preferred treatment for ARAS to correct renal hemodynamic disorders due to its advantages in trauma and safety.3 It is beneficial to the degrading of hypertension, improving renal function, or slowing down the deterioration of renal function. However, large-scale randomized controlled clinical trials such as ASTRAL and CORAL have shown no worthwhile benefit of PTRAS for patients with moderate to severe stenosis (stenosis of at least 60%).4,5 The outcome of renal function after revascularization is diverse.6,7 It is recognized that only about 20–30% of patients with moderate to severe ARAS show improved renal function after PTRAS.8,9 Therefore, identifying patients with improved outcome can help reduce inappropriate and potentially harmful interventions.10,11
Because more than 50% of ARAS patients present renal cortical ischemia, the assessment of renal parenchymal perfusion is a useful supplement to evaluate the degree of renal ischemia, identify patients with potential benefits after PTRAS, and guide the treatment of ARAS.12,13 Cheung et al14 utilized MRI to identify kidneys with hibernating parenchyma and help predict the outcome of renal function after PTRAS. Compared with MRI, contrast-enhanced ultrasonography (CEUS) does not require the administration of a gadolinium-based contrast agent, and is capable of assessing the degree of ARAS and renal parenchymal perfusion simultaneously. The changes of CEUS parameters are not only earlier than laboratory indicators but also reveal the abnormal perfusion of renal parenchyma in the early stage.15 However, few studies on predicting the improvement of renal function after PTRAS by evaluating the characteristics of renal parenchymal perfusion in ARAS patients.
The purpose of this study was to assess the renal parenchymal perfusion of the affected kidney in ARAS patients and predict the benefits of renal function after PTRAS utilizing time-intensity curve (TIC) parameters.
Patients and Methods
Patient Recruitment
This prospective cohort study was approved by the ethics committee of Tongji Hospital of Tongji University (K-W-2019-008). Written informed consents were obtained from all participants prior to inclusion. This study was conducted in accordance with the declaration of Helsinki.
Thirty-two patients with refractory hypertension combined with unexplained renal dysfunction and diagnosed with ARAS were screened for enrollment from Jun 2017 to May 2020. The definition of ARAS was: (1) at least one risk factor for atherosclerosis (diabetes, hyperlipidemia, age > 40 years, smoking);16 (2) at least 2 imaging findings suggesting atherosclerosis (cone-shaped renal artery stenosis or occlusion; eccentric stenosis; irregular plaque; calcification; stenosis involving the origin or proximal segment of the renal artery; imaging findings of atherosclerosis in other abdominal vessels).17
The inclusion criteria for enrolled patients were as follows: (1) age 40–75 years; (2) moderate to severe stenosis by CT angiography or digital subtraction angiography (moderate: 50%–69%; severe: 70%-99%); (3) systolic blood pressure of at least 180 mmHg and/or diastolic blood pressure of at least 110 mmHg without antihypertensive medications, or uncontrolled hypertension with 3 antihypertensive medications including diuretics; (4) diameter of at least 7.0 cm of the affected kidney. The exclusion criteria were as follows: (1) estimated glomerular filtration rate (eGFR) < 30 mL/(min·1.73 m2) [eGFR= 186× serum creatinine (mg/dl)−1.154 × age−0.203×0.742 (if female) ×1.233 (if Chinese)];18 (2) patients with contraindications for renal revascularization; (3) patients with severe cardiovascular, cerebrovascular, and pulmonary diseases; (4) patients undergone previous revascularization for renal artery stenosis (5) patients with unclear ultrasound images or hypersensitivity to ultrasound contrast agents.
There were 26 patients with unilateral renal artery stenosis and 6 patients with bilateral renal artery stenosis. Hence, 38 kidneys needed to be revascularized in this study. According to the degree of renal artery stenosis, 38 kidneys were divided into moderate stenosis group (n=25) and severe stenosis group (n=13). Besides, 30 patients with clinical suspicion of an atherosclerotic renovascular disease but without evidence of ARAS and renal dysfunction were enrolled as the control group. The demographic and clinical characteristics of all subjects including age, gender, history of smoking, course of hypertension, type of antihypertensives, diabetes, hyperlipidemia, heart rate, body mass index (BMI), systolic pressure, diastolic pressure, serum creatinine (Scr), and eGFR were recorded.
Assessment of radioisotope glomerular filtration rate (rGFR)
All patients underwent baseline assessment of renal function using Philips Precedence SPECT/CT camera (Philips Healthcare, Guildford, United Kingdom). The assessments were performed by 2 radiologists with more than 10 years’ experience in SPECT. After accurately measuring the height and weight of each patient, a bolus injection of 99mTc-DTPA 185MBp was performed. Renal dynamic blood flow and functional imaging were conducted within 20–30 minutes. rGFR of each kidney was measured by the Gate’s method.19 According to the rGFR, 38 kidneys were divided into mild dysfunction group (35 mL/min > rGFR ≥ 25 mL/min, n=14) and moderate dysfunction group (25 mL/min > rGFR ≥ 15 mL/min, n=24). At 4 months after renal revascularization, rGFR was repeated to evaluate the outcome of renal function. The outcome was classified as improved, stable, or deteriorated according to the following thresholds compared to the baseline (improved: rGFR increased by > 15%; deteriorated: rGFR decreased by > 15%; stable: changes between the improved and deteriorated).
Renal Parenchymal Perfusion by CEUS
The renal parenchymal perfusion was performed using a MyLab Twice ultrasound system (Esaote, Genova, Italy) by 2 sonographers with more than 10 years’ experience in ultrasound. The ultrasound was oriented at the largest section of kidneys with the patient in the lateral decubitus position. CEUS was performed after the injection of 1.2 mL of the ultrasound contrast agent (SonoVue, Bracco, Italy) followed by 5 mL flush of 0.9% sodium chloride solution. The sonographer continuously observed the contrast process of the renal parenchyma in real-time for 3 min until the enhancement intensity was weakened to near the pre-test level. TIC quantitative analysis began to run after two regions of interest (ROI) on each image (reference ROI and analysis ROI) were set (Figure 1). The CEUS quantitative data, including rise time (RT), peak intensity (PI), time to peak (TTP), mean transit time (mTT), and area under the curve (AUC) were obtained. In order to reduce bias, the analysis was repeated twice to calculate the average value.
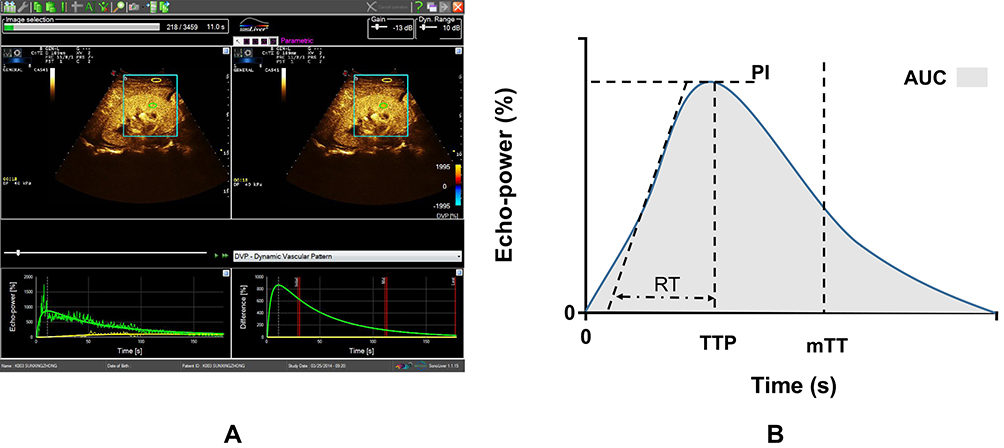 |
Figure 1 Representative TIC (A) and schematic diagram (B) of renal parenchymal perfusion. The CEUS quantitative data were derived from the TIC, including RT, PI, TTP, mTT, and AUC. Abbreviations: TIC, time-intensity curve; CEUS, contrast-enhanced ultrasonography; RT, rise time; PI, peak intensity; TTP, time to peak; mTT, mean transit time; AUC, area under the curve. |
Statistical Analysis
Statistical analyses were performed using statistical product and service solutions (version 22.0; SPSS Inc., Chicago, IL, USA) and MedCalc (Version 22.0.1; MedCalc Software, Ostend, Belgium). The numerical data were expressed as mean ± standard deviations for normally distributed variables and as median (interquartile range) for non-normally distributed variables. Independent sample t-test, paired-samples t-test, one-way ANOVA and a post hoc Student-Newman-Keuls test, and Mann–Whitney U-test were used for comparison. The categorical variables were expressed as number (percentage) and the comparison was performed by the chi-square test. The correlations of CEUS parameters with renal artery stenosis and rGFR were analyzed with Pearson correlations. Receiver-operating characteristic (ROC) curve was established and the area under the ROC curve was used to evaluate the predictive accuracy for the renal functional outcome after PTRAS, and a multi-indicator combined prediction model was established with Logistic regression.
Results
Demographic and Clinical Characteristics of All Subjects
The demographic and clinical characteristics of all subjects are shown in Table 1. ARAS patients had lower eGFR and higher Scr compared with the control patients. No differences in other characteristics were observed (P > 0.05).
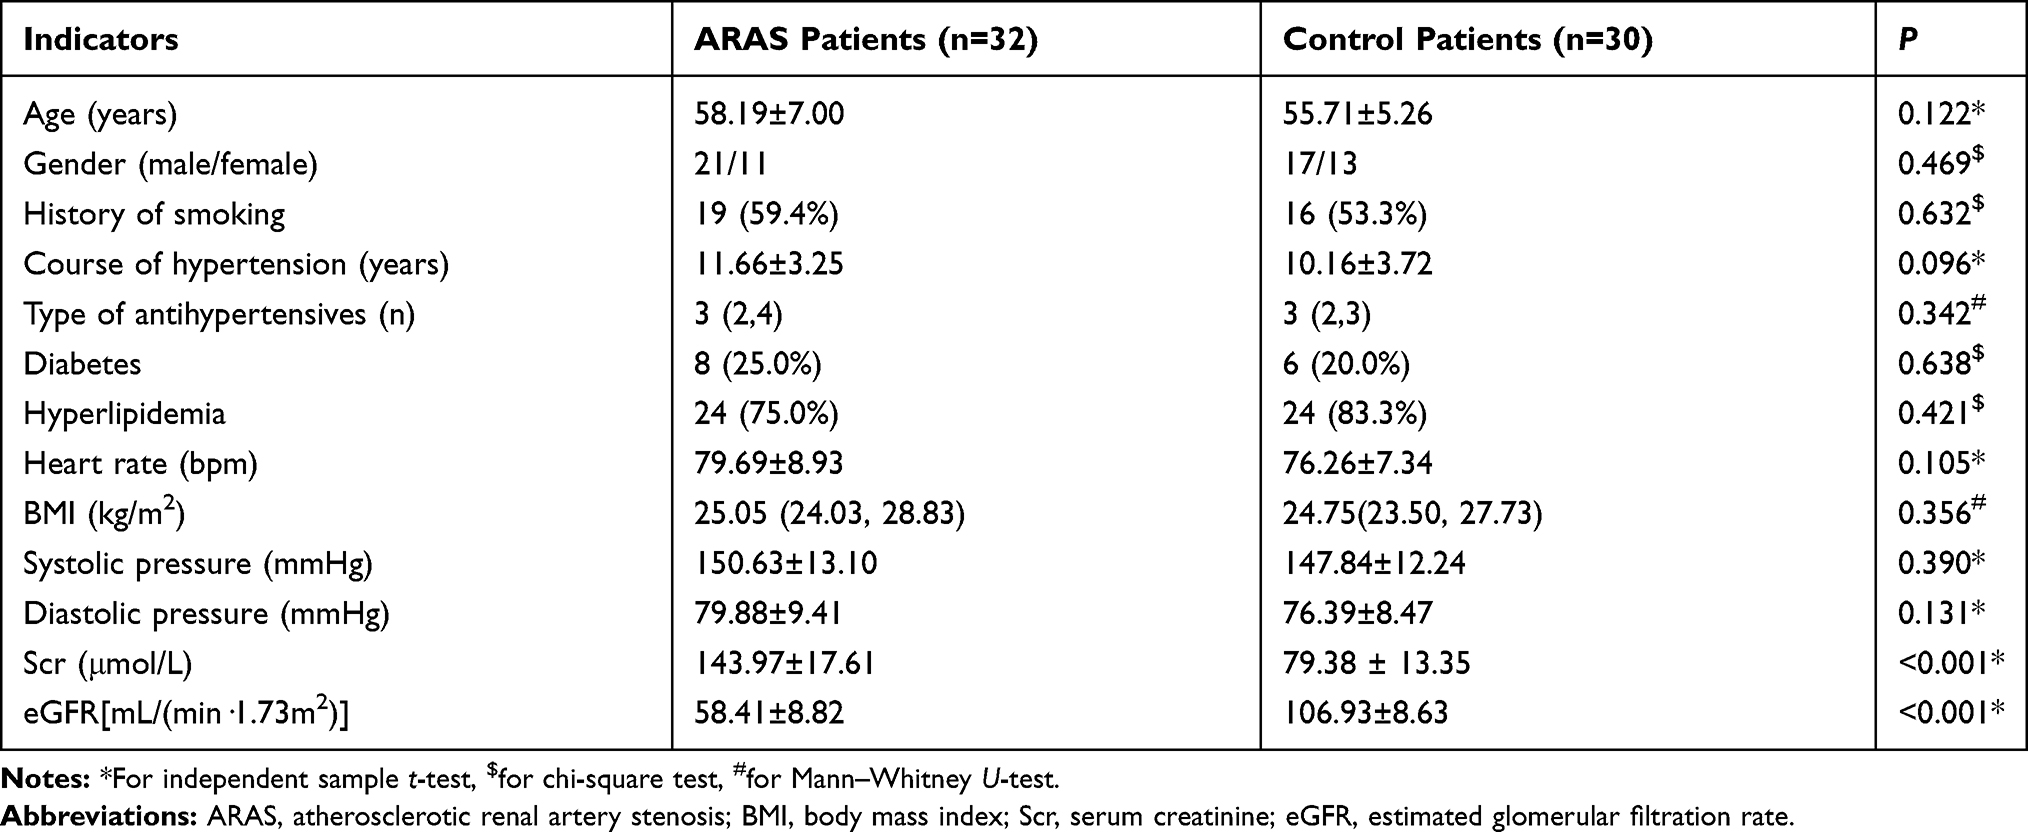 |
Table 1 Demographic and Clinical Characteristics of ARAS and Control Patients |
Renal Parenchymal Perfusion in Different Degrees of Renal Artery Stenosis
None of the subjects had adverse reactions to contrast medium. Figure 2 shows the typical TIC features in control, moderate stenosis, and severe stenosis groups. Each curve clearly showed ascending slope, peak, and descending slope. The TIC of the control group showed a steep ascending slope, and then gradually descended to the baseline level. Among the three groups, the largest AUC and PI were present in the control group, and the AUC and PI of the moderate stenosis group were slightly larger than that of the severe stenosis group. Quantitative analysis of the TIC parameters (Table 2) showed that the AUC and PI of the moderate and severe stenosis groups were smaller than the control group (P < 0.05). There is no difference in all TIC parameters between the moderate and severe stenosis groups (P > 0.05).
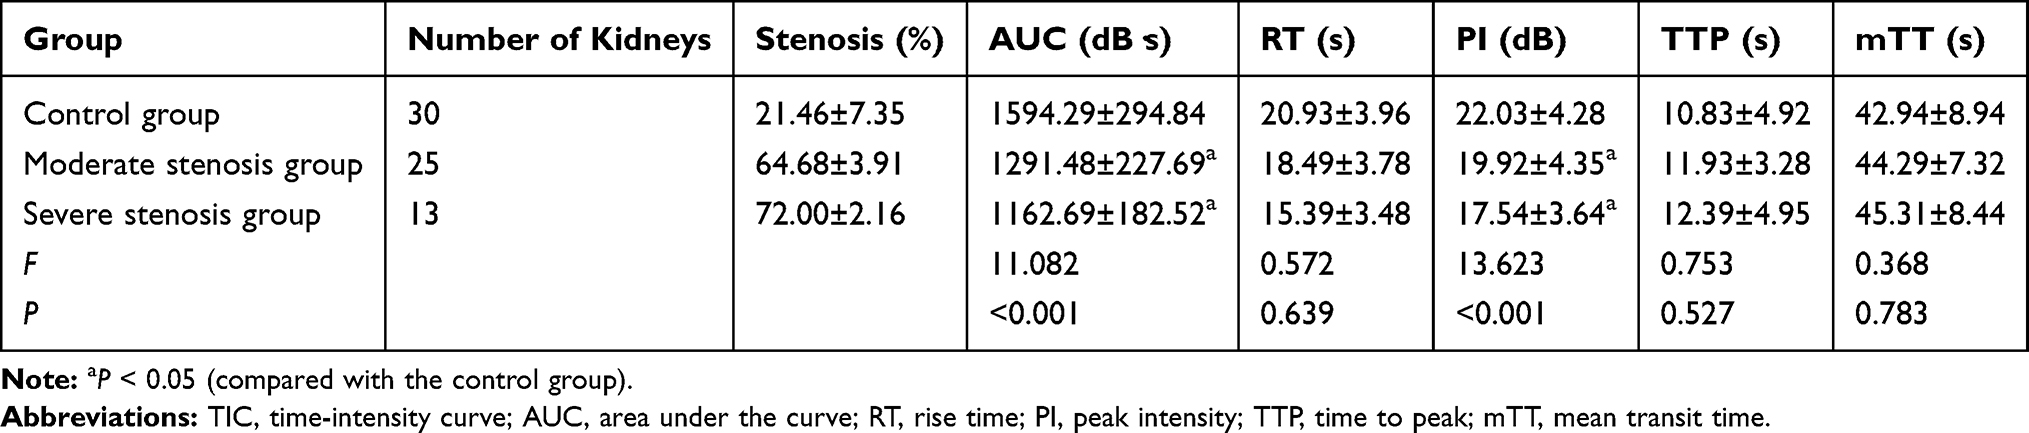 |
Table 2 Comparison of TIC Parameters Among the Moderate and Severe Stenosis Group and the Control Group |
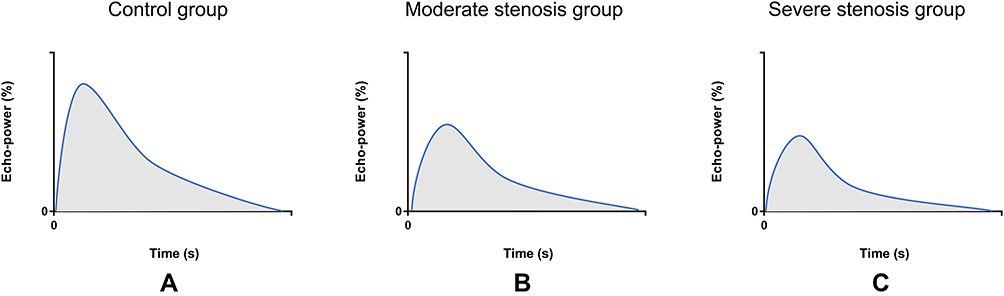 |
Figure 2 Changes of TIC schematic diagrams in different degrees of renal arterial stenosis (A–C). The largest AUC and PI were present in the control group (A), and the AUC and PI of the moderate stenosis group (B) were slightly larger than those of the severe stenosis group (C). Other parameters (RT, TTP, and mTT) are similar among the three groups. Abbreviations: TIC, time-intensity curve; CEUS, contrast-enhanced ultrasonography; AUC, area under the curve; RT, rise time; PI, peak intensity; TTP, time to peak; mTT, mean transit time. |
Renal Parenchymal Perfusion in Different Degrees of Renal Dysfunction
The typical TIC features in mild and moderate dysfunction groups are shown in Figure 3. Compared with the control group, the AUC and PI of the mild and moderate dysfunction groups were smaller, and the changes of AUC and PI became more obvious as the renal dysfunction worsened. The quantitative analysis of the TIC parameters in different degrees of renal dysfunction is shown in Table 3. The AUC and PI of the mild and moderate dysfunction groups were smaller than the control group (P < 0.05), and the AUC and PI of the moderate dysfunction group were smaller compared with the mild dysfunction group (P < 0.05).
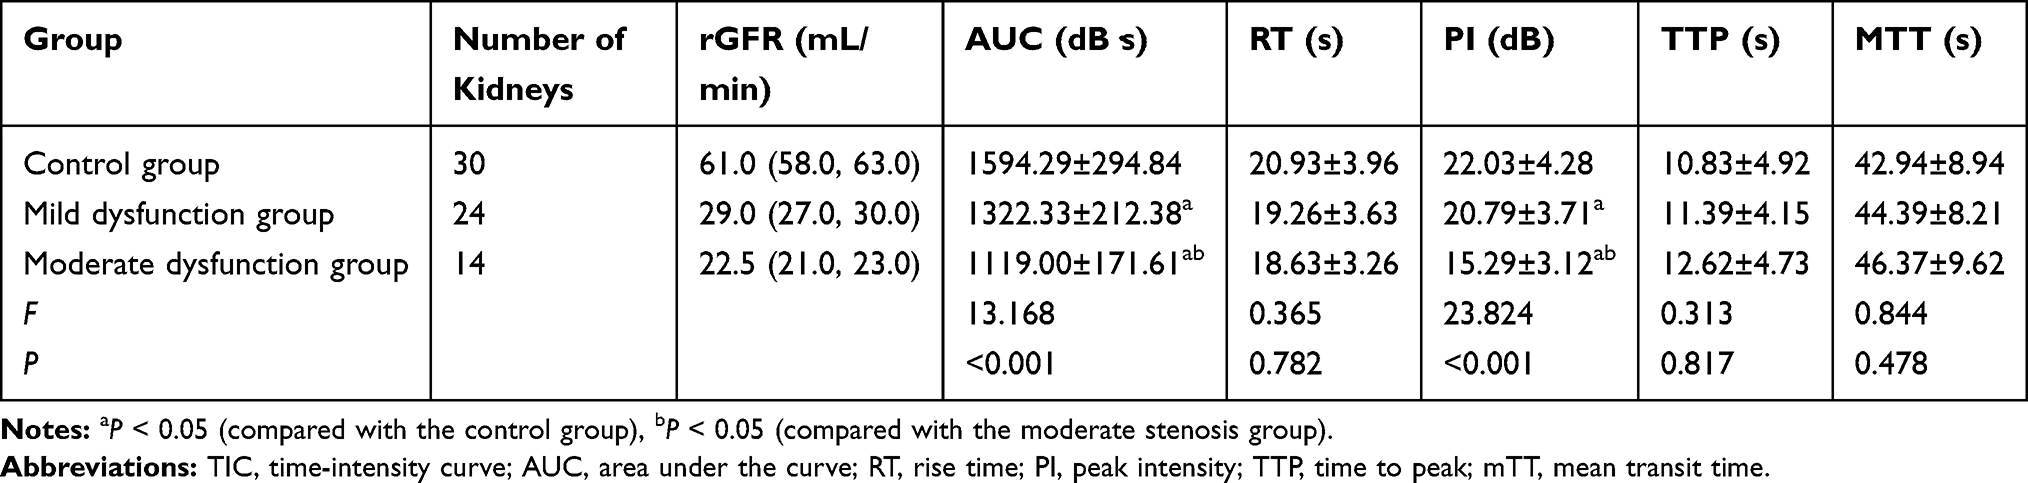 |
Table 3 Comparison of TIC Parameters Between the Mild and Moderate Dysfunction Group and the Control Group |
 |
Figure 3 Changes of TIC schematic diagrams in different degrees of renal dysfunction (A–C). The largest AUC and PI were present in the control group (A), and the AUC and PI of the mild dysfunction group (B) were larger than the moderate dysfunction group (C). Other parameters (RT, TTP, and mTT) are similar among the three groups. Abbreviations: TIC, time-intensity curve; CEUS, contrast-enhanced ultrasonography; AUC, area under the curve; RT, rise time; PI, peak intensity; TTP, time to peak; mTT, mean transit time. |
Correlation of TIC Parameters (AUC and PI) with Renal Artery Stenosis and Renal Function
Correlation analysis showed that the TIC parameters (AUC and PI) were positively correlated with renal function (r=0.617, 0.663; P<0.05), but weakly and negatively correlated with the stenosis (r=−0.360, −0.435; P<0.05) (Figure 4). rGFR and renal artery stenosis also showed a weak negative correlation (r=−0.423; P<0.05).
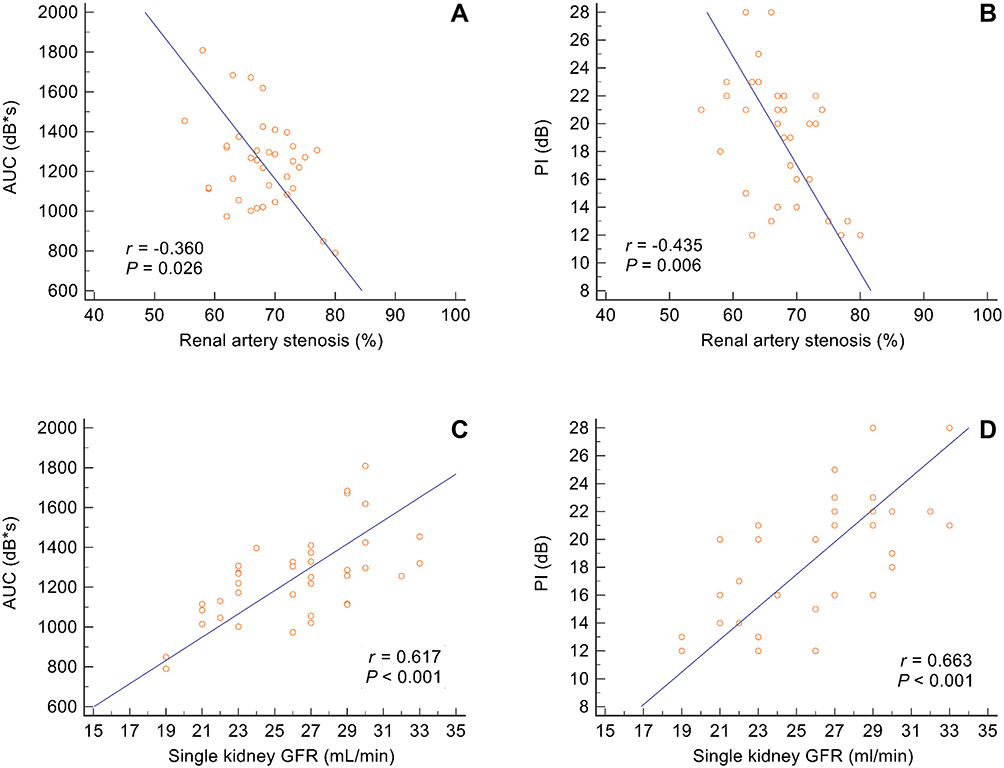 |
Figure 4 Correlation analysis of TIC parameters (AUC and PI) with different degrees of renal artery stenosis and rGFR. (A) and (B) shows the association between TIC parameters and renal artery stenosis. (C) and (D) shows the association between TIC parameters and rGFR of affected kidneys. Abbreviations: TIC, time-intensity curve; AUC, area under the curve; PI, peak intensity. |
Outcome of Blood Pressure and Renal Function After PTRAS
All operations were successfully completed and a total of 38 renal artery stents were implanted. The postoperative systolic pressure was lower than that before operation, and the difference was statistically significant (preoperative systolic pressure: 150.63±13.10 mmHg vs postoperative systolic pressure: 138.29±8.23 mmHg, P < 0.001; preoperative diastolic pressure: 79.88±9.41 mmHg vs postoperative diastolic pressure: 74.26±7.25 mmHg, P > 0.05, paired-samples t-test). The types of antihypertensive agents declined significantly compared preoperatively (3 (2,4) vs 2 (1, 2), P < 0.001, Mann–Whitney U-test). The postoperative eGFR [63.27±7.23 mL/(min*1.73m2)] was higher than the baseline [58.41±8.82 mL/(min*1.73m2)], but the difference was not statistically significant (P > 0.05, paired-samples t-test). The average change in rGFR of 38 stented kidneys from baseline to 4 months after surgery was 1.26±11.36 mL/min. Ten kidneys (26.3%) improved [changes of rGFR: 5.5 (4.5, 7.0) mL/min], 22 kidneys (57.9%) remained stable [1.5 (−2.5, 2.0) mL/min], and 6 kidneys (15.8%) deteriorated [−5.0 (−4.5, −6.5) mL/min] after surgery.
Predictive Accuracy for the Renal Functional Outcome After PTRAS
The accuracy of baseline rGFR was 0.670 in predicting improved renal function following PTRAS. Compared with the baseline rGFR, the accuracy of baseline AUC (0.855) and PI (0.782) were higher (P < 0.05). The combination of PI, AUC and rGFR was not accurate (0.807) due to the influence of rGFR. Hence, the accuracy of the combined prediction model only included baseline AUC and PI (0.889) was the highest, with a sensitivity and specificity of 100% and 75%, respectively (Figure 5). The fitting equation was Logit (P) =14.861–0.011 * baseline AUC - 0.197 * baseline PI.
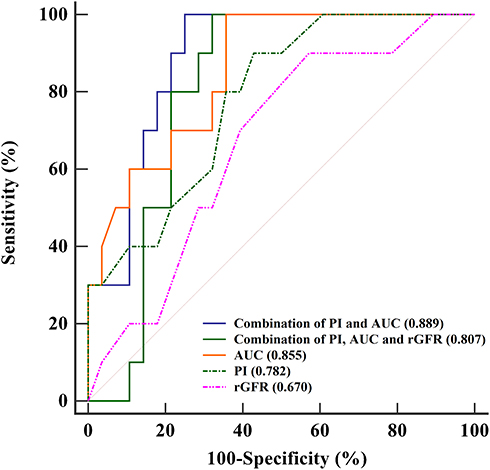 |
Figure 5 ROC curves of baseline rGFR, AUC, PI, the combination of baseline AUC and PI, and the combination of PI, AUC and rGFR in predicting improved renal function following PTRAS. Blue line represents the combination of AUC and PI (0.889). Green line represents the combination of PI, AUC and rGFR (0.807). Orange line represents baseline AUC (0.855). Green dashed line represents baseline PI (0.782). Pink dashed line represents baseline rGFR (0.670). Abbreviations: ROC, receiver-operating characteristics; AUC, area under the curve; PI, peak intensity; rGFR, radioisotope glomerular filtration rate; PTRAS, percutaneous transluminal renal artery stenting. |
Discussion
The present study revealed that renal parenchymal perfusion was closely associated with the renal function of the affected kidney but weakly associated with the renal artery stenosis in ARAS patients. TIC parameters (AUC and PI) were useful in the assessment of renal parenchymal perfusion in different degrees of renal dysfunction. ROC analyses indicated that compared with baseline rGFR, baseline AUC and PI were helpful and sensitive for the prediction of improved renal function following PTRAS. Their combination was more accurate than the individual indicators and could be useful for identifying patients with potential benefits after PTRAS.
Although PTRAS can effectively reduce blood pressure and improve ischemic renal function, clinical trial data do not support that renal revascularization is more beneficial to patients than drug therapy.4,5 Our study indicated that only 26.3% of kidneys with renal artery stenosis obtained improved renal function after PTRAS, which is in line with the study of Chrysochou et al20 that has reported on renal functional response. Weinberg et al21 believe that defects in the selection of indications may be an important reason for the inaccurate results of clinical trials. SCAI expert consensus statement further regulates the surgical indications of PTRAS, among which ischemic nephropathy with progressive renal function decline is one of the main indications.22
Since the compensation of contralateral kidney, the Scr or eGFR in patients with unilateral renal artery stenosis is often in the normal range. Therefore, objective and accurate evaluations are needed to assess the renal ischemia caused by renal artery stenosis. The rGFR of affected kidneys can indicate decreased renal function, but the degree of renal artery stenosis and decreased renal function are not matched.23 In our study, the baseline rGFR of the affected kidney was weakly correlated with the stenosis. Dong et al24 also found that there was no significant correlation between the changes in GFR and the degree of renal artery stenosis. Moreover, many factors affect the changes in GFR (such as hypertension, nephritis or nephropathy, etc.), which cannot fully indicate the outcome of renal function after PTRAS. It is recognized that renal parenchymal blood flow accounts for about 90% of the entire kidney blood flow. The measurement of renal parenchymal perfusion utilizing CEUS can evaluate the blood supply of the entire kidney, thereby assessing renal dysfunction caused by renal artery stenosis. Our study found that the TIC parameters (AUC and PI) of CEUS was closely associated with the renal function of affected kidneys, which indicated that they were useful in the assessment of renal parenchymal perfusion in different degrees of renal dysfunction.
In this study, after 4 months of PTRAS, the blood pressure of ARAS patients was lower than the baseline, which is consistent with the results of previous studies.25 The rGFR of 10 kidneys was improved compared with the baseline, which indicated restored renal blood flow and improved renal function. However, there were 22 kidneys remained stable and 6 kidneys deteriorated. It implied that the outcome of PTRAS depended on different degrees of preoperative renal ischemia.
One hypothesis to explain these differences may be that there is “hibernating parenchyma” in those kidneys with improved outcomes after PTRAS.20,26 The “hibernating parenchyma” means that after the compensating capacity of the kidney gradually decreases, part of the glomerular function will be in a dormant state to maintain the blood supply of the medulla. The renal microvasculature remodeling and damage may temporarily or permanently deteriorate renal blood flow, glomerular filtration capacity and renal tubular function, which may be the starting point of RAS.27–29 Since no irreversible structural changes have occurred, the return of blood flow to the ischaemic tissue after the stenosis corrected can help improve renal function. Onuigbo et al30 also reported that in patients with hemodynamically significant renal artery stenosis who present with acutely worsening renal failure, PTRAS was more likely than not to produce both renal and cardiovascular benefits. The ROC curves in this study revealed that the TIC parameters (AUC and PI) could help identify the kidneys with “hibernating parenchyma” in ARAS patients which were still salvageable with PTRAS. The combined model based on baseline AUC and PI was more accurate in the prediction of renal functional improvement than the individual indicators. In the clinical setting, physicians can calculate the probability of improved outcome using the combined model and perform the subsequent treatment.
The primary limitation of this study is the limited patient numbers. This leads to a lack of kidneys with irreversible structural changes in our study. Although in theory, PTRAS may not be beneficial to restore the renal function of this type of kidney, it still needs to be verified by increasing cases. Although CEUS provided us with a safe method to evaluate renal perfusion, it still faces the limitation of measurement errors caused by factors such as obesity and poor breathing coordination. It is particularly obvious in the diagnosis of renal artery stenosis due to the attenuation of acoustic energy and the limitation of angle adjustment. Besides, we did not evaluate whether renal functional improvement after PTRAS translated into a survival benefit. Nonetheless, the results of this study do inform us that renal parenchymal TIC has potential clinical uses in the future.
In conclusion, the TIC parameters (AUC and PI) were closely associated with the renal function in ARAS patients. Their combination is valuable in the prediction of renal functional improvement after PTRAS. Our study strongly demonstrated that CEUS could accurately assess renal parenchymal perfusion and identify ARAS patients with potential benefit after PTRAS.
Ethical Approval
Ethical approval for the study was obtained from the ethics committee of Tongji Hospital of Tongji University (K-W-2019-008).
Informed Consent
Written informed consent was obtained from all patients.
Acknowledgments
The authors wish to thank all the study participants, research staff and students who participated in this work.
Author Contributions
Xiu-yan Wang and Shuo Wang contributed equally to this study and are co-first authors.
Study design: Xiu-yan Wang, Shuo Wang, Yuan Li and Bao-min Shi.
Data collection and analysis: Xiu-yan Wang, Shuo Wang, Yan-ping Pang, Chen Yu, and Tian Jiang.
Supervision: Yuan Li and Bao-min Shi.
Statistics: Yan-ping Pang, Tian Jiang, Chen Yu, and Yuan Li.
Manuscript writing: Xiu-yan Wang, Shuo Wang, Yan-ping Pang, Tian Jiang, Chen Yu, Yuan Li, and Bao-min Shi.
Manuscript revision: Xiu-yan Wang, Shuo Wang, Yuan Li, and Bao-min Shi
Approval of the manuscript: all authors.
All authors made substantial contributions to conception and design, acquisition of data, or analysis and interpretation of data; took part in drafting the article or revising it critically for important intellectual content; agreed to submit to the current journal; gave final approval of the version to be published; and agree to be accountable for all aspects of the work.
Funding
National Natural Science Foundation of China (NO. 81873609).
Disclosure
The authors declare that they have no conflict of interest.
References
1. Hackam DG, Wu F, Li P, et al. Statins and renovascular disease in the elderly: a population-based cohort study. Eur Heart J. 2011;32(5):598–610. doi:10.1093/eurheartj/ehq452
2. Covic A, Gusbeth-Tatomir P. The Role of the Renin-Angiotensin-Aldosterone System in Renal Artery Stenosis, Renovascular Hypertension, and Ischemic Nephropathy: diagnostic Implications. Prog Cardiovasc Dis. 2009;52(3):204–208. doi:10.1016/j.pcad.2009.09.005
3. Marini M, Fernandez-Rivera C, Cao I, et al. Treatment of transplant renal artery stenosis by percutaneous transluminal angioplasty and/or stenting: study in 63 patients in a single institution. Transplant Proc. 2011;43(6):2205–2207. doi:10.1016/j.transproceed.2011.06.049
4. Wheatley K, Ives N, Gray R, et al. Revascularization versus medical therapy for renal-artery stenosis. N Engl J Med. 2009;361(20):1953–1962. doi:10.1056/NEJMoa0905368
5. Cooper CJ, Murphy TP, Cutlip DE, et al. Stenting and medical therapy for atherosclerotic renal-artery stenosis. N Engl J Med. 2014;370(1):13–22. doi:10.1056/NEJMoa1310753
6. Cheung CM, Wright JR, Shurrab AE, et al. Epidemiology of renal dysfunction and patient outcome in atherosclerotic renal artery occlusion.. J Am Soc Nephrol. 2002;13(1):149–157.
7. Wright JR, Duggal A, Thomas R, et al. Clinicopathological correlation in biopsy-proven atherosclerotic nephropathy: implications for renal functional outcome in atherosclerotic renovascular disease. Nephrol Dial Transplant. 2001;16(4):765–770. doi:10.1093/ndt/16.4.765
8. Kalra PA, Chrysochou C, Green D, et al. The benefit of renal artery stenting in patients with atheromatous renovascular disease and advanced chronic kidney disease.. Catheter Cardiovasc Interv. 2010;75(1):1–10. doi:10.1002/ccd.22290
9. Tanemoto M, Takeuchi Y, Mishima E, et al. Stage of chronic kidney disease is an outcome-predicting factor of angioplasty for atheromatous renal artery stenosis. Hypertens Res. 2010;33(11):1206–1210. doi:10.1038/hr.2010.152
10. Mishima E, Suzuki T, Ito S. Selection of Patients for Angioplasty for Treatment of Atherosclerotic Renovascular Disease: predicting Responsive Patients. Am J Hypertens. 2020;33(5):391–401. doi:10.1093/ajh/hpaa016
11. Iwashima Y, Ishimitsu T. How should we define appropriate patients for percutaneous transluminal renal angioplasty treatment? Hypertens Res. 2020;43(10):1015–1027. doi:10.1038/s41440-020-0496-z
12. Adani GL, Como G, Bonato F, et al. Detection of transplant renal artery stenosis with contrast-enhanced ultrasound. Radiol Case Rep. 2018;13(4):890–894. doi:10.1016/j.radcr.2018.06.003
13. Fan M, Ni X, Li Y, et al. Assessment of transplant renal artery stenosis with diffusion-weighted imaging: A preliminary study. Magn Reson Imaging. 2019;60:157–163. doi:10.1016/j.mri.2019.05.007
14. Cheung CM, Chrysochou C, Shurrab AE, et al. Effects of renal volume and single-kidney glomerular filtration rate on renal functional outcome in atherosclerotic renal artery stenosis. Nephrol Dial Transplant. 2010;25(4):1133–1140. doi:10.1093/ndt/gfp623
15. Wang L, Wu J, Cheng J-F, et al. Diagnostic value of quantitative contrast-enhanced ultrasound (CEUS) for early detection of renal hyperperfusion in diabetic kidney disease. J Nephrol. 2015;28(6):669–678. doi:10.1007/s40620-015-0183-3
16. Chrysochou C, Kalra PA. Epidemiology and Natural History of Atherosclerotic Renovascular Disease. Prog Cardiovasc Dis. 2009;52(3):184–195. doi:10.1016/j.pcad.2009.09.001
17. Bookstein JJ, et al. Radiologic aspects of renovascular hypertension. 3. Appraisal of arteriography. JAMA. 1972;221(4):368–374. doi:10.1001/jama.1972.03200170016004
18. Ma Y-C, Zuo L, Chen J-H, et al. Modified glomerular filtration rate estimating equation for Chinese patients with chronic kidney disease. J Am Soc Nephrol. 2006;17(10):2937–2944. doi:10.1681/asn.2006040368
19. Gates GF. Glomerular filtration rate: estimation from fractional renal accumulation of 99mTc-DTPA (stannous). AJR Am J Roentgenol. 1982;138(3):565–570. doi:10.2214/ajr.138.3.565
20. Chrysochou C, Green D, Ritchie J, et al. Kidney volume to GFR ratio predicts functional improvement after revascularization in atheromatous renal artery stenosis. PLoS One. 2017;12(6):e0177178. doi:10.1371/journal.pone.0177178
21. Weinberg MD, Olin JW. Stenting for atherosclerotic renal artery stenosis: one poorly designed trial after another. Cleve Clin J Med. 2010;77(3):164–171. doi:10.3949/ccjm.77a.10001
22. Parikh SA, Shishehbor MH, Gray BH, et al. SCAI expert consensus statement for renal artery stenting appropriate use. Catheter Cardiovasc Interv. 2014;84(7):1163–1171. doi:10.1002/ccd.25559
23. Safian RD, Textor SC. Renal-artery stenosis. N Engl J Med. 2001;344(6):431–442. doi:10.1056/nejm200102083440607
24. Dong Y-J, Huang C, Luo D-M, et al. Decrease of glomerular filtration rate may be attributed to the microcirculation damage in renal artery stenosis. Chin Med J. 2015;128(6):750–754. doi:10.4103/0366-6999.152483
25. Ronden RA, Houben AJ, Kessels AG, et al. Predictors of clinical outcome after stent placement in atherosclerotic renal artery stenosis: a systematic review and meta-analysis of prospective studies.. J Hypertens. 2010;28(12):2370–2377. doi:10.1097/HJH.0b013e32833ec392
26. Vassallo D, Kalra PA. Progress in the treatment of atherosclerotic renovascular disease: the conceptual journey and the unanswered questions. Nephrol Dial Transplant. 2016;31(10):1595–1605. doi:10.1093/ndt/gfv278
27. Basile DP. Rarefaction of peritubular capillaries following ischemic acute renal failure: a potential factor predisposing to progressive nephropathy. Curr Opin Nephrol Hypertens. 2004;13(1):1–7. doi:10.1097/00041552-200401000-00001
28. Bobik A. The structural basis of hypertension: vascular remodelling, rarefaction and angiogenesis/arteriogenesis. J Hypertens. 2005;23(8):1473–1475. doi:10.1097/01.hjh.0000174970.56965.4f
29. Urbieta-Caceres VH, Syed FA, Lin J, et al. Age-dependent renal cortical microvascular loss in female mice. Am J Physiol Endocrinol Metab. 2012;302(8):E979. doi:10.1152/ajpendo.00411.2011
30. Onuigbo M, Frenandes R, Nijhawan V. The ASTRAL Trial results revisited--to stent or not to stent in renal artery stenosis? Qjm. 2010;103(5):357. doi:10.1093/qjmed/hcp202
 © 2020 The Author(s). This work is published and licensed by Dove Medical Press Limited. The full terms of this license are available at https://www.dovepress.com/terms.php and incorporate the Creative Commons Attribution - Non Commercial (unported, v3.0) License.
By accessing the work you hereby accept the Terms. Non-commercial uses of the work are permitted without any further permission from Dove Medical Press Limited, provided the work is properly attributed. For permission for commercial use of this work, please see paragraphs 4.2 and 5 of our Terms.
© 2020 The Author(s). This work is published and licensed by Dove Medical Press Limited. The full terms of this license are available at https://www.dovepress.com/terms.php and incorporate the Creative Commons Attribution - Non Commercial (unported, v3.0) License.
By accessing the work you hereby accept the Terms. Non-commercial uses of the work are permitted without any further permission from Dove Medical Press Limited, provided the work is properly attributed. For permission for commercial use of this work, please see paragraphs 4.2 and 5 of our Terms.