")
Back to Journals » Cancer Management and Research » Volume 12
Contrast-Enhanced CT Parameters of Gastric Adenocarcinoma: Can Radiomic Features Be Surrogate Biomarkers for HER2 Over-Expression Status?
Authors Wang N, Wang X, Li W, Ye H, Bai H, Wu J, Chen M
Received 6 September 2019
Accepted for publication 15 January 2020
Published 18 February 2020 Volume 2020:12 Pages 1211—1219
DOI https://doi.org/10.2147/CMAR.S230138
Checked for plagiarism Yes
Review by Single anonymous peer review
Peer reviewer comments 2
Editor who approved publication: Dr Chien-Feng Li
Na Wang,1,* Xinxin Wang,2,* Wenya Li,2,* Huajun Ye,3 Hongzhao Bai,2 Jiansheng Wu,3 Mengjun Chen3
1Health Care Center, The First Affiliated Hospital of Wenzhou Medical University, Wenzhou, Zhejiang 325002, People’s Republic of China; 2Wenzhou Medical University, Wenzhou, Zhejiang 325002, People’s Republic of China; 3Department of Gastroenterology, The First Affiliated Hospital of Wenzhou Medical University, Wenzhou, Zhejiang 325002, People’s Republic of China
*These authors contributed equally to this work
Correspondence: Mengjun Chen; Jiansheng Wu
Department of Gastroenterology, The First Affiliated Hospital of Wenzhou Medical University, Nan Bai Xiang Street, Ouhai District, Wenzhou, Zhejiang 325002, People’s Republic of China
Tel +86-577-55579521
Fax +86-577-55579792
Email [email protected]; [email protected]
Objective: The aim of this study was to determine the role of contrast-enhanced computed tomography (CE-CT) parameters in predicting the expression status of HER2 in gastric adenocarcinoma (GAC) patients before radical gastrectomy.
Materials and Methods: A total of 460 GAC patients who underwent non-contrast CT (NC-CT) and CE-CT examinations before radical resection were enrolled in this retrospective study. The radiologists reviewed their CT scans and recorded parameters, including CT attenuate value (CAV) and corrected CAV (cCAV). The pathologist identified the postoperative HER2 expression status, and HER2 expression status was evaluated by immunohistochemical staining (IHC). The association between CE-CT parameters and HER2 expression status was analyzed.
Results: Among the 460 patients, 84 patients had HER2 over-expression status, at a prevalence of 18.3%. The CAVs were significantly different between the 2 different HER2 expression groups in the non-contrast and arterial phases (non-contrast phase: p = 0.005; arterial phase: p < 0.001). Besides, there was a significant difference in the cCAVs between the 2 groups in the arterial phase (arterial phase: p = 0.003). Univariate and multivariate logistic regression analyses identified that the maximum diameter of tumor, differentiation degree, CAV in non-contrast, arterial, and portal phases, and cCAV in the arterial phase were predictive factors of HER2 expression status.
Conclusion: Our analyses showed that the CE-CT parameters were significantly different between different HER2 expression groups. CE-CT parameters could serve as simple, objective predictive factors of HER2 expression status of GAC patients.
Keywords: gastric adenocarcinoma, contrast-enhanced-CT, human epidermal growth factor receptor 2
Introduction
Gastric cancer (GC) is one of the leading causes of cancer-related death according to global cancer statistics, especially in East Asia.1 The histopathological characteristics of GC, namely the pathological type, depth of invasion, differentiation degree, lymph node metastasis, and molecular profiling, are well-known prognostic factors in advanced GC.2,3
The human epidermal growth factor receptor 2 (HER2) is a proto-oncogene located on chromosome 17q21, and it is a potential therapeutic target for advanced HER2-positive GC.4,5 In 6–35% of all GC patients, gastric lesions have been reported to over-express HER2.6–10 The status of HER2 expression in gastric lesions is currently evaluated by immunohistochemistry (IHC), silver in situ hybridization (SISH), and fluorescence in situ hybridization (FISH).5,11,12 It was found to be correlated with tumor grade and location on the intestine, but not with gender, age, tumor location or (tumor node metastasis) TNM stage, depth of invasion, lymph node metastases, and distant metastasis.4,13
At present, gastroscopic biopsy is the main routine detection method to gain information about the histopathological characteristics of lesions before surgery. However, gastroscopic histopathological findings are influenced by many factors, including site and depth of the specimens and evaluation of the pathologist. The small specimens obtained using a gastroscope usually provide incomplete information about the lesion; this is a major drawback as some GCs are of mixed histopathological type. Besides, gastroscopic biopsy is inevitably invasive and unable to reach the outside of the gastric wall.14,15 Complementarily, CE-CT is a noninvasive method for evaluating the lesions and further analyzing adjacent structures outside the gastric wall.16,17 Recently, a number of articles proposed the utility of CT for histopathological assessment of GCs. For example, Zhengyang Zhou et al showed that CT texture analysis was capable of accessing Lauren classification, differentiation degree, and vascular invasion status of GCs.16 Yuichiro Doki et al found that the optimal cut-off values of visualized lymph node sizes in multidetector-row CT were able to improve the diagnostic prediction of lymph node metastasis in GC patients.17 Nonetheless, to the best of our knowledge, there is no research on the correlation between HER2 expression and CE-CT parameters.
The aim of this study was to determine the role of CE-CT in predicting the expression status of HER2 in GAC patients before radical gastrectomy.
Materials and Methods
Patients
This study enrolled patients who were diagnosed with GAC between July 2013 and February 2018 at The First Affiliated Hospital of Wenzhou Medical University. The inclusion criteria were as follows: (1) age 18 years or older, (2) radical gastrectomy and lymphadenectomy carried out at The First Affiliated Hospital of Wenzhou Medical University, (3) newly diagnosed GAC confirmed by postoperative pathological studies, (4) at least one measurable intraoperative lesion, (5) HER2 status of GAC lesion identified by IHC staining, and (6) must have undergone CE-CT before radical excision. Patients were excluded from the study if (1) they were treated with any regimen such as chemotherapy or targeted agents before surgery and CE-CT, (2) their CT image quality was poor for post-processing owing to artifacts, and (3) their tumor diameters were less than 5 mm, as this is insufficient for containing a region of interest (ROI).
All data concerning the clinical characteristics and subsequent operative treatment were extracted and analyzed in accordance with the Declaration of Helsinki. The study was approved by the institutional review board of The First Affiliated Hospital of Wenzhou Medical University. Also, consent was waived by the institutional review board given the retrospective nature of this study, yet patient confidentiality was protected.
CT Image Acquisition
All patients underwent 64-slice multidetector CE-CT (Light Speed Plus 16, GE Healthcare, Waukesha, WI) before radical resection. Written informed consent for preoperative CE-CT was obtained from all patients. After fasting from solid food for at least 6 h prior to examination, the patients were requested to drink 600–1000 mL of water to achieve gastric pouch distension. The patients were trained to hold their breath before the scanning. All patients were in the supine position and the scanner covered the entire or upper abdomen during a single breath hold. After a non-contrast scan (0 s), 100–120 mL iodinated contrast agent (Omnipaque 350 mg I/mL; GE Healthcare, Shanghai, China) was injected intravenously at a flow rate of 3.0 mL/s using an automatic injector. CE-CT images were obtained at 40 s (arterial phase), 70 s (portal phase), and 240 s (delayed phase) after the infusion of the contrast agent. NC-CT and CE-CT datasets were transferred to a picture archiving and communication system (PACS).
The parameters for abdomen CT were as follows: 64 detector rows, tube voltage of 120 kVp, tube current of 200 mA, rotation time of 0.4 s, section thickness of 0.625 mm, pitch of 1.375 mm, and reconstruction interval of 0.625 mm.
CT Image Evaluation
Two seasoned radiologists (Lin Yi and Mao Dandan), with 10 and 7 years of experience in abdominal image reading, respectively, reviewed the CT images. Both radiologists were blinded to the clinicopathological information, other than the gastroendoscopy findings.
Referring to the general location of tumors (cardia, fundus, body, antrum, etc.) on endoscopy, the two readers independently reviewed the CT images and identified the gastric lesions on PACS. The mediastinal window settings included a window level (WL) of 50 and a window width (WW) of 250. The GCs were characterized as focal thickening of the gastric wall or mass lesions with obvious enhancement on CE-CT images. The focal thickening was determined to be cancerous when it was at least 6 mm or greater than the thickness of the adjacent gastric wall on the axial images.18,19 After general localization, the readers targeted the largest tumor section on the axial images as the ROI (Figure 1). The ROI was manually drawn along the margin of the lesion, while the gastric lumen and the image artifacts were carefully avoided. After drawing the ROI, the PACS software automatically generated the average CAV, which was the mean of all of pixels’ CT values within the ROI. Image analysis for each patient was performed separately in the non-contrast, arterial, portal, and delayed phases. The ROIs in different phases were drawn on the same slice and at the same location. When drawing the ROIs in contrast-enhanced phases, the two radiologists measured the mean CAV in the aortic canal on the same slice to calculate the corresponding corrected CAV ([cCAV] CAV in ROI/CAV in aortic canal). The two readers interpreted the CT images independently, and the ROI drawings were verified without any significant divergence between them.
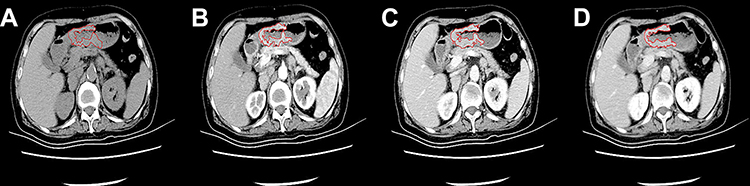 |
Figure 1 NC-CT and CE-CT scans of GACs. Notes: CT images in the non-contrast phase (A), arterial phase (B), portal venous phase (C), and delayed phase (D) showed a thickened gastric wall. The thickened gastric wall was targeted as the ROI. The ROI was manually drawn along the margin of the lesion (red line). |
The two radiologists reviewed the CE-CT and NC-CT of each patient and recorded a set of parameters as follows: (1) CAV of ROI in non-contrast phase, (2) CAV of ROI in arterial phase, (3) CAV of ROI in portal phase, (4) CAV of ROI in delayed phase, (5) cCAV of ROI in arterial phase, (6) cCAV of ROI in portal phase, and (7) cCAV of ROI in delayed phase. The average parameters (CAV, cCAV, etc.) of the two readers were calculated for statistical analyses as well as interobserver agreement analysis.
Pathological Evaluation
Postoperative pathological diagnoses were retrospectively identified by one experienced pathologist (Jinyu Zheng with 8 years of experience in gastrointestinal pathology) in all cases. The HER2 expression status of all GAC patients was identified by IHC.
Tissue samples of GC lesions were fixed in 10% buffered formalin and embedded in paraffin. The paraffin block of each specimen was cut into 4-μm and 2-μm-thick sections for IHC. IHC study was performed using the HercepTestTM (Dako, Denmark) according to the manufacturer’s guidelines, and the lesions were scored using the validated protocol for GC. In our study, only HER2 IHC 2+ or IHC 3+ were considered HER2 positive.6
In light of the WHO’s classification of digestive tumors and UICC 2010 TNM classification of malignant tumors,20,21 the pathologist reviewed and recorded a set of histopathological parameters as follows: (1) HER2 expression status, (2) location of tumor, (3) maximum diameter of tumor, (4) differentiation degree, (5) T stage (depth of infiltration), (6) N stage (lymph node metastasis), (7) M stage (distant metastasis), (8) vascular invasion status, and (9) neural invasion status.
Statistical Analysis
According to the HER2 expression status, we divided the patients into two groups, HER2-positive group and HER2-negative group. Then, we compared the clinicopathological characteristics between the two groups by Mann–Whitney U-test (continuous variables) or chi-square test (categorical variables). The CE-CT parameters between the two groups were compared by independent sample t-test and Spearman correlation analysis. Normal distribution of CE-CT parameters was conducted by Kolmogorov–Smirnov test. The diagnostic performance of CE-CT parameters in distinguishing between different HER2 expression statuses was assessed by receiver operating characteristic (ROC) analysis. Besides, we evaluated the interobserver agreement between the measurements of the CE-CT parameters of the two radiologists using the intra-class correlation coefficient (ICC) (0.000–0.200, poor; 0.201–0.400, fair; 0.301–0.600, moderate; 0.601–0.800, good; 0.801–1.000, excellent). The univariable and multivariable analyses were performed by logistic regression analyses. All variables with a p value < 0.1 in the univariable analysis were subsequently included in the multivariable logistic regression model. All tests were two-sided and the test results with p value <0.05 were considered statistically significant. All statistical analyses were performed using the SPSS 19 statistical software (SPSS Inc./IBM, Armonk, NY).
Results
Patients’ Clinicopathological Characteristics
A total of 460 patients with GAC were enrolled in this retrospective study, and their clinicopathological characteristics are summarized in Table 1. Among the 460 patients, 84 patients had HER2 over-expression status with a prevalence of 18.3%. Additionally, the HER2 overexpression was not very common in GACs at the antrum and pylorus (p = 0.016) and in undifferentiated GACs (p < 0.001) but was common in differentiated GACs (p < 0.001) with statistical significance (Table 1).
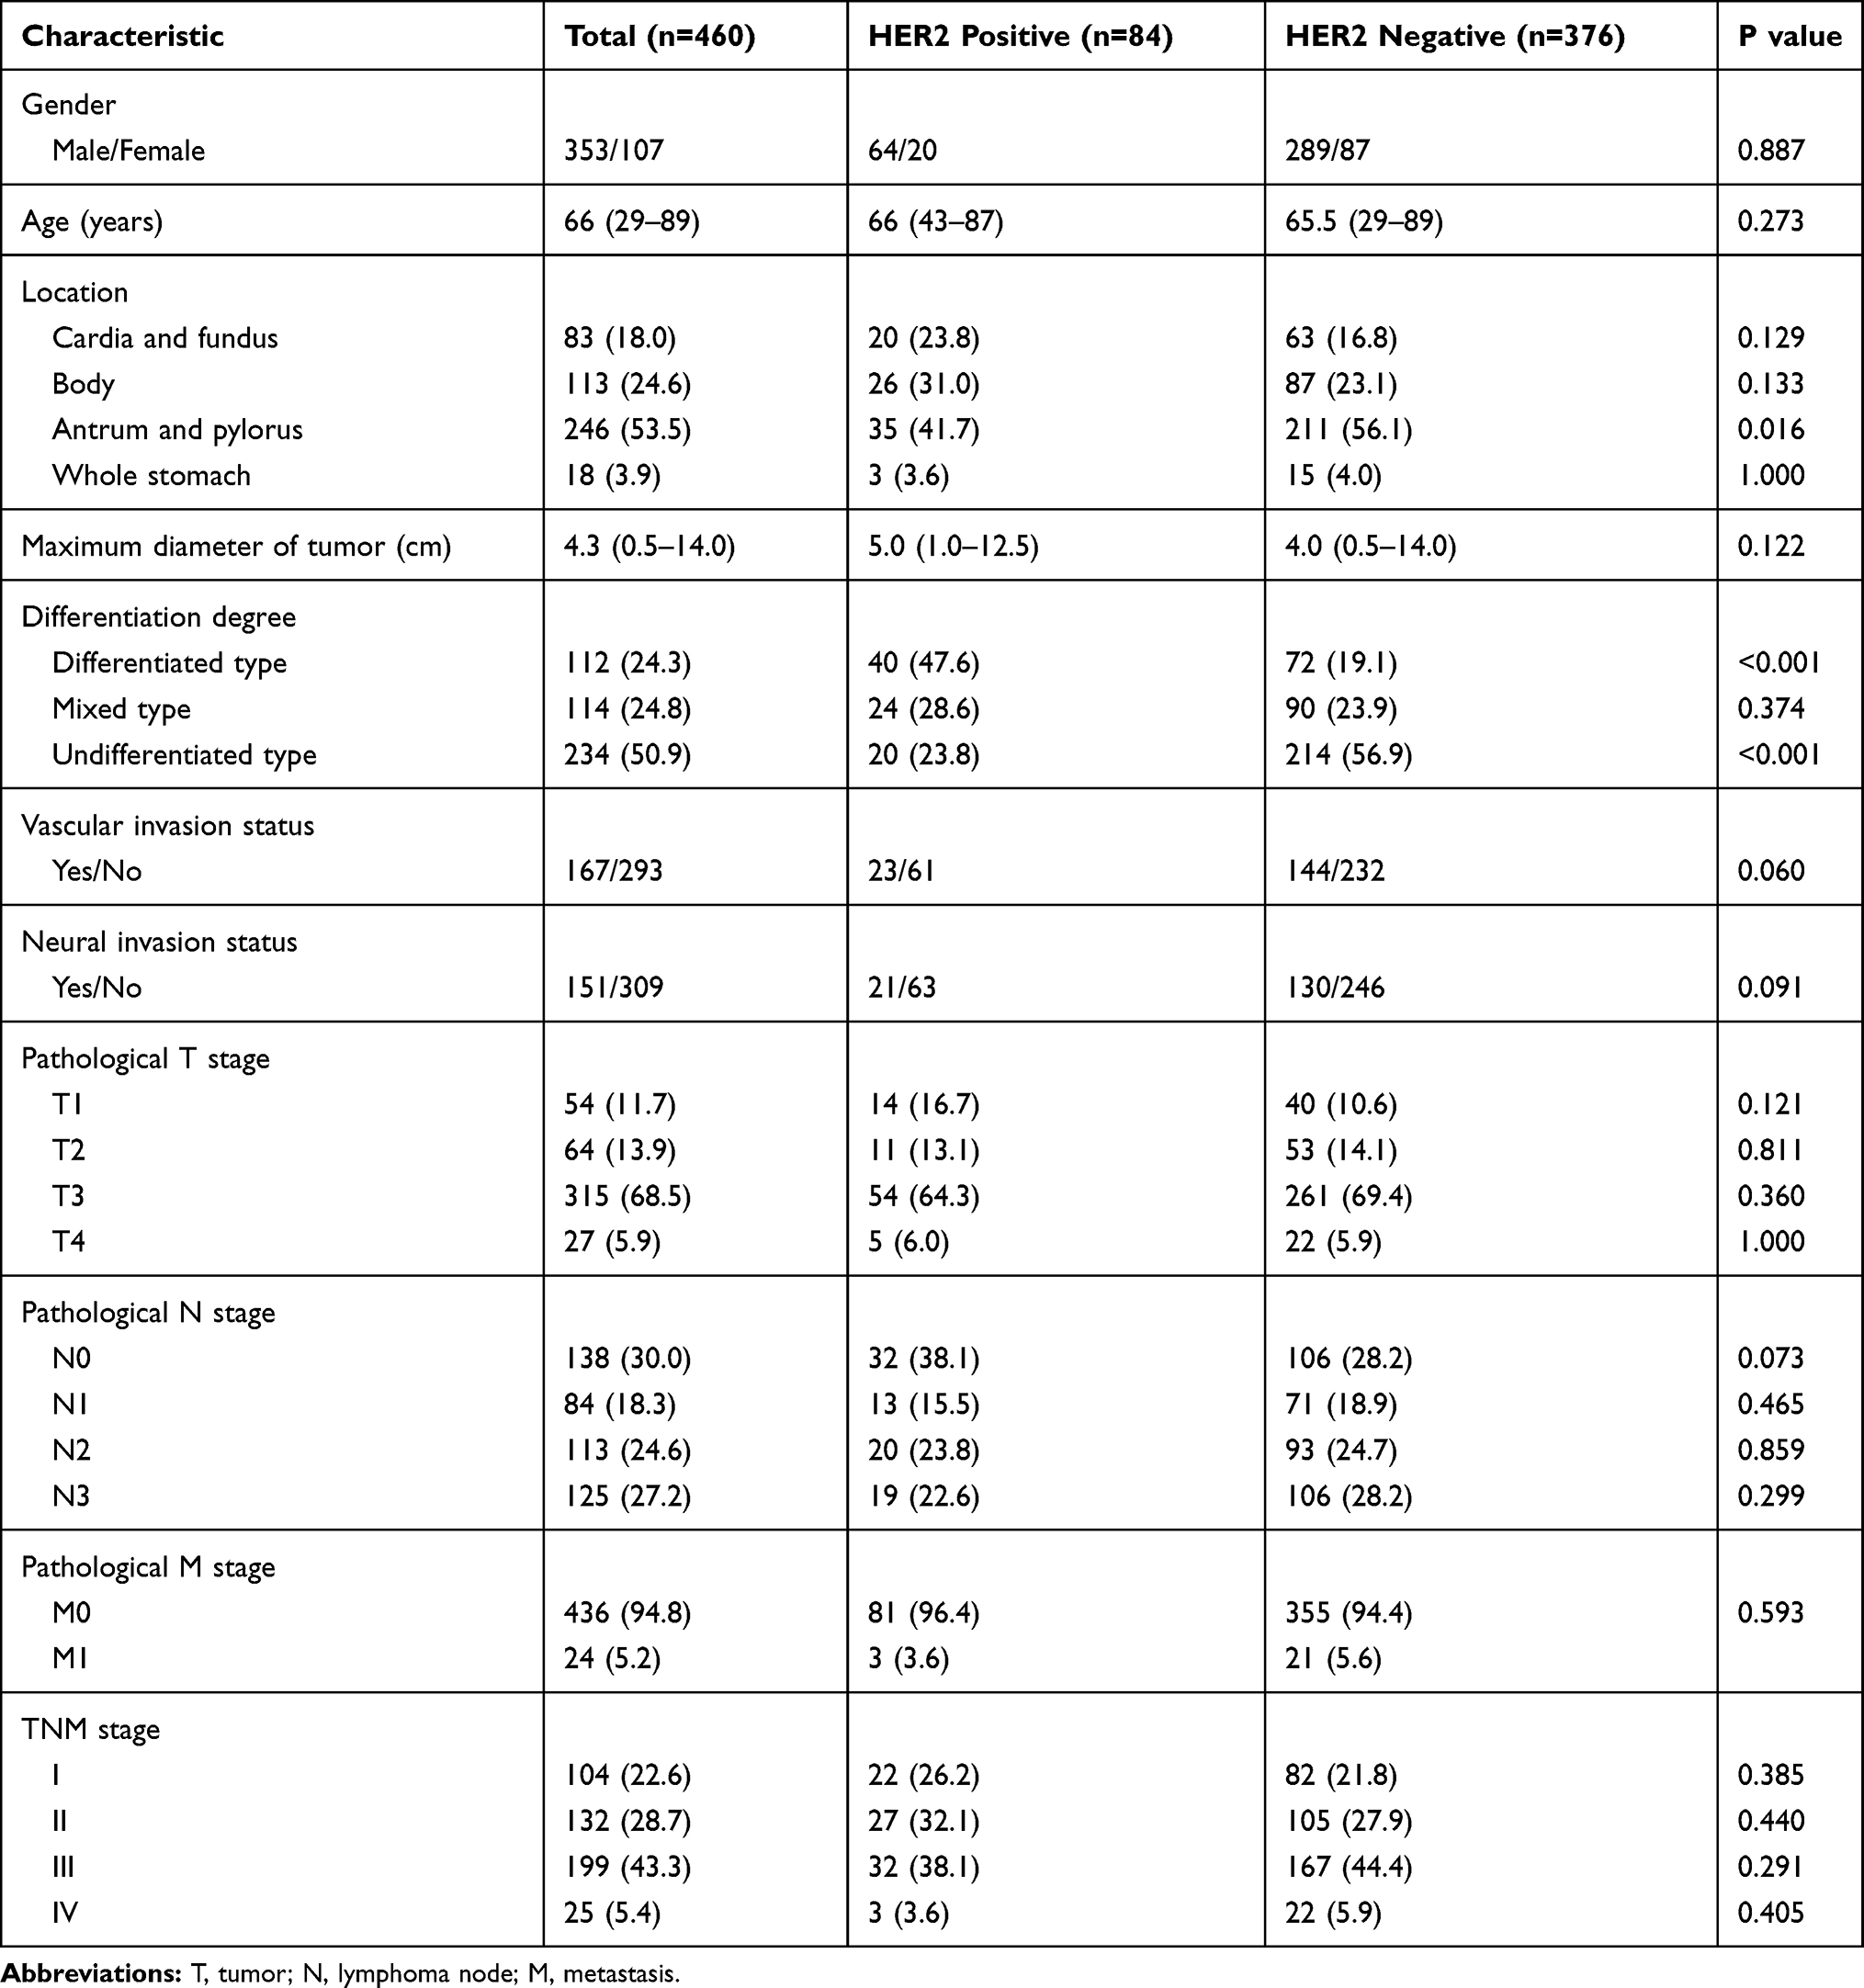 |
Table 1 Clinicopathological Characteristics of Patients with GACs, Median (Range) or n (%) |
CT Analysis and Diagnostic Performance
The interobserver agreement between the measurements of CE-CT parameters of the two radiologists was ranked from good to excellent. Specifically, the ICCs of CAV in non-contrast, arterial, portal, and delayed phases were 0.690 (good), 0.865 (excellent), 0.845 (excellent), and 0.856 (excellent), respectively. The ICCs of cCAV in the arterial, portal, and delayed phases were 0.807 (excellent), 0.817 (excellent), and 0.811 (excellent), respectively.
In the dynamic CE-CT analysis, the CAVs were significantly different between the two different HER2 expression groups in the non-contrast and arterial phases (non-contrast phase: p = 0.005; arterial phase: p < 0.001; Table 2). Besides, the CAVs of the HER2-positive group were significantly lower than those of the HER2-negative group in the non-contrast phase, but the CAVs of the HER2-positive group were significantly higher than those of the HER2-negative group in the arterial phase (Figure 2). There were significant differences in the cCAVs between the two groups in the arterial phase (p = 0.003; Table 2, Figure 2). On correlation analysis, the CAVs in the non-contrast (CC = −0.135, p = 0.004), arterial (CC = 0.172, p < 0.001), and portal phases (CC = 0.093, p = 0.047) were found to be significantly correlated with different expression statuses of HER2. While the CAVs in the non-contrast phase were negatively correlated with HER2 expression status, the CAVs in the arterial and portal phases were positively correlated with HER2 expression status. Regarding the cCAVs, only the cCAVs in the arterial phase were correlated with HER2 expression status (CC = 0.141; p = 0.002; Table 2).
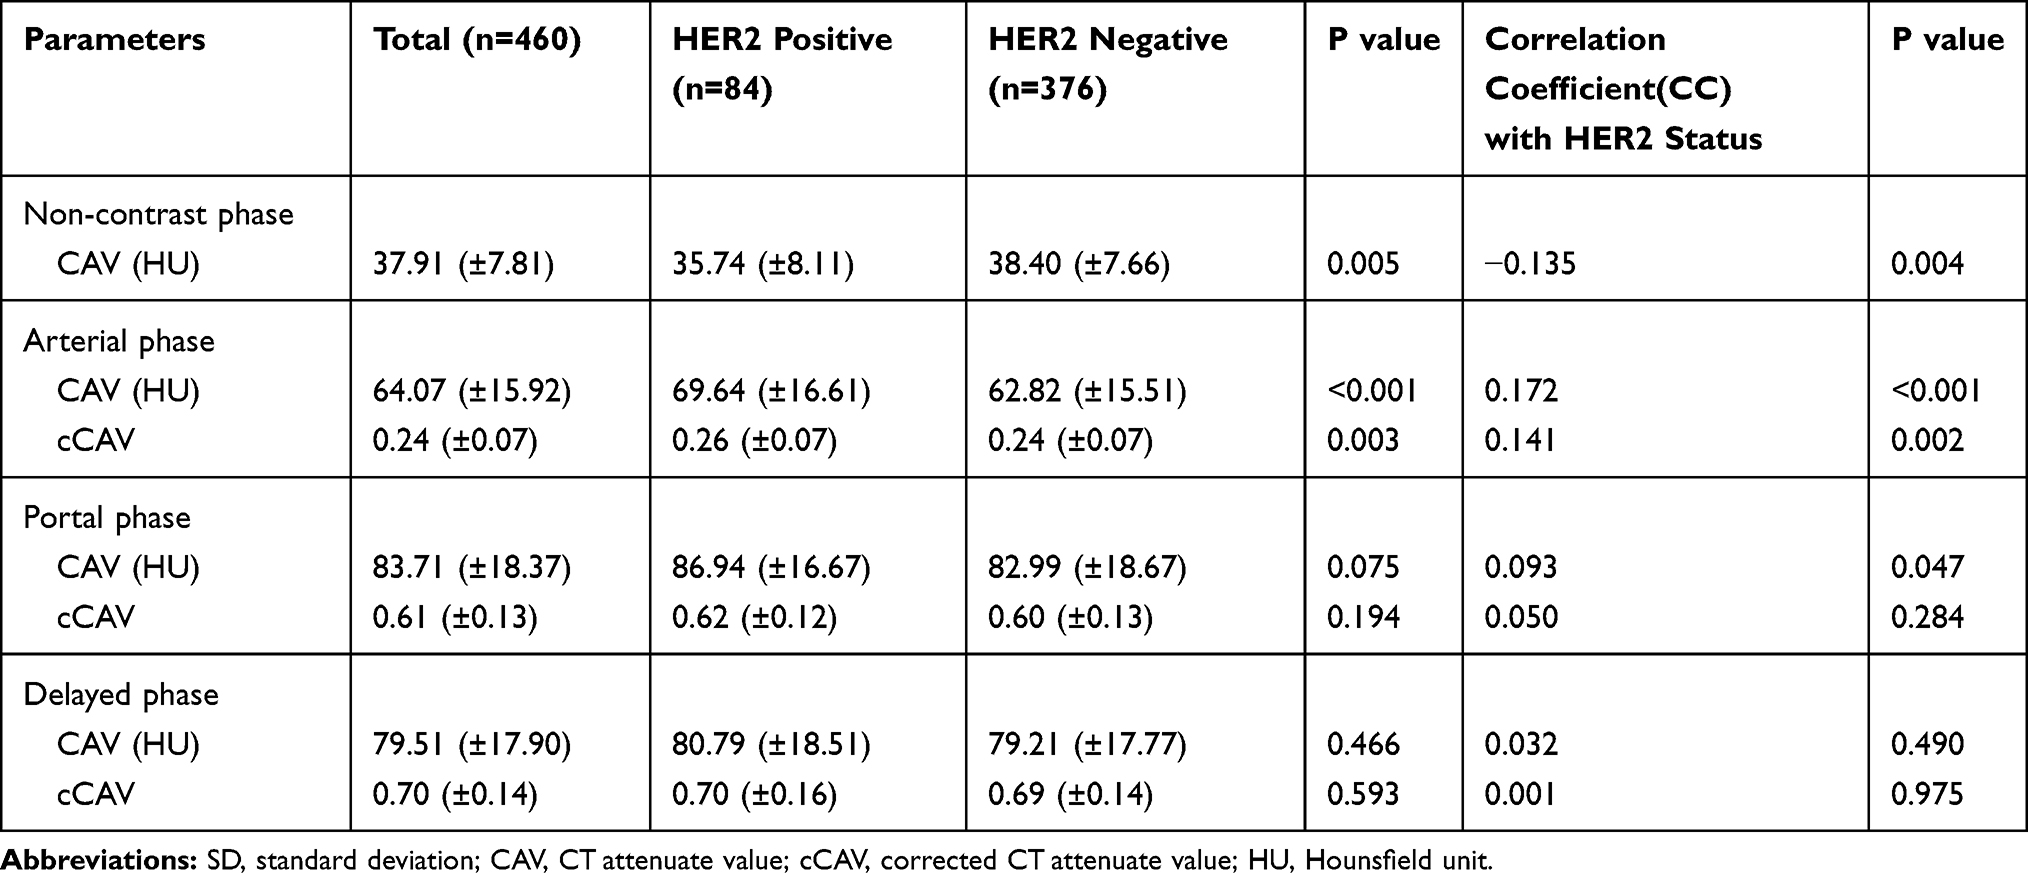 |
Table 2 Dynamic CT Parameters of Patients with GACs, Mean (±SD) |
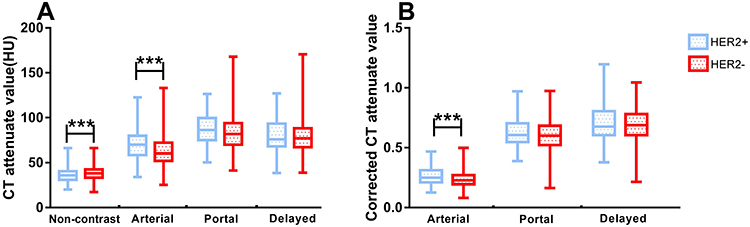 |
Figure 2 CT parameters between two different HER2 expression groups were compared. Notes: (A) The CAVs were significantly different between 2 groups in non-contrast (p = 0.005) and arterial (p < 0.001) phases. (B) The cCAVs were significantly different between 2 groups in arterial (p = 0.003) phase. ***p < 0.01. |
With regard to the diagnostic performance of the CE-CT parameters in predicting HER2 expression, the cut-off, sensitivity, specificity, and AUC under ROC curve are listed in Table 3. The CAVs in the non-contrast, arterial, and portal phases could distinguish between HER2-positive and negative GACs (non-contrast phase: AUC = 0.601, p = 0.004; arterial phase: AUC = 0.628, p < 0.001; portal phase: AUC = 0.569, p = 0.047; Table 3). Additionally, with a cut-off of 0.255, the cCAVs in the arterial phase showed a sensitivity of 50.0% and a specificity of 69.4% in distinguishing between GACs with HER2-positive and negative expression (AUC = 0.605, p = 0.003). However, the cCAVs in the other phases did not show any significant discrimination.
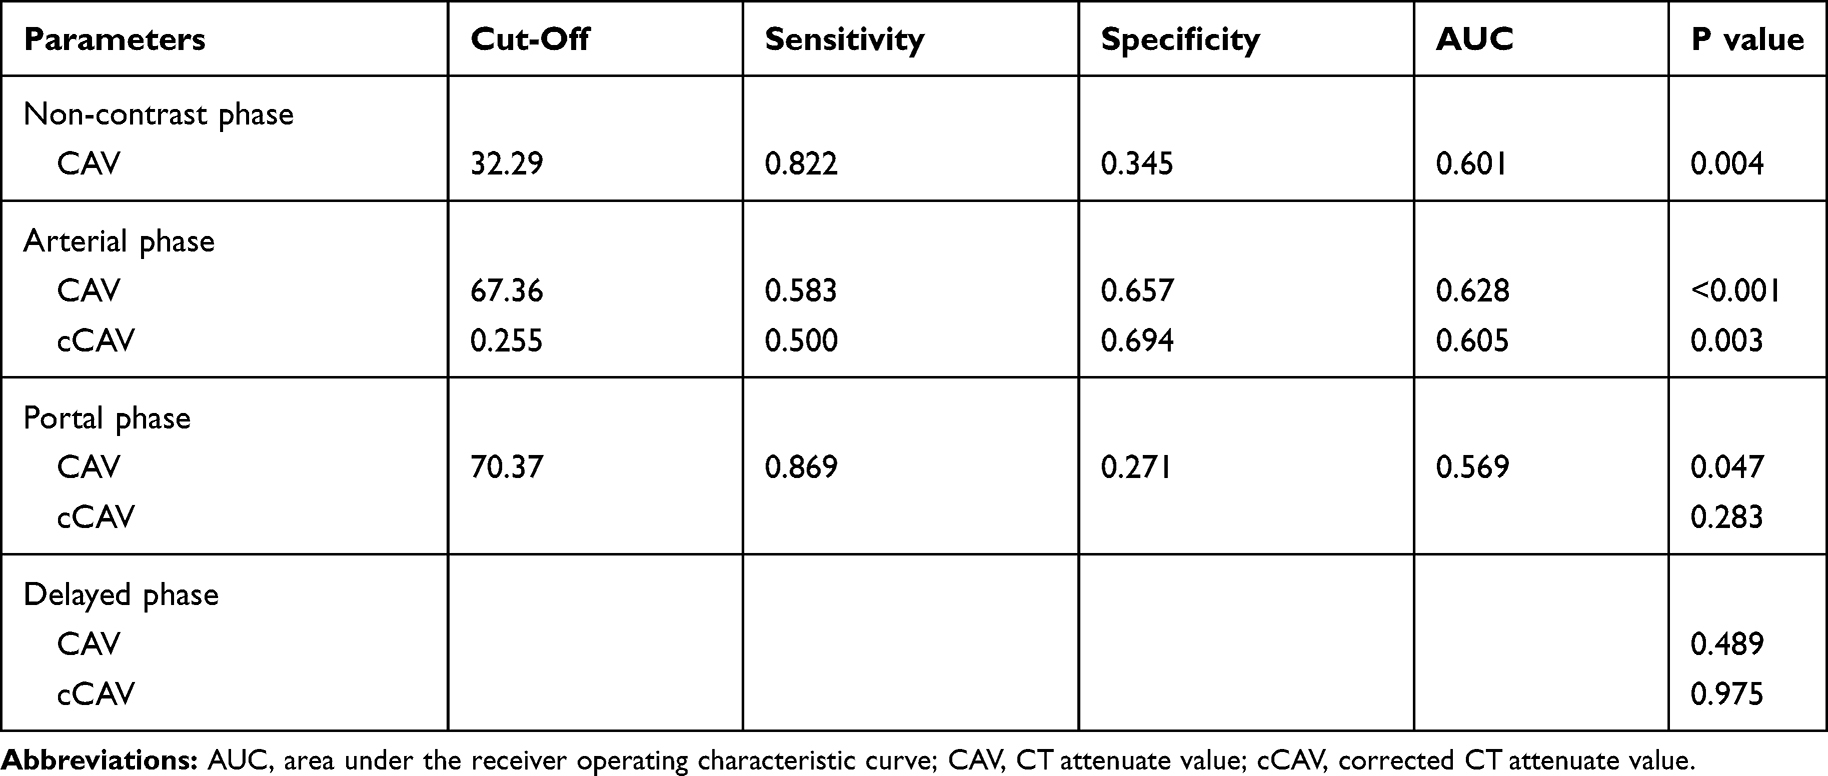 |
Table 3 Diagnostic Performance of CT Parameters in Distinguishing the HER2 Status |
Logistic Regression Analysis
The results of the univariate and multivariate logistic regression analyses of factors affecting HER2 expression are listed in Table 4. The univariate analysis revealed that differentiation degree [differentiated type vs undifferentiated type, OR = 5.944, 95% confidence interval (95% CI) = 3.264–10.826, p < 0.001; mixed type vs undifferentiated type, OR = 2.853, 95% CI = 1.501–5.425, p = 0.001], CAVs in the non-contrast (OR = 0.411, 95% CI = 0.244–0.693, p = 0.001), arterial (OR = 2.681, 95% CI = 1.653–4.346, p < 0.001), and portal (OR = 2.470, 95% CI = 1.260–4.845, p = 0.008) phases, and cCAVs in the arterial phase (OR = 2.270, 95% CI = 1.403–3.670, p = 0.001) were significantly associated with HER2 expression status.
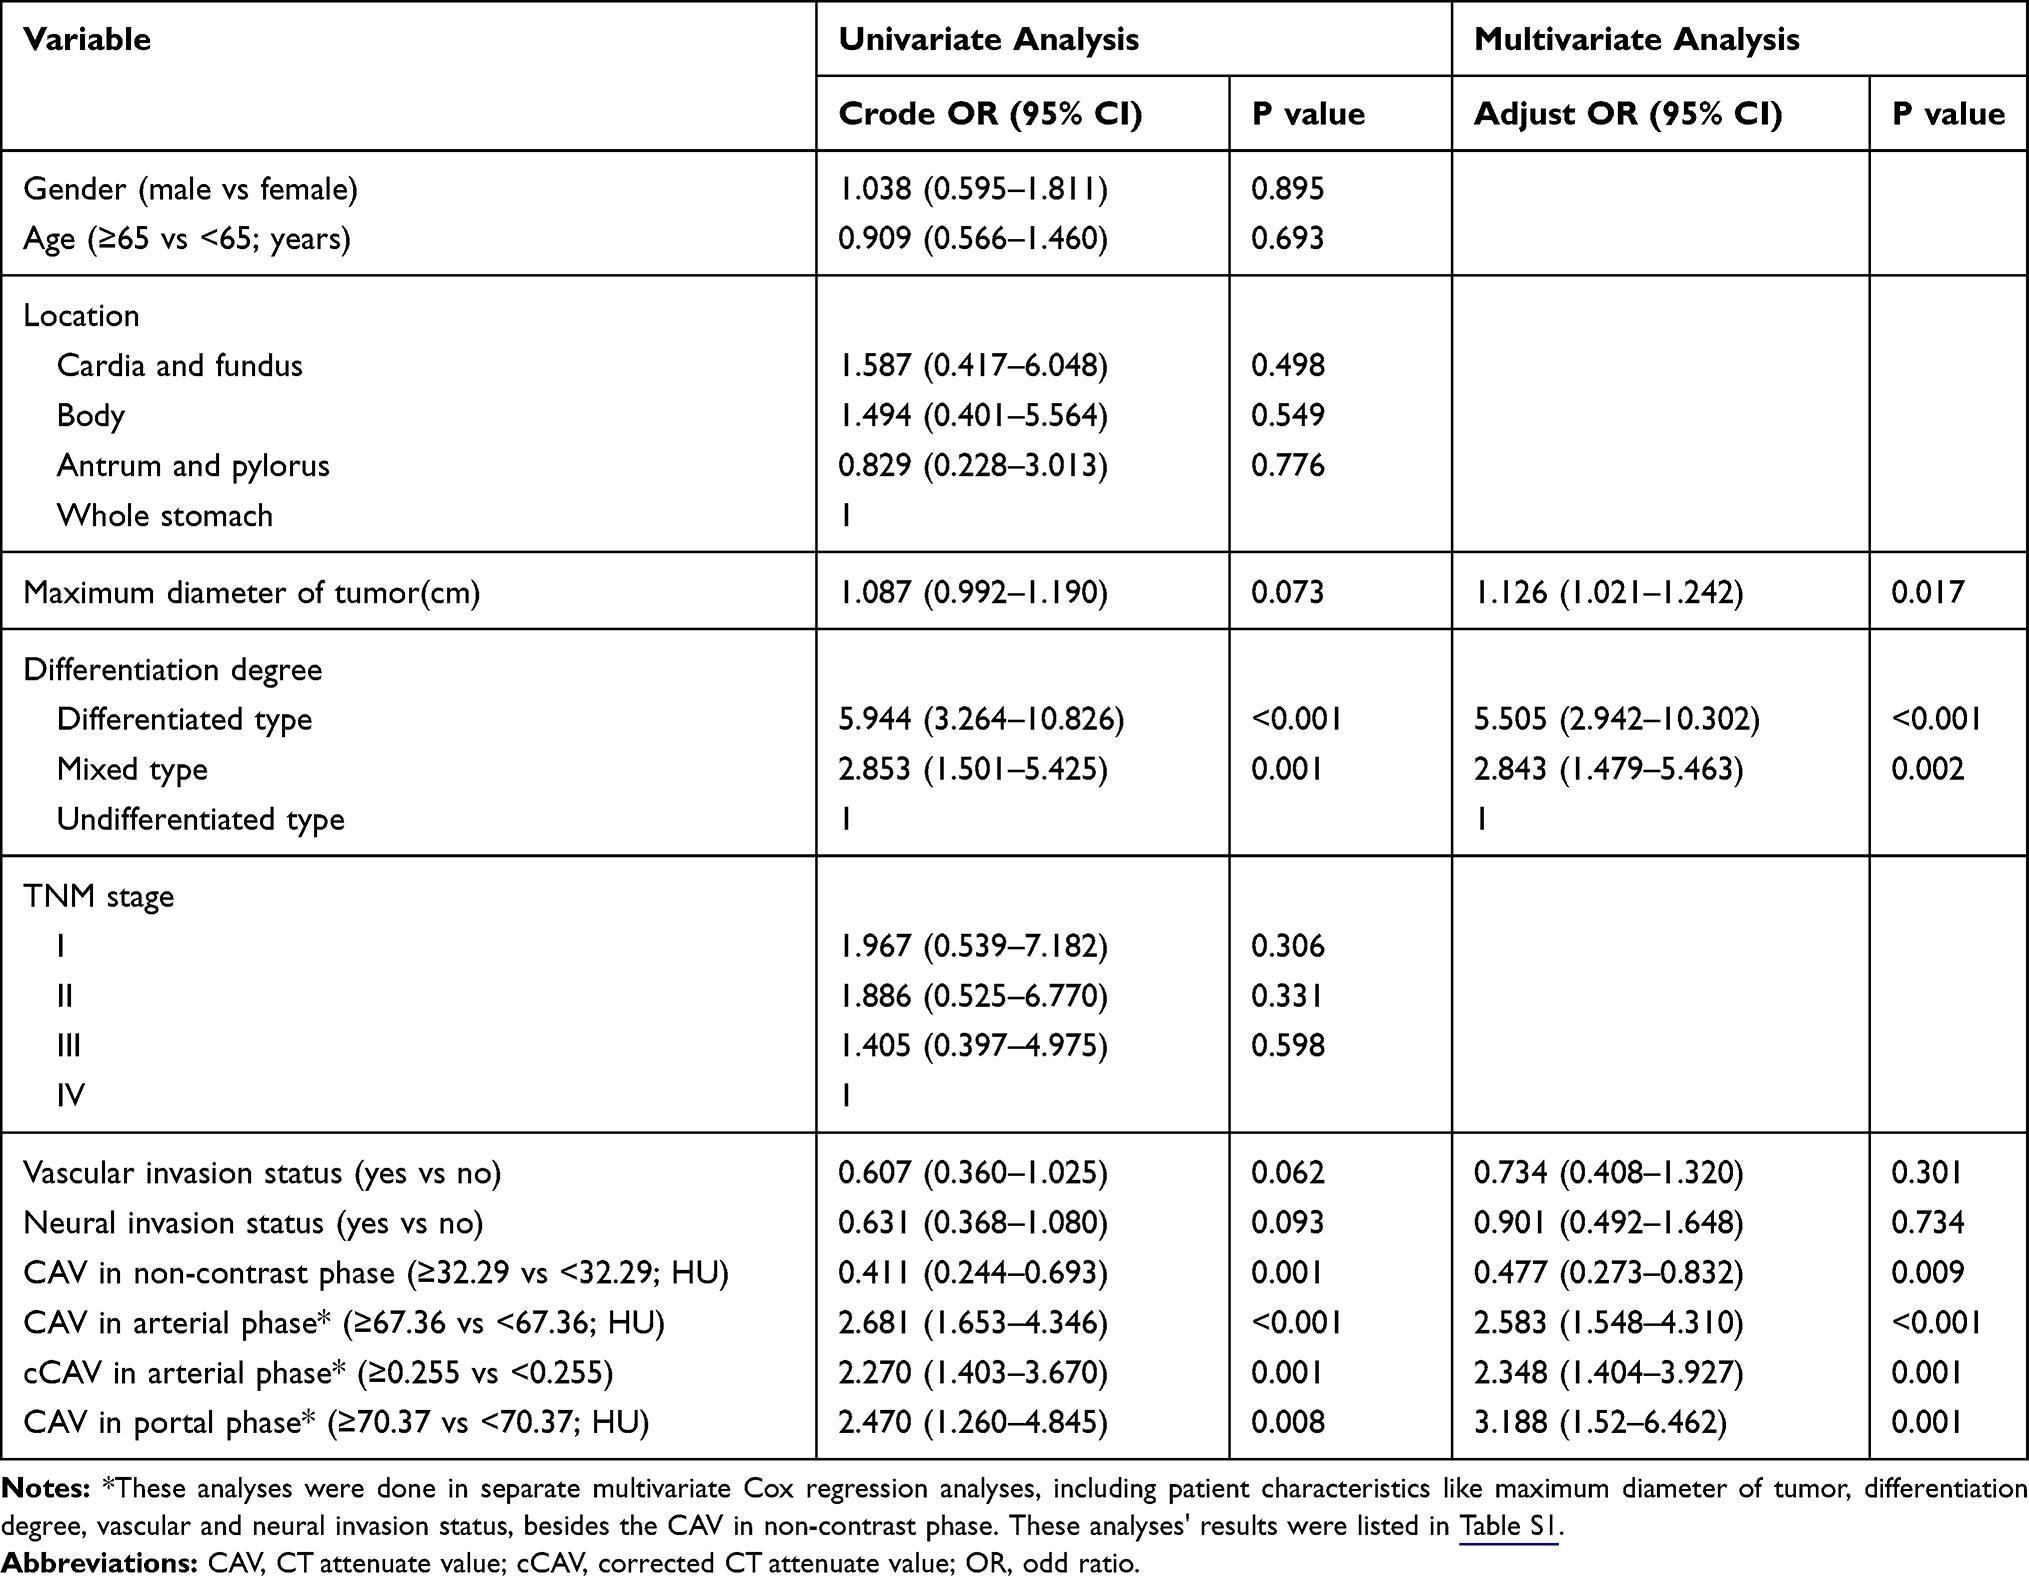 |
Table 4 Univariate and Multivariate Logistic Regression Analysis for Patients with Gastric Adenocarcinomas |
Multivariate analysis included all the variables with p value <0.1 in the univariate analysis, and all the CT parameters were separately included in multivariate logistic regression analysis (Table 4 and Table S1). It was found that the long maximum diameter of tumor (OR = 1.126, 95% CI = 1.021–1.242, p = 0.017), differentiated and mixed GACs (differentiated type vs undifferentiated type: OR = 5.505, 95% CI = 2.942–10.302, p < 0.001; mixed type vs undifferentiated type: OR = 2.843, 95% CI = 1.479–5.463, p = 0.002), low CAV in the non-contrast phase (OR = 0.477, 95% CI = 0.273–0.832, p = 0.009), high CAV in the arterial (OR = 2.583, 95% CI = 1.548–4.310, p < 0.001) and portal phases (OR = 3.188, 95% CI = 1.52–6.462, p = 0.001), and high cCAV in the arterial phase (OR = 2.348, 95% CI = 1.404–3.927, p = 0.001) were risk factors for the HER2-positive group.
Discussion
In this study, we found a correlation between preoperative CT parameters and postoperative histopathological HER2 expression status of GACs, which has never been reported previously. Our analysis showed that HER2-positive GACs showed significantly low CAVs in the non-contrast phase and high CAVs in the arterial and portal phases, compared to the HER2-negative group. Besides, univariate and multivariate logistic analyses showed that low CAVs in the non-contrast phase, high CAVs in the arterial and portal phases, and high cCAVs in arterial phase were risk factors for HER2 over-expression of GACs.
HER2 is a member of the epidermal growth factor receptor (EGFR) family, whose over-expression has been associated with cell transformation and oncogenesis.22–24 Recently, the development of targeted therapy, such as trastuzumab, has drawn attention to HER2 expression status.25,26 Clinical studies have shown that several clinicopathological characteristics, such as, older age, male, intestinal type, and well-differentiation, were correlated with HER2 over-expression.13,27 In this study, we found that the differentiation degree of GACs was also related with HER2 over-expression. Besides, we found that preoperative CE-CT parameters, namely CAV in the arterial, portal, and delayed phases and cCAV in the delayed phase (Table 4) were associated with HER2 expression in the lesions of GAC, in line with the findings of Ciesielski, who found a relationship between HER2 overexpression and angiogenesis in GC.28
A previous study by Minkyu Jung showed that GCs with HER2 over-expression generally show high 18F-fluorodeoxyglucose (FDG) uptake in PET/CT scan images of the primary gastric tumor lesion before therapy.29 Similarly, we observed higher CAVs in the arterial and portal phases in HER2-positive GACs than in HER2-negative GACs (Table 2). We also observed that HER2 overexpression was more common in differentiated GACs than in undifferentiated GACs (Table 1). Many studies proposed that HER2 expression status is associated with the differentiation degree of GCs.13,30,31 Besides, there were significant differences in the CAVs of GCs showing different degrees of differentiation in some previous studies.32,33 Thus, the correlation between HER2 positivity and CE-CT parameters with high values could be influenced by these histologic characteristics. Additionally, compared to PET/CT, as an auxiliary modality to predict the HER2 expression status, CE-CT is affordable and easily available in developing countries.
Our study showed that preoperative CT parameters could be helpful biomarkers for predicting HER2 expression of GACs. Due to high heterogeneity of GACs, gene-expression profiling based on tissue specimens may be affected by sampling errors, especially in the case of endoscopic biopsy specimens. The CE-CT parameters can be used to evaluate the gastric lesions and further analyze their adjacent structures outside the wall in a non-invasion manner. Therefore, acquiring these imaging features could be useful in guiding biopsy and predicting HER2 expression status.
However, this study still has some limitations: (1) retrospective nature of the study, (2) single-center research study with inevitable selection bias, and (3) lack of other pathological types such as squamous carcinoma and adenosquamous carcinoma. Despite the above limitations, a combination of traditional clinicopathological findings and radiomic features might improve the diagnostic prediction of HER2 expression status.
In conclusion, we found that CE-CT parameters could serve as simple, objective factors in a Chinese GAC cohort. Given its effectiveness and convenience, we hypothesize that CE-CT parameters aid not only cancer staging but also HER2 expression prediction. Further detailed, larger prospective studies are required to confirm the specific role of CE-CT parameters as prognostic factors in HER2 status prediction in GAC.
Conclusion
In summary, this study showed that CE-CT parameters were correlated with HER2 expression status in GAC patients. Although the sensitivity and specificity were restrictive to some extent, preoperative CE-CT parameters, especially CAVs, could be potentially helpful biomarkers for predicting the HER2 expression of GACs. Further studies with larger sample sizes are required for confirming the relationship.
Abbreviations
CE-CT, contrast-enhanced CT; GAC, gastric adenocarcinoma; NC-CT, non-contrast CT; CAV, CT attenuate value; cCAV, corrected CAV; IHC, immunohistochemical stain; OR, odds ratio; GC, gastric cancer; HER2, human epidermal growth factor receptor 2; SISH, silver in situ hybridization; FISH, fluorescence in situ hybridization; ROI, region of interest; PACS, picture archiving and communication system; WL, window level; WW, window width; ROC, receiver operating characteristic; ICC, intra-class correlation coefficient; CC, correlation coefficient; CI, confidence interval; EGFR, epidermal growth factor receptor; FDG, fluorodeoxyglucose.
Ethics Approval and Consent to Participate
The study was approved by the institutional review board of The First Affiliated Hospital of Wenzhou Medical University. The need for consent was waived by the institutional review board owing to the retrospective nature of this study, yet patient confidentiality was protected.
Availability of Data and Material
Please contact the corresponding author for data requests.
Author Contributions
All authors contributed to data analysis, drafting or revising the article, gave final approval of the version to be published, and agree to be accountable for all aspects of the work.
Funding
This study was supported by grants from the Wenzhou Municipal Sci-Tech Bureau’s program (No. Y20170063).
Disclosure
The authors report no conflicts of interest in this work.
References
1. Torre LA, Bray F, Siegel RL, et al. Global cancer statistics, 2012. CA Cancer J Clin. 2015;65(2):87–108. doi:10.3322/caac.21262
2. Zu H, Wang H, Li C, et al. Clinicopathologic characteristics and prognostic value of various histological types in advanced gastric cancer. Int J Clin Exp Pathol. 2014;7(9):5692–5700.
3. Rocken C. Molecular classification of gastric cancer. Expert Rev Mol Diagn. 2017;17(3):293–301. doi:10.1080/14737159.2017.1286985
4. Shabbir A, Qureshi M, Khalid A, et al. Gastric adenocarcinoma expressing human epidermal growth factor receptor in South Asian population. Saudi J Gastroenterol. 2018;24(5):289–293. doi:10.4103/sjg.SJG_23_18
5. Sekaran A, Kandagaddala RS, Darisetty S, et al. HER2 expression in gastric cancer in Indian population–an immunohistochemistry and fluorescence in situ hybridization study. Indian J Gastroenterol. 2012;31(3):106–110. doi:10.1007/s12664-012-0214-0
6. Mrklic I, Bendic A, Kunac N, et al. Her-2/neu assessment for gastric carcinoma: validation of scoring system. Hepatogastroenterology. 2012;59(113):300–303. doi:10.5754/hge10776
7. Kim TY, Han HS, Lee KW et al. A Phase I/II study of poziotinib combined with paclitaxel and trastuzumab in patients with HER2-positive advanced gastric cancer. Gastric Cancer. 2019;22:1206–1214.
8. Saeki H, Oki E, Kashiwada T, et al. Re-evaluation of HER2 status in patients with HER2-positive advanced or recurrent gastric cancer refractory to trastuzumab (KSCC1604). Eur J Cancer. 2018;105:41–49. doi:10.1016/j.ejca.2018.09.024
9. Boku N. HER2-positive gastric cancer. Gastric Cancer. 2014;17(1):1–12. doi:10.1007/s10120-013-0252-z
10. Okita A, Imai H, Takahashi M, et al. Efficacy and safety of trastuzumab in combination with S-1 and cisplatin therapy for Japanese patients with HER2-positive advanced gastric cancer: retrospective analysis. Tohoku J Exp Med. 2018;245(2):123–129. doi:10.1620/tjem.245.123
11. Kepil N, Batur S, Sonmez Wetherilt C, et al. Human epidermal growth factor receptor 2 (HER-2) status evaluation in advanced gastric cancer using immunohistochemistry versus silver in situ hybridization. Bosn J Basic Med Sci. 2017;17(2):109–113. doi:10.17305/bjbms.2016.1497
12. Park YS, Hwang HS, Park HJ, et al. Comprehensive analysis of HER2 expression and gene amplification in gastric cancers using immunohistochemistry and in situ hybridization: which scoring system should we use? Hum Pathol. 2012;43(3):413–422. doi:10.1016/j.humpath.2011.05.019
13. He C, Bian XY, Ni XZ et al. Correlation of human epidermal growth factor receptor 2 expression with clinicopathological characteristics and prognosis in gastric cancer. World J Gastroenterol. 2013;19(14):2171–2178. doi:10.3748/wjg.v19.i14.2171
14. Kurihara M, Shirakabe H, Yarita T, et al. Diagnosis of small early gastric cancer by X-ray, endoscopy, and biopsy. Cancer Detect Prev. 1981;4(1–4):377–383.
15. Johansen A, Sikjaer B. Gastroscopic biopsy: reliability of histological diagnosis with special reference to the single biopsy. Scand J Gastroenterol. 1975;10(5):453–458.
16. Liu S, Liu S, Ji C, et al. Application of CT texture analysis in predicting histopathological characteristics of gastric cancers. Eur Radiol. 2017;27(12):4951–4959. doi:10.1007/s00330-017-4881-1
17. Saito T, Kurokawa Y, Takiguchi S, et al. Accuracy of multidetector-row CT in diagnosing lymph node metastasis in patients with gastric cancer. Eur Radiol. 2015;25(2):368–374. doi:10.1007/s00330-014-3373-9
18. Kim HJ, Kim AY, Oh ST, et al. Gastric cancer staging at multi-detector row CT gastrography: comparison of transverse and volumetric CT scanning. Radiology. 2005;236(3):879–885. doi:10.1148/radiol.2363041101
19. Kim JW, Shin SS, Heo SH, et al. The role of three-dimensional multidetector CT gastrography in the preoperative imaging of stomach cancer: emphasis on detection and localization of the tumor. Korean J Radiol. 2015;16(1):80–89. doi:10.3348/kjr.2015.16.1.80
20. Flejou JF. [WHO Classification of digestive tumors: the fourth edition]. Ann Pathol. 2011;31(5 Suppl):S27–S31. doi:10.1016/j.annpat.2011.08.001
21. Wittekind C. [Lymph nodes, tumour deposits, and TNM: are we getting better? 7th edition of UICC 2010 TNM classification of malignant tumors]. Strahlenther Onkol. 2012;188(2):191–192. doi:10.1007/s00066-011-0032-9
22. Moasser MM. The oncogene HER2: its signaling and transforming functions and its role in human cancer pathogenesis. Oncogene. 2007;26(45):6469–6487. doi:10.1038/sj.onc.1210477
23. Menard S, Pupa SM, Campiglio M, et al. Biologic and therapeutic role of HER2 in cancer. Oncogene. 2003;22(42):6570–6578. doi:10.1038/sj.onc.1206779
24. Rubin I, Yarden Y. The basic biology of HER2. Ann Oncol. 2001;12(Suppl 1):S3–S8. doi:10.1093/annonc/12.suppl_1.S3
25. Bang Y-J, Van Cutsem E, Feyereislova A, et al. Trastuzumab in combination with chemotherapy versus chemotherapy alone for treatment of HER2-positive advanced gastric or gastro-oesophageal junction cancer (ToGA): a Phase 3, open-label, randomised controlled trial. Lancet. 2010;376(9742):687–697. doi:10.1016/S0140-6736(10)61121-X
26. Rivera F, Romero C, Jimenez-Fonseca P, et al. Phase II study to evaluate the efficacy of Trastuzumab in combination with capecitabine and oxaliplatin in first-line treatment of HER2-positive advanced gastric cancer: HERXO trial. Cancer Chemother Pharmacol. 2019;83(6):1175–1181. doi:10.1007/s00280-019-03820-7
27. Otsu H, Oki E, Ikawa-Yoshida A, et al. Correlation of HER2 expression with clinicopathological characteristics and prognosis in resectable gastric cancer. Anticancer Res. 2015;35(4):2441–2446.
28. Lauren P. The two histological main types of gastric carcinoma: diffuse and so-called intestinal-type carcinoma. An attempt at a histo-clinical classification. Acta Pathol Microbiol Scand. 1965;64:31–49. doi:10.1111/apm.1965.64.issue-1
29. Park JS, Lee N, Beom SH, et al. The prognostic value of volume-based parameters using (18)F-FDG PET/CT in gastric cancer according to HER2 status. Gastric Cancer. 2018;21(2):213–224. doi:10.1007/s10120-017-0739-0
30. Wang HB, Liao XF, Zhang J. Clinicopathological factors associated with HER2-positive gastric cancer: a meta-analysis. Medicine (Baltimore). 2017;96(44):e8437. doi:10.1097/MD.0000000000008437
31. Zhou F, Li N, Jiang W, et al. Prognosis significance of HER-2/neu overexpression/amplification in Chinese patients with curatively resected gastric cancer after the ToGA clinical trial. World Journal of Surgical Oncology. 2012;10:274. doi:10.1186/1477-7819-10-274
32. Tsurumaru D, Miyasaka M, Muraki T, et al. Histopathologic diversity of gastric cancers: relationship between enhancement pattern on dynamic contrast-enhanced CT and histological type. Eur J Radiol. 2017;97:90–95. doi:10.1016/j.ejrad.2017.10.018
33. Lee JH, Park M-S, Kim KW, et al. Advanced gastric carcinoma with signet ring cell carcinoma versus non-signet ring cell carcinoma: differentiation with multidetector CT. J Comput Assist Tomogr. 2006;30(6):880–884. doi:10.1097/01.rct.0000220800.76276.46
 © 2020 The Author(s). This work is published and licensed by Dove Medical Press Limited. The full terms of this license are available at https://www.dovepress.com/terms.php and incorporate the Creative Commons Attribution - Non Commercial (unported, v3.0) License.
By accessing the work you hereby accept the Terms. Non-commercial uses of the work are permitted without any further permission from Dove Medical Press Limited, provided the work is properly attributed. For permission for commercial use of this work, please see paragraphs 4.2 and 5 of our Terms.
© 2020 The Author(s). This work is published and licensed by Dove Medical Press Limited. The full terms of this license are available at https://www.dovepress.com/terms.php and incorporate the Creative Commons Attribution - Non Commercial (unported, v3.0) License.
By accessing the work you hereby accept the Terms. Non-commercial uses of the work are permitted without any further permission from Dove Medical Press Limited, provided the work is properly attributed. For permission for commercial use of this work, please see paragraphs 4.2 and 5 of our Terms.