")
Back to Journals » OncoTargets and Therapy » Volume 12
Construction of prognostic microRNA signature for human invasive breast cancer by integrated analysis
Authors Shi W, Dong F, Jiang Y, Lu L, Wang C, Tan J , Yang W, Guo H, Ming J, Huang T
Received 30 September 2018
Accepted for publication 20 January 2019
Published 15 March 2019 Volume 2019:12 Pages 1979—2010
DOI https://doi.org/10.2147/OTT.S189265
Checked for plagiarism Yes
Review by Single anonymous peer review
Peer reviewer comments 2
Editor who approved publication: Dr XuYu Yang
Wei Shi,* Fang Dong,* Yujia Jiang, Linlin Lu, Changwen Wang, Jie Tan, Wen Yang, Hui Guo, Jie Ming,* Tao Huang*
Department of Breast and Thyroid Surgery, Union Hospital, Tongji Medical College, Huazhong University of Science and Technology, Wuhan 430022, China
*These authors contributed equally to this work
Background: Despite the advances in early detection and treatment methods, breast cancer still has a high mortality rate, even in those patients predicted to have a good prognosis. The purpose of this study is to identify a microRNA signature that could better predict prognosis in breast cancer and add new insights to the current classification criteria.
Materials and methods: We downloaded microRNA sequencing data along with corresponding clinicopathological data from The Cancer Genome Atlas (TCGA). Of 1,098 breast cancer patients identified, 253 patients with fully characterized microRNA profiles were selected for analysis. A three-microRNA signature was generated in the training set. Subsequently, the performance of the signature was confirmed in a validation set. After construction of the signature, we conducted additional experiments, including flow cytometry and the Cell Counting Kit-8 assay, to illustrate the correlation of this microRNA signature with breast cancer cell cycle, apoptosis, and proliferation.
Results: Three microRNAs (hsa-mir-31, hsa-mir-16-2, and hsa-mir-484) were identified to be significantly and independently correlated with patient prognosis, and performed with good stability. Our results suggest that higher expression of hsa-mir-484 indicated worse prognosis, while higher expression of hsa-mir-31 and hsa-mir-16-2 indicated better prognosis. Moreover, additional experiments confirmed that this microRNA signature was related to breast cancer cell cycle and proliferation.
Conclusion: Our results indicate a three-microRNA signature that can accurately predict the prognosis of breast cancer, especially in basal-like and hormone receptor-positive breast cancer subtypes. We recommend more aggressive therapy and more frequent follow-up for high-risk groups.
Keywords: microRNA, breast cancer, TCGA, prognosis
Introduction
Breast cancer is one of the most common malignancies among women, and despite the discovery of early detection methods and effective treatment therapies, it is still the second leading cause of cancer-related death in females.1 Breast cancer is a group of molecularly distinct neoplasms classified into four main subgroups based on their expression of estrogen receptor (ER),2 progesterone receptor (PR), and human epidermal growth factor receptor 2 (Her2). These subgroups require different treatment therapies and experience different clinical outcomes. However, even within the subgroups, there are different subsets of genetic and epigenetic abnormalities leading to different patient prognoses;3 thus, more research is needed to understand the mechanisms related to the prognosis within different breast cancer subgroups.
MicroRNAs are a class of endogenously expressed small, single-stranded, non-coding RNAs. Over the past decade, the aberrant expression of microRNAs has been increasingly reported in human cancers and has often been associated with diagnosis,4 prognosis, and response to clinical therapies.5 They are involved in the post-transcriptional regulation of gene expression via base pairing with target mRNAs (usually in the 3′ untranslated region), causing degradation and translation repression of mRNAs.6 MicroRNAs are now widely regarded as the most powerful regulators of gene expression in complex cellular processes including cancer cell proliferation, metastasis, migration, and apoptosis.7 Of particular importance is the association with cancer cell proliferation and metastasis, as these are two hallmarks of malignancy and the leading causes of cancer-related death.5 In addition, many studies have shed light on tumor-targeting therapies using microRNAs as novel diagnostic and therapeutic tools.8,9
The Cancer Genome Atlas (TCGA) project provides researchers with a set of comprehensive tools that can be used to analyze clinical and genetic signatures of a variety of cancers including breast carcinoma. In this study, we retrieved breast carcinoma data from TCGA to construct a three-microRNA signature that can be used to predict the prognosis of breast cancer, and we verified the signature using both statistical and experimental methods.
Materials and methods
TCGA breast invasive carcinoma data set
The clinical information and expression levels from 1,158 microRNAs of 1,098 patients with breast as the primary cancer site were downloaded from TCGA (https://cancergenome.nih.gov/) on May 4, 2017. Patients were screened by the following criteria for inclusion: 1) the patients were female; 2) the patients had no preoperative treatment; 3) the patients’ sample types were primary tumor; 4) the patients had fully characterized microRNA profiles; and 5) the percentage of necrosis in samples was <40% on both the top and bottom slides. Patients who were alive but missing the date of last contact were excluded. A total of 253 breast invasive carcinoma patients were identified for further study according to the selection criteria. The total set was randomly separated into a training set (153 patients) and a validation set (100 patients).
Construction and validation of the integrated microRNA signature
The microRNA signature was constructed in the training set. A total of 1,158 microRNA expression levels were presented as reads per million (RPM) microRNA mapped data. Any microRNA expression level reads where microRNAs equaled 0 RPM in >40% observations were excluded. After transformation into binary variables according to the median expression level, univariate Cox models were generated for preliminary screening of microRNAs that were significantly correlated with overall survival (OS). A cut-off P-value of <0.05 was used to filter out significant parameters. Clinical characteristics that were previously reported to be associated with prognosis, including age at diagnosis, N stage, T stage, metastasis, ER, PR, and Her2, were also similarly evaluated in the univariate Cox models. We then generated general multivariate stepwise Cox regression models to determine which of the significant microRNA identified by univariate proportional hazards regression was an independent predictor of prognosis. OS time was calculated from the date of the initial pathological diagnosis to the date of death.
The permutation test was used to evaluate the performance and randomness of the final multivariate model. Using the combination of patient OS time and vital status as a label, each patient was assigned a label and risk score under the microRNA scoring system. A random system was constructed by assigning labels while the risk score was kept consistent within each individual. The random system was tested for significance in predicting survival. If the model performed well, the random system was not a predictor of prognosis, and the area under the curve (AUC) of the receiver operating characteristics (ROC) curve would approach 0.5. We generated 1,000 random systems. A cut-off P-value of <0.05 was used to indicate a significant association between AUCs of the random system and the label system. We would conclude that the label system had no effect on outcome unless the calculated P-value was smaller than 0.05. A validation set containing 100 patients was used to test the prognostic value of the microRNA signature. These analyses were performed using R software (version 3.3.2, https://www.r-project.org/).
Bioinformatics analysis
Targetscan7.1 (http://www.targetscan.org/vert_71/), DIANA-microT,10 miRWalk,11 miRanda (http://www.microrna.org/microrna/home.do), PicTar (http://www.pictar.org/), and miRDB12 were used to identify the target genes of three microRNAs. To increase accuracy, only target genes predicted by a minimum of three programs were retained for further analysis. Lists of target genes were submitted to DAVID Bioinformatics Resources 6.8 (https://david.ncifcrf.gov/) to annotate the biological functions of the candidate microRNAs. Subsequently, Gene Ontology (GO) function, Kyoto Encyclopedia of Genes and Genomes (KEGG) pathway enrichment analysis,13 and PANTHER™ Version 11 analyses were conducted. Pathways with fold enrichment >1.5 and P<0.05 were considered to be of interest.14
Cell lines and culturing method
After evaluating qRT-PCR (data not shown) for the expression of the three microRNAs together with our statistical analysis results, we ultimately chose the cell line MDA-MB-231 to continue further study. MDA-MB-231 was obtained from the American Type Culture Collection (Manassas, VA, USA), cultured according to the instructions, and used within 6 months after recovery from liquid nitrogen.
Transfection, cell proliferation assay, and flow cytometry
Cells were plated in six-well plates, transfected with microRNA mimic, microRNA inhibitor, and their corresponding negative controls using Lipofectamine™ 3000 Transfection Reagent (Thermo Fisher Scientific, Waltham, MA, USA) following established protocols (transfection efficiency was at least 60% as confirmed by qRT-PCR; data not shown). All microRNA oligonucleotides were synthesized by RiboBio (Guangzhou, China) and quantification was performed with a stem-loop real-time PCR microRNA kit (RiboBio, Guangzhou, China). Transfected MDA-MB-231 was seeded at a density of 5×10³ cells per well into 96-well plates and incubated at 37°C for 72 hours. Cell viability was assessed using the Cell-Counting Kit-8 (CCK-8) assay (Dojindo, Kumamoto, Japan); absorbance values were determined at 450 nm using a microplate spectrophotometer. Flow cytometry was performed using propidium iodide (PI) staining solution (Chinese Academy of Sciences, Shanghai, China) and Annexin V: fluorescein isothiocyanate (FITC) Apoptosis Detection Kit I (BD Bioscience) following the instructions provided.
Statistical analyses
Apart from the above methods, other statistical analyses were performed using IBM SPSS Statistics version 22.0 (IBM Corp., Armonk, NY, USA). Survival analysis was conducted using the Kaplan–Meier method with the log-rank test. Means ± SDs of continuous variables were calculated from at least three independent experiments. Student’s t-test was used to compare groups and Pearson’s chi-squared test to assess the correlation between variables. All statistical tests were two-sided and a P-value <0.05 was considered statistically significant.
Results
Construction of microRNA prognostic signature
Six microRNAs were identified as prognostic markers after univariate Cox model screening (Table 1). Three microRNAs (hsa-mir-31, hsa-mir-16-2, and hsa-mir-484) were identified to be independently correlated with patient prognosis in multivariate Cox regression (Table 2); higher expression of hsa-mir-484 indicated worse prognosis, while higher expression of hsa-mir-31 and hsa-mir-16-2 indicated improved prognosis. The β-coefficients (microRNA weight on OS) and status of every selected microRNA were used to calculate the risk score, as follows: risk score = (0.494 * Status of hsa-mir-484) − (0.786 * Status of hsa-mir-16-2) − (0.620 * Status of hsa-mir-31). The patients were assigned to the high-risk group if their risk score was greater than the median; otherwise, they were assigned to the low-risk group.
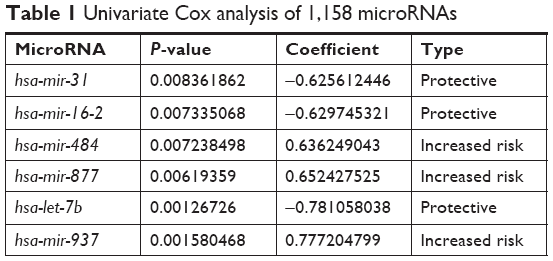 | Table 1 Univariate Cox analysis of 1,158 microRNAs |
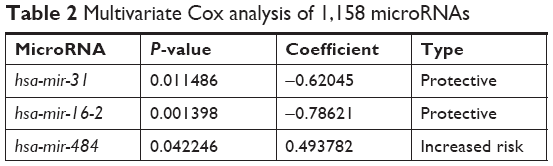 | Table 2 Multivariate Cox analysis of 1,158 microRNAs |
Performance of microRNA signature
The Kaplan–Meier and ROC analyses were applied to test the performance of the three-microRNA signature in the training set. The patients in the high-risk group had significantly worse OS than those in the low-risk group (P<0.0001) (Figure 1A). The AUC of the signature was 0.683 (Figure 1B). These results confirmed that the three-microRNA signature was powerful enough to divide breast cancer patients into high-risk and low-risk groups.
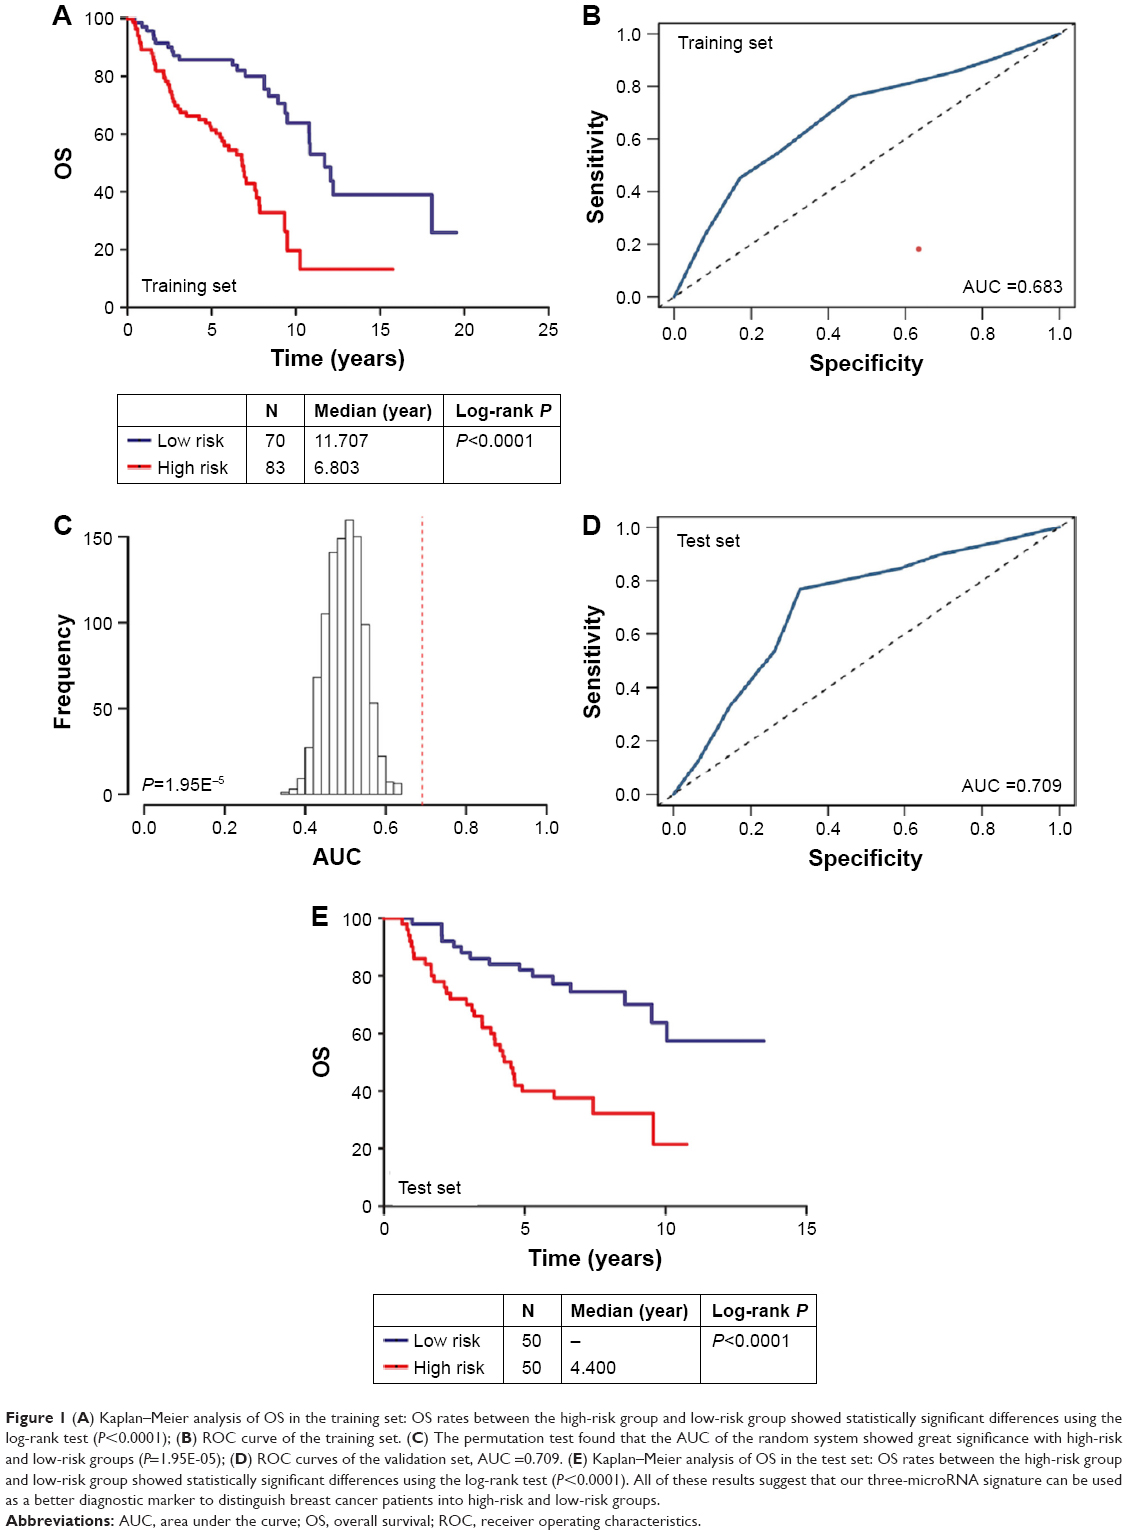 | Figure 1 (A) Kaplan–Meier analysis of OS in the training set: OS rates between the high-risk group and low-risk group showed statistically significant differences using the log-rank test (P<0.0001); (B) ROC curve of the training set. (C) The permutation test found that the AUC of the random system showed great significance with high-risk and low-risk groups (P=1.95E-05); (D) ROC curves of the validation set, AUC =0.709. (E) Kaplan–Meier analysis of OS in the test set: OS rates between the high-risk group and low-risk group showed statistically significant differences using the log-rank test (P<0.0001). All of these results suggest that our three-microRNA signature can be used as a better diagnostic marker to distinguish breast cancer patients into high-risk and low-risk groups. |
Next, we conducted a permutation test and leave-one-out cross-validation (LOO-CV) to test whether the three-microRNA signature was applicable to other breast cancer patients in the test set.15 The permutation test found that the AUC of the random system showed great significance with high-risk and low-risk groups (P=1.95E-05) (Figure 1C). In addition, the LOO-CV AUC was 0.709 (Figure 1D) and the Kaplan–Meier curve indicated that the high-risk patients had significantly worse OS (P<0.0001) (Figure 1E), which together validated the performance of the three-microRNA signature.
Subgroup analysis
After the construction and validation of the three-microRNA signature, we constructed Kaplan–Meier and ROC curves of OS in the total set (Figure 2). We then divided these patients into different subgroups according to their clinicopathological features to assess the performance of the three-microRNA signature in different groups.
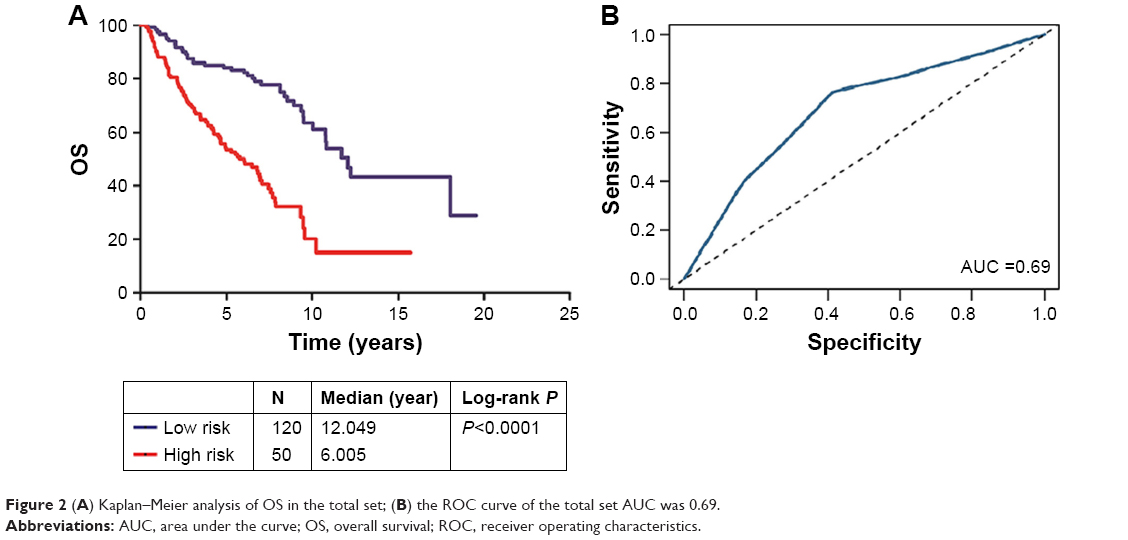 | Figure 2 (A) Kaplan–Meier analysis of OS in the total set; (B) the ROC curve of the total set AUC was 0.69. |
First, the patients were separated into three groups based on their age at diagnosis (≤45 years, 46–65 years, and >65 years). In the ≤45-year-old group, the AUC of the signature was 0.715 with a Kaplan–Meier curve P-value <0.0001 (Figure 3A and D). However, in the 46–65-year-old and >65-year-old groups, the AUCs were 0.57 and 0.561, respectively, and the Kaplan–Meier curve P-values were 0.0798 and 0.422, respectively (Figure 3B, C, E, and F).
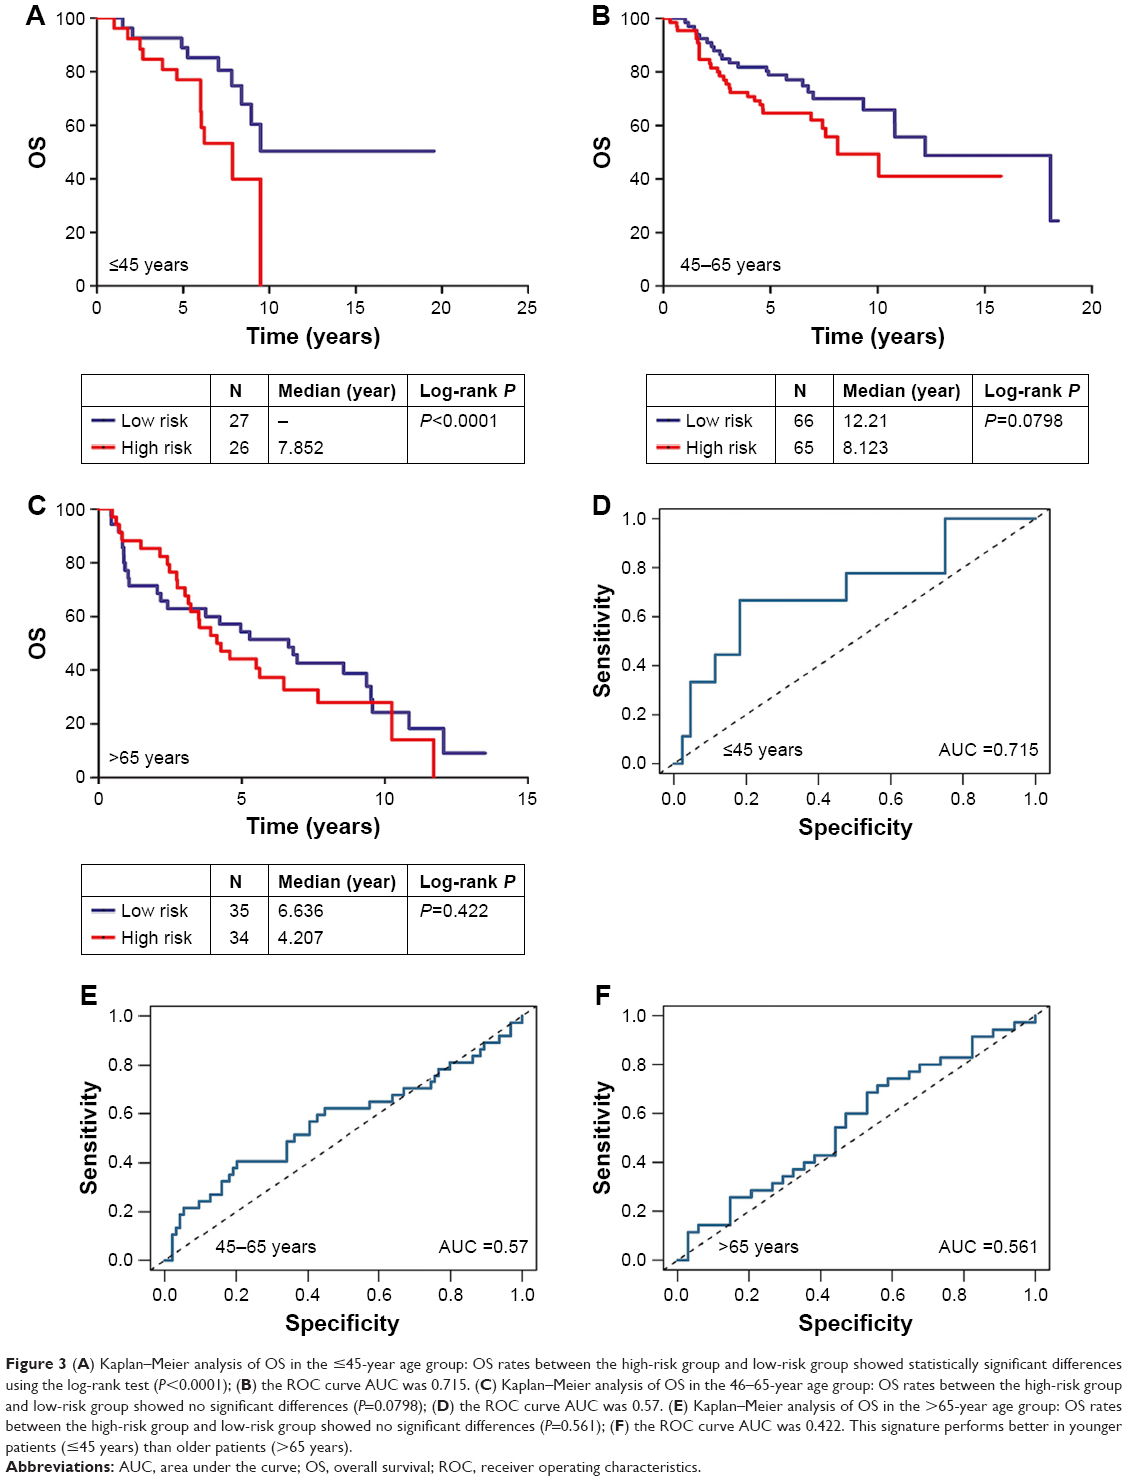 | Figure 3 (A) Kaplan–Meier analysis of OS in the ≤45-year age group: OS rates between the high-risk group and low-risk group showed statistically significant differences using the log-rank test (P<0.0001); (B) the ROC curve AUC was 0.715. (C) Kaplan–Meier analysis of OS in the 46–65-year age group: OS rates between the high-risk group and low-risk group showed no significant differences (P=0.0798); (D) the ROC curve AUC was 0.57. (E) Kaplan–Meier analysis of OS in the >65-year age group: OS rates between the high-risk group and low-risk group showed no significant differences (P=0.561); (F) the ROC curve AUC was 0.422. This signature performs better in younger patients (≤45 years) than older patients (>65 years). |
Next, we grouped the patients based on their molecular subtype. For basal-like carcinoma patients, the AUC and P-value were 0.755 and 0.003, respectively (Figure 4A and B). For luminal carcinoma patients, the AUC and P-value were 0.688 and <0.0001, respectively (Figure 4C and D). However, in the Her2-enriched subgroup, the AUC and P-value were 0.545 and 0.5532, respectively (Figure 4E and F).
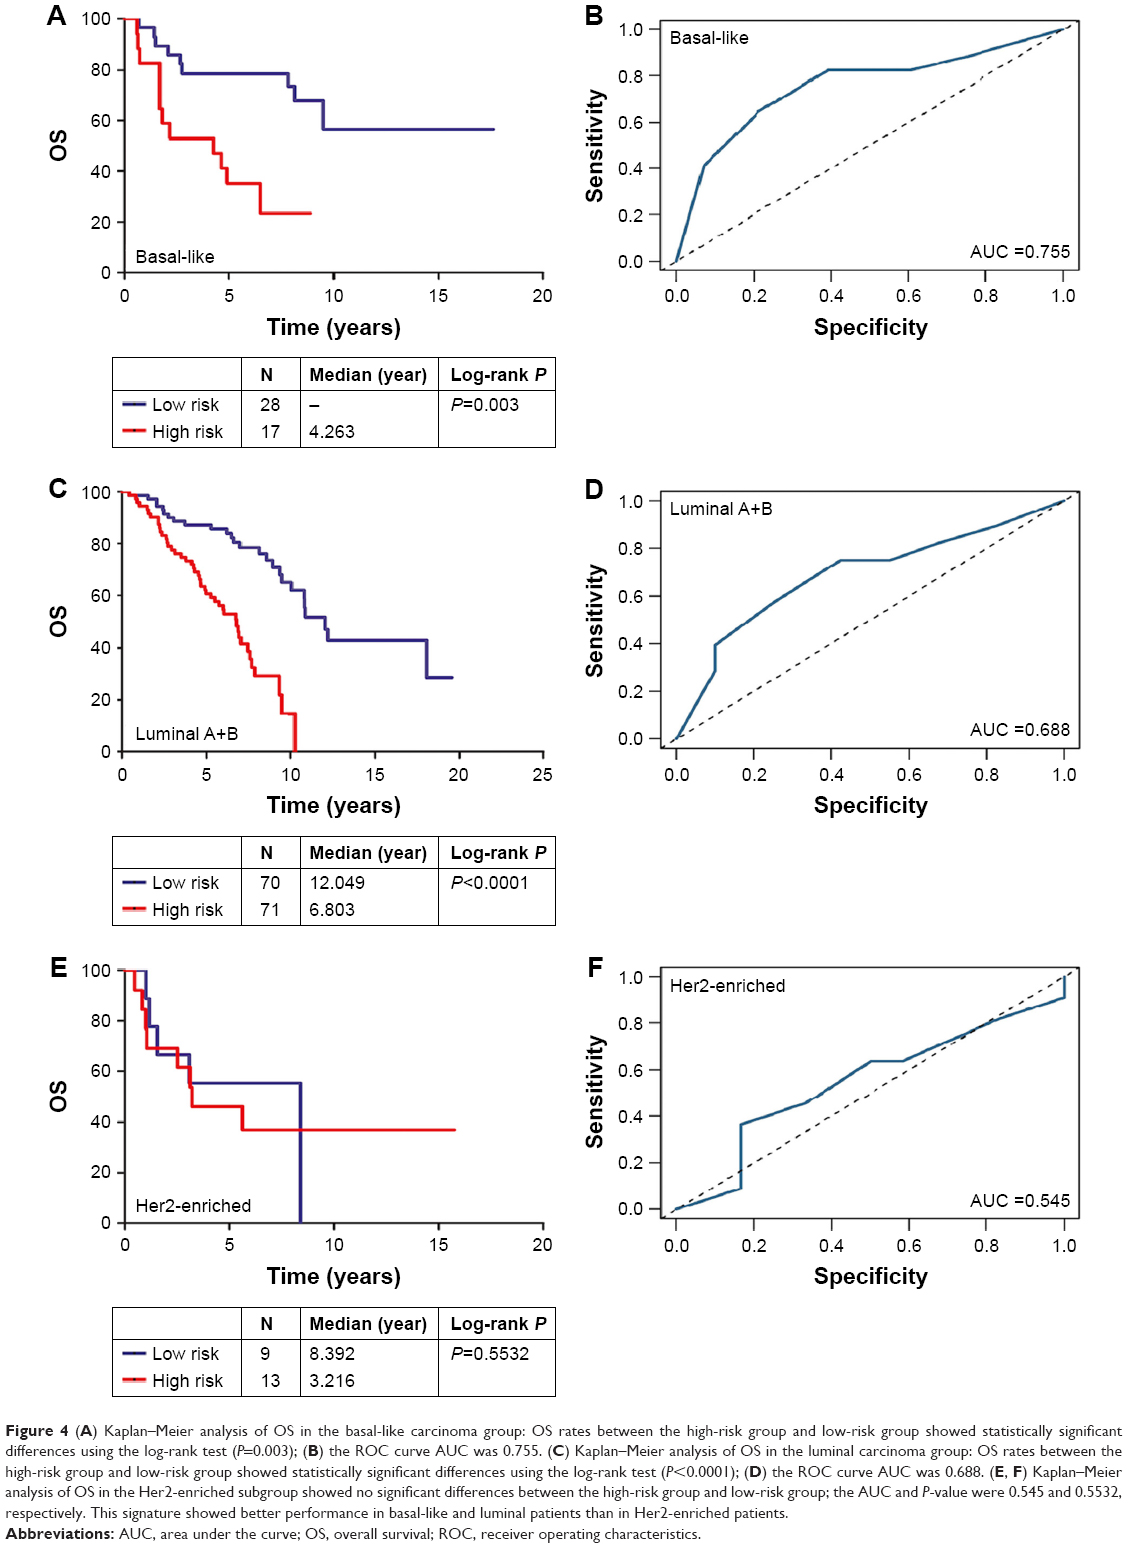 | Figure 4 (A) Kaplan–Meier analysis of OS in the basal-like carcinoma group: OS rates between the high-risk group and low-risk group showed statistically significant differences using the log-rank test (P=0.003); (B) the ROC curve AUC was 0.755. (C) Kaplan–Meier analysis of OS in the luminal carcinoma group: OS rates between the high-risk group and low-risk group showed statistically significant differences using the log-rank test (P<0.0001); (D) the ROC curve AUC was 0.688. (E, F) Kaplan–Meier analysis of OS in the Her2-enriched subgroup showed no significant differences between the high-risk group and low-risk group; the AUC and P-value were 0.545 and 0.5532, respectively. This signature showed better performance in basal-like and luminal patients than in Her2-enriched patients. |
Finally, we analyzed the relationship between tumor stage and the microRNA signature. In the American Joint Committee on Cancer (AJCC) stage I and II group, the AUC and P-value were 0.724 and <0.0001, respectively (Figure 5A and B); in the stage III and IV group, the AUC and P-value were 0.673 and <0.013, respectively (Figure 5C and D). There was no significant difference between these two groups.
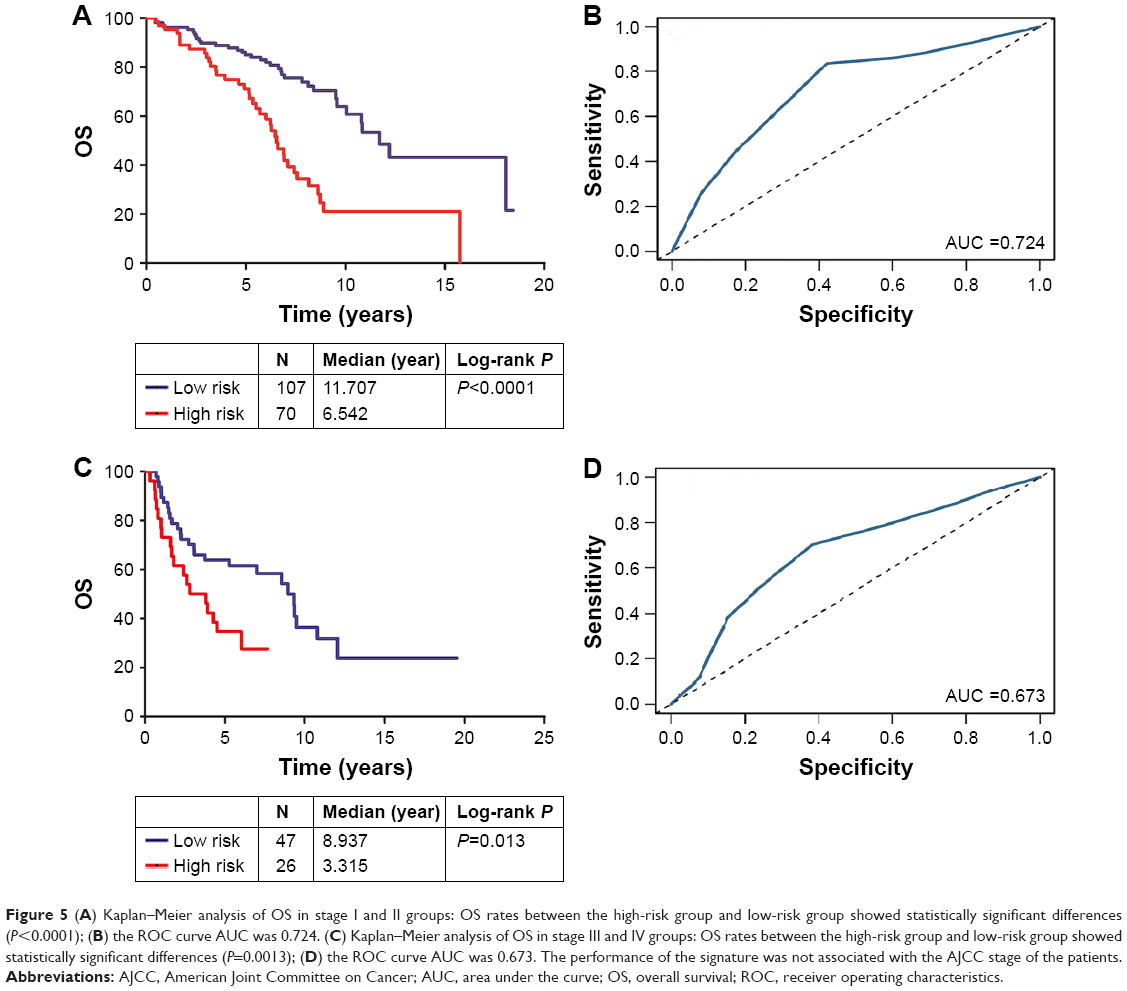 | Figure 5 (A) Kaplan–Meier analysis of OS in stage I and II groups: OS rates between the high-risk group and low-risk group showed statistically significant differences (P<0.0001); (B) the ROC curve AUC was 0.724. (C) Kaplan–Meier analysis of OS in stage III and IV groups: OS rates between the high-risk group and low-risk group showed statistically significant differences (P=0.0013); (D) the ROC curve AUC was 0.673. The performance of the signature was not associated with the AJCC stage of the patients. |
Clinical and pathological features and microRNA signature
The clinical characteristics that were utilized to fit the univariate Cox model are shown in Table 3. In our study, age at diagnosis, ER status, PR status, Her2 status, and T stage were not associated with prognosis. N stage and metastasis had significant prognostic value, with P-values of 0.000 and 0.000, respectively. After adjustment for N stage and metastasis, hsa-mir-31, hsa-mir-16-2, and hsa-mir-484 were all still independent prognostic factors (Table 4).
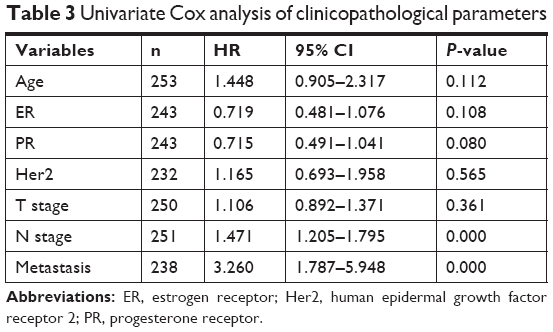 | Table 3 Univariate Cox analysis of clinicopathological parameters |
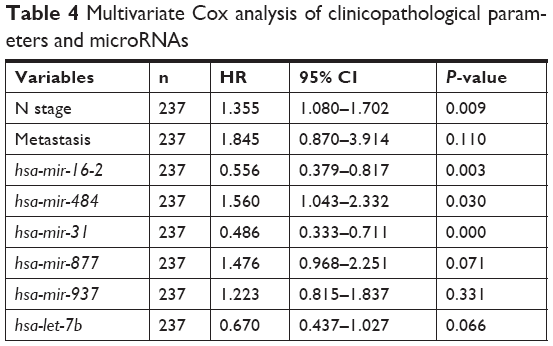 | Table 4 Multivariate Cox analysis of clinicopathological parameters and microRNAs |
The correlation between patient clinicopathological characteristics and the microRNA signature is presented in Table 5. The microRNA signature was not associated with age at diagnosis, ER status, PR status, Her2 status, T stage, N stage or metastasis.
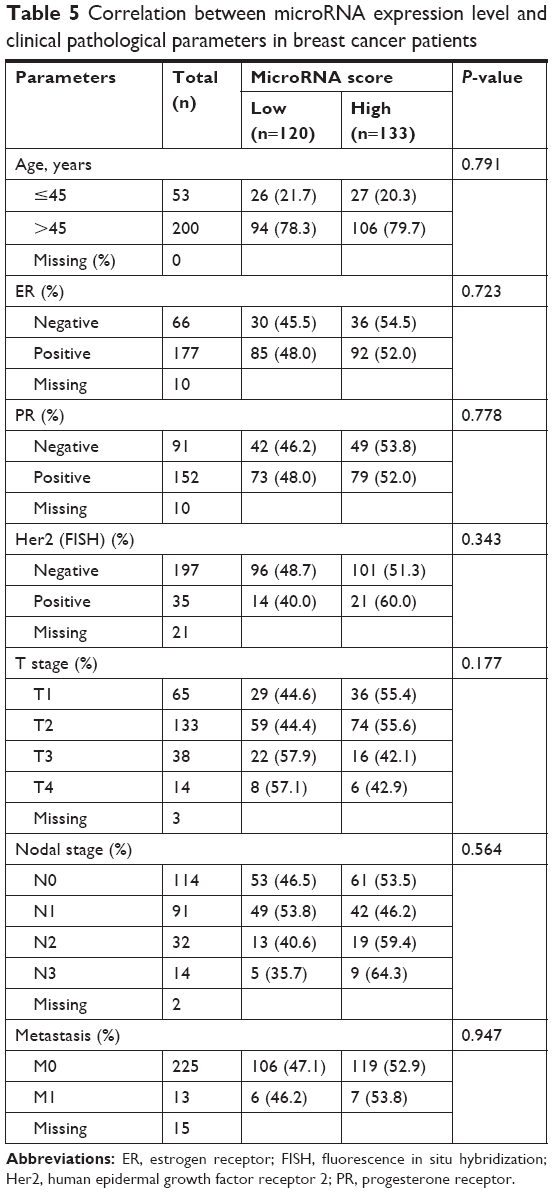 | Table 5 Correlation between microRNA expression level and clinical pathological parameters in breast cancer patients |
GO annotation and KEGG pathway analysis of hsa-mir-31, hsa-mir-16-2, and hsa-mir-484
Target genes of hsa-mir-16-2, hsa-mir-31, and hsa-mir-484, as predicted by five programs, are listed in Table 6. There were 254, 149, and 336 target genes predicted by at least three programs for hsa-mir-16-2, hsa-mir-31, and hsa-mir-484, respectively. GO annotation analysis included biological processes, cellular components, and molecular function, as shown in Table 7 (fold enrichment >1.5, P<0.05). These results indicate that these candidate targets are significantly related to biosynthesis, metabolic processes, DNA binding, and system development. Furthermore, they could be protein complex or transcription factor complex components. KEGG and PANTHER analyses indicate that the candidate targets were significantly enriched in several oncogenic signaling pathways, including Hippo (P=0.0025), Wnt (P=0.000852), epidermal growth factor (EGF) receptor (P=0.00712), fibroblast growth factor (FGF) (P=0.000458), angiogenesis (P=0.003092), adherens junction (P=0.003865), and cytokine–cytokine receptor interaction (P=0.001133), as shown in Table 8. The three microRNAs are related to breast cancer cell cycle, viability, and apoptosis in vitro.
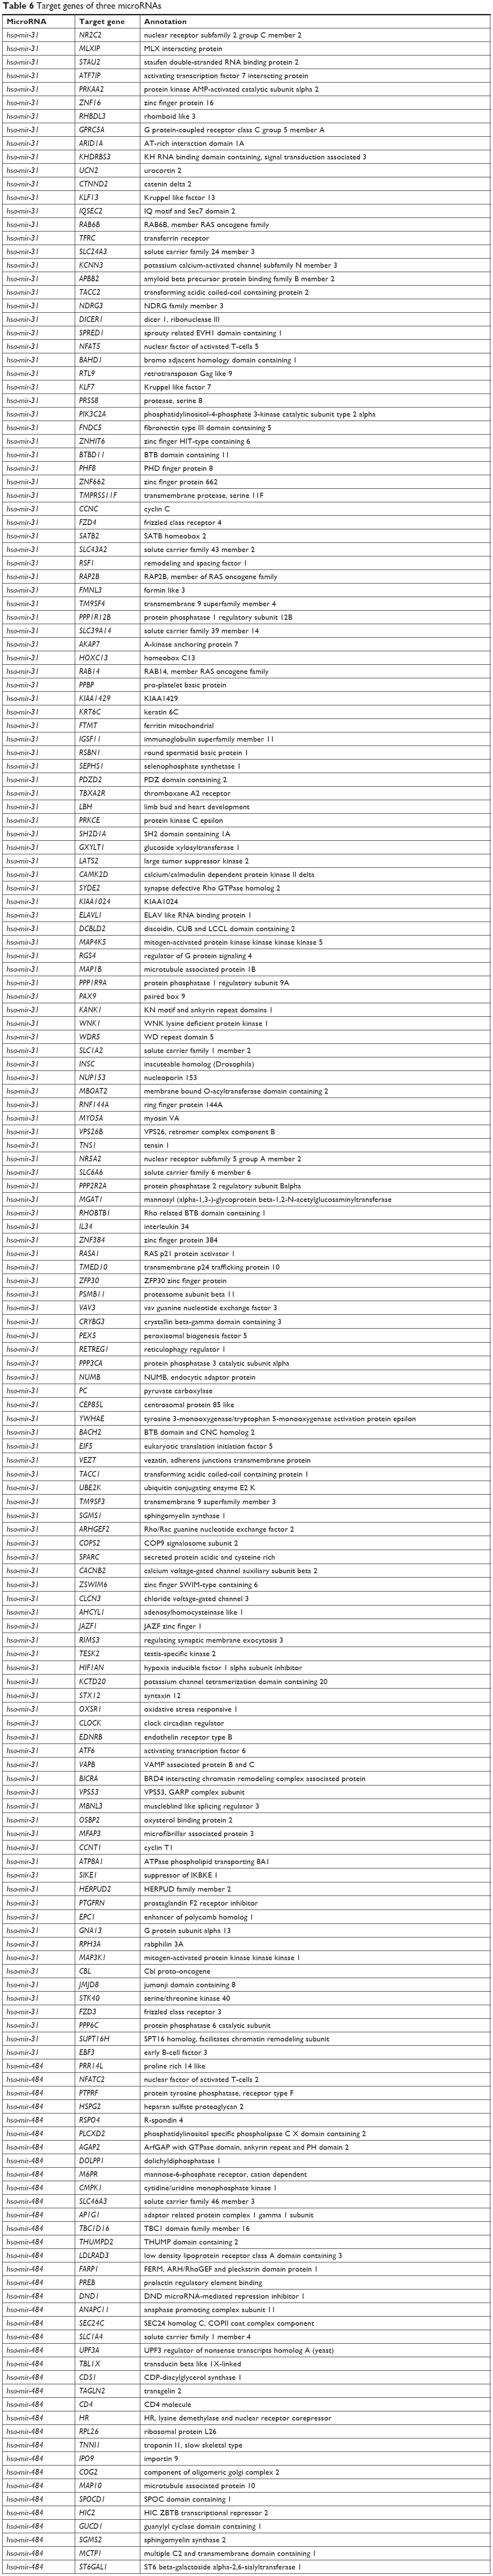 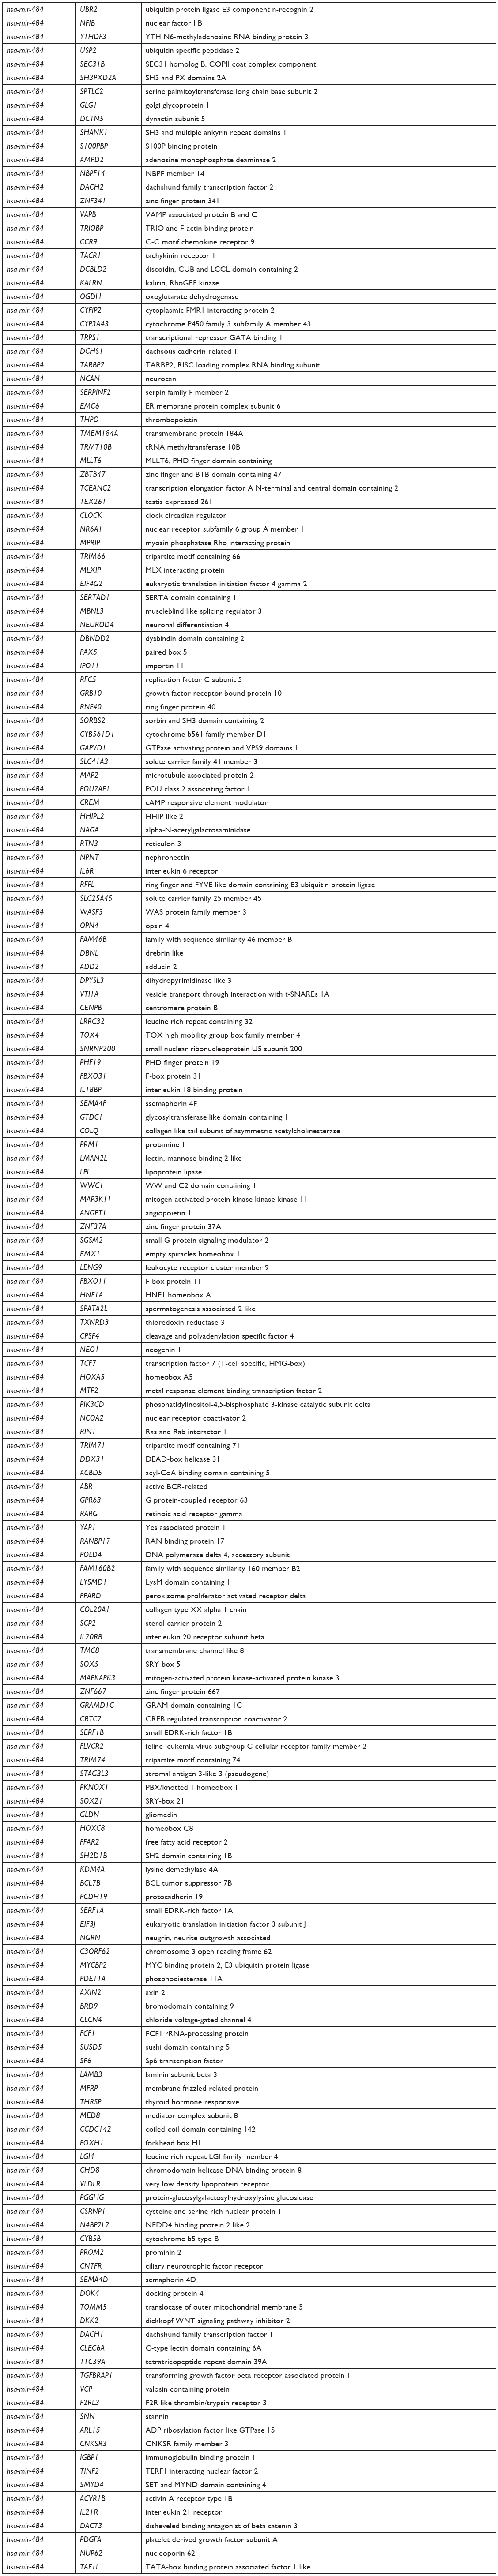 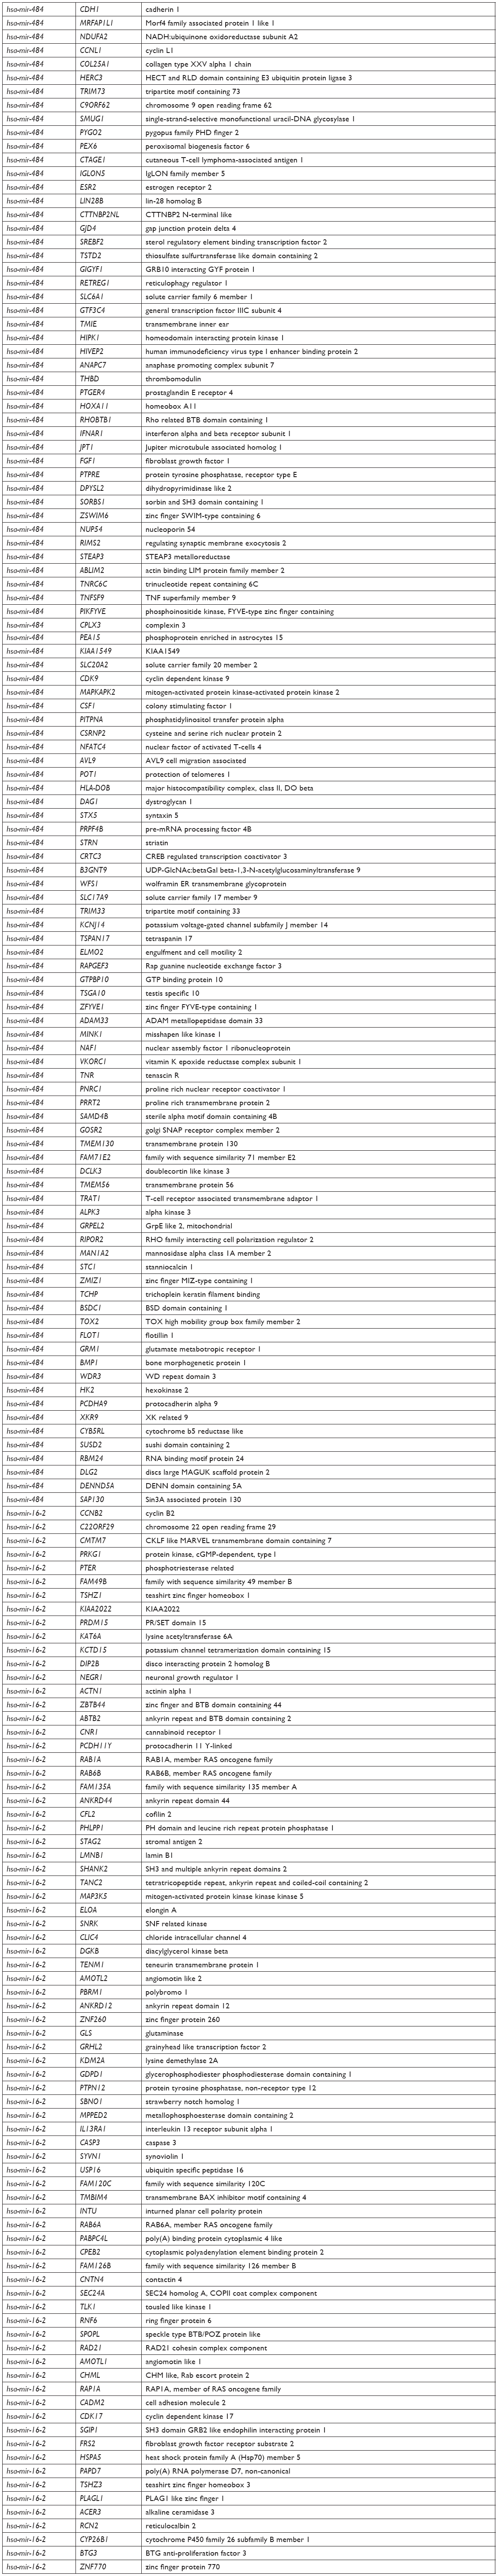 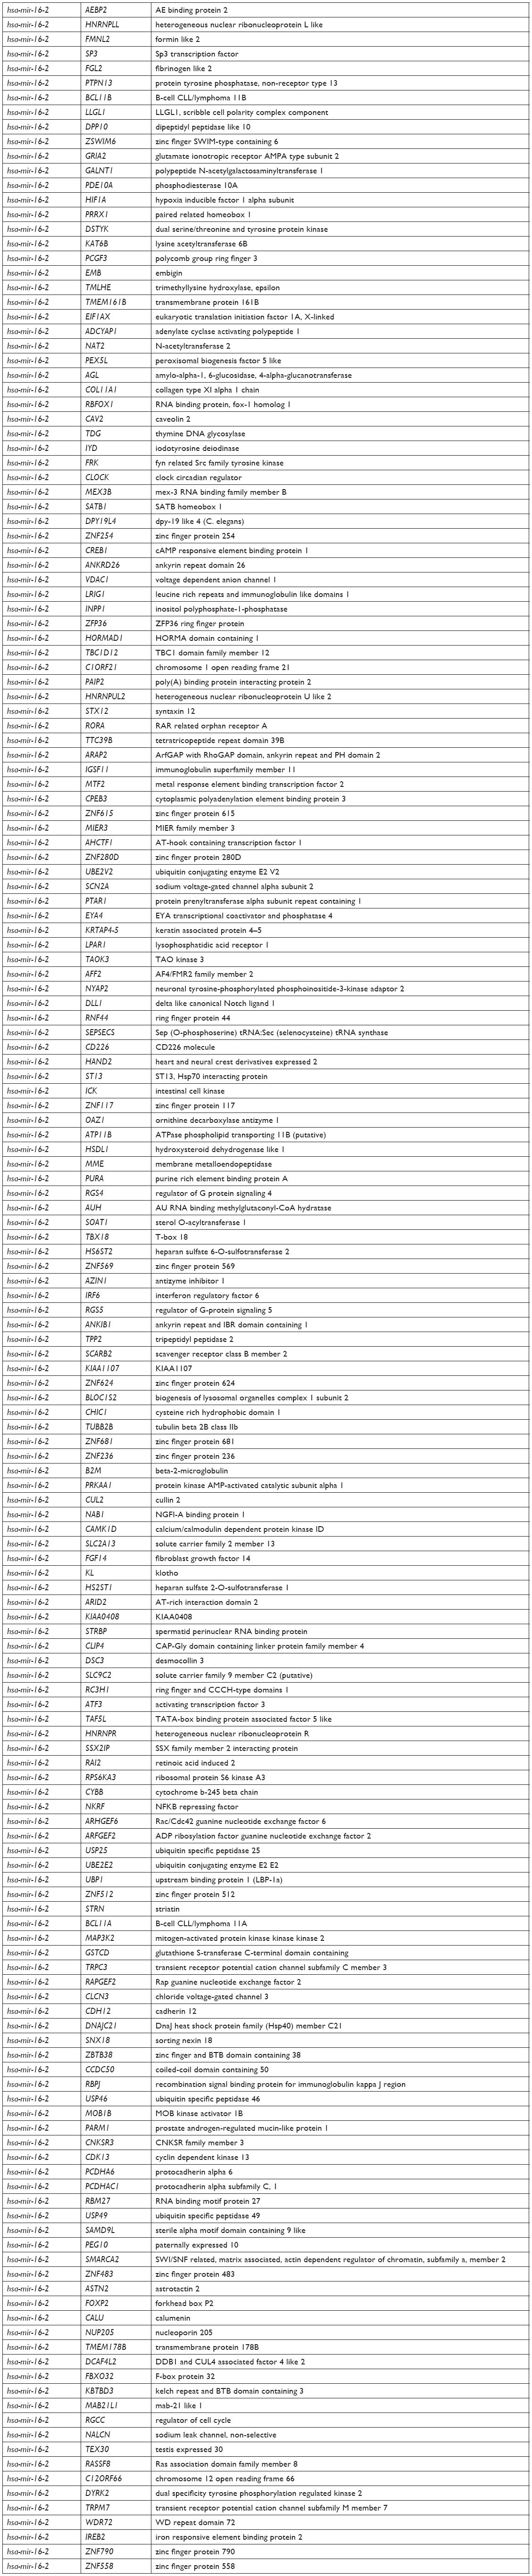 | Table 6 Target genes of three microRNAs |
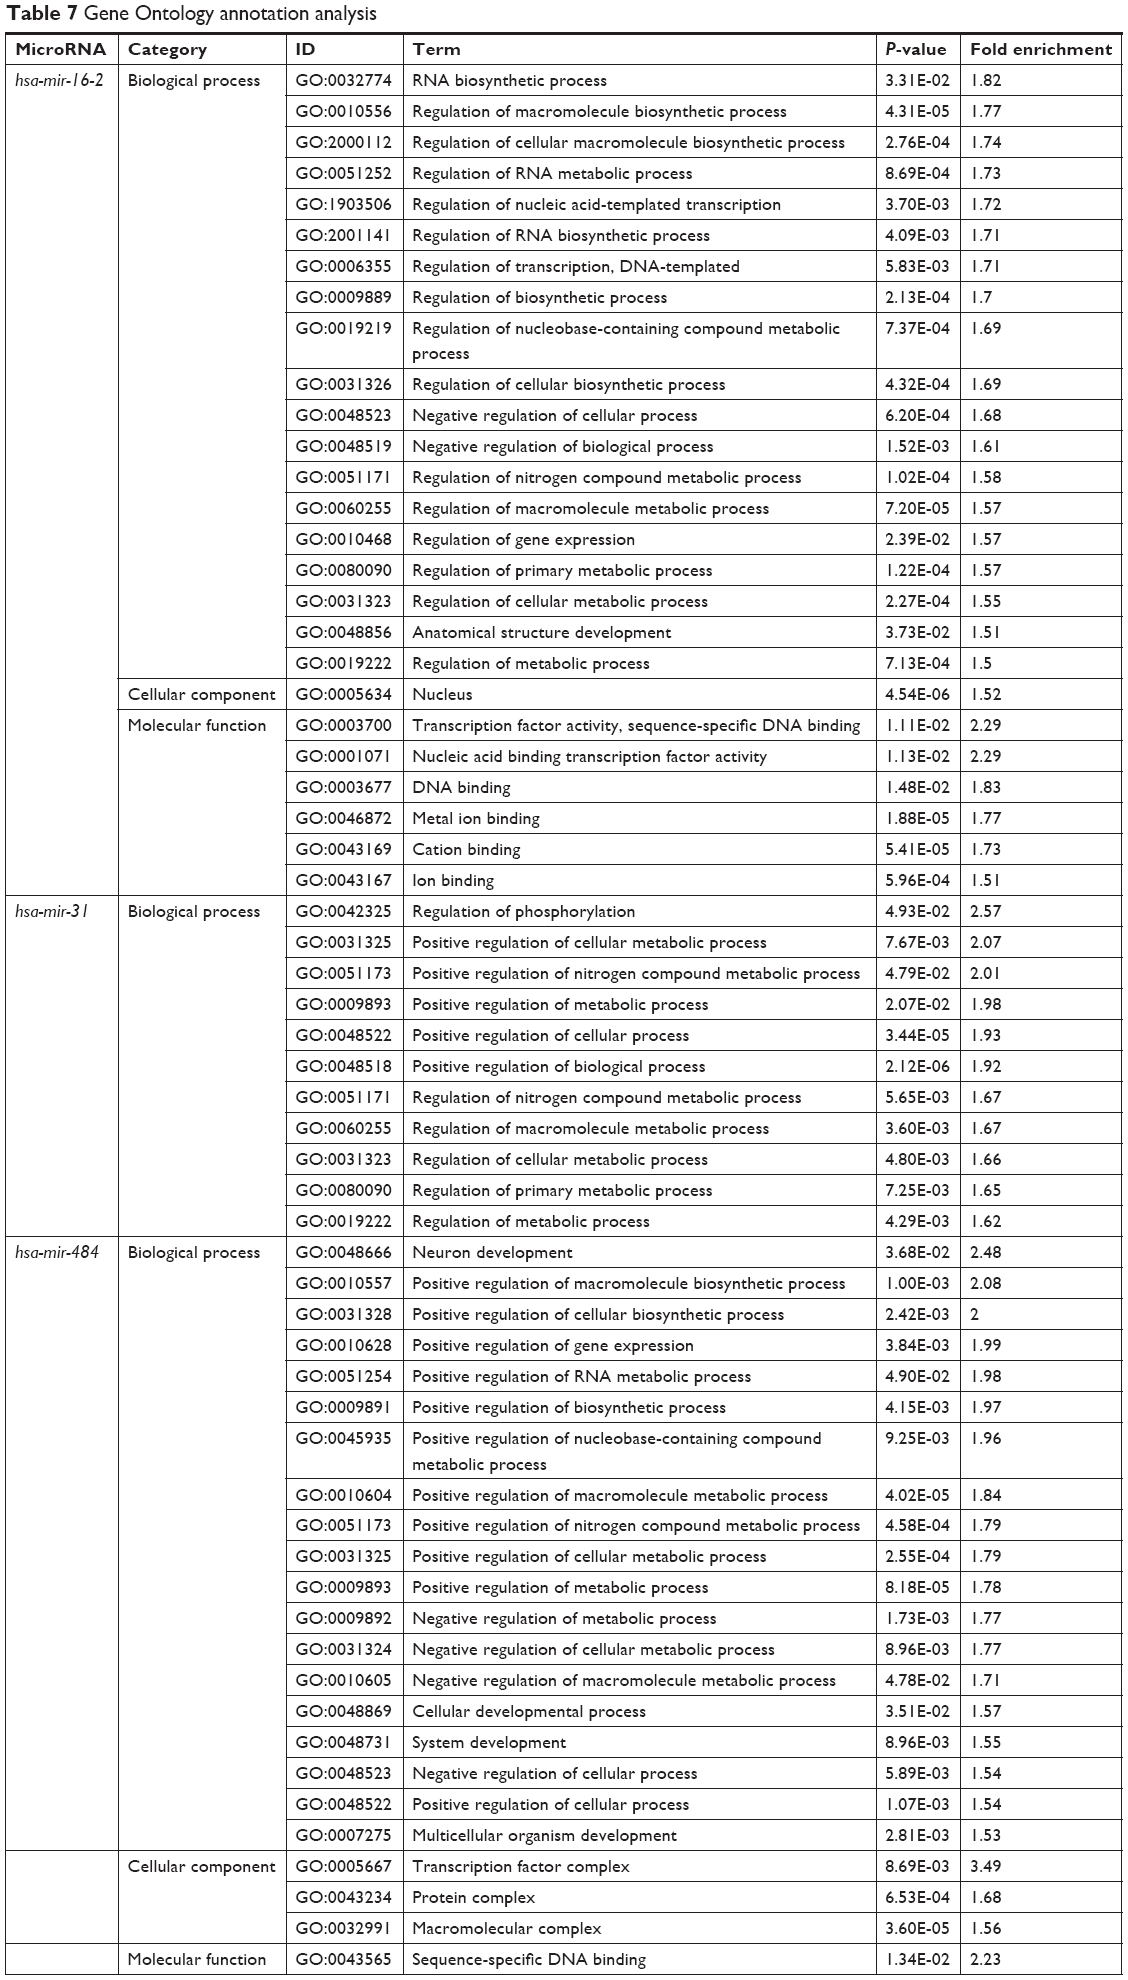 | Table 7 Gene Ontology annotation analysis |
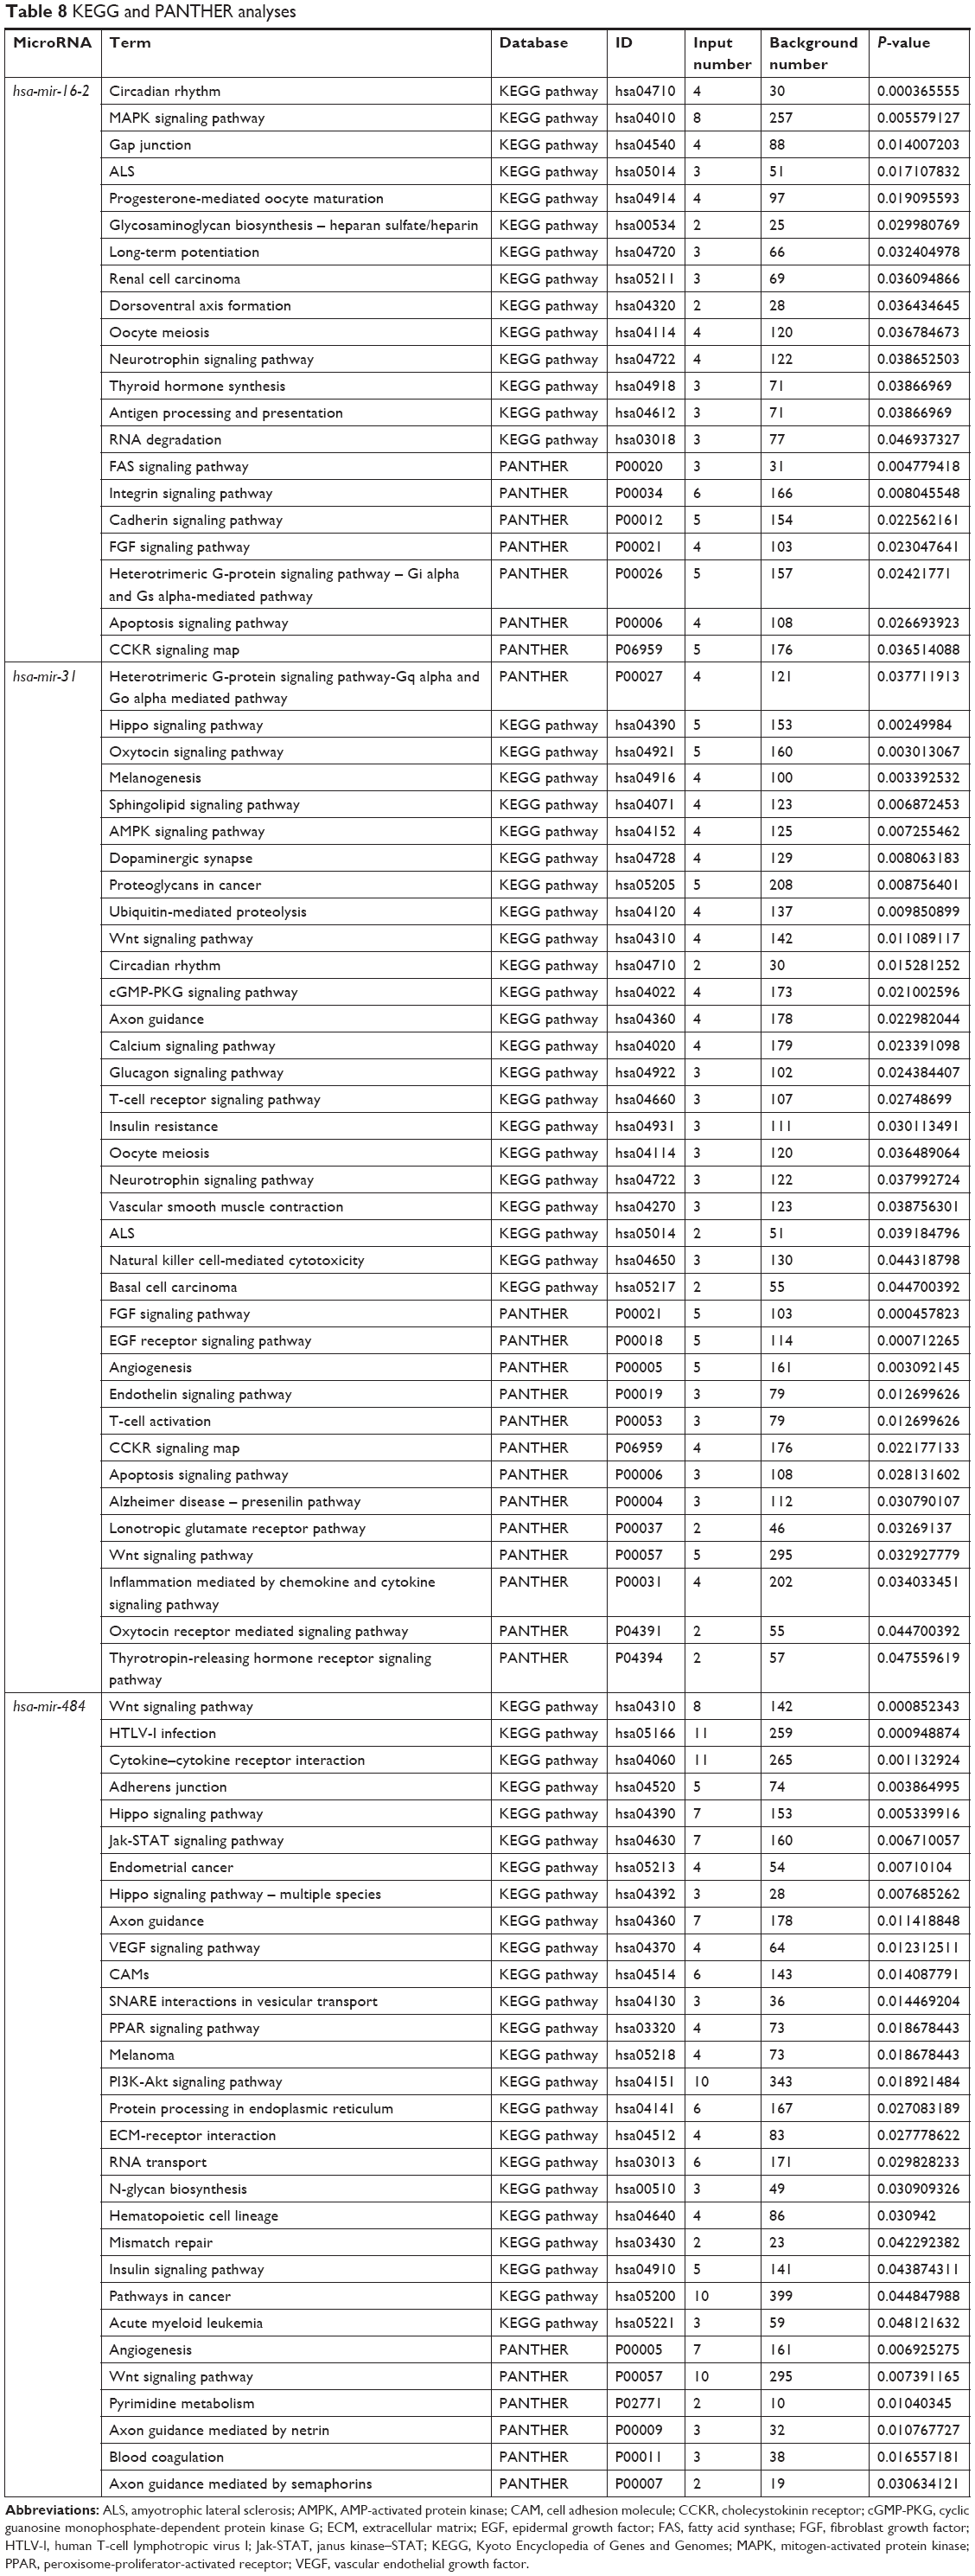 | Table 8 KEGG and PANTHER analyses |
MDA-MB-231 cells were transfected according to the β-coefficient. One group was transfected with hsa-mir-484 inhibitor, hsa-mir-16-2 mimic, and hsa-mir-31 mimic (low-risk group), a second group was transfected with hsa-mir-484 mimic, hsa-mir-16-2 inhibitor, and hsa-mir-31 inhibitor (high-risk group), and a final group was transfected with control sequences (negative control group). Cell cycle flow cytometry showed that the cell counts of S and G2/M phase were increased in both high-risk and low-risk groups compared to the negative control group (Figure 6A–D). The CCK-8 assay showed that cell viability of the high-risk group was significantly increased compared to the control group, while the viability of the low-risk group was decreased (Figure 6E). We then used an apoptosis assay to confirm whether cell apoptosis was increased in the experimental groups. Our results revealed that the apoptosis rate was 11.07% in the high-risk group (Figure 6F) and 30.49% in low-risk group (Figure 6G), while it was 12.01% in the control group (Figure 6H).
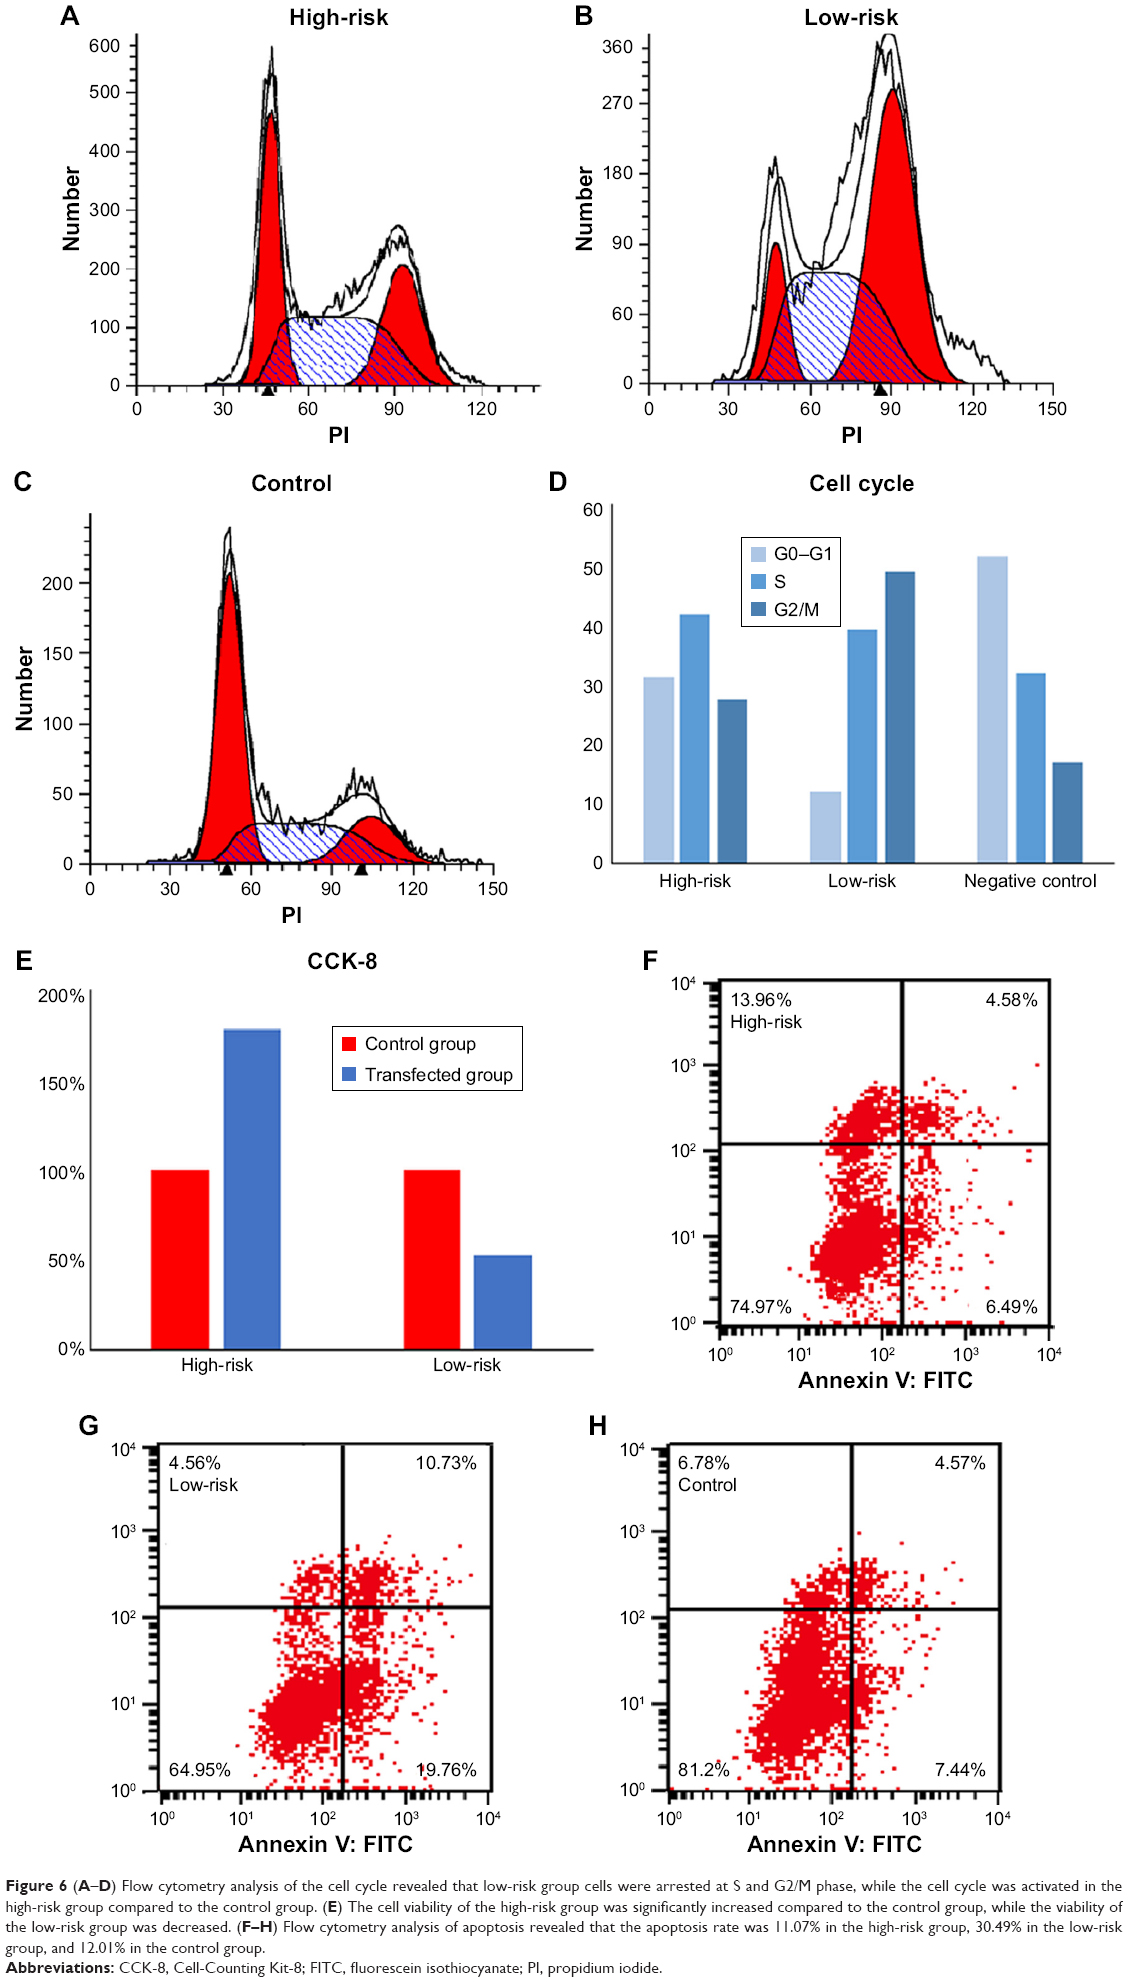 | Figure 6 (A–D) Flow cytometry analysis of the cell cycle revealed that low-risk group cells were arrested at S and G2/M phase, while the cell cycle was activated in the high-risk group compared to the control group. (E) The cell viability of the high-risk group was significantly increased compared to the control group, while the viability of the low-risk group was decreased. (F–H) Flow cytometry analysis of apoptosis revealed that the apoptosis rate was 11.07% in the high-risk group, 30.49% in the low-risk group, and 12.01% in the control group. |
Discussion
Accumulating evidence has shown that microRNA deregulation plays a pivotal role in multiple cellular and biological processes, including cell proliferation and cell apoptosis,16–19 and targets a variety of pathways as oncogenes or tumor suppressors. Recently, microRNA-based anticancer therapies have been explored, either alone or in combination with other therapies.20,21 However, only a few articles have constructed a microRNA scoring system to predict the outcome of breast carcinoma.22,23 Here, we built a three-microRNA signature (hsa-mir-31, hsa-mir-484, and hsa-mir-16-2) that proved powerful enough to be an independent prognostic factor after rounds of statistical analysis.
According to our analysis, all three microRNAs target many cancer-related pathways, including the MAPK signaling pathway,24 Hippo signaling pathway,25 EGF receptor signaling pathway,26 and Wnt signaling pathway;27 some of these have been confirmed by previous studies.28 To be specific, hsa-mir-484 was found to be associated with poor prognosis in patients receiving gemcitabine treatment for breast cancer or sunitinib treatment for metastatic renal cell carcinoma and in ovarian cancer patients demonstrating chemosensitivity.28–30 In addition, we found that circulating hsa-mir-484 is significantly differentially expressed, with decreased expression in the tumor tissue and increased expression in plasma compared to healthy volunteers.28,31–33 The microRNA hsa-mir-16-2 plays a tumor suppressor role by inducing cell cycle arrest, DNA damage repair, and apoptosis.33–35 Of the three microRNAs, hsa-mir-31 is the most studied. Previous studies show that hsa-mir-31 is a major contributor to breast cancer progression and metastasis by regulating metastasis-related genes, including RhoA, Radexin,36 WAVE3,37 RDX, SATB2,38,39 FOXP3,40 GNA13,41 and several integrin subunits,42 all involved in key steps in the invasion–metastasis cascade. In addition, hsa-mir-31 expression level is high in early-stage breast cancer tissues, diminishes as the tumor progresses to more advanced stages, and is even sometimes undetectable in metastatic tumors.36,37 Loss of hsa-mir-31 expression is accompanied by increased expression of its target genes, allowing the tumor to become more invasive and ultimately metastasize.37 In summary, these three microRNAs are involved in chemoresistance, cell cycle arrest, and metastasis, and therefore, they can theoretically predict the prognosis of breast cancer.
Of note, our analysis indicates that our prognostic signature performed especially well in young patients (age ≤45 years) with basal-like breast carcinoma. To our knowledge, triple-negative breast cancer is characterized by the lack of hormone receptors (ER and PR) and HER2 expression, a common basal-like subtype, and a high propensity for distant site metastases.43 Furthermore, effective targeted therapies beyond chemotherapy and radiotherapy are absent for triple-negative breast cancer, leading to poor clinical outcomes and a high mortality rate.44,45 These features make our signature even more valuable. We propose that high-risk patients, as determined by the calculations derived from our model, should be treated more aggressively and have a shorter follow-up interval.
Moreover, our experimental results also verified our signature. In the low-risk group, cell proliferative ability was inhibited, and S and G2/M phase cell counts were significantly increased, indicating that the cell cycle was arrested at the G2/M phase. In the high-risk group, cell proliferative ability was significantly increased combined with low cell counts in S and G2/M phase, indicating that the cells were proliferating rapidly. We also conducted an apoptosis assay in which the cell apoptosis rate was significantly increased in the low-risk group compared to the control group. Meanwhile, there was no significant difference between the high-risk group and the control group. This was not consistent with our prediction, and we propose that perhaps this signature could not significantly affect the apoptosis of breast cancer cells. Combined together, these results suggest that our signature was associated with the viability and cell cycle of breast cancer cells.
Limitations
We must acknowledge some limitations of our study. Since we excluded patients with insufficient data for analysis (such as RNA sequencing data, histological data, and follow-up data), there could be an influence of selection bias on our final results. Despite this, our microRNA signature demonstrated performance stability. As it is well accepted that microRNAs can be secreted and/or released to the local microenvironment and into the circulation,46 it may be possible to use blood or tissue samples to detect the expression level of these three microRNAs as a reference to guide the treatment of breast cancer patients.
Conclusion
We recommend more aggressive therapy and appropriate shorter follow-up intervals for patients in the high-risk group.
Availability of data and materials
All data generated or analyzed during this study are included in this published article.
Acknowledgment
This work was supported by the National Natural Science Foundation of China: Jie Ming (grant no. 81672611) and Hui Guo (grant no. 81602350).
Disclosure
The authors report no conflicts of interest in this work.
References
Siegel RL, Miller KD, Jemal A. Cancer statistics, 2017. CA Cancer J Clin. 2017;67(1):7–30. | ||
Parker JS, Mullins M, Cheang MC, et al. Supervised risk predictor of breast cancer based on intrinsic subtypes. J Clin Oncol. 2009;27(8):1160–1167. | ||
Polyak K. Heterogeneity in breast cancer. J Clin Invest. 2011;121(10):3786–3788. | ||
Di Leva G, Garofalo M, Croce CM. MicroRNAs in cancer. Annu Rev Pathol. 2014;9:287–314. | ||
Abba ML, Patil N, Leupold JH, et al. MicroRNAs as novel targets and tools in cancer therapy. Cancer Lett. 2017;387:84–94. | ||
Bartel DP. MicroRNAs: target recognition and regulatory functions. Cell. 2009;136(2):215–233. | ||
Rupaimoole R, Slack FJ. MicroRNA therapeutics: towards a new era for the management of cancer and other diseases. Nat Rev Drug Discov. 2017;16(3):203–222. | ||
Mlcochova J, Faltejskova-Vychytilova P, Ferracin M, et al. MicroRNA expression profiling identifies miR-31-5p/3p as associated with time to progression in wild-type RAS metastatic colorectal cancer treated with cetuximab. Oncotarget. 2015;6(36):38695–38704. | ||
Gandellini P, Giovannetti E, Nicassio F. MicroRNAs in cancer management: big challenges for small molecules. Biomed Res Int. 2015;2015:1–2. | ||
Maragkakis M, Vergoulis T, Alexiou P, et al. DIANA-microT web server upgrade supports fly and worm miRNA target prediction and bibliographic miRNA to disease association. Nucleic Acids Res. 2011;39(Web Server issue):W145–W148. | ||
Dweep H, Gretz N. miRWalk2.0: a comprehensive atlas of microRNA-target interactions. Nat Methods. 2015;12(8):697. | ||
Wong N, Wang X. miRDB: an online resource for microRNA target prediction and functional annotations. Nucleic Acids Res. 2015;43(Database issue):D146–D152. | ||
Huang da W, Sherman BT, Lempicki RA. Systematic and integrative analysis of large gene Lists using David bioinformatics resources. Nat Protoc. 2009;4(1):44–57. | ||
Mi H, Huang X, Muruganujan A, et al. Panther version 11: expanded annotation data from gene ontology and Reactome pathways, and data analysis tool enhancements. Nucleic Acids Res. 2017;45(D1):D183–D189. | ||
Cheng H, Garrick DJ, Fernando RL. Efficient strategies for leave-one-out cross validation for genomic best linear unbiased prediction. J Anim Sci Biotechnol. 2017;8:38. | ||
Pan YZ, Morris ME, Yu AM. MicroRNA-328 negatively regulates the expression of breast cancer resistance protein (BCRP/ABCG2) in human cancer cells. Mol Pharmacol. 2009;75(6):1374–1379. | ||
Miller TE, Ghoshal K, Ramaswamy B, et al. MicroRNA-221/222 confers tamoxifen resistance in breast cancer by targeting p27Kip1. J Biol Chem. 2008;283(44):29897–29903. | ||
Sun F, Fu H, Liu Q, et al. Downregulation of CCND1 and CDK6 by miR-34a induces cell cycle arrest. FEBS Lett. 2008;582(10):1564–1568. | ||
Mei M, Ren Y, Zhou X, et al. Downregulation of miR-21 enhances chemotherapeutic effect of taxol in breast carcinoma cells. Technol Cancer Res Treat. 2010;9(1):77–86. | ||
Jain CK, Gupta A, Dogra N, Kumar VS, Wadhwa G, Sharma SK. MicroRNA therapeutics: the emerging anticancer strategies. Recent Pat Anticancer Drug Discov. 2014;9(3):286–296. | ||
Dai X, Tan C. Combination of microRNA therapeutics with small-molecule anticancer drugs: mechanism of action and co-delivery nanocarriers. Adv Drug Deliv Rev. 2015;81:184–197. | ||
Volinia S, Croce CM. Prognostic microRNA/mRNA signature from the integrated analysis of patients with invasive breast cancer. Proc Natl Acad Sci U S A. 2013;110(18):7413–7417. | ||
Buffa FM, Camps C, Winchester L, et al. microRNA-associated progression pathways and potential therapeutic targets identified by integrated mRNA and microRNA expression profiling in breast cancer. Cancer Res. 2011;71(17):5635–5645. | ||
Sebolt-Leopold JS, Herrera R. Targeting the mitogen-activated protein kinase cascade to treat cancer. Nat Rev Cancer. 2004;4(12):937–947. | ||
Johnson R, Halder G. The two faces of Hippo: targeting the Hippo pathway for regenerative medicine and cancer treatment. Nat Rev Drug Discov. 2014;13(1):63–79. | ||
Ciardiello F, Tortora G. EGFR antagonists in cancer treatment. N Engl J Med. 2008;358(11):1160–1174. | ||
Reya T, Clevers H. Wnt signalling in stem cells and cancer. Nature. 2005;434(7035):843–850. | ||
Vecchione A, Belletti B, Lovat F, et al. A microRNA signature defines chemoresistance in ovarian cancer through modulation of angiogenesis. Proc Natl Acad Sci U S A. 2013;110(24):9845–9850. | ||
Ye FG, Song CG, Cao ZG, et al. Cytidine deaminase axis modulated by miR-484 differentially regulates cell proliferation and chemoresistance in breast cancer. Cancer Res. 2015;75(7):1504–1515. | ||
Prior C, Perez-Gracia JL, Garcia-Donas J, et al. Identification of tissue microRNAs predictive of sunitinib activity in patients with metastatic renal cell carcinoma. PLoS One. 2014;9(1):e86263. | ||
Kjersem JB, Ikdahl T, Lingjaerde OC, Guren T, Tveit KM, Kure EH. Plasma microRNAs predicting clinical outcome in metastatic colorectal cancer patients receiving first-line oxaliplatin-based treatment. Mol Oncol. 2014;8(1):59–67. | ||
Hu Z, Dong J, Wang LE, et al. Serum microRNA profiling and breast cancer risk: the use of miR-484/191 as endogenous controls. Carcinogenesis. 2012;33(4):828–834. | ||
Lovat F, Fassan M, Gasparini P, et al. miR-15b/16-2 deletion promotes B-cell malignancies. Proc Natl Acad Sci U S A. 2015;112(37):11636–11641. | ||
Sherr CJ. The Pezcoller Lecture: cancer cell cycles revisited. Cancer Res. 2000;60(14):3689–3695. | ||
Rahman M, Lovat F, Romano G, et al. miR-15b/16-2 regulates factors that promote p53 phosphorylation and augments the DNA damage response following radiation in the lung. J Biol Chem. 2014;289(38):26406–26416. | ||
Valastyan S, Reinhardt F, Benaich N, et al. RETRACTED: a pleiotropically acting microRNA, miR-31, inhibits breast cancer metastasis. Cell. 2009;137(6):1032–1046. | ||
Sossey-Alaoui K, Downs-Kelly E, Das M, Izem L, Tubbs R, Plow EF. WAVE3, an actin remodeling protein, is regulated by the metastasis suppressor microRNA, miR-31, during the invasion-metastasis cascade. Int J Cancer. 2011;129(6):1331–1343. | ||
O’Day E, Lal A. MicroRNAs and their target gene networks in breast cancer. Breast Cancer Res. 2010;12(2):201. | ||
Aprelikova O, Yu X, Palla J, et al. The role of miR-31 and its target gene SATB2 in cancer-associated fibroblasts. Cell Cycle. 2010;9(21):4387–4398. | ||
Rouas R, Fayyad-Kazan H, El Zein N, et al. Human natural Treg microRNA signature: role of microRNA-31 and microRNA-21 in FOXP3 expression. Eur J Immunol. 2009;39(6):1608–1618. | ||
Rasheed SAK, Teo CR, Beillard EJ, et al. MicroRNA-31 controls G protein alpha-13 (GNA13) expression and cell invasion in breast cancer cells. Mol Cancer. 2015;14(1):67. | ||
Augoff K, Das M, Bialkowska K, McCue B, Plow EF, Sossey-Alaoui K. miR-31 is a broad regulator of β1-integrin expression and function in cancer cells. Mol Cancer Res. 2011;9(11):1500–1508. | ||
Vaz-Luis I, Ottesen RA, Hughes ME, et al. Outcomes by tumor subtype and treatment pattern in women with small, node-negative breast cancer: a multi-institutional study. J Clin Oncol. 2014;32(20):2142–2150. | ||
Anders C, Carey LA. Understanding and treating triple-negative breast cancer. Oncology. 2008;22(11):1233–1239, 1239–1240, 1243. | ||
Carey L, Winer E, Viale G, Cameron D, Gianni L. Triple-negative breast cancer: disease entity or title of convenience? Nat Rev Clin Oncol. 2010;7(12):683–692. | ||
Cortez MA, Bueso-Ramos C, Ferdin J, Lopez-Berestein G, Sood AK, Calin GA. MicroRNAs in body fluids – the mix of hormones and biomarkers. Nat Rev Clin Oncol. 2011;8(8):467–477. |
 © 2019 The Author(s). This work is published and licensed by Dove Medical Press Limited. The full terms of this license are available at https://www.dovepress.com/terms.php and incorporate the Creative Commons Attribution - Non Commercial (unported, v3.0) License.
By accessing the work you hereby accept the Terms. Non-commercial uses of the work are permitted without any further permission from Dove Medical Press Limited, provided the work is properly attributed. For permission for commercial use of this work, please see paragraphs 4.2 and 5 of our Terms.
© 2019 The Author(s). This work is published and licensed by Dove Medical Press Limited. The full terms of this license are available at https://www.dovepress.com/terms.php and incorporate the Creative Commons Attribution - Non Commercial (unported, v3.0) License.
By accessing the work you hereby accept the Terms. Non-commercial uses of the work are permitted without any further permission from Dove Medical Press Limited, provided the work is properly attributed. For permission for commercial use of this work, please see paragraphs 4.2 and 5 of our Terms.