")
Back to Journals » International Journal of General Medicine » Volume 15
Construction of Molecular Subtypes and Related Prognostic and Immune Response Models Based on M2 Macrophages in Glioblastoma
Authors Xiao K , Zhao S, Yuan J, Pan Y, Song Y, Tang L
Received 22 October 2021
Accepted for publication 23 December 2021
Published 26 January 2022 Volume 2022:15 Pages 913—926
DOI https://doi.org/10.2147/IJGM.S343152
Checked for plagiarism Yes
Review by Single anonymous peer review
Peer reviewer comments 4
Editor who approved publication: Dr Scott Fraser
Kai Xiao,1 Shushan Zhao,2 Jian Yuan,1 Yimin Pan,1 Ya Song,2 Lanhua Tang3,4
1Department of Neurosurgery, Xiangya Hospital, Central South University, Changsha, People’s Republic of China; 2Department of Orthopedics, Xiangya Hospital, Central South University, Changsha, People’s Republic of China; 3Department of Oncology, Xiangya Hospital, Central South University, Changsha, People’s Republic of China; 4National Clinical Research Center for Geriatric Disorders, Xiangya Hospital, Central South University, Changsha, People’s Republic of China
Correspondence: Lanhua Tang
Department of Oncology, Xiangya Hospital, Central South University, Changsha, People’s Republic of China
Email [email protected]
Objectives: To identify the molecular subtypes of glioblastoma multiforme (GBM) related to M2 macrophage-based prognostic genes, then to preliminarily explore their biological functions and construct immunotherapy response gene models.
Material and Methods: We used R language to analyze GBM microarray data, and other tools, including xCell and CIBERSORTx, to identify subtypes of GBM that related to M2 macrophages. The process started with the exploration of biological functions of the two subtypes by pathway analyses and GSEA, and continued with a combined procedure of constructing an M2 macrophage-related prognostic gene model and exploring the immune treatment response for GBM.
Results: A high abundance of M2 macrophages in GBM was associated with poor prognosis. According to M2 macrophage-related prognostic genes, GBM was divided into two subtypes (cluster A and cluster B). The differential gene enrichment analysis of the two clusters showed that cluster A was less enriched in M2 macrophages and had immunopotential. The M2score, which was constructed based on M2 macrophage-related prognostic genes, was not only related to the survival and prognosis of patients with GBM, but also predictive of the effectiveness of immunotherapy in these patients. This result has been effectively verified in an external data set.
Conclusion: GBM was successfully divided into two subtypes according to M2-macrophage-related prognostic genes. In GBM, a high M2score may indicate better clinical outcome and enhancement of the immunotherapy response.
Keywords: glioblastoma, M2 macrophage, prognosis, immunotherapy, molecular subtypes
Introduction
Glioblastoma multiforme (GBM) is the most aggressive and deadliest primary brain tumor of adults.1 Although many treatments, including surgical resection with chemotherapy and radiotherapy, may improve the outcome, the median survival time is still only 14–16 months2 and the 5-year survival rate is just 9.8%.3 GBM is a biologically heterogeneous intracranial neoplasm and it has most of the classical hallmarks of a tumor. The poor prognosis in GBM is due to significant differences between patients and the wide dissemination of cancer cells before diagnosis.4 Even if resections are repeatedly performed, recurrence can be predicted with certainty.5 Recent studies have focused on genetic and epigenetic research to discover the subtypes of GBM with different prognoses, and to guide personalized therapies targeting specific molecules or pathogenies. However, the challenge remains that GBM is still incurable, while any progress and achievements have been limited.
Over the past decade, immunotherapy has revolutionized the field of oncology and developed into one of the most effective cancer therapies for many fatal cancers, such as melanoma and colorectal cancer, which largely explains its success. The main breakthrough came with immune checkpoint blockade (ICB) therapy. Among the immune check inhibitors, monoclonal antibodies, including PD-1/PD-L1 and CTLA-4 inhibitors, have provided promising therapeutic outcomes. However, GBM has benefited little from immune checkpoint inhibitors so far. The poor results may be caused by several mechanisms, including the heterogeneous nature of GBM and the immunosuppressive status of the tumor microenvironment.
Tumor-associated macrophages (TAMs), accounting for approximately 30–50% of the bulk in GBM, play an important role in cancer maintenance and progression. TAMs have different phenotypes owing to their activation state. M0 is a precursor “pre-activation” state, which can polarize into “classical” (M1) with seemingly anti-tumor functions and “alternative” (M2) with pro-tumor effects due to chemokines and cytokines.6 M2 macrophages play a pivotal role in immune suppression and pro-tumor functions during GBM progression through the secretion of immunosuppressive factors.7 A high ratio of M2/M1 in TAMs results in poor clinical prognosis, and inhibiting the polarization of M0 to M2 could dramatically reduce the growth of glioma stem cells. Gordon et al found that PD-1 expression by TAMs had anti-phagocytic and tumor immunity inhibition effects, implying that PD-1 may also function through a direct effect on macrophages, other than modulating T cells.8 The underlying mechanism of M2 macrophages in GBM has great significance for estimating the prognosis of GBM patients and improving the therapeutic outcome.
According to the expression patterns, GBM tumors were originally grouped into four subtypes: neural, proneural, classical and mesenchymal.9 The revised classification system then eliminated the neural subtype owing to normal brain tissue contamination.10 Although many other classification systems have been developed,11–14 no M2 macrophage-based molecular subtypes have been reported. We hypothesized that analyzing the M2 macrophage-related prognostic gene expression pattern in GBM could enable us to differentiate the subtypes efficiently. This new classification system would provide us with a new direction for GBM prognosis and response to therapies.
Methods
Dataset Acquisition from GlioVis Database
GlioVis is a web-based database for data visualization and analysis to explore brain tumor expression datasets.15 This user-friendly database offers the research community an unprecedented fast and intuitive portal to molecular profiles.15 The Cancer Genome Atlas–Glioblastoma Multiforme (TCGA-GBM) and a GBM dataset reported by Gravendeel et al,16 including corresponding clinical data, were obtained for downstream study. The relevant CEL files were downloaded and the robust multiarray average (RMA) normalized analysis was applied. Then, the probe was converted into gene symbols by the R program and the batch effects were removed before downstream analysis.17 GBM patients with complete outcome data and expression data were included in the subsequent analysis. Somatic mutation datasets of TCGA-GBM and The Cancer Genome Atlas Low-Grade Glioma (TCGA-LGG) were downloaded from TCGA, and copy number variation (CNV) data were obtained from the University of California, Santa Cruz (UCSC) Xena website (http://xena.ucsc.edu/). No additional ethical approval was applicable, owing to the data being publicly available.
Tumor Immunity Analyses and WGCNA
The immune and stromal cell expression profiles of all GBM samples were qualified using xCell tools (https://xcell.ucsf.edu). xCell is a simple web tool that calculates independent enrichment scores of 64 kinds of immune and stromal cells based on enrichment.18
Weighted gene co-expression network analysis (WGCNA) was applied to explore the correlations between immune-related genes and immune cell types by constructing significant modules. WGCNA was conducted using the “WGCNA” package for R (version 3.6.2).19 The immune-related gene list was downloaded from the immunology database and analysis portal (ImmPort) system. First, both the average linkage method and Pearson’s correlation matrices were applied to establish the co-expression similarity matrix. To enhance the matrix similarity and construct a co-expression network, appropriate β-values were selected. Next, the adjacency matrix was transformed into a topological overlap matrix (TOM) to determine immune cell connectivity. Finally, an average linkage hierarchical clustering tree was established according to TOM-based dissimilarity, and immune cells with similar expression profiles were clustered to form modules.20 The associations between immune cell type and immune-related genes were evaluated by Pearson’s correlation analysis.
Discovering Subtypes of GBM
To distinguish cancer subtypes based on M2 macrophages, we repeatedly perturbed the data and partitioned the patients using a classical clustering algorithm.21 A range of potential cluster numbers K was explored to evaluate the stability and consistency of the clustering, determine the clustering numbers of samples and establish the consistent clustering algorithm. Two principles were applied to select the number K: first, the growth rate of the cumulative distribution function (CDF) value should be low; second, the correlation in the group should be high, while there should be no small clusters in the clustering group.22 Classification of TCGA-GBM patients into various clinically significant subtypes was performed using the “ConsensusClusterPlus” package in this process. For the purpose of elucidating the molecular mechanism of patients in the different clusters, gene set enrichment analysis (GSEA) was conducted by comparing the patients in the different clusters.
Identification of Differentially Expressed Genes in Different Clusters
The mRNA expression profiles extracted from patients in different clusters were subjected to differential expression analysis by the R software package. The differentially expressed genes (DEGs) were selected according to the criteria: P<0.05, |log2FC)| >1. The “limma” package of R was conducted to find DEGs.23 The Gene Ontology (GO) pathway enrichment of DEGs was performed, and a P-value less than 0.05 was set to indicate a significant difference.
Establishment of the M2 Macrophage-Related Gene Signature and Prognostic Model Construction
Based on the M2 macrophage-related genes, principal component analysis (PCA) was used to construct the M2 macrophage-related prognostic model (M2score). PCA1, PCA2, PCA3, PCA4 and PCA5 were extracted to serve as the M2score, since PCA1–PCA5 made independent contributions to more than 70% of the overall explained variation. This method focused the score on the set with the largest block of well-correlated genes in the set, while the contributions from other genes, which did not track with other set members, were decreased.24 After obtaining the prognostic value of each gene signature score, we applied an algorithm similar to GGI25 to define the M2score of each patient:

where j is the expression of genes.
Protein–Protein Interaction (PPI) Network Construction and Identification of Hub Genes
The PPI network was constructed using the Search Tool for Retrieval of Interacting Genes (STRING) (https://string-db.org) and Cytoscape software.26 MCODE, a Cytoscape plugin,27 was applied to analyze significant modules in the PPI network. We used the default settings, with degree cutoff at 2, node score cutoff at 0.2, K core at 2 and a maximum depth of 100 to infer modules. The PPI network topological structure and relationship characteristics, including MCC, DMNC, MNC, Degree, EPC, BottleNeck, EcCentricity, Closeness, Radiality, Betweenness, ClusteringCoefficient and Stress, were calculated using the CytoHubba plugin, and the top ranked genes can be considered as the hub genes.
Prediction of Immunotherapy Response
The IMvigor210 cohort is an urothelial carcinoma cohort treated with atezolizumab, an anti-PD-L1 antibody approved by the FDA. This cohort, which is based on the Creative Commons 3.0 License, was used to predict the patients’ response to immunotherapy.28 The clinical information and complete expression data were obtained from http://research-pub.Gene.com/imvigor210-corebiologies. The raw data were normalized and the count value was transformed into the TPM value.
Tumor Immune Dysfunction and Exclusion (TIDE) is a web platform (http://tide.dfci.harvard.edu) that infers gene functions in modulating tumor immunity and evaluates biomarkers to predict the ICB clinical response.29 The TIDE algorithm is a calculation method and can evaluate two different tumor-immune escape mechanisms, namely, the dysfunction of tumor-infiltrating cytotoxic T lymphocytes (CTLs) and the rejection of CTLs by immunosuppressive factors.30 Patients with a higher TIDE score have a higher chance of anti-tumor immune escape, while patients with lower TIDE score show a lower ICB treatment response rate.31
Statistical Analysis
The expression of immune-related genes in tumor and normal tissues was compared by one-way ANOVA. The clinical characteristics between the two groups were analyzed by the chi-squared test. The Kaplan–Meier method was applied for the logarithmic rank test in survival analysis. The waterfall function in the “maftools” package was used to visualize the mutational landscape in TCGA-GBM and TCGA-LGG patients. The area under the curve (AUC) of the receiver operating characteristics (ROC) curve was applied to evaluate the performance of the prognostic signature using the R package. All statistical analyses were performed using the R program (version 3.6.1, https://www.r-project.org/). A P-value of 5% or lower was considered to be statistically significant.
Results
Low Fractions of M2 Macrophage Are Associated with Better Overall Survival in GBM
After downloading and processing the data from TCGA and Gravendeel, the gene expression profiles were obtained and then uploaded to the xCell website to analyze the different immune cell fractions. The fractions of M2 macrophages were significantly different in the GBM subtypes, with the mesenchymal subtype having the highest fraction (Figure 1A and B). According to the M2 macrophage fractions, patients were divided into high- and low-fraction groups. The overall survival was analyzed by the Kaplan–Meier survival curve and the results demonstrated that the groups with low fractions of M2 macrophages in both TCGA (Figure 1C) and Gravendeel datasets (Figure 1D) were significantly associated with better outcomes in GBM.
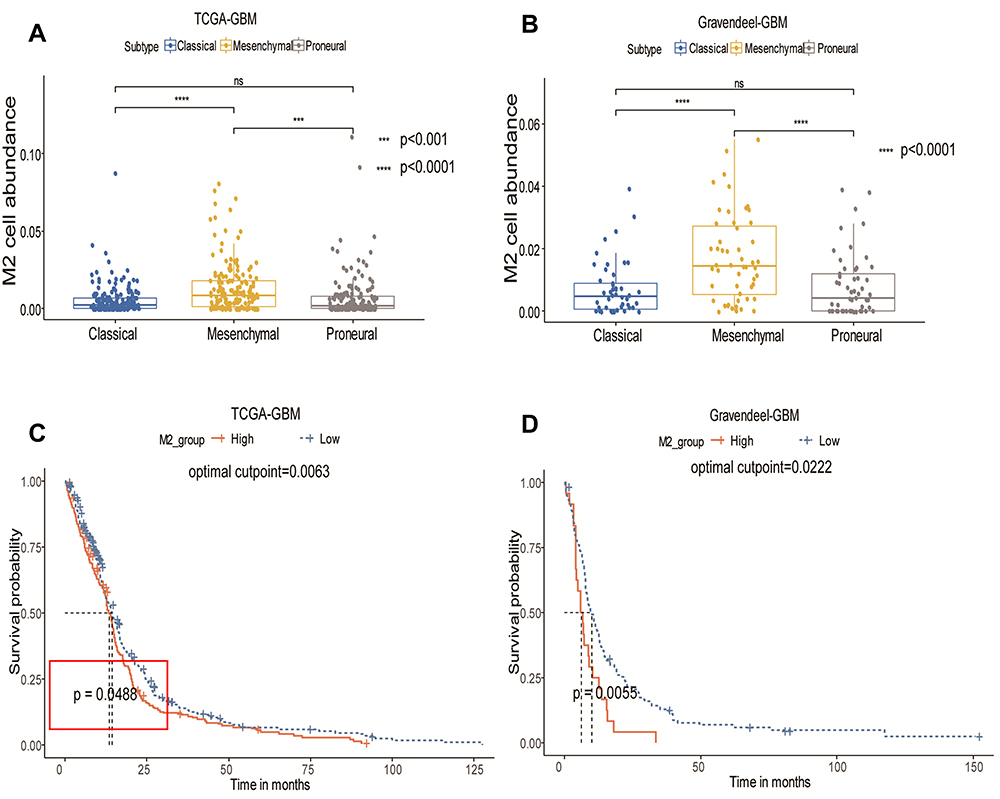 |
Figure 1 Distribution of M2 macrophages in different subtypes and the prognostic value of M2 macrophages. (A) Distribution of M2 macrophages in GBM subtype – mesenchymal, proneural and classical – in TCGA-GBM dataset. (B) Distribution of M2 macrophages in the Gravendeel dataset. (C) Kaplan–Meier survival curve for proportion of M2 macrophages in TCGA-GBM dataset. (D) Kaplan–Meier survival curve for proportion of M2 macrophages in the Gravendeel dataset. Statistical significance at ***P<0.001 and ****P<0.0001. Abbreviation: ns, not significant. |
Acquisition of the M2 Macrophage-Related Gene Module
To identify the M2 macrophage-related genes, we downloaded 4723 immune genes from the ImmPort system. A WGCNA network was constructed by the R programming WGCNA package for this purpose. After removing outlier samples, the soft threshold (β=4, scale-free R2=0.9 in TCGA; β=3 scale-free R2=0.9) was used to guarantee a scale-free network, ultimately identifying 16 distinct modules in TCGA-GBM and five distinct modules in the Gravendeel dataset (Figure 2A–D). The immune genes in the same color module have similar gene expression patterns. Correlations between modules and the fractions of M2 macrophages were calculated, and the blue module, including 424 genes in TCGA-GBM and 461 genes in the Gravendeel dataset, was found to be correlated positively with M2 macrophages (Figure 2E and F). Thus, the genes in the blue module were selected as potential prognostic genes in the following univariate Cox analyses. Finally, 68 genes were confirmed to be significantly associated with overall survival by univariate Cox analyses (Figure 2G). So, these 68 genes were defined as M2 macrophage-related prognostic genes and were included in the subtype analysis.
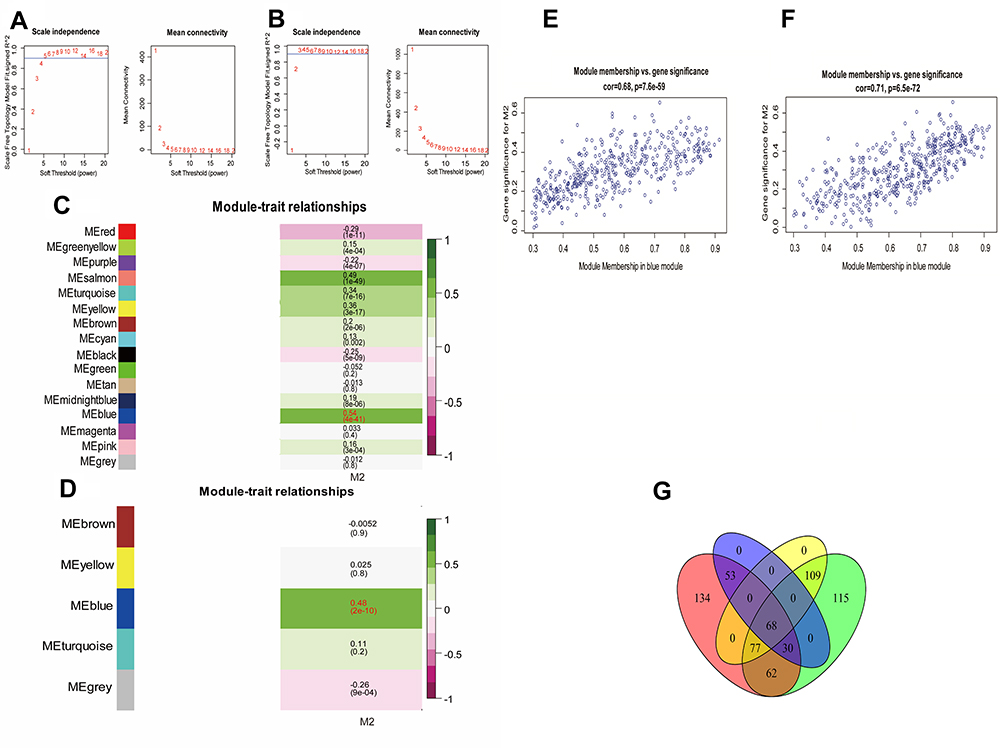 |
Figure 2 WGCNA network and module detection. (A) Selection of the soft-thresholding powers in TCGA-GBM. Power 4 was chosen because the fit index curve flattened out upon reaching a high value (>0.8). (B) Selection of the soft-thresholding powers in the Gravendeel dataset. Power 3 was chosen because the fit index curve flattened out upon reaching a high value (>0.9). (C) Correlation matrix for eigengene and M2 macrophages in TCGA-GBM dataset. Each cell includes the corresponding correlations and the P-value. (D) Correlation matrix for eigengene and M2 macrophages in the Gravendeel dataset. (E) Scatter plot of the correlation between the blue module eigengene and M2 macrophages in TCGA-GBM dataset. The correlation coefficient and P-value are indicated in the plot. (F) Scatter plot of the correlation between the blue module eigengene and M2 macrophages in the Gravendeel dataset. (G) Venn diagram showing prognostic immune genes and M2 macrophage-related genes in TCGA-GBM dataset and Gravendeel dataset. |
Clustering of GBM by M2 Macrophage-Related Prognostic Genes
The consistent clustering analysis of GBM was performed based on the expression of M2 macrophage-related prognostic genes in TCGA-GBM dataset. According to the cumulative distribution function (CDF), the area under CDF curve analyses and the correlation between groups, the patients were clustered into two subgroups, which we defined as the M2clusterA group and M2clusterB group (Figure 3A). The M2clusterA group included 287 GBM patients while the M2clusterB group included 238 GBM patients. Kaplan–Meier survival analysis confirmed that the M2clusterA group had a better overall survival rate (Figure 3B). Furthermore, the M2 macrophage-related prognostic gene expression, cluster information and clinical features are displayed in the heatmap, which illustrates that the mesenchymal subtype was mainly grouped in M2clusterB while MGMT promoter methylation status and CpG island methylator phenotype (G-CIMP) were significantly associated with the M2clusterA group (Figure 3C). The GO enrichment analysis indicated that the M2 macrophage-related prognostic genes were significantly enriched in immune response, immune regulation and immune receptor activity (Figure 3D). Based on these results, these two cluster groups had different clinical features and molecular characteristics.
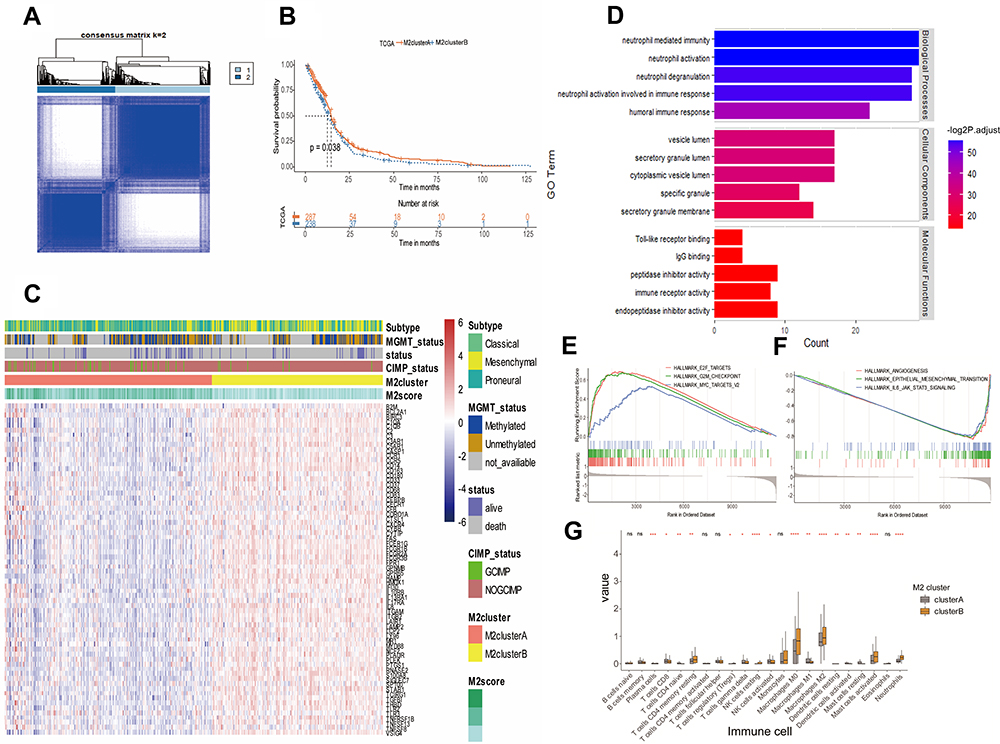 |
Figure 3 Identification of M2 macrophage-related subtypes of GBM in TCGA-GBM dataset. (A) Consensus score matrix of TCGA-GBM samples when k=2. (B) Kaplan–Meier survival curves derived from TCGA-GBM survival data for M2clusterA and M2clusterB groups. (C) Heatmap of the M2 macrophage-related prognostic genes ordered by subtype, with annotations associated with MGMT status, CIMP status, M2cluster and M2score. (D) Signaling pathways associated with M2 macrophage-related prognostic genes. The enrichment of Gene Ontology (GO) pathways related to immune response, immune regulation and immune receptor activity. (E and F) GSEA results on the pathway of M2clusterA. E2F targets, G2M checkpoint and myc targets signaling pathways were significantly upregulated (E), while angiogenesis, epithelial–mesenchymal transition and IL-6/JAK/STAT1 signaling were downregulated (F). (G) Histogram showing differences in the composition of immune cells between M2clusterA and M2clusterB. *P<0.05, **P<0.01, ***P<0.001 and ****P<0.0001. Abbreviation: ns, not significant. |
First, for further study of the potential molecular mechanisms between M2clusterA and M2clusterB groups, GSEA was conducted by comparing these two cluster groups, and the result showed that E2F targets, G2M checkpoint and myc targets signaling pathways were significantly upregulated in the M2clusterA group (Figure 3E), while angiogenesis, epithelial–mesenchymal transition and IL-6/JAK/STAT1 signaling were significantly downregulated in the M2clusterA group (Figure 3F).
Second, the immune infiltration in the M2clusterA and M2clusterB groups was analyzed by CIBERSORTx, which is another platform used to verify the different tumor immune microenvironment in the two groups. TCGA-GBM gene expression profiles were uploaded to the website and the results suggested that the fractions of immune cells, such as M0 macrophages, M2 macrophages, activated mast cells and resting NK cells, were different in the M2clusterA and M2clusterB groups, indicating a varied tumor immune microenvironment (Figure 3G).
Somatic Mutation Frequency Landscape and Protein–Protein Interaction Network Construction
To explore the mutations of M2 macrophage-related prognostic genes in different glioma types, we constructed waterfall plots for M2 macrophage-related prognostic genes in GBM and in low-grade glioma (LGG). The graphs showed that 91 out of 393 GBM patients (23.16%) had alterations (Figure 4A), while 43 out of 508 LGG patients (8.46%) had alterations (Figure 4B). Thus, more somatic mutation was observed in M2 macrophage-related prognostic genes in GBM than in LGG.
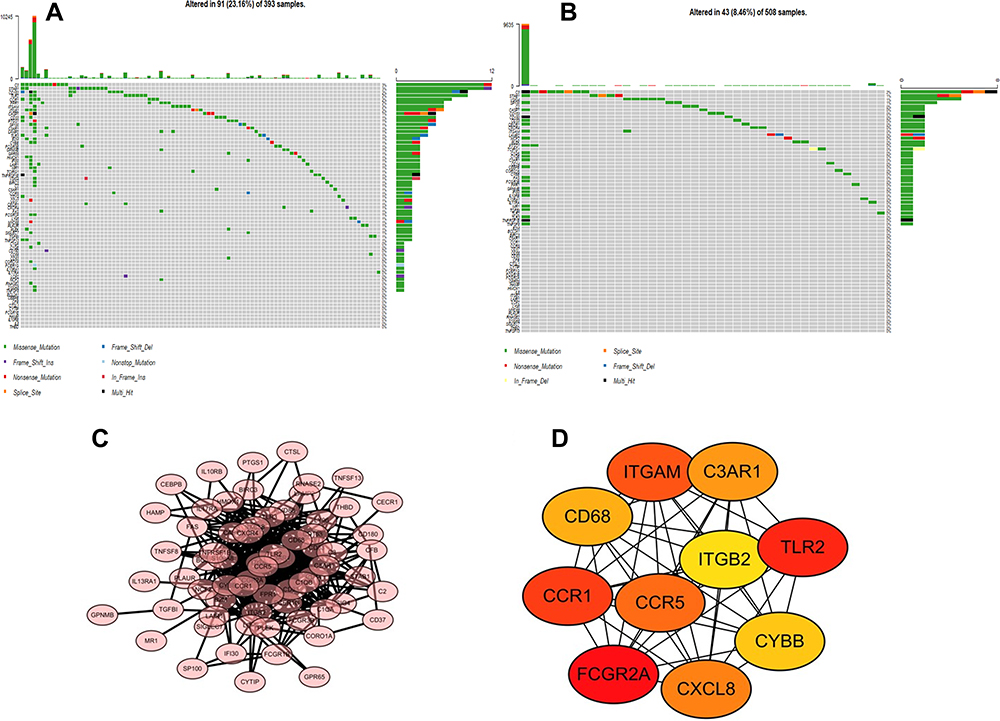 |
Figure 4 Somatic mutation frequency landscape and protein–protein interaction network construction. (A) Somatic mutation of M2 macrophage-related prognostic genes in TCGA-GBM dataset. (B) Somatic mutation of M2 macrophage-related prognostic genes in TCGA-LGG dataset. (C) PPI networks of M2 macrophage-related prognostic genes using the STRING tool. Genes are represented as nodes in the plot, and their interactions are denoted by lines. (D) Top 10 hub genes using the MCC algorithm. The color of a node in the PPI network reflects the P-value. |
The STRING tool was applied and then a PPI network was constructed to better understand the interplay among the 68 M2 macrophage-related prognostic genes. There were 68 nodes and 473 edges in this network (Figure 4C). CytoHubba is a Cytoscape plugin that allows the use of several topological analysis algorithms to identify the hub genes. In the present study, the MCC method was applied, and 10 hub genes (FCGR2A, CCR1, CD68, ITGAM, C3AR1, TLR2, CYBB, CXCL8, CCR5 and ITGB2) of the whole network are visualized in Figure 4D. The gradual color change from red to yellow represents the connection score, from high to low.
Clinical Application of the PCA-Derived M2score and Relationship to Immunotherapy
Based on PCA and the calculation method, the M2score was obtained (Figure 5A). First, we grouped the IMvigor210 cohort into high- and low-M2score groups; although the Kaplan–Meier survival curve between the two groups did not differ significantly, there was a trend toward statistical significance (P=0.068) (Figure 5B). Then, patients in both TCGA-GBM and the Gravendeel dataset were divided into high- and low-M2score groups. The Kaplan–Meier survival results indicated that the high-M2score group was strongly associated with better overall survival (Figure 5C and D). A dendrogram, including the M2score, M2cluster, CIMP status, survival status, MGMT status, subtype, isocitrate dehydrogenase-1 (IDH1) status, treatment plan and clinical features, is illustrated in Supplementary Figure 1A (Figure S1A). The figure demonstrates that the IDH mutations were significantly associated with higher M2scores. Meanwhile, the IDH mutations were more likely to be grouped in clusterA and had better overall survival. A prognostic nomogram was then developed by combining prognostic factors, including IDH mutation, gender, patient age and M2score (Figure S1B). The predicted probabilities corresponded well with the actual 1-, 3- and 5-year overall survival rates of GBM patients (Figure S1C).
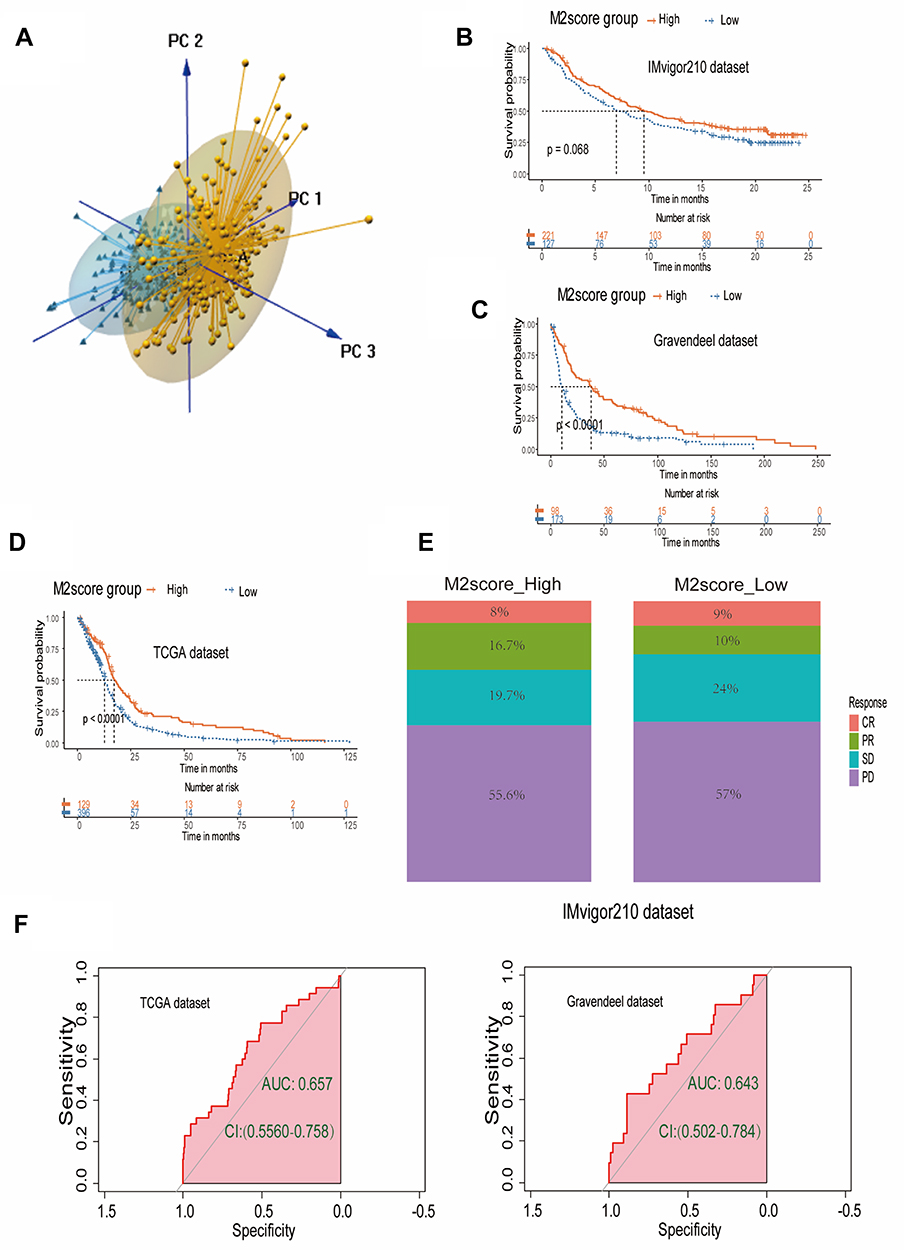 |
Figure 5 Clinical application of the PCA-derived M2score and its relationship to immunotherapy. (A) Principal component analysis (PCA) for GBM. (B) Kaplan–Meier survival curve for high- and low-M2score groups in the IMvigor210 cohort. (C) Kaplan–Meier survival curve for high- and low-M2score groups in the Gravendeel dataset. (D) Kaplan–Meier survival curve for high- and low-M2score groups in TCGA-GBM dataset. (E) Stacked barplot for immunotherapy response of high- and low-M2score groups based on the IMvigor 210 cohort. (F) ROC curve AUC statistics assessing the predictive power of the M2score for immunotherapy response in TCGA-GBM dataset and Gravendeel dataset based on the TIDE tools. |
Anti-PD-1/PDL1 and anti-CTLA4 have provided breakthrough immunotherapy in cancer treatment. To determine whether our immune classification and M2score could predict GBM patients’ response to ICB therapy, we verified the high- and low-M2score based on the IMvigor 210 cohort. The stacked column chart showed that were higher percentages of complete and partial responses (CR and PR) in the high-M2score group (Figure 5E).
TIDE is a computational method which integrates T-cell dysfunction and removal characteristics and simulates tumor immune escape at the level of tumor-infiltrating CTLs to predict the ICB response, which has an advantage in predicting the efficacy of anti-PD1/PDL1 and anti-CTLA4 therapy. After uploading the expression data to the website, the results indicated that 35 GBM patients had immunotherapy efficacy, while 490 patients failed on immunotherapy in the TCGA-GBM cohort. Using the ROC algorithm, we constructed the ROC curve and found that M2score had the capacity to predict the responsiveness of immunotherapy (AUC 0.657, 95% CI: 0.556–0.758) (Figure 5F). In addition, the AUC was 0.643 (95% CI: 0.502–0.643) to evaluate the responsiveness to immunotherapy of M2score in the Gravendeel dataset (Figure 5F), which also demonstrated an appropriate predictive accuracy. Therefore, we concluded that M2score could effectively predict the survival outcome of GBM. Moreover, M2score was a potential biomarker for evaluating the clinical response to immunotherapy, to a certain extent.
Discussion
Based on morphological similarities, GBM has traditionally been classified into gliosarcoma, giant cell GBM and epithelioid GBM by the WHO Classification of Tumors of the Central Nervous System (CNS).32 With features containing both neoplastic cells and stroma, GBM has histological heterogeneity, with disappointing prognosis. Even for patients who have similar histopathological features, the molecular biological characteristics are variable, which makes it challenging to effectively target patients using different treatment strategies. Genome-wide transcriptome analysis led to the classification of GBM into four distinct molecular subtypes – mesenchymal, classical, proneural and neural – based on the bulk tumor gene expression profile.9 However, the clinical relevance of subtyping is still controversial.13 Gill et al reported that the neural subtype contained a variable mixture of infiltrating glioma cells and non-neoplastic brain cells, providing a particularly robust and clinically relevant dataset, as the samples were taken from the margins of the tumor.10 Therefore, only three common subtypes that related to the center of the tumor were investigated in the current study.
Although many achievements have been made in targeted therapies and immunotherapies, the results are still unsatisfactory owing to complex pathophysiology. Therefore, there is an urgent need to establish an individualized risk stratification approach, and to classify GBM patients into appropriate risk groups to guide individualized treatment.33 In the present study, high-throughput gene and transcript-level data from TCGA-GBM and Gravendeel’s microarray data were analyzed to screen immune-related DEGs. In order to efficiently estimate the level of immune cell infiltration, xCell and CIBERSORTx tools, which can analyze traditional bulk expression profiles and then calculate the immune infiltration scores, were applied. The fractions of M2 macrophages and M2 macrophage-related immune genes were identified, and then clustering of the GBM by M2 macrophages was conducted and the M2score was established successfully. Finally, we found that the M2score could effectively predict the survival outcome of GBM and this is a potential biomarker for evaluating the clinical response to immunotherapy.
In the past few decades, the methods of uncovering tumor and immune cell interactions have improved the available treatment options for GBM.34 Mounting evidence suggests that immune suppression induced by cancer cells is the major factor responsible for poor outcomes.35 Macrophages are one of the most abundant innate immune cell types in the microenvironment of various tumors.36 M2 macrophages play a pivotal role in immune suppression and pro-tumor functions during GBM progression because of the secretion of immunosuppressive factors. Our results verified that GBM patients with a low fraction of M2 macrophages had significantly better outcomes in both TCGA and Gravendeel datasets. Sørensen et al also found that M2 macrophages had an unfavorable prognostic value in high-grade gliomas.37 Furthermore, a study performed by Zhu et al38 showed that PD-L1-mediated immunosuppression attributed to the infiltration and M2-polarization and correlated with poor survival. Taking these findings into account, the presence of M2 macrophages is important for the progression of GBM and has been well studied. Assessing the mechanism of M2 macrophages in GBM may provide more information on treatment options.
The WGCNA network was constructed and then 68 immune genes were identified as M2 macrophage-related prognostic genes. Based on these 68 gene expression profiles, the patients in TCGA-GBM were divided into M2clusterA and M2clusterB groups. The M2clusterA group had higher M2score, a smaller fraction of M2 macrophages, more MGMT promoter methylation and CpG island methylator phenotype, and consequently a better overall survival rate. Many trials have reported that MGMT promoter methylation is associated with longer survival in GBM patients treated with TMZ, both in the overall population and in older patients.39–42 As for CpG island methylation, researchers have found that it is a relevant prognostic factor, independently of the known predictors, such as grade and age.43 The favorable prognostic value of CpG island methylator phenotype in GBM patients has been reported in many other studies.43–45 Compared with the non-carrying CpG island methylator phenotype, the authors found that the carrying CpG island methylator phenotype was more enriched among the proneural subtypes, which had a better prognosis.9,45 The GSEA results showed that E2F targets, G2M checkpoint and myc targets signaling pathways were significantly upregulated in the M2clusterA group, while angiogenesis, epithelial–mesenchymal transition and IL-6/JAK/STAT1 signaling were significantly downregulated in the M2clusterA group. Conversely, Yu et al found that expression of E2Fs was significantly upregulated and linked with grade progression.46 Meanwhile, chromatin remodeler HELLS strongly correlated with targets of E2F3 and MYC transcriptional activity in GBM patients.47 These results imply that E2F targets and myc targets signaling pathway could also affect the prognosis, independently of the M2 macrophage or immune response. Little is known about the role of the G2M checkpoint in the pathophysiology of GBM.
Ten hub genes, namely FCGR2A, CCR1, CD68, ITGAM, C3AR1, TLR2, CYBB, CXCL8, CCR5 and ITGB2, were identified by CytoHubba, all of which, except for CXCL8, were associated with the plasma membrane. CXCL8, also known as IL-8, was predominantly secreted by macrophages and contributed to the immunosuppressive microenvironment.48 Seven genes were enriched in the inflammatory response (CCR1, CCR5, CXCL8, C3AR1, CYBB, ITGB2 and TLR2), while four genes each were enriched in the immune response (CCR1, CCR5, CXCL8 and TLR2), positive regulation of angiogenesis (CXCL8, C3AR1, CYBB and ITGB2) or chemotaxis (CCR1, CCR5, CXCL8 and C3AR1). TLR2, C3AR1, ITGAM, CD68 and CCR5 have been widely reported as a marker of macrophages in GBM, and studies have shown that TLR2, CD68 and CCR5 act as immune suppressors and contribute toward GBM progression in the tumor microenvironment.49–53 FCGR2A, CYBB, CXCL8 and ITGB2 were significantly upregulated in GBM and associated with shorter overall survival of GBM patients.54–58 As for the role of CCR1 in GBM, the results are still controversial. Zhang et al found that CCR1 and CCR5 were two key receptors of CCL8 and they triggered CCL8-induced invasion of GBM cells,59 while Pham et al reported that individual deletion of CCR1 or CCR5 had little or no effect on the survival of tumor-bearing mice, or the number of GBM-infiltrated microglia/macrophages and lymphocytes.60 Consequently, these 10 hub genes are associated with a higher degree of malignancy and poorer prognosis in gliomas.
Furthermore, we investigated the relationship between the M2score and immunotherapy to guide personalized treatment decisions. Nowadays, immune checkpoint inhibitors have been approved for gastric cancer, breast cancer, colon cancer and other cancers.61 However, they have demonstrated limited efficacy in GBM.62 Hence, for the future development of immunotherapy in GBM, it is necessary to construct an efficient immune classification or prognostic model to predict the response of GBM patients to ICB therapy.63,64 Based on the results presented in this report, we successfully verified M2score as an appropriate predictive score to predict the response to ICB therapy. Both the IMvigor210 cohort and the TIDE score showed us that the M2score is a potential biomarker for evaluating the clinical response to immunotherapy.
we still have some limitations in the current study. First, this is a retrospective study that may display statistical bias, and the bulk sequence transcriptome data were used, in which there is a lack of comprehensive exploration for intratumoral heterogeneity. Second, the tumor immunity analysis was calculated by xCell, which cannot represent real immune cell infiltration. Finally, the urothelial cancer cohort, instead of a GBM cohort, was applied to explore the connection between gene expression and the immunotherapy response. Therefore, prospective studies and in vitro and in vivo experiments regarding these genes are required to validate our in silico results, and the response of immunotherapy should be further verified in randomized clinical trials.
Conclusion
In summary, by detecting distinct fractions of the M2 macrophage, this study successfully identified immune-related prognostic genes and constructed the M2score, which could be employed to quantitatively predict the prognosis of GBM patients. The activation pathway, immune infiltration, mutation features and drug response underlying the M2score were also identified. Our findings provide a basis for understanding the role of M2 macrophages and immune-related prognostic genes, and indicate the potential clinical implications of M2score in GBM.
Abbreviations
AUC, area under the curve; CDF, cumulative distribution function; CNV, copy number variation; CTL, cytotoxic T lymphocyte; DEG, differentially expressed gene; GBM, glioblastoma; GEO, Gene Expression Omnibus; GO, Gene Ontology; GSEA, gene set enrichment analysis; ICB, immune checkpoint blockade; LGG, low-grade glioma; PCA, principal component analysis; PPI, protein–protein interaction; RMA, robust multiarray average; ROC, receiver operating characteristics; STRING, Search Tool for the Retrieval of Interacting Genes; TAM, tumor-associated macrophage; TCGA, The Cancer Genome Atlas; TIDE, Tumor Immune Dysfunction and Exclusion; TOM, topological overlap matrix; UCSC, University of California, Santa Cruz; WGCNA, weighted gene co-expression network analysis.
Data Sharing Statement
Publicly available datasets, available from TCGA database and the GEO database (https://www.ncbi.nlm.nih.gov/gds), were analyzed in this study.
Ethics Statement
All clinical data involved in this study were obtained from open databases and therefore met ethical review standards. This study, involving human participants, was reviewed and approved by the Ethics Committee of the Xiangya Hospital, Central South University, Changsha.
Funding
This work was financially supported by the National Natural Science Foundation of China (no. 81902222), the Natural Science Foundation of Hunan Province (2020JJ4928), and National Clinical Research Center for Geriatric Disorders, Xiangya Hospital, Central South University, Changsha, China.
Disclosure
The authors report no conflicts of interest.
References
1. Vollmann-Zwerenz A, Leidgens V, Feliciello G, Klein CA, Hau P. Tumor cell invasion in glioblastoma. Int J Mol Sci. 2020;21:6. doi:10.3390/ijms21061932
2. Louis DN, Perry A, Reifenberger G, et al. The 2016 World Health Organization classification of tumors of the central nervous system: a summary. Acta Neuropathol. 2016;131(6):803–820. doi:10.1007/s00401-016-1545-1
3. Stupp R, Hegi ME, Mason WP, et al. Effects of radiotherapy with concomitant and adjuvant temozolomide versus radiotherapy alone on survival in glioblastoma in a randomised Phase III study: 5-year analysis of the EORTC-NCIC trial. Lancet Oncol. 2009;10(5):459–466. doi:10.1016/S1470-2045(09)70025-7
4. Hanahan D, Weinberg RA. Hallmarks of cancer: the next generation. Cell. 2011;144(5):646–674. doi:10.1016/j.cell.2011.02.013
5. Barker FG
6. Landry AP, Balas M, Alli S, Spears J, Zador Z. Distinct regional ontogeny and activation of tumor associated macrophages in human glioblastoma. Sci Rep. 2020;10(1):19542. doi:10.1038/s41598-020-76657-3
7. Guadagno E, Presta I, Maisano D, et al. Role of macrophages in brain tumor growth and progression. Int J Mol Sci. 2018;19:4. doi:10.3390/ijms19041005
8. Gordon SR, Maute RL, Dulken BW, et al. PD-1 expression by tumour-associated macrophages inhibits phagocytosis and tumour immunity. Nature. 2017;545(7655):495–499. doi:10.1038/nature22396
9. Verhaak RG, Hoadley KA, Purdom E, et al. Integrated genomic analysis identifies clinically relevant subtypes of glioblastoma characterized by abnormalities in PDGFRA, IDH1, EGFR, and NF1. Cancer Cell. 2010;17(1):98–110. doi:10.1016/j.ccr.2009.12.020
10. Gill BJ, Pisapia DJ, Malone HR, et al. MRI-localized biopsies reveal subtype-specific differences in molecular and cellular composition at the margins of glioblastoma. Proc Natl Acad Sci U S A. 2014;111(34):12550–12555. doi:10.1073/pnas.1405839111
11. Tang Y, Qazi MA, Brown KR, et al. Identification of five important genes to predict glioblastoma subtypes. Neuro-Oncol Adv. 2021;3(1):vdab144. doi:10.1093/noajnl/vdab144
12. Hu B, Ruan Y, Wei F, et al. Identification of three glioblastoma subtypes and a six-gene prognostic risk index based on the expression of growth factors and cytokines. Am J Transl Res. 2020;12(8):4669–4682.
13. Garofano L, Migliozzi S, Oh YT, et al. Pathway-based classification of glioblastoma uncovers a mitochondrial subtype with therapeutic vulnerabilities. Nature Cancer. 2021;2(2):141–156. doi:10.1038/s43018-020-00159-4
14. Ma H, Zhao C, Zhao Z, et al. Specific glioblastoma multiforme prognostic-subtype distinctions based on DNA methylation patterns. Cancer Gene Ther. 2020;27(9):702–714. doi:10.1038/s41417-019-0142-6
15. Bowman RL, Wang Q, Carro A, Verhaak RG, Squatrito M. GlioVis data portal for visualization and analysis of brain tumor expression datasets. Neuro-Oncology. 2017;19(1):139–141. doi:10.1093/neuonc/now247
16. Gravendeel LA, Kouwenhoven MC, Gevaert O, et al. Intrinsic gene expression profiles of gliomas are a better predictor of survival than histology. Cancer Res. 2009;69(23):9065–9072. doi:10.1158/0008-5472.CAN-09-2307
17. Leek JT, Johnson WE, Parker HS, Jaffe AE, Storey JD. The sva package for removing batch effects and other unwanted variation in high-throughput experiments. Bioinformatics. 2012;28(6):882–883. doi:10.1093/bioinformatics/bts034
18. Aran D, Hu Z, Butte AJ. xCell: digitally portraying the tissue cellular heterogeneity landscape. Genome Biol. 2017;18(1):220. doi:10.1186/s13059-017-1349-1
19. Langfelder P, Horvath S. WGCNA: an R package for weighted correlation network analysis. BMC Bioinform. 2008;9:559. doi:10.1186/1471-2105-9-559
20. Guo R, Chu A, Gong Y. Identification of cancer stem cell-related biomarkers in intestinal-type and diffuse-type gastric cancer by stemness index and weighted correlation network analysis. J Transl Med. 2020;18(1):418. doi:10.1186/s12967-020-02587-3
21. Wang J, Zhang C, He W, Gou X. Effect of m(6)A RNA methylation regulators on malignant progression and prognosis in renal clear cell carcinoma. Front Oncol. 2020;10:3. doi:10.3389/fonc.2020.00003
22. Raykov YP, Boukouvalas A, Baig F, Little MA. What to do when k-means clustering fails: a simple yet principled alternative algorithm. PLoS One. 2016;11(9):e0162259. doi:10.1371/journal.pone.0162259
23. Ritchie ME, Phipson B, Wu D, et al. limma powers differential expression analyses for RNA-sequencing and microarray studies. Nucleic Acids Res. 2015;43(7):e47. doi:10.1093/nar/gkv007
24. Zeng D, Li M, Zhou R, et al. Tumor microenvironment characterization in gastric cancer identifies prognostic and immunotherapeutically relevant gene signatures. Cancer Immunol Res. 2019;7(5):737–750. doi:10.1158/2326-6066.CIR-18-0436
25. Sotiriou C, Wirapati P, Loi S, et al. Gene expression profiling in breast cancer: understanding the molecular basis of histologic grade to improve prognosis. J Natl Cancer Inst. 2006;98(4):262–272. doi:10.1093/jnci/djj052
26. Peng G, Masood K, Gantz O, Sinha U. Neuromuscular electrical stimulation improves radiation-induced fibrosis through Tgf-Beta1/MyoD homeostasis in head and neck cancer. J Surg Oncol. 2016;114(1):27–31. doi:10.1002/jso.24265
27. Jiang H, Wang H, Wang S, et al. Expression of ERCC1, TYMS, RRM1, TUBB3, non-muscle myosin II, myoglobin and MyoD1 in lung adenocarcinoma pleural effusions predicts survival in patients receiving platinum-based chemotherapy. Mol Med Rep. 2015;11(5):3523–3532. doi:10.3892/mmr.2014.3141
28. Mariathasan S, Turley SJ, Nickles D, et al. TGFbeta attenuates tumour response to PD-L1 blockade by contributing to exclusion of T cells. Nature. 2018;554(7693):544–548. doi:10.1038/nature25501
29. Fu J, Li K, Zhang W, et al. Large-scale public data reuse to model immunotherapy response and resistance. Genome Med. 2020;12(1):21. doi:10.1186/s13073-020-0721-z
30. Chen X, Chen H, He D, et al. Analysis of tumor microenvironment characteristics in bladder cancer: implications for immune checkpoint inhibitor therapy. Front Immunol. 2021;12:672158. doi:10.3389/fimmu.2021.672158
31. Jiang P, Gu S, Pan D, et al. Signatures of T cell dysfunction and exclusion predict cancer immunotherapy response. Nat Med. 2018;24(10):1550–1558. doi:10.1038/s41591-018-0136-1
32. Louis DN, Perry A, Wesseling P, et al. The 2021 WHO classification of tumors of the central nervous system: a summary. Neuro-Oncology. 2021;23(8):1231–1251. doi:10.1093/neuonc/noab106
33. Zuo S, Zhang X, Wang L. A RNA sequencing-based six-gene signature for survival prediction in patients with glioblastoma. Sci Rep. 2019;9(1):2615. doi:10.1038/s41598-019-39273-4
34. Arevalo AST, Erices JI, Uribe DA, et al. Monras CAQ: current therapeutic alternatives and new perspectives in glioblastoma multiforme. Curr Med Chem. 2017;24(25):2781–2795. doi:10.2174/0929867324666170303122241
35. Vidyarthi A, Agnihotri T, Khan N, et al. Predominance of M2 macrophages in gliomas leads to the suppression of local and systemic immunity. Cancer Immunol Immunother. 2019;68(12):1995–2004. doi:10.1007/s00262-019-02423-8
36. Colegio OR, Chu NQ, Szabo AL, et al. Functional polarization of tumour-associated macrophages by tumour-derived lactic acid. Nature. 2014;513(7519):559–563. doi:10.1038/nature13490
37. Sorensen MD, Dahlrot RH, Boldt HB, Hansen S, Kristensen BW. Tumour-associated microglia/macrophages predict poor prognosis in high-grade gliomas and correlate with an aggressive tumour subtype. Neuropathol Appl Neurobiol. 2018;44(2):185–206. doi:10.1111/nan.12428
38. Zhu Z, Zhang H, Chen B, Liu X, Zhang S, Zong Z, Gao M. PD-L1-Mediated Immunosuppression in Glioblastoma Is Associated With the Infiltration and M2-Polarization of Tumor-Associated Macrophages. Front Immunol. 2020 Nov 30;11:588552. doi:10.3389/fimmu.2020.588552. PMID: 33329573; PMCID: PMC7734279.
39. Malmstrom A, Gronberg BH, Marosi C, et al. Temozolomide versus standard 6-week radiotherapy versus hypofractionated radiotherapy in patients older than 60 years with glioblastoma: the Nordic randomised, Phase 3 trial. Lancet Oncol. 2012;13(9):916–926. doi:10.1016/S1470-2045(12)70265-6
40. Weller M, van den Bent M, Tonn JC, et al. European Association for Neuro-Oncology (EANO) guideline on the diagnosis and treatment of adult astrocytic and oligodendroglial gliomas. Lancet Oncol. 2017;18(6):e315–e329. doi:10.1016/S1470-2045(17)30194-8
41. Wick W, Platten M, Meisner C, et al. Temozolomide chemotherapy alone versus radiotherapy alone for malignant astrocytoma in the elderly: the NOA-08 randomised, phase 3 trial. Lancet Oncol. 2012;13(7):707–715. doi:10.1016/S1470-2045(12)70164-X
42. Perry JR, Laperriere N, O’Callaghan CJ, et al. Short-course radiation plus temozolomide in elderly patients with glioblastoma. N Engl J Med. 2017;376(11):1027–1037. doi:10.1056/NEJMoa1611977
43. Noushmehr H, Weisenberger DJ, Diefes K, et al. Identification of a CpG island methylator phenotype that defines a distinct subgroup of glioma. Cancer Cell. 2010;17(5):510–522. doi:10.1016/j.ccr.2010.03.017
44. Ceccarelli M, Barthel FP, Malta TM, et al. Molecular profiling reveals biologically discrete subsets and pathways of progression in diffuse glioma. Cell. 2016;164(3):550–563. doi:10.1016/j.cell.2015.12.028
45. Phillips HS, Kharbanda S, Chen R, et al. Molecular subclasses of high-grade glioma predict prognosis, delineate a pattern of disease progression, and resemble stages in neurogenesis. Cancer Cell. 2006;9(3):157–173. doi:10.1016/j.ccr.2006.02.019
46. Yu H, Li Z, Wang M. Expression and prognostic role of E2F transcription factors in high-grade glioma. CNS Neurosci Ther. 2020;26(7):741–753. doi:10.1111/cns.13295
47. Zhang G, Dong Z, Prager BC, et al. Chromatin remodeler HELLS maintains glioma stem cells through E2F3 and MYC. JCI Insight. 2019;4(7). doi:10.1172/jci.insight.126140
48. Hasan T, Caragher SP, Shireman JM, et al. Interleukin-8/CXCR2 signaling regulates therapy-induced plasticity and enhances tumorigenicity in glioblastoma. Cell Death Dis. 2019;10(4):292. doi:10.1038/s41419-019-1387-6
49. Qian J, Luo F, Yang J, et al. TLR2 promotes glioma immune evasion by downregulating MHC class II molecules in microglia. Cancer Immunol Res. 2018;6(10):1220–1233. doi:10.1158/2326-6066.CIR-18-0020
50. Huang S, Song Z, Zhang T, et al. Identification of immune cell infiltration and immune-related genes in the tumor microenvironment of glioblastomas. Front Immunol. 2020;11:585034. doi:10.3389/fimmu.2020.585034
51. Wang Q, Hu B, Hu X, et al. Tumor evolution of glioma-intrinsic gene expression subtypes associates with immunological changes in the microenvironment. Cancer Cell. 2017;32(1):42–56 e46. doi:10.1016/j.ccell.2017.06.003
52. Wang L, Zhang C, Zhang Z, et al. Specific clinical and immune features of CD68 in glioma via 1024 samples. Cancer Manag Res. 2018;10:6409–6419. doi:10.2147/CMAR.S183293
53. Novak M, Koprivnikar Krajnc M, Hrastar B, et al. CCR5-mediated signaling is involved in invasion of glioblastoma cells in its microenvironment. Int J Mol Sci. 2020;21(12). doi:10.3390/ijms21124199
54. Zhang Z, Chen J, Huo X, et al. Identification of a mesenchymal-related signature associated with clinical prognosis in glioma. Aging. 2021;13(9):12431–12455. doi:10.18632/aging.202886
55. Liu Y, Zhao Y, Fang J, Fang J, Yuan X. Bioinformatics analysis of microenvironment-related genes associated with radioresistance in glioblastoma. Transl Cancer Res. 2020;9(12):7495–7504. doi:10.21037/tcr-20-2476
56. Chen Z, Mou L, Pan Y, Feng C, Zhang J, Li J. CXCL8 promotes glioma progression by activating the JAK/STAT1/HIF-1alpha/snail signaling axis. Onco Targets Ther. 2019;12:8125–8138. doi:10.2147/OTT.S224721
57. Syafruddin SE, Nazarie W, Moidu NA, Soon BH, Mohtar MA. Integration of RNA-Seq and proteomics data identifies glioblastoma multiforme surfaceome signature. BMC Cancer. 2021;21(1):850. doi:10.1186/s12885-021-08591-0
58. Wang X, Ning W, Qiu Z, Li S, Zhang H, Yu C. Tumor-associated macrophages based signaling pathway analysis and hub genes identification in glioma. Medicine. 2020;99(51):e23840. doi:10.1097/MD.0000000000023840
59. Zhang X, Chen L, Dang WQ, et al. CCL8 secreted by tumor-associated macrophages promotes invasion and stemness of glioblastoma cells via ERK1/2 signaling. Lab Invest. 2020;100(4):619–629. doi:10.1038/s41374-019-0345-3
60. Pham K, Luo D, Liu C, Harrison JK. CCL5, CCR1 and CCR5 in murine glioblastoma: immune cell infiltration and survival rates are not dependent on individual expression of either CCR1 or CCR5. J Neuroimmunol. 2012;246(1–2):10–17. doi:10.1016/j.jneuroim.2012.02.009
61. Darvin P, Toor SM, Sasidharan Nair V, Elkord E. Immune checkpoint inhibitors: recent progress and potential biomarkers. Exp Mol Med. 2018;50(12):1–11. doi:10.1038/s12276-018-0191-1
62. Brahm CG, van Linde ME, Enting RH, et al. The current status of immune checkpoint inhibitors in neuro-oncology: a systematic review. Cancers. 2020;12(3). doi:10.3390/cancers12030586
63. Le NQK, Hung TNK, Do DT, Lam LHT, Dang LH, Huynh TT. Radiomics-based machine learning model for efficiently classifying transcriptome subtypes in glioblastoma patients from MRI. Comput Biol Med. 2021;132:104320. doi:10.1016/j.compbiomed.2021.104320
64. Do DT, Le NQK. Using extreme gradient boosting to identify origin of replication in Saccharomyces cerevisiae via hybrid features. Genomics. 2020;112(3):2445–2451. doi:10.1016/j.ygeno.2020.01.017
 © 2022 The Author(s). This work is published and licensed by Dove Medical Press Limited. The full terms of this license are available at https://www.dovepress.com/terms.php and incorporate the Creative Commons Attribution - Non Commercial (unported, v3.0) License.
By accessing the work you hereby accept the Terms. Non-commercial uses of the work are permitted without any further permission from Dove Medical Press Limited, provided the work is properly attributed. For permission for commercial use of this work, please see paragraphs 4.2 and 5 of our Terms.
© 2022 The Author(s). This work is published and licensed by Dove Medical Press Limited. The full terms of this license are available at https://www.dovepress.com/terms.php and incorporate the Creative Commons Attribution - Non Commercial (unported, v3.0) License.
By accessing the work you hereby accept the Terms. Non-commercial uses of the work are permitted without any further permission from Dove Medical Press Limited, provided the work is properly attributed. For permission for commercial use of this work, please see paragraphs 4.2 and 5 of our Terms.