")
Back to Journals » OncoTargets and Therapy » Volume 14
Construction of miRNA-mRNA Regulatory Network and Prognostic Signature in Endometrial Cancer
Authors Sun R, Liu J, Nie S, Li S, Yang J, Jiang Y, Cheng W
Received 3 August 2020
Accepted for publication 10 March 2021
Published 6 April 2021 Volume 2021:14 Pages 2363—2378
DOI https://doi.org/10.2147/OTT.S272222
Checked for plagiarism Yes
Review by Single anonymous peer review
Peer reviewer comments 2
Editor who approved publication: Dr Alberto Bongiovanni
Rui Sun,* Jinhui Liu,* Sipei Nie,* Siyue Li, Jing Yang, Yi Jiang, Wenjun Cheng
Department of Gynecology, The First Affiliated Hospital of Nanjing Medical University, Nanjing, Jiangsu, People’s Republic of China
*These authors contributed equally to this work
Correspondence: Wenjun Cheng
Department of Gynecology, The First Affiliated Hospital of Nanjing Medical University, Nanjing, 210029, Jiangsu, People’s Republic of China
Email [email protected]
Introduction: This bioinformatic study confirmed a new miRNA-mRNA regulatory network and a prognostic signature in endometrial cancer (EC).
Materials and Methods: We downloaded RNA-seq and miRNA-seq data of EC from the TCGA database, then used EdegR package to screen differentially expressed miRNAs and mRNAs (DE-miRNAs and DE-mRNAs). Then, we constructed a regulatory network of EC-associated miRNAs and hub genes by Cytoscape, and determined the expression of unexplored miRNAs in EC tissues and normal adjacent tissues by quantitative Real-Time PCR (qRT-PCR). A prognostic signature model and a predictive nomogram were constructed. Finally, we explored the association between the prognostic model and the immune cell infiltration.
Results: A total of 11,531 DE-mRNAs and 236 DE-miRNAs, as well as 275 and 118 candidate DEGs for upregulated and downregulated DE-miRNAs were screened out. The miRNA-mRNA network included 5 downregulated and 13 upregulated DE-miRNAs. qRT-PCR proved that the expression levels of miRNA-18a-5p, miRNA-18b-5p, miRNA-449c-5p and miRNA-1224-5p and their target genes (NR3C1, CTGF, MYC, and TNS1) were consistent with our predictions. Univariate and multivariate Cox proportional hazards regression analyses of the hub genes revealed a significant prognostic value of NR3C1, EZH2, AND GATA4, and these genes were closely related to eight types of immune infiltration cells.
Conclusion: We identified three genes as candidate biomarkers for EC, which may provide a theoretical basis for targeted therapy.
Keywords: TCGA, endometrial cancer, miRNA-mRNA network, prognostic model, immune infiltration cell
Introduction
Endometrial cancer (EC), a common malignancy, has an estimated incidence of 10–20 per 100,000 women globally and the figure is still increasing.1 Surgical treatment is the major therapy for early-stage EC patients.2 The prognosis of advanced EC is poor, and the 5-year overall survival rate is only 15–17%.3 Therefore, new biomarkers should be explored before the development of effective target treatments.
MicroRNAs (miRNAs), the 19–25 nucleotide non-coding RNAs, regulate gene expression and participate in biological processes.4 By base-pairing with complementary sequences within messenger RNA (mRNA) molecules, miRNA can silence RNAs and regulate post-transcriptional gene expression to promote cell proliferation,5 apoptosis,6 cell cycle,7 migration,8 differentiation,9 and energy metabolism.10 The dysregulation of miRNA is linked to multiple diseases, such as obesity, cancer, cardiovascular diseases, inflammatory diseases, and disorders of the female reproductive system.11–16 Many studies have verified the close relationship between miRNA and EC.17 For example, the overexpressed miR-137 suppresses tumor cell proliferation and colony formation in vitro and xenograft tumor growth in vivo.18 Despite the previous analyses on the miRNA expression in EC, this bioinformatic study aimed to confirm a new miRNA-mRNA regulatory network.
In our study, the differentially expressed miRNAs (DE-miRNAs) in EC were screened using TCGA database (Figure 1). The functions of DE-miRNA target genes were predicted by the functional and pathway enrichment analysis. Then, the regulatory network was established using EC-associated miRNAs and their target genes. The expression of unexplored EC-associated miRNAs was determined using qRT-PCR. Finally, we built a prognostic signature model using the hub genes and explored the association between the prognostic model and the immune infiltration.
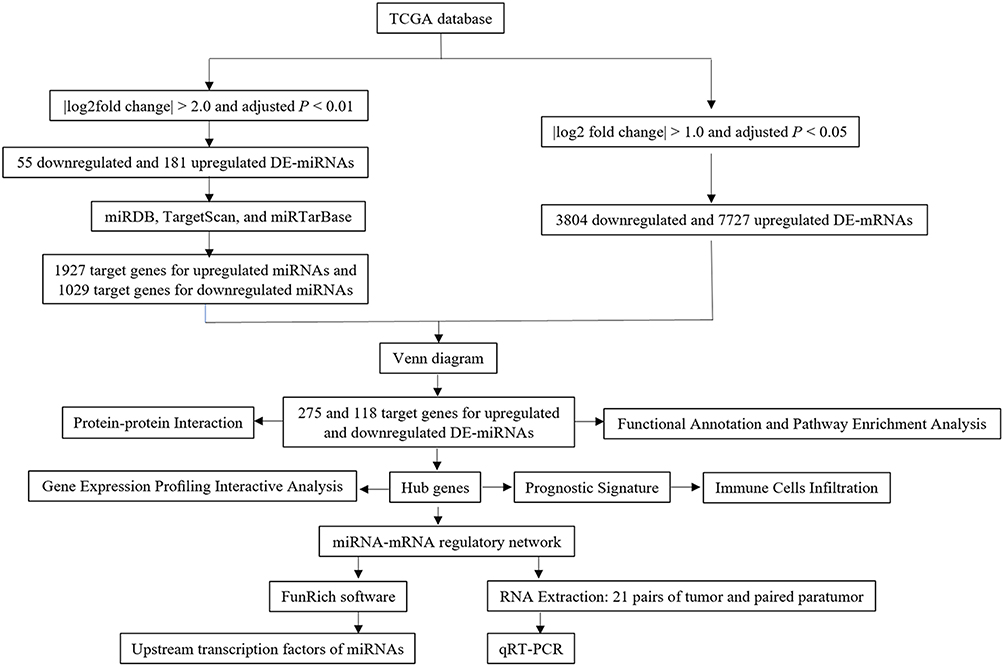 |
Figure 1 Flow chart of this article. |
Methods
Study Population
The mRNAs expression profiles of 587 (552 EC and 35 normal) tissues, and the miRNA isoform expression profiles of 568 (546 EC and 22 normal) tissues from TCGA database (http://cancergenome.nih.gov/publications/publicationguidelines) were downloaded and the corresponding clinical data were collected. The sequenced data were downloaded from Illumina HiSeq RNASeq and Illumina HiSeq_miRNASeq platforms.
Screening DE-mRNAs and DE-miRNAs
We used the “edegR” package operated by R software to screen out DE-mRNAs and DE-miRNAs. DE-miRNAs were defined as |log2 fold change (FC)| >2.0 and adjusted P < 0.01. DE-mRNAs were identified if |log2 FC| >1.0 and adjusted P < 0.05.
Differentially Expressed Genes
To get the downstream target genes of DE-miRNAs, we used miRTarBase (http://mirtarbase.mbc.nctu.edu.tw/php/index.php), miRDB (http://www.mirdb.org/), and TargetScan (http://www.targetscan.org/) to determine whether the DE-miRNAs and the target genes were paired. The differentially expressed genes (DEGs) and the overlapping genes of DE-mRNAs and miRNA target genes were identified using Venn diagram (https://bioinfogp.cnb.csic.es/tools/venny/).
Functional Annotation and Pathway Enrichment Analysis
Gene Ontology (GO) analysis and the Kyoto Encyclopedia of Genes and Genomes (KEGG) pathway enrichment analysis were used to detect the functions of the target genes. The categories of GO functional annotation included biological process (BP), cellular component (CC), and molecular function (MF). The Enrichr database (http://amp.pharm.mssm.edu/Enrichr/) was applied in GO functional annotation and KEGG pathway enrichment analysis for the overlapping target genes and DE-mRNAs. P < 0.05 was used as the threshold.
Construction of Protein‐Protein Interaction
To reveal functional interactions and relationships between protein products of DEGs in EC, we uploaded all the overlapping genes screened from the Search Tool for the Retrieval of Interacting Genes (STRING) database (http://string‐db.org/). Subsequently, the hub genes in the network were identified according to the connectivity using Cytoscape software (version 3.6.1). We used “MCODE” plug‐in to visualize and select modular hubs in the PPI network (degree = 4, node score = 0.2, k‐core = 2, and max. depth = 100). The node in the network represented a gene or a protein and the line between the nodes represented their interaction. Central nodes represented key or significant proteins or genes with important functions. We recognized the top 10 hub nodes as hub genes.
Validation of Hub Gene Expression Levels
The expression levels of top 20 hub genes were validated using the Gene Expression Profiling Interactive Analysis (GEPIA).19 The hub genes with |log2FC| >2 and p < 0.01 were considered statistically different.
Establishment of miRNA-mRNA Regulatory Pathways and Corresponding Transcription Factors
We built a new miRNA-mRNA network to identify the most functional miRNAs, then used the Cytoscape software (version 3.6.1) to establish the miRNA-hub gene network and to investigate the association between the 20 hub genes and the DE-miRNAs. The selected upregulated and downregulated DE-miRNAs were input into FunRich software to predict the upstream transcription factors of the screened DE-miRNAs.
RNA Extraction and Quantitative Real-Time PCR (qRT-PCR)
EC tissues and pericarcinomatous tissues were obtained from patients of the First Affiliated Hospital of Nanjing Medical University. The clinical program was approved by the ethics committee of the First Affiliated Hospital of Nanjing Medical University. All patients individually signed the informed consent. Total RNA of 42 (21 pairs of tumor and paired paratumor) tissues was separated using Trizol reagent (Thermo Fisher Scientific, Waltham, MA). The RNA quantity control and concentration were evaluated using NanoDrop 2000 Spectrophotometer (Thermo Scientific, Wilmington, DE, USA). The reverse transcription of total RNA was performed using the Reverse Transcription Kit (Takara, Tokyo, Japan). qRT-PCR was conducted (SYBR Premix Ex Taq, TaKaRa, Dalian, China) on Light Cycler 480 (Roche, Switzerland) to detect the relative miRNA and mRNA expressions using the 2−ΔΔCt method, in which GAPDH and U6 were used as endogenous control for mRNA and miRNA, respectively. The PCR primers are listed in Supplemental Table 1.
Establishment of Prognostic Signature Model Using Hub Genes
The association between the hub gene expression and the overall survival was assessed using the univariate Cox proportional hazards regression analysis. Then, the prognosis-related genes (p<0.05) were taken as candidate variables. Stepwise multivariate Cox proportional hazards regression analysis was employed to predict the risk score of the genes. The model was developed using the coxph () function in survival package.20 The risk score for predicting the overall survival was calculated as follows: Risk score = exp RNA1 * β RNA1 + exp RNA2 * β RNA2 + exp RNA3 * β RNA3 + … exp RNAn * β RNAn (exp RNA: relative expression value after transforming z score; β RNA: regression coefficient obtained via the multivariate Cox proportional hazards regression model). The patients fell into either a low-risk group or a high-risk group based on the mean risk score. We used the “survival” package in R to generate the overall survival curves of both groups. The 1-, 3-, and 5-year receiver operating characteristic (ROC) curves were used to calculate the predictive value of the model. The sensitivity and specificity of the risk model of EC were calculated by the ROC curve using the “survival ROC” R package. The areas under the ROC curve (AUC) presenting sensitive and specific cities were used to indicate the predictive value. The predictive model, established with the AUC >0.6, was considered to have explanatory and informative efficacy. In addition, comprehensive survival analysis was implemented to analyze the relationship between the different clinical parameters (age, race, tumor stage, histological type, grade, and tumor status) and the risk score model. Clinical-based subgroup survival analysis stratified by clinical factors was also conducted. All analyses were conducted using the R. P < 0.05 was considered statistically significant in the prognostic signature analysis. Finally, we built and validated a predictive nomogram.21 Clinical parameters like age, race, tumor stage, histological type, grade, and tumor status, and the risk score model, were used to build a nomogram to investigate the probability of 1-, 3-, and 5-OS of EC. Validity of the nomogram was assessed by discrimination and calibration.
Association of Prognostic Signature with Immune Cell Infiltration
To investigate the prognostic signature, CIBERSORT was used to search the most significant tumor‐infiltrating immune cells and prognostic signature of the risk score.22 We explored the relationship between the risk score and the significant immune cells, including B cells memory fraction, B cells naive fraction, dendritic cells activated fraction, dendritic cells resting fraction, eosinophils fraction, macrophages M0 fraction, macrophages M1 fraction, macrophages M2 fraction, mast cells resting fraction, monocytes fraction, neutrophils fraction, NK cells activated fraction, NK cells resting fraction, plasma cells fraction, T cells CD4 memory activated fraction, T cells CD4 memory resting fraction, T cells CD8 fraction, T cells follicular helper fraction, T cells gamma delta fraction, and T cells regulatory (Tregs) fraction. The Tumor Immune Estimation Resource 2.0 (TIMER 2.0) (http://timer.cistrome.org/) provides more robust estimation of immune infiltration levels for The Cancer Genome Atlas (TCGA). It can be used to perform Spearman correlation analysis between multiple TIICs and specific gene, which is used to validate the immunologic correlation in this study.
Results
Analysis of DE-miRNAs
Totally, 55 downregulated and 181 upregulated miRNAs were screened out in EC samples (Supplemental Figure 1A). Supplemental Figure 1B showed the heat map of DE-miRNAs.
Target Genes of DE-miRNAs
DE-miRNA-gene pairs in the three databases were chosen to obtain reliable miRNA–gene pairs. As a result, 1927 target genes were paired with upregulated miRNAs, and 1029 target genes with downregulated miRNAs (Supplemental Table 2).
Candidate DE-mRNAs and Their Target Genes
We screened out 3804 downregulated and 7727 upregulated mRNAs, and confirmed the corresponding target genes (Supplemental Figure 2A). The heat map of DE-mRNAs was presented in Supplemental Figure 2B.
Differentially Expressed Genes
Abundant studies have proved the inverse relationship between miRNAs and target genes.23 Our study screened out 1927 target genes for upregulated miRNAs and 1029 target genes for downregulated miRNAs. We also identified 7727 upregulated and 3804 downregulated target genes of DE-mRNAs. After analyzing DE-mRNAs and target genes of DE-miRNAs, 275 and 118 candidate DEGs for upregulated and downregulated DE-miRNAs were identified, respectively (Figure 2).
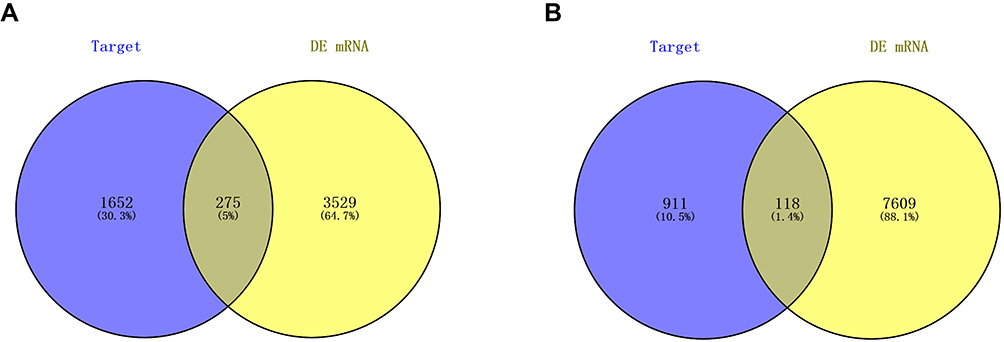 |
Figure 2 Screening of candidate DEGs. (A) The intersection of target genes of upregulated DE-miRNAs and downregulated target genes of DE-mRNAs; (B) the intersection of target genes of downregulated DE-miRNAs and upregulated target genes of DE-mRNAs. Blue represents target genes of DE-miRNAs. Yellow represents DE-mRNAs. Abbreviations: DE-miRNAs, differentially expressed microRNAs; DE-mRNAs, differentially expressed messenger RNAs; DEGs, differentially expressed genes. |
Functional and Pathway Enrichment Analysis
The GO functional annotation included BP, CC, and MF. Figure 3 presented the top 10 enriched GO items. In BP analysis, the candidate target genes of upregulated DE-miRNAs were significantly enriched in the cell migration involved in sprouting angiogenesis and the negative regulation of DNA-templated transcription (Figure 3A). In CC analysis, these genes were significantly enriched in chromatin and protein kinase complex (Figure 3C). The MF analysis revealed these genes were associated with vascular endothelial growth factor-activated receptor activity and transcription of RNA polymerase II (Figure 3E). BP analysis showed that the candidate target genes of downregulated DE-miRNAs were involved in the positive and negative feedback regulation of DNA-templated transcription (Figure 3B). In CC analysis, these genes were significantly enriched in nuclear transcription factor complex and chromatin in telomeric region (Figure 3D). MF analysis indicated that these genes were significantly enriched in AT DNA binding and retinoid X receptor binding (Figure 3F). KEGG pathway enrichment analysis showed that the upregulated DE-miRNAs were enriched in FOXO signaling pathway, and Focal adhesion (Figure 3G). The downregulated DE-miRNAs were enriched in pathways in cancer and cell cycle (Figure 3H).
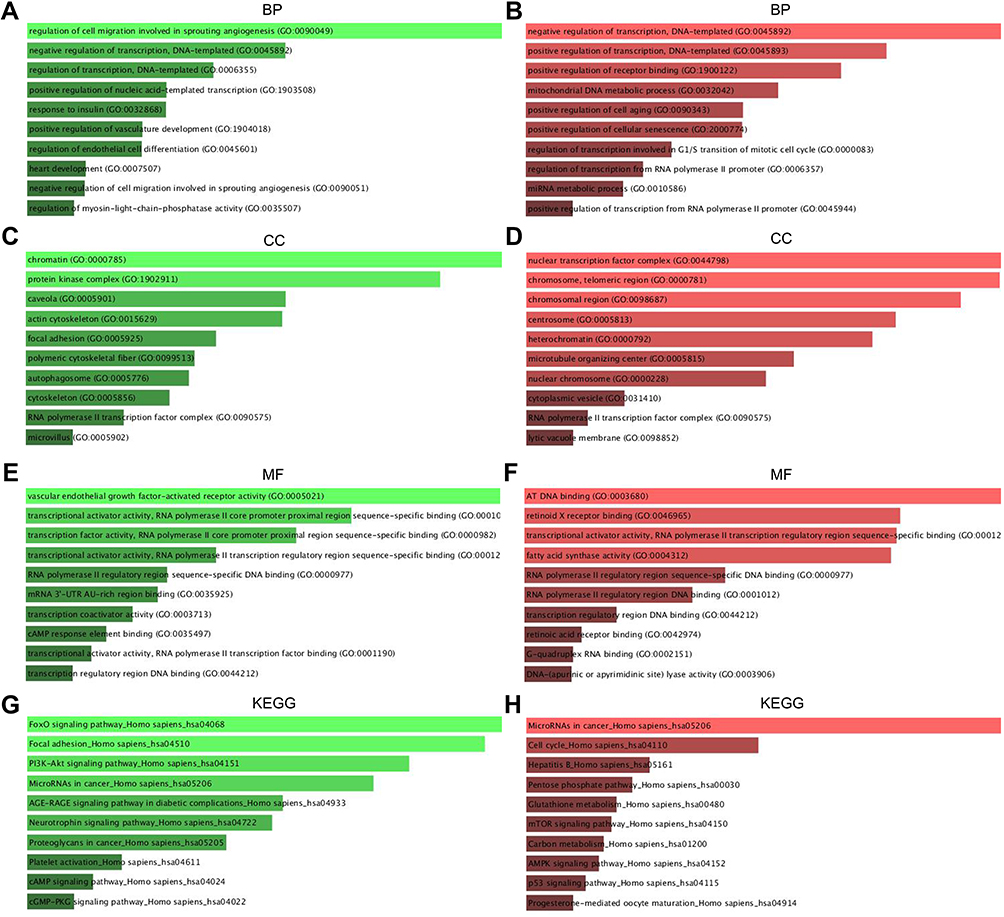 |
Figure 3 The enriched functions for DEGs of DE-mRNAs and DE-miRNAs. (A) The top 10 enriched BP items of downregulated candidate genes; (B) the top 10 enriched BP items of upregulated candidate genes; (C) the top 10 enriched CC items of downregulated candidate genes; (D) the top 10 enriched CC items of upregulated candidate genes; (E) the top 10 enriched MF items of downregulated candidate genes; (F) the top 10 enriched MF items of upregulated candidate genes (GO: gene ontology); (G) the top 10 enriched KEGG items of downregulated candidate genes; (H) the top 10 enriched KEGG items of downregulated candidate genes. Abbreviations: KEGG, The Kyoto Encyclopedia of Genes and Genomes; BP, biological process; CC, cellular component; MF, molecular function. |
PPI Network and Hub Genes
PPI network of these genes was constructed after mapping these candidate DEGs into the STRING database (Figure 4A and B). Totally, 275 and 118 node pairs of upregulated and downregulated DE-miRNAs for candidate target genes were obtained. The top 10 hub genes of upregulated DE-miRNAs are listed in Supplemental Figure 3A. The top 10 hub genes of downregulated DE-miRNAs are shown in Supplemental Figure 4B.
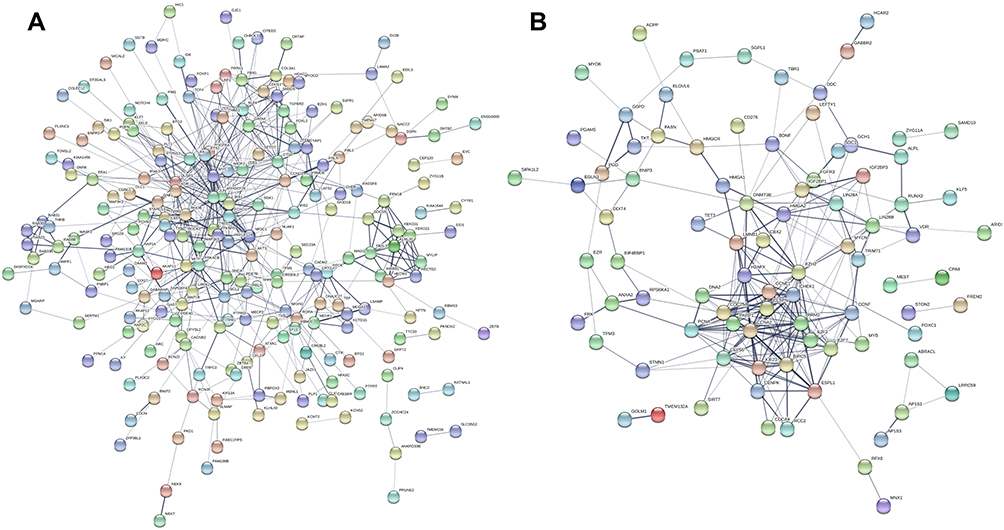 |
Figure 4 PPI network of the candidate target genes. (A) Upregulated DE-miRNAs; (B) downregulated DE-miRNAs. Abbreviation: PPI, protein–protein interaction. |
Hub Gene Expression Levels
Using GEPIA database, we found the expression of the 10 hub genes of downregulated DE-miRNAs was significantly higher in EC tissues than in normal ones (Figure 5A–Q). Marked upregulation was found in 7 out of 10 hub genes of upregulated DE-miRNAs in EC tissues compared with normal tissues. No significant difference was observed in MYC, PRKACB, and GATA4 expression between the EC and normal tissues (p > 0.05).
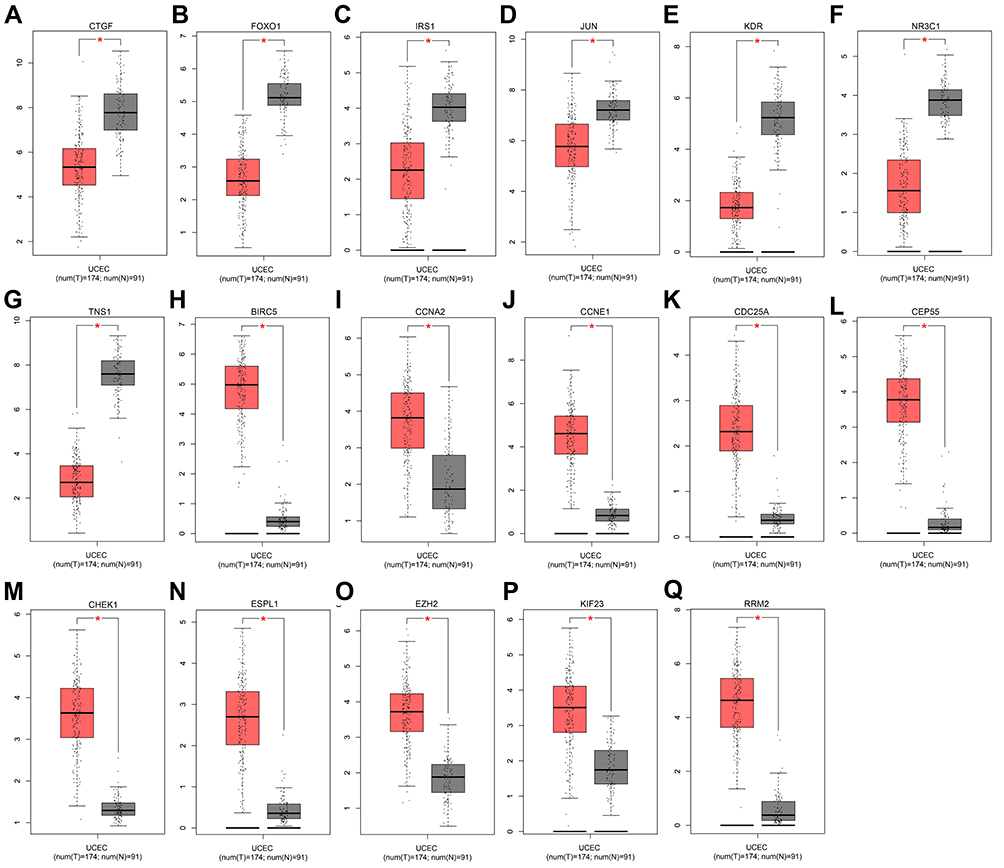 |
Figure 5 The expression levels of 17 hub genes from the GEPIA database. (A) CTGF expression; (B) FOXO1 expression; (C) IRS1 expression; (D) JUN expression; (E) KDR expression; (F) NR3C1 expression; (G) TNS1 expression; (H) BIRC5 expression; (I) CCNA2 expression; (J) CCNE1 expression; (K) CDC25A expression; (L) CEP55 expression; (M) CHEK1 expression; (N) ESPL1 expression; (O) EZH2 expression; (P) KIF23 expression; (Q) RRM2 expression. *p < 0.05. |
miRNA-mRNA Regulatory Pathways and Corresponding Transcription Factors
We established an miRNA-mRNA regulatory network about EC occurrence and progression (Figure 6A). Different genes might be regulated by the same miRNA. For example, miR-424-5p targeted the largest number of genes (KIF23, CHEK1, CEP55, CDC25A, and CCNE1) i, suggesting that miR-424-5p might play a significant part in the development of EC. On the other hand, different miRNAs could regulate the same gene, indicating their vital role in the progression of EC. For example, NR3C1, FOXO1, and JUN were, respectively, targeted by three miRNAs. Via FunRich software, the top five transcription factors for upregulated and downregulated DE-miRNAs were obtained (Figure 6B and C).
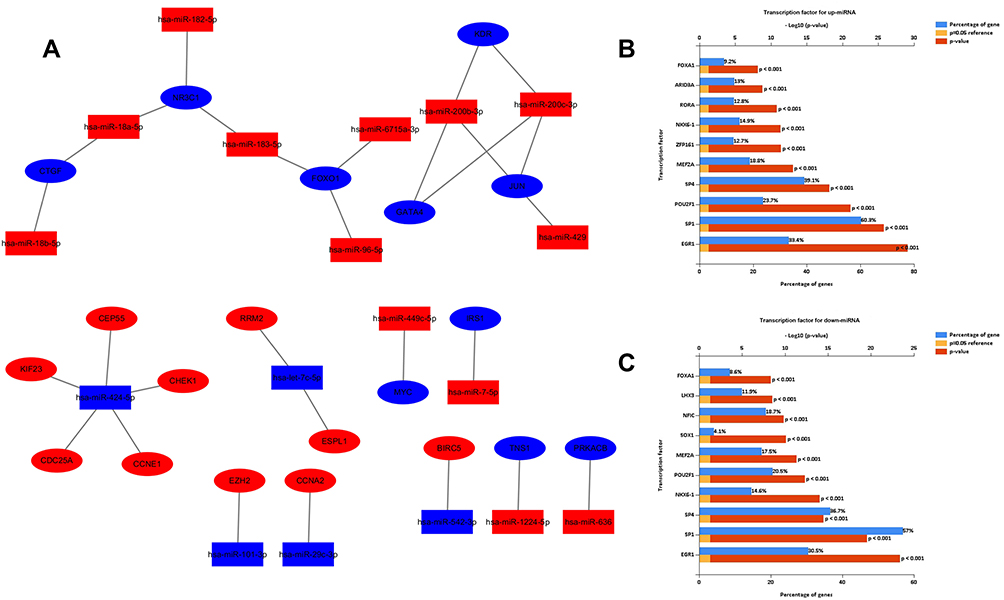 |
Figure 6 Regulatory network of miRNA-mRNAs and corresponding transcription factors. (A) Regulatory network of RC‐associated genes and their target miRNAs (red: upregulation, blue: downregulation, oval: mRNA, rectangle: miRNA); (B) predicted transcription factors of upregulated DE-miRNAs; (C) transcription factors of downregulated DE-miRNAs. |
Since 12 of the 18 miRNAs in the network were verified in EC, and their expression levels were consistent with our results, we assessed the remaining six miRNAs in EC. The results (Figure 7A–L) demonstrated that expression levels of miRNA-18a-5p, miRNA-18b-5p, miRNA-449c-5p and miRNA-1224-5p were markedly upregulated in EC tumors compared with those in paratumor tissues. Of note, miRNA-636 expression was significantly downregulated, which was inconsistent with our prediction. The expression of miRNA-6715a-3p showed no difference between EC and adjacent normal tissues (Figure 7F). qRT-PCR revealed that NR3C1, CTGF, MYC, TNS1, PRKACB, and FOXO1 had a higher expression in tumors than in paratumor tissues (Figure 7J–L). The above results indicated that miRNA-18a-5p, miRNA-18b-5p, miRNA-449c-5p and miRNA-1224-5p and their target genes might play a more powerful role than miRNA-636 and miRNA-6715a-3p and their target genes in EC development.
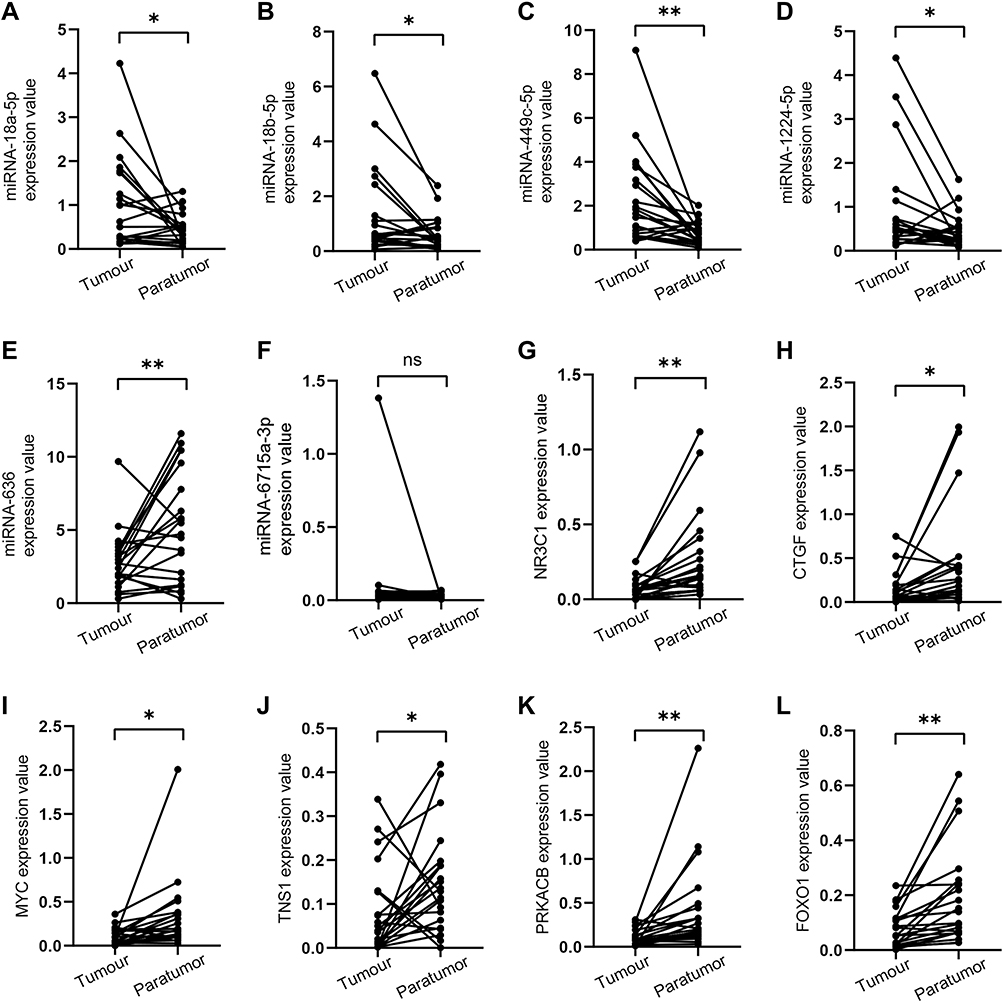 |
Figure 7 Expression of potential miRNAs and target genes in EC tissues and normal adjacent tissues. (A–F) miRNA expression levels; (G–L) mRNA expression levels. *p<0.05; **p<0.01. Abbreviation: ns, no statistic. |
Prognostic Signature Model
A prognostic analysis was conducted based on the 20 hub genes (Supplemental Figure 3). The top eight significant prognostic factors were ESPL1, NR3C1, CCNE1, GATA4, KIF23, EZH2, CDC25A, and BIRC5, as shown in the univariate Cox proportional hazards regression analysis (Supplemental Table 3). The genes NR3C1, EZH2, and GATA4 exhibited a significant prognostic value in the multivariate Cox proportional hazards regression analysis. Immunohistochemistry also confirmed the differential expression of NR3C1, EZH2, and GATA4 in normal endometrial tissues (Supplemental Figure 4A, 4C, and 4E) and endometrial carcinoma tissues (Supplemental Figure 4B, 4D, and 4F) based on the Human Protein Atlas (HPA, https://www.proteinatlas.org/). The hazard ratios of NR3C1, EZH2, and GATA4 were positive, suggesting their negative correlation with prognosis. The following formula was used to calculate the patient’s risk score:
Risk score = 0.284183* NR3C1 + 0.401466* EZH2 + 0.089382* GATA4
Kaplan–Meier curve was plotted to compare the survival time of low-risk patients and high-risk patients. The results showed that the low-risk patients had significantly longer overall survival time than the high-risk ones (p< 0.0001; Figure 8A). The areas under the time-dependent survival ROC curves were more than 0.656 in both groups, indicating the good performance of our risk model in predicting 1-, 3-, and 5-year survival (Figure 8B). We also analyzed the risk score distribution, survival status, and the expression of three genes for each patient (Figure 8C–E). The heatmap (Figure 9A) showed comparison of clinicopathological features between the two groups. Significant differences were found between the two group in terms of grade, age, stage, histological type, and tumor status (p < 0.01). Univariate Cox regression analysis and multivariate Cox regression analysis proved that this prognostic model could be an independent prognostic indicator of EC (Figure 9B and C). It was also found that high‐risk patients in age ≥60 years old and stage III/IV subgroups were prone to a worse OS (Figure 9D and E). A nomogram was then constructed to predict 1-year, 3-year, and 5-year OS in 482 EC patients using seven prognostic factors including age, race, stage, histological type, grade, tumor status, and the risk score (Figure 10A–D). The nomogram, combined with the model, might be used to predict survival time of EC patients in clinical practice.
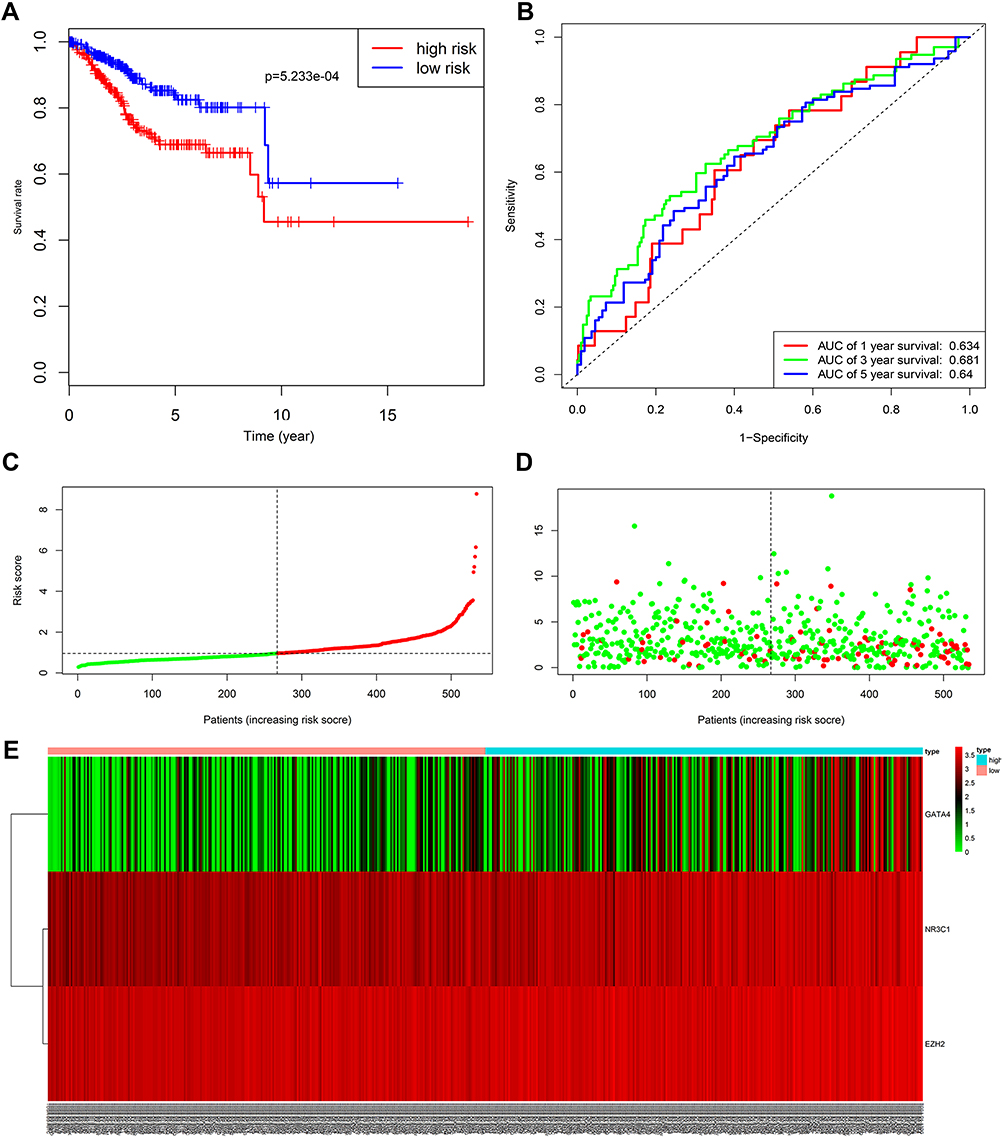 |
Figure 8 Analysis of the prognostic model between low- and high-risk groups. (A) Kaplan-Meier survival curve of overall survival between the high-risk group and low-risk group; (B) the time-dependent survival ROC curves; (C) the distributions of risk score; (D) survival status; (E) the heatmap showing the expression levels of the three genes in low- and high-risk groups. Abbreviation: ROC, receiver operating characteristic. |
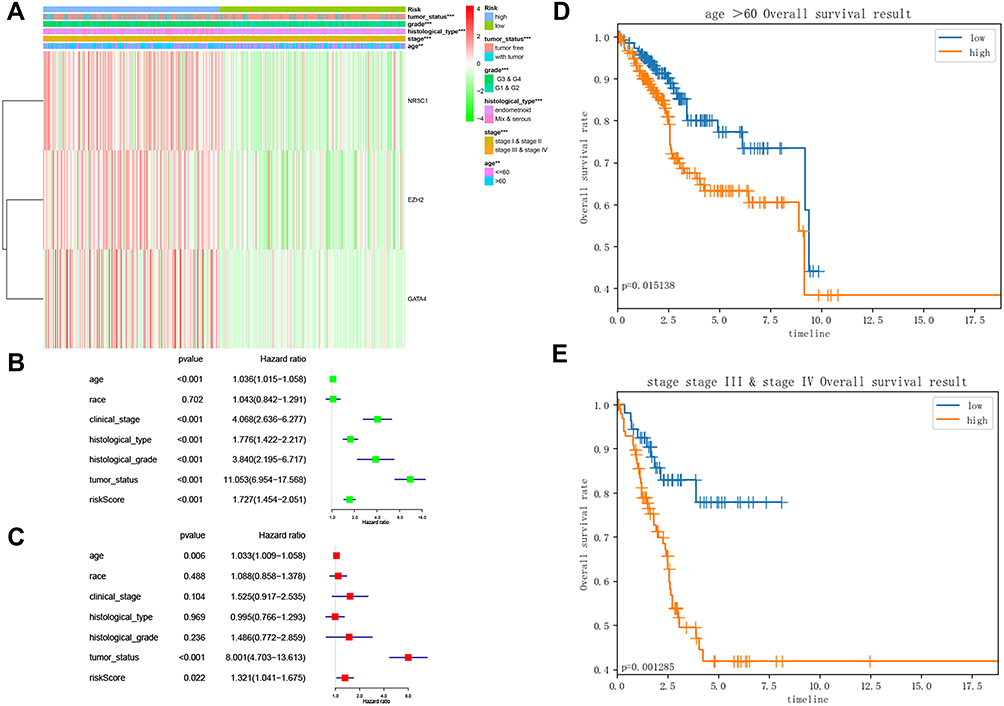 |
Figure 9 Study of the factors impacting EC prognosis. (A) The heatmap comparing the distribution of clinicopathological features in the low- and high-risk groups. **p<0.01; ***p<0.001; (B) Forest Plot for univariate Cox regression analysis of clinical factors and risk score; (C) Forest Plot for multivariate Cox regression analysis of clinical factors and risk score; (D) Kaplan-Meier survival curve of age ≥60 years old subgroup between the low- and high-risk groups for the overall survival rate in EC; (E) Kaplan-Meier survival curve of stage III/IV subgroup between the low- and high-risk groups for the overall survival rate in EC. Abbreviation: EC, endometrial cancer. |
 |
Figure 10 Nomogram predicting overall survival for EC patients. (A) For each patient, seven lines are drawn upward to determine the points received from the seven predictors in the nomogram. The sum of these points is located on the ‘Points’ axis. Then a line is drawn downward to determine the possibility of 1‑, 3‑, and 5‑year overall survival of EC. (B–D) The calibration plot for internal validation of the 1‑, 3‑, and 5‑year overall survival nomogram. Y‑axis: actual survival; X‑axis: nomogram‑predicted survival. Abbreviation: EC, endometrial cancer. |
Prognostic Signature Associated with Immune Cells Infiltration
We used CIBERSORT method to search the most significant tumor‐infiltrating immune cells and prognostic signature of risk score. The genes NR3C1, EZH2, and GATA4 in the prognostic model were associated with the enumeration and activation of immune cells. A close relationship was also confirmed between the three genes and the eight types of immune infiltration cells, including B cells naive fraction, macrophages M1 fraction, neutrophils fraction, T cells CD4 memory resting fraction, T cells follicular helper fraction, T cells gamma delta fraction, and T cells regulatory (Tregs) fraction (Figure 11A–G). In addition, TIMER 2.0 was also used to validate the correlation between three hub genes and tumor-infiltrating immune cells (TIICs). The results showed that NR3C1, EZH2, and GATA4 were all correlated with some certain TIICs (Supplemental Figure 5A–C).
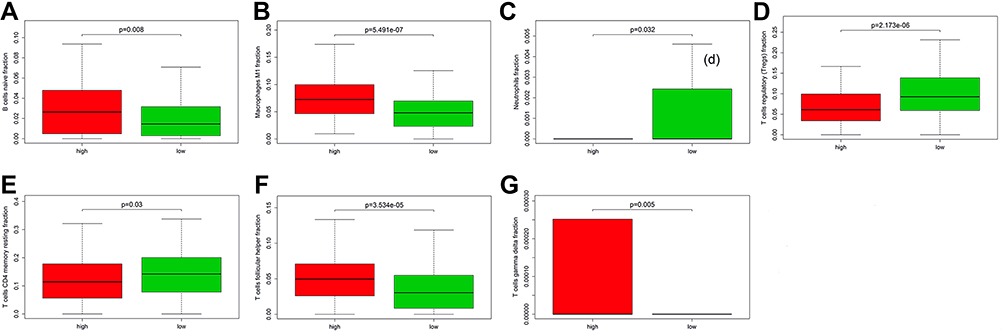 |
Figure 11 Relationship of risk score with the significant immune cell. (A) B cells naive fraction; (B) macrophages M1; (C) neutrophils; (D) T cells regulatory (Tregs); (E) T cells CD4 memory resting; (F) T cells follicular helper; (G) T cells gamma delta. |
Discussion
Recent studies have mentioned that the expression of miRNAs and their downstream targets is closely related to EC development. For the first time in this study, we constructed a regulatory network using EC-associated genes and DE-miRNAs. Besides, we built a prognostic model based on hub genes, and confirmed the relationship between immune cell infiltration and the prognostic signature of risk score.
In our study, Five downregulated DE-miRNAs and 13 upregulated DE-miRNAs were finally determined, among which miR-424-5p targeted the largest number of genes (KIF23, CHEK1, CEP55, CDC25A, and CCNE1) in the regulatory network, suggesting its significant role in the development of EC. Our analytic results on the expression of DE-miRNAs were mostly consistent with the previous studies. For example, the miR-424-5p and let-7c-5p expression levels were lower in EC tissues than in normal tissue.24,25 The significant down-regulation of miR-542-3p in EC26,27 promoted the morphological change of endometrial stromal cells.28 The lowered expression of miR-101-3p was significantly correlated with a poor overall survival; miR-101-3p regulated the cell proliferation in the carcinogenesis of endometrial serous carcinoma.29 miR-96-5p, miR-182, miR-7, and miR-183-5p were significantly up-regulated in EC compared with normal endometrium.30,31 The miR-200 family (miR-200b, miR-200c, and miR-429) in EC was upregulated compared with that in normal endometrial tissues.32 Li et al identified that miRNA-29c-3p (a tumor suppressor) was significantly lower in EC cells and was linked to the low paclitaxel sensitivity of EC.33 However, some miRNAs were found to be related to other tumors rather than EC. For instance, a research revealed the significantly higher expression of miR-636 and the significantly lower expression of miR-18a-5p in breast cancer than in normal samples.34 Wu et al detected a lower miR-449c-5p level in gastric cancer (GC), which was correlated with a lower survival rate.35 miR-18b-5p was upregulated in breast cancer.36,37 Compared with normal tissues, miR-1224-5p was significantly down-regulated in lung cancer tissues.38 Although most miRNAs in the network have been reported to be associated with cancer, miR-6715a-3p has not yet been reported. According to the present network, miR-6715a-3p might be related to EC. However, further qRT-PCR found a higher expression of miR-6715a-3p in EC tissues than in the adjacent tissues but with no significant difference, which might be caused by the small sample size.
We built the PPI network and identified the top 20 hub genes (10 upregulated and 10 downregulated ones). The expressions of these hub genes in EC were assessed using GEPIA database, which included more normal samples than TCGA.19 Inspiringly, the expression levels of these genes were generally consistent with our results of TCGA mRNA data. Most of these genes were key modulators of EC. For example, c-myc was found activated in multiple human tumors (including EC) with a poor prognosis;39,40 c-myc was proved to promote EC growth through many pathways.41–43 The histone methyltransferase EZH2 promoted EC cell growth through H3K27 trimethylation.44 CCNA2 knockdown decreased the cell proliferation in human EC cell lines.45 Based on the above results, we built an miRNA-mRNA regulatory network. In this network, most miRNA-mRNA pairs might contribute to the pathogenesis of EC, making them potential therapeutic targets.
Since miRNA expression is modulated by transcription factors,46,47 we speculated that these DE-miRNAs could be regulated by the transcription factors. Specific protein-1 (Sp1), a zinc-finger transcription factor of the Sp/KLF family, can bind to GC-rich promoter elements like GC-boxes, CACCC-boxes and related motif.48–50 Sp1, which regulates the expression of genes involved in cell cycle, proliferation and death,51,52 has been reported as an miRNA target.53,54 But few studies have reported its role in miRNA expression modulation and its function in EC. For instance, Sp1 was verified as a target of miR-490, and Sp1 knockdown could reverse the effects of miR-490 inhibition on the malignant behaviors of EC, providing a new strategy for EC therapy.55 The functions of these transcription factors in EC need further experimental exploration in the future.
In this study, we developed a three-gene signature (GATA4, NR3C1, and EZH2) from the 20 hub genes. These three key genes are correlated to tumorigenesis, development, and metastasis. The abnormal expression of GATA4 has been reported to be associated with the onset and progression of some solid tumors, but whether GATA4 is an oncogenic driver or a tumor suppressor in oncogenesis is unclear. Chia et al56 found that KLF5/GATA4/GATA6 might promote GC development by engaging in mutual crosstalk, and maintaining a pro-oncogenic transcriptional regulatory network in GC. A recent study also demonstrated that GATA4 promoted oncogenesis by inhibiting miR125b-dependent suppression of DKK3 expression.57 However, Han et al discovered that GATA4 could suppress tumor by repressing the NF-κB signaling in cells of breast cancer.58 Compared with samples of non-neoplastic endometrium, the EC group showed significant higher methylation in GATA4 gene.59 In addition, nuclear receptor subfamily 3 group C member 1 (NR3C1), a member of the nuclear hormone receptor super family of ligand-activated transcription factors, regulated the glucocorticoid hormone activities and changed gene expression in target cells and tissues.60 NR3C1 was identified as epigenetically deregulated gene in gastrointestinal tumorigenesis.61,62 NR3C1 was correlated with liver metastasis of GC63 and highly methylated in GC, indicating that it might play a pivotal role in the initiation and progression of GC. The variants of NR3C1, namely rs4912913, rs33388 and rs12521436, might contribute to GC susceptibility.64,65 EZH2, the enzymatic subunit of the polycomb-repressive complex 2 (PRC2) that catalyzes H3K27 methylation, is a most frequently mutated epigenetic regulator in hematologic malignancies. A recent study indicated that EZH2, as a potential anti-EC therapeutic target, could drive EC progression by regulating miR-361/Twist signaling, which is consistent with our research.66 These findings suggest that the three-genes signature can help clinicians to select high-risk patients from those with identical clinical or molecular characteristics and make rational treatment decisions.
EC is a group of heterogeneous tumors with distinct characteristics. High-throughput technologies bring EC with a possibility of targeted therapies. Currently, immunotherapies, such as anti-cancer vaccines, anti-PD-1 monoclonal antibody, and adoptive cell transfer, have emerged as alternative treatments for EC.67 Therefore, it is critical to identify molecular subgroups that are amenable to targeted therapies, including immunotherapy. We established a prognostic model to compare the enumeration and activation of immune cell subtypes between high-risk and low-risk groups. Many studies have supported the key role of immune infiltration in the development of cancer. For example, T cells could induce dormancy or promote multistage carcinogenesis. The degree of T cell infiltration in tumor could predict the patient’s response to cancer immunotherapy.68 High T cell density in tumor and immune cells was once considered as an active anti-tumor response.69 Tumor-associated macrophages, especially M1 macrophages, became tumoricidal in a less hypoxic environment and less exposed to tumor-derived cytokines.70,71 Besides, in the advanced stage of tumor, M1 macrophages tended to polarize into M2 macrophages, thus having protumor function.72
The present study has some limitations. First, the sample size in TCGA database is not large enough. Second, the association of these miRNA-mRNA pairs needs to be validated by experiments. In the future, more in vitro and in vivo functional experiments should be performed on the miRNA-mRNA regulatory pathways in EC.
Conclusion
The miRNA-mRNA regulatory network in EC was established and three hub genes were screened out from hundreds of candidate genes by bioinformatics analysis. Moreover, we identified a three-gene prognostic signature as a prognostic predictor for EC. The findings of this study may provide theoretical reference for the exploration of the biomarkers for the diagnosis and prognosis of EC.
Abbreviations
EC, endometrial cancer; DE-miRNAs, differentially expressed; DE-mRNAs, differentially expressed mRNAs; DEGs, the differentially expressed genes; FC, fold change; GO, gene ontology; KEGG, The Kyoto Encyclopedia of Genes and Genomes; BP, biological process; CC, cellular component; MF, molecular function; microRNAs, microRNAs; mRNAs, messenger RNAs; PPI, protein–protein interaction; FDR, false discovery rate.
Data Sharing Statement
EC mRNA and miRNA data can be downloaded from TCGA database (http://cancergenome.nih.gov/publications/publicationguidelines).
Ethics Approval and Consent to Participate
Endometrial cancer tissues and pericarcinomatous tissues were obtained from patients of the First Affiliated Hospital of Nanjing Medical University. The clinical program was approved by the ethics committee of the First Affiliated Hospital of Nanjing Medical University. All patients individually signed informed consent.
Consent for Publication
All parties consented for publication.
Acknowledgment
The principal authors are very grateful for the data support provided by the TCGA databases.
Author Contributions
All authors made a significant contribution to the work reported, whether that is in the conception, study design, execution, acquisition of data, analysis and interpretation, or in all these areas; took part in drafting, revising or critically reviewing the article; gave final approval of the version to be published; have agreed on the journal to which the article has been submitted; and agree to be accountable for all aspects of the work.
Funding
This work was supported by the National Natural Science Foundation of China (8187101839) and the Jiangsu Province Medical Innovation Team (No. CXTDA2017008).
Disclosure
The authors report no conflicts of interest for this work.
References
1. Chu D, Wu J, Wang K, et al. Effect of metformin use on the risk and prognosis of endometrial cancer: a systematic review and meta-analysis. Bmc Cancer. 2018;18:438. doi:10.1186/s12885-018-4334-5
2. Morice P, Leary A, Creutzberg C, Abu-Rustum N, Darai E. Endometrial cancer. Lancet. 2016;387:1094–1108. doi:10.1016/S0140-6736(15)00130-0
3. Lee YC, Lheureux S, Oza AM. Treatment strategies for endometrial cancer: current practice and perspective. Curr Opin Obstet Gynecol. 2017;29:47–58. doi:10.1097/GCO.0000000000000338
4. Ramon LA, Braza-Boils A, Gilabert J, et al. microRNAs related to angiogenesis are dysregulated in endometrioid endometrial cancer. Hum Reprod. 2012;27:3036–3045. doi:10.1093/humrep/des292
5. Yan R, Yang T, Zhai H, Zhou Z, Gao L, Li Y. MicroRNA-150-5p affects cell proliferation, apoptosis, and EMT by regulation of the BRAF (V600E) mutation in papillary thyroid cancer cells. J Cell Biochem. 2018;119:8763–8772. doi:10.1002/jcb.27108
6. Yang Z, Zhang T, Wang Q, Gao H. Overexpression of microRNA-34a attenuates proliferation and induces apoptosis in pituitary adenoma cells via SOX7. Mol Ther Oncolytics. 2018;10:40–47. doi:10.1016/j.omto.2018.07.001
7. Li P, Xie XB, Chen Q, et al. MiRNA-15a mediates cell cycle arrest and potentiates apoptosis in breast cancer cells by targeting synuclein-gamma. Asian Pac J Cancer Prev. 2014;15:6949–6954. doi:10.7314/apjcp.2014.15.16.6949
8. Xiao R, Li C, Chai B. miRNA-144 suppresses proliferation and migration of colorectal cancer cells through GSPT1. Biomed Pharmacother. 2015;74:138–144. doi:10.1016/j.biopha.2015.08.006
9. Dotto GP, Karine L. miR-34a/SIRT6 in squamous differentiation and cancer. Cell Cycle. 2014;13:1055–1056. doi:10.4161/cc.28378
10. Si W, Shen J, Du C, et al. A miR-20a/MAPK1/c-Myc regulatory feedback loop regulates breast carcinogenesis and chemoresistance. Cell Death Differ. 2018;25:406–420. doi:10.1038/cdd.2017.176
11. Carreras-Badosa G, Bonmati A, Ortega FJ, et al. Altered circulating miRNA expression profile in pregestational and gestational obesity. J Clin Endocrinol Metab. 2015;100:E1446–E1456. doi:10.1210/jc.2015-2872
12. Ohlsson TE, Van der Hoek KH, Van der Hoek MB, et al. MicroRNA-regulated pathways associated with endometriosis. Mol Endocrinol. 2009;23:265–275. doi:10.1210/me.2008-0387
13. Sonkoly E, Pivarcsi A. microRNAs in inflammation. Int Rev Immunol. 2009;28:535–561. doi:10.3109/08830180903208303
14. Joladarashi D, Thandavarayan RA, Babu SS, Krishnamurthy P. Small engine, big power: microRNAs as regulators of cardiac diseases and regeneration. Int J Mol Sci. 2014;15:15891–15911. doi:10.3390/ijms150915891
15. Ramon LA, Braza-Boils A, Gilabert-Estelles J, et al. microRNAs expression in endometriosis and their relation to angiogenic factors. Hum Reprod. 2011;26:1082–1090. doi:10.1093/humrep/der025
16. Gilabert-Estelles J, Braza-Boils A, Ramon LA, et al. Role of microRNAs in gynecological pathology. Curr Med Chem. 2012;19:2406–2413. doi:10.2174/092986712800269362
17. Cohn DE, Fabbri M, Valeri N, et al. Comprehensive miRNA profiling of surgically staged endometrial cancer. Am J Obstet Gynecol. 2010;202:651–656. doi:10.1016/j.ajog.2010.02.051
18. Zhang W, Chen JH, Shan T, et al. miR-137 is a tumor suppressor in endometrial cancer and is repressed by DNA hypermethylation. Lab Invest. 2018;98:1397–1407. doi:10.1038/s41374-018-0092-x
19. Tang Z, Li C, Kang B, Gao G, Li C, Zhang Z. GEPIA: a web server for cancer and normal gene expression profiling and interactive analyses. Nucleic Acids Res. 2017;45:W98–W102. doi:10.1093/nar/gkx247
20. Zhang Z. Semi-parametric regression model for survival data: graphical visualization with R. Ann Transl Med. 2016;4:461. doi:10.21037/atm.2016.08.61
21. Iasonos A, Schrag D, Raj GV, Panageas KS. How to build and interpret a nomogram for cancer prognosis. J Clin Oncol. 2008;26:1364–1370. doi:10.1200/JCO.2007.12.9791
22. Newman AM, Liu CL, Green MR, et al. Robust enumeration of cell subsets from tissue expression profiles. Nat Methods. 2015;12:453–457. doi:10.1038/nmeth.3337
23. Hammond SM. An overview of microRNAs. Adv Drug Deliv Rev. 2015;87:3–14. doi:10.1016/j.addr.2015.05.001
24. Lu Z, Nian Z, Jingjing Z, Tao L, Quan L. MicroRNA-424/E2F6 feedback loop modulates cell invasion, migration and EMT in endometrial carcinoma. Oncotarget. 2017;8:114281–114291. doi:10.18632/oncotarget.23218
25. Xiong H, Li Q, Liu S, et al. Integrated microRNA and mRNA transcriptome sequencing reveals the potential roles of miRNAs in stage I endometrioid endometrial carcinoma. PLoS One. 2014;9:e110163. doi:10.1371/journal.pone.0110163
26. Jurcevic S, Olsson B, Klinga-Levan K. MicroRNA expression in human endometrial adenocarcinoma. Cancer Cell Int. 2014;14:88. doi:10.1186/s12935-014-0088-6
27. Devor EJ, Cha E, Warrier A, Miller MD, Gonzalez-Bosquet J, Leslie KK. The miR-503 cluster is coordinately under-expressed in endometrial endometrioid adenocarcinoma and targets many oncogenes, cell cycle genes, DNA repair genes and chemotherapy response genes. Onco Targets Ther. 2018;11:7205–7211. doi:10.2147/OTT.S180921
28. Tochigi H, Kajihara T, Mizuno Y, et al. Loss of miR-542-3p enhances IGFBP-1 expression in decidualizing human endometrial stromal cells. Sci Rep. 2017;7:40001. doi:10.1038/srep40001
29. Hiroki E, Akahira J, Suzuki F, et al. Changes in microRNA expression levels correlate with clinicopathological features and prognoses in endometrial serous adenocarcinomas. Cancer Sci. 2010;101:241–249. doi:10.1111/j.1349-7006.2009.01385.x
30. Myatt SS, Wang J, Monteiro LJ, et al. Definition of microRNAs that repress expression of the tumor suppressor gene FOXO1 in endometrial cancer. Cancer Res. 2010;70:367–377. doi:10.1158/0008-5472.CAN-09-1891
31. Chung TK, Lau TS, Cheung TH, et al. Dysregulation of microRNA-204 mediates migration and invasion of endometrial cancer by regulating FOXC1. Int J Cancer. 2012;130:1036–1045. doi:10.1002/ijc.26060
32. Lee JW, Park YA, Choi JJ, et al. The expression of the miRNA-200 family in endometrial endometrioid carcinoma. Gynecol Oncol. 2011;120:56–62. doi:10.1016/j.ygyno.2010.09.022
33. Li L, Shou H, Wang Q, Liu S. Investigation of the potential theranostic role of KDM5B/miR-29c signaling axis in paclitaxel resistant endometrial carcinoma. Gene. 2019;694:76–82. doi:10.1016/j.gene.2018.12.076
34. Encarnacion-Medina J, Ortiz C, Vergne R, Padilla L, Matta J. MicroRNA expression changes in women with breast cancer stratified by DNA repair capacity levels. J Oncol. 2019;2019:7820275. doi:10.1155/2019/7820275
35. Wu Z, Wang H, Fang S, Xu C. MiR-449c inhibits gastric carcinoma growth. Life Sci. 2015;137:14–19. doi:10.1016/j.lfs.2015.06.020
36. Fonseca-Sanchez MA, Perez-Plasencia C, Fernandez-Retana J, et al. microRNA-18b is upregulated in breast cancer and modulates genes involved in cell migration. Oncol Rep. 2013;30:2399–2410. doi:10.3892/or.2013.2691
37. Hong Y, Liang H, Uzair-Ur-Rehman, et al. miR-96 promotes cell proliferation, migration and invasion by targeting PTPN9 in breast cancer. Sci Rep. 2016;6:37421. doi:10.1038/srep37421
38. Yu PF, Wang Y, Lv W, et al. LncRNA NEAT1/miR-1224/KLF3 contributes to cell proliferation, apoptosis and invasion in lung cancer. Eur Rev Med Pharmacol Sci. 2019;23:8403–8410. doi:10.26355/eurrev_201910_19151
39. Dang CV. c-Myc target genes involved in cell growth, apoptosis, and metabolism. Mol Cell Biol. 1999;19:1–11. doi:10.1128/mcb.19.1.1
40. Geisler JP, Geisler HE, Manahan KJ, et al. Nuclear and cytoplasmic c-myc staining in endometrial carcinoma and their relationship to survival. Int J Gynecol Cancer. 2004;14:133–137. doi:10.1111/j.1048-891x.2004.14027.x
41. Subramaniam KS, Omar IS, Kwong SC, et al. Cancer-associated fibroblasts promote endometrial cancer growth via activation of interleukin-6/STAT-3/c-Myc pathway. Am J Cancer Res. 2016;6:200–213.
42. Qiu MT, Fan Q, Zhu Z, et al. KDM4B and KDM4A promote endometrial cancer progression by regulating androgen receptor, c-myc, and p27kip1. Oncotarget. 2015;6:31702–31720. doi:10.18632/oncotarget.5165
43. Bai JX, Yan B, Zhao ZN, et al. Tamoxifen represses miR-200 microRNAs and promotes epithelial-to-mesenchymal transition by up-regulating c-Myc in endometrial carcinoma cell lines. Endocrinology. 2013;154:635–645. doi:10.1210/en.2012-1607
44. Oki S, Sone K, Oda K, et al. Oncogenic histone methyltransferase EZH2: a novel prognostic marker with therapeutic potential in endometrial cancer. Oncotarget. 2017;8:40402–40411. doi:10.18632/oncotarget.16316
45. Huo X, Sun H, Cao D, et al. Identification of prognosis markers for endometrial cancer by integrated analysis of DNA methylation and RNA-Seq data. Sci Rep. 2019;9:9924. doi:10.1038/s41598-019-46195-8
46. Mullany LE, Herrick JS, Wolff RK, Stevens JR, Samowitz W, Slattery ML. MicroRNA-transcription factor interactions and their combined effect on target gene expression in colon cancer cases. Genes Chromosomes Cancer. 2018;57:192–202. doi:10.1002/gcc.22520
47. Mullany LE, Herrick JS, Wolff RK, Stevens JR, Samowitz W, Slattery ML. Transcription factor-microRNA associations and their impact on colorectal cancer survival. Mol Carcinog. 2017;56:2512–2526. doi:10.1002/mc.22698
48. Lania L, Majello B, De Luca P. Transcriptional regulation by the Sp family proteins. Int J Biochem Cell Biol. 1997;29:1313–1323. doi:10.1016/s1357-2725(97)00094-0
49. Yu JH, Schwartzbauer G, Kazlman A, Menon RK. Role of the Sp family of transcription factors in the ontogeny of growth hormone receptor gene expression. J Biol Chem. 1999;274:34327–34336. doi:10.1074/jbc.274.48.34327
50. Suske G. The Sp-family of transcription factors. Gene. 1999;238:291–300. doi:10.1016/s0378-1119(99)00357-1
51. Maor S, Mayer D, Yarden RI, et al. Estrogen receptor regulates insulin-like growth factor-I receptor gene expression in breast tumor cells: involvement of transcription factor Sp1. J Endocrinol. 2006;191:605–612. doi:10.1677/joe.1.07016
52. Tong Y, Tan Y, Zhou C, Melmed S. Pituitary tumor transforming gene interacts with Sp1 to modulate G1/S cell phase transition. Oncogene. 2007;26:5596–5605. doi:10.1038/sj.onc.1210339
53. Hu J, Shan Z, Hu K, et al. miRNA-223 inhibits epithelial-mesenchymal transition in gastric carcinoma cells via Sp1. Int J Oncol. 2016;49(1):325–335. doi:10.3892/ijo.2016.3533
54. Qin F, Zhao Y, Shang W, et al. Sinomenine relieves oxygen and glucose deprivation-induced microglial activation via inhibition of the SP1/miRNA-183-5p/IkappaB-alpha signaling pathway. Cell Mol Biol (Noisy-Le-Grand). 2018;64:140–147. doi:10.14715/cmb/2018.64.10.23
55. Shao W, Li Y, Chen F, Jia H, Jia J, Fu Y. Long non-coding RNA DLEU1 contributes to the development of endometrial cancer by sponging miR-490 to regulate SP1 expression. Pharmazie. 2018;73:379–385. doi:10.1691/ph.2018.8352
56. Chia NY, Deng N, Das K, et al. Regulatory crosstalk between lineage-survival oncogenes KLF5, GATA4 and GATA6 cooperatively promotes gastric cancer development. Gut. 2015;64:707–719. doi:10.1136/gutjnl-2013-306596
57. Pei Y, Yao Q, Yuan S, et al. GATA4 promotes hepatoblastoma cell proliferation by altering expression of miR125b and DKK3. Oncotarget. 2016;7:77890–77901. doi:10.18632/oncotarget.12839
58. Han X, Tang J, Chen T, Ren G. Restoration of GATA4 expression impedes breast cancer progression by transcriptional repression of ReLA and inhibition of NF-kappaB signaling. J Cell Biochem. 2019;120:917–927. doi:10.1002/jcb.27455
59. Chmelarova M, Kos S, Dvorakova E, et al. Importance of promoter methylation of GATA4 and TP53 genes in endometrioid carcinoma of endometrium. Clin Chem Lab Med. 2014;52:1229–1234. doi:10.1515/cclm-2013-0162
60. Sanchez-Vega B, Gandhi V. Glucocorticoid resistance in a multiple myeloma cell line is regulated by a transcription elongation block in the glucocorticoid receptor gene (NR3C1). Br J Haematol. 2009;144:856–864. doi:10.1111/j.1365-2141.2008.07549.x
61. Ahlquist T, Lind GE, Costa VL, et al. Gene methylation profiles of normal mucosa, and benign and malignant colorectal tumors identify early onset markers. Mol Cancer. 2008;7(1):94. doi:10.1186/1476-4598-7-94
62. Lind GE, Kleivi K, Meling GI, et al. ADAMTS1, CRABP1, and NR3C1 identified as epigenetically deregulated genes in colorectal tumorigenesis. Cell Oncol. 2006;28:259–272. doi:10.1155/2006/949506
63. Chang W, Ma L, Lin L, et al. Identification of novel hub genes associated with liver metastasis of gastric cancer. Int J Cancer. 2009;125:2844–2853. doi:10.1002/ijc.24699
64. Gu Y, Deng B, Kong J, et al. Functional polymorphisms in NR3C1 are associated with gastric cancer risk in Chinese population. Oncotarget. 2017;8:105312–105319. doi:10.18632/oncotarget.22172
65. Qu Y, Dang S, Hou P. Gene methylation in gastric cancer. Clin Chim Acta. 2013;424:53–65. doi:10.1016/j.cca.2013.05.002
66. Ihira K, Dong P, Xiong Y, et al. EZH2 inhibition suppresses endometrial cancer progression via miR-361/Twist axis. Oncotarget. 2017;8:13509–13520. doi:10.18632/oncotarget.14586
67. Di Tucci C, Capone C, Galati G, et al. Immunotherapy in endometrial cancer: new scenarios on the horizon. J Gynecol Oncol. 2019;30:e46. doi:10.3802/jgo.2019.30.e46
68. Teng MW, Ngiow SF, Ribas A, Smyth MJ. Classifying Cancers Based on T-cell Infiltration and PD-L1. Cancer Res. 2015;75:2139–2145. doi:10.1158/0008-5472.CAN-15-0255
69. Chen DS, Mellman I. Elements of cancer immunity and the cancer-immune set point. Nature. 2017;541:321–330. doi:10.1038/nature21349
70. Greten FR, Eckmann L, Greten TF, et al. IKKbeta links inflammation and tumorigenesis in a mouse model of colitis-associated cancer. Cell. 2004;118:285–296. doi:10.1016/j.cell.2004.07.013
71. Mantovani A, Sica A, Allavena P, Garlanda C, Locati M. Tumor-associated macrophages and the related myeloid-derived suppressor cells as a paradigm of the diversity of macrophage activation. Hum Immunol. 2009;70:325–330. doi:10.1016/j.humimm.2009.02.008
72. Dunn GP, Old LJ, Schreiber RD. The three Es of cancer immunoediting. Annu Rev Immunol. 2004;22:329–360. doi:10.1146/annurev.immunol.22.012703.104803
 © 2021 The Author(s). This work is published and licensed by Dove Medical Press Limited. The full terms of this license are available at https://www.dovepress.com/terms.php and incorporate the Creative Commons Attribution - Non Commercial (unported, v3.0) License.
By accessing the work you hereby accept the Terms. Non-commercial uses of the work are permitted without any further permission from Dove Medical Press Limited, provided the work is properly attributed. For permission for commercial use of this work, please see paragraphs 4.2 and 5 of our Terms.
© 2021 The Author(s). This work is published and licensed by Dove Medical Press Limited. The full terms of this license are available at https://www.dovepress.com/terms.php and incorporate the Creative Commons Attribution - Non Commercial (unported, v3.0) License.
By accessing the work you hereby accept the Terms. Non-commercial uses of the work are permitted without any further permission from Dove Medical Press Limited, provided the work is properly attributed. For permission for commercial use of this work, please see paragraphs 4.2 and 5 of our Terms.