")
Back to Journals » Journal of Inflammation Research » Volume 14
Construction of ceRNA Network to Reveal Potential Biomarkers in Crohn’s Disease and Validation in a TNBS Induced Mice Model
Received 13 September 2021
Accepted for publication 12 November 2021
Published 2 December 2021 Volume 2021:14 Pages 6447—6459
DOI https://doi.org/10.2147/JIR.S338053
Checked for plagiarism Yes
Review by Single anonymous peer review
Peer reviewer comments 2
Editor who approved publication: Professor Ning Quan
Chenglin Ye,1 Sizhe Zhu,2 Jingping Yuan1
1Department of Pathology, Renmin Hospital of Wuhan University, Wuhan, Hubei, People’s Republic of China; 2Department of Clinical Immunology, Tongji Hospital, Tongji Medical College, Huazhong University of Sciences and Technology, Wuhan, Hubei, People’s Republic of China
Correspondence: Jingping Yuan; Sizhe Zhu Email [email protected]; [email protected]
Purpose: We aimed to construct a competing endogenous RNA (ceRNA) network and explore the potential biomarkers in Crohn’s disease (CD) via bioinformatics analysis. Validation of candidate biomarkers in a 2,4,6-trinitrobenzene sulfonic acid (TNBS) induced experimental colitis model and ceRNA network in an HCT116 cell line was also an aim, along with purposing to reveal the pathogenesis of CD.
Methods: GSE102134 and GSE67106 datasets were obtained and used to screen the differentially expressed genes. WCGNA was applied to identify the relative model to construct the ceRNA network. Furthermore, the relationship between candidate gene and immune infiltration was investigated. Then, the expression of potential biomarkers was validated via qRT-PCR in a TNBS induced experimental colitis model. Finally, the ceRNA network was confirmed by RNAi experiments in an HCT116 cell line.
Results: The ceRNA network, consisting of four lncRNAs, four miRNAs, and eight mRNAs, was constructed and the ROC analysis showed four mRNAs (PTGS2, LPL, STAT1, and TRIB2) had high diagnostic accuracy (AUC> 0.9). In addition, upregulated PTGS2 was positively correlated with immune cell infiltration, including Natural killer cells, exhausted T-cells, monocytes, and Dendritic cells. The outcome of this TNBS induced experimental colitis model verified that the expression of PTGS2 and mir-429 was consistent with results of previous bioinformatics analysis. Furthermore, the predicted ceRNA network MIR3142HG/mir-429/PTGS2 were validated via RNA interference. Knockout of MIR3142HG decreased the mRNA level of PTGS2, whereas inhibition of mir-429 increased the mRNA level of PTGS2 in the HCT116 cell line.
Conclusion: The exploration of the ceRNA network in this work might contribute to understanding the pathogenesis of CD. The constructed MIR3142HG/mir-429/PTGS2 ceRNA network may play a role in CD, and PTGS2 can be a potential immune-related biomarker in CD.
Keywords: Crohn’s disease, ceRNA network, bioinformatics analysis, WCGNA, validation, experimental colitis mice model
Introduction
Crohn’s disease (CD) and ulcerative colitis are chronic inflammatory disorders of the gastrointestinal tract, with symptoms evolving in a relapsing and remitting manner that comprise the term inflammatory bowel disease (IBD).1 CD is characterized by the involvement of all parts of the intestine, the most common being the terminal ileum and colon.2,3 The complex interplay between genetic susceptibility, environmental factors, and altered gut microbiota, leading to dysregulated innate and adaptive immune responses, might result in CD.4 Although the mortality caused by CD is very low, the morbidity is still a serious problem, and a large number of CD patients do not respond to drug treatments and must undergo multiple operations to relieve symptoms.5 In addition, CD is incurable and increases the risk of lymphoma, biliary tract cancer, and colorectal cancer.6 In the past 10 years, CD has developed into a global disease, the prevalence on every continent is rising, adding a heavier economic burden to society. The incidence of CD in China, despie being lower than that in western countries, has increased rapidly with urbanization and industrialization. The current estimated incidence rate is 0.51–1.09 per 100,000.7–10 However, the pathogenesis and pathophysiology of CD are not yet fully understood.11 Therefore, it is crucial to explore the pathogenic mechanisms of CD.
In recent years, a new hypothesis of RNA is “competing endogenous RNA (ceRNA)”, which proposes the regulatory dialogue between different RNAs, including long noncoding RNAs (lncRNAs), microRNAs (miRNAs), transcribed pseudogenes, and circular RNAs.12 To date, lncRNAs have been proved to be involved in many cellular processes and pathological conditions.13 lncRNAs can serve as miRNA sponges and compete for reducing the ability of miRNA binding to protein-coding transcripts.14,15 At present, many studies have shown that ceRNA were implicated in different kinds of diseases, such as cancer, acute kidney injury, Alzheimer’s disease, and acute myocardial infarction.16–18 Emerging data have suggested that ceRNA networks play a pivotal role in progression in IBD.19,20
In this study, we obtained the data related to CD from the NCBI GEO, and compared an expression profile between CD and healthy controls. Following, mRNAs, miRNAs, LncRNAs of CD and normal samples were applied to differential expression analysis. Simultaneously, weighted correlation network analysis (WGCNA) was used to enrich modules to select mRNAs and lncRNAs most related to CD. Furthermore, miRWalk and LncBase databases were used to predict interacting mRNAs and lncRNAs. Thus, four lncRNAs, four miRNAs, and eight mRNAs were identified to construct a lncRNA–miRNA–mRNA ceRNA network in CD. Immune infiltration analysis was performed to investigate the effect of candidate mRNA biomarkers in regulation of immune cells. Furthermore, the expressions of candidates were validated in a 2,4,6-trinitrobenzene sulfonic acid (TNBS) induced colitis mice model. Finally, the predicted ceRNA network was confirmed via RNA interference (RNAi) in the HCT116 cell line. Collectively, our results provided insights into the molecular mechanism and investigated potential biomarkers of CD.
Materials and Methods
GEO Dataset Selection
A flowchart of the study design is shown in Figure 1. The expression profile datasets of lncRNAs, miRNAs, and mRNAs were downloaded from the NCBI GEO (www.ncbi.nlm.nih.gov/geo) database. lncRNAs, miRNAs, and mRNAs between active human CD tissue and matched normal tissue were included. The lncRNA expression profile data were obtained from GSE67106 (20 active CD tissues and 21 matched normal tissues from intestinal biopsies).21 miRNAs and mRNAs expression profiling data were obtained from GSE102134 (composed of GSE102127 and GSE 102133), GSE102127 (33 active CD tissues and six matched normal tissues from ileum biopsies) and GSE102133 (55 active CD tissues and 12 normal tissues from ileum biopsies) datasets.22 The validation set was GSE75214 (75 active CD tissues and 22 normal tissues from ileum biopsies).23
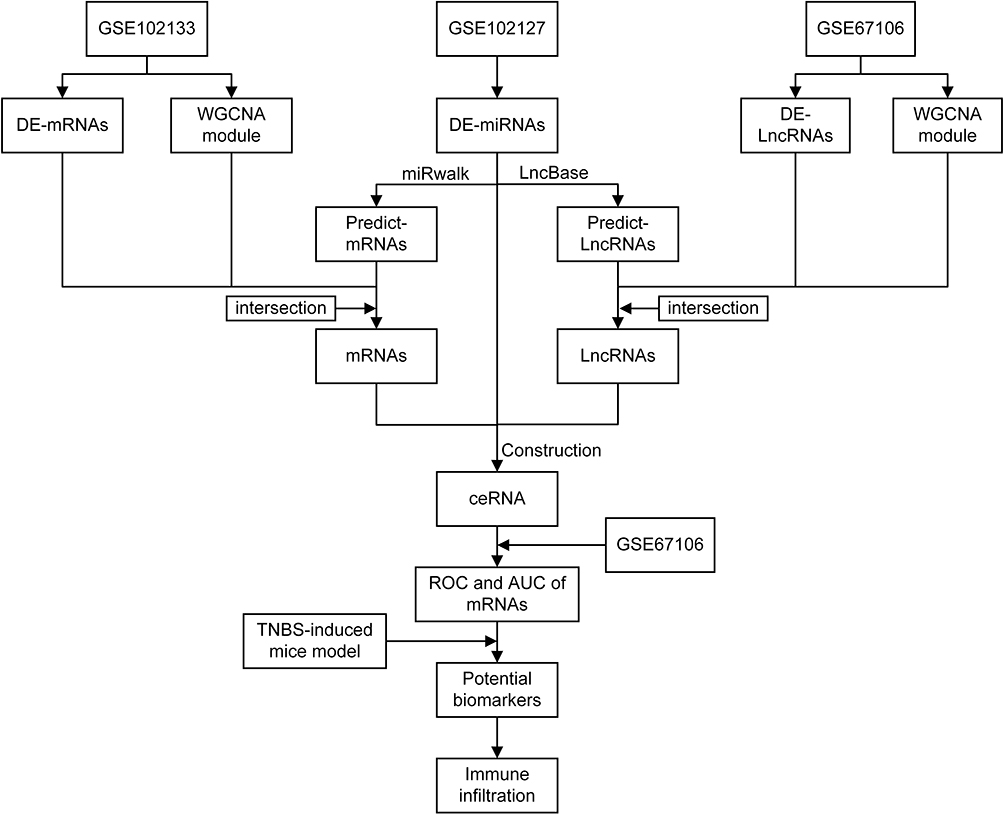 |
Figure 1 Flowchart of this work. |
Differential Expression Analysis and WGCNA
Differential expression analysis was performed by GEO2R, with an adjusted P-value<0.05, the log(fold-change) >1.0 or <−1.0 was defined as a DEmRNA, DEmiRNA, DElncRNA, respectively.
WGCNA was applied to assess the relative importance and module membership of lncRNAs and mRNAs.24 The minimum number of module genes was set at 30. The hierarchical clustering dendrogram summarized the Gene modules with different colors.
Gene Set Enrichment Analysis and Protein–Protein Interaction Network Building
The metascape database was used for functional annotation of genes. Gene ontology (GO) and Kyoto encyclopedia of genes and genomes (KEGG) pathway enrichment analyses were performed.25
A protein–protein interaction (PPI) network was constructed by the STRING database with high confidence (0.7), and line color indicates the type of interaction evidence.26 The hub genes were identified by Cytoscape cytohubba.
CeRNA Network Construction
The miRWalk database was used to predict the interaction between miRNA and mRNA.27 The LncBase database was applied to explore the interaction between miRNA and lncRNA.28 The intersection of DEmRNA, WGCNA module, and predict mRNA was selected to construct the ceRNA network, the same as the intersection of DElncRNA, WGCNA module, and predict lncRNA and DEmiRNA. The CeRNA network was visualized by Cytoscape.
Immune Infiltration Analysis
ImmuCellAI database was applied to estimate the differential of immune cell infiltration in two groups.29
TNBS Induced Colitis Mice Model
TNBS colitis belongs to the group of chemically induced colitis animal models, since it was introduced in 1989. It is the most common experimental colitis model to closely mimic CD, which shares features of human CD. Twenty specific pathogen-free (SPF) female C57BL/6J mice (8–10 weeks old, weighing 20∼22 g) were purchased from Beijing Vital River Laboratory Animal Technology Co. Ltd. All animal experiments were conducted in strict accordance with the Institutional Animal Care and Use Committees and Institutional Review Board (IRB) of Tongji Hospital. All experimental procedures of the mice were specifically approved for this study by the Medical Ethics Committee of Tongji Hospital and were carried out in accordance with institutional guidelines (TJ-IRB20182677) and guide for the care and use of laboratory animals (National Academies Press, 2011). All experimental procedures of the mice were specifically approved for this study by the Medical Ethics Committee of Tongji Hospital. All procedures on mice were performed under sodium pentobarbital anesthesia, and all efforts were made to minimize suffering. The TNBS induced mice model most commonly utilized animal models of CD and has shown a significant consistency that reflects their extensive use during the last decades.30 Before the induction of experimental colitis, a short fasting is needed of about 12 hours. Subsequently, the anesthesia is performed via sodium pentobarbital, then administered with 100 mg/kg TNBS in 50% ethanol, while the control group was only administered 50% ethanol. After that, the mice were held in a head down position in order to avoid expulsion of the fluid for a few minutes. All mice were euthanized on the 4th day and the colons were collected for further tests.
RNAi and Transfection
Human colon cancer cell line HCT116 cells were seeded in 6-wells plates at a density of 1.5×10⁶ cells/well and incubated at 50–60% confluence before transfection. Then, the cells were transfected with siRNA-MIR3142HG or mir-429 inhibitor or negative control (NC) (GenePharma, China) by using transfection reagent GP-transfect-Mate (GenePharma, China) according to the manufacturer’s protocol. Oligonucleotide sequences are listed in Supplementary Table S2.
qRT-PCR
TRIpure Reagent was used to extract total RNA from HCT116 cells and colon tissues of TNBS mice, and the PCR conditions were 95°C for 5 minutes, followed by 40 cycles of 95°C for 15 seconds, 60°C for 15 seconds, and 72°C for 30 seconds. The relative gene expression level was calculated using the 2-ΔΔCt method. To normalize the data, GAPDH was used as an internal reference. The sequences of the primers are shown in Table 1.
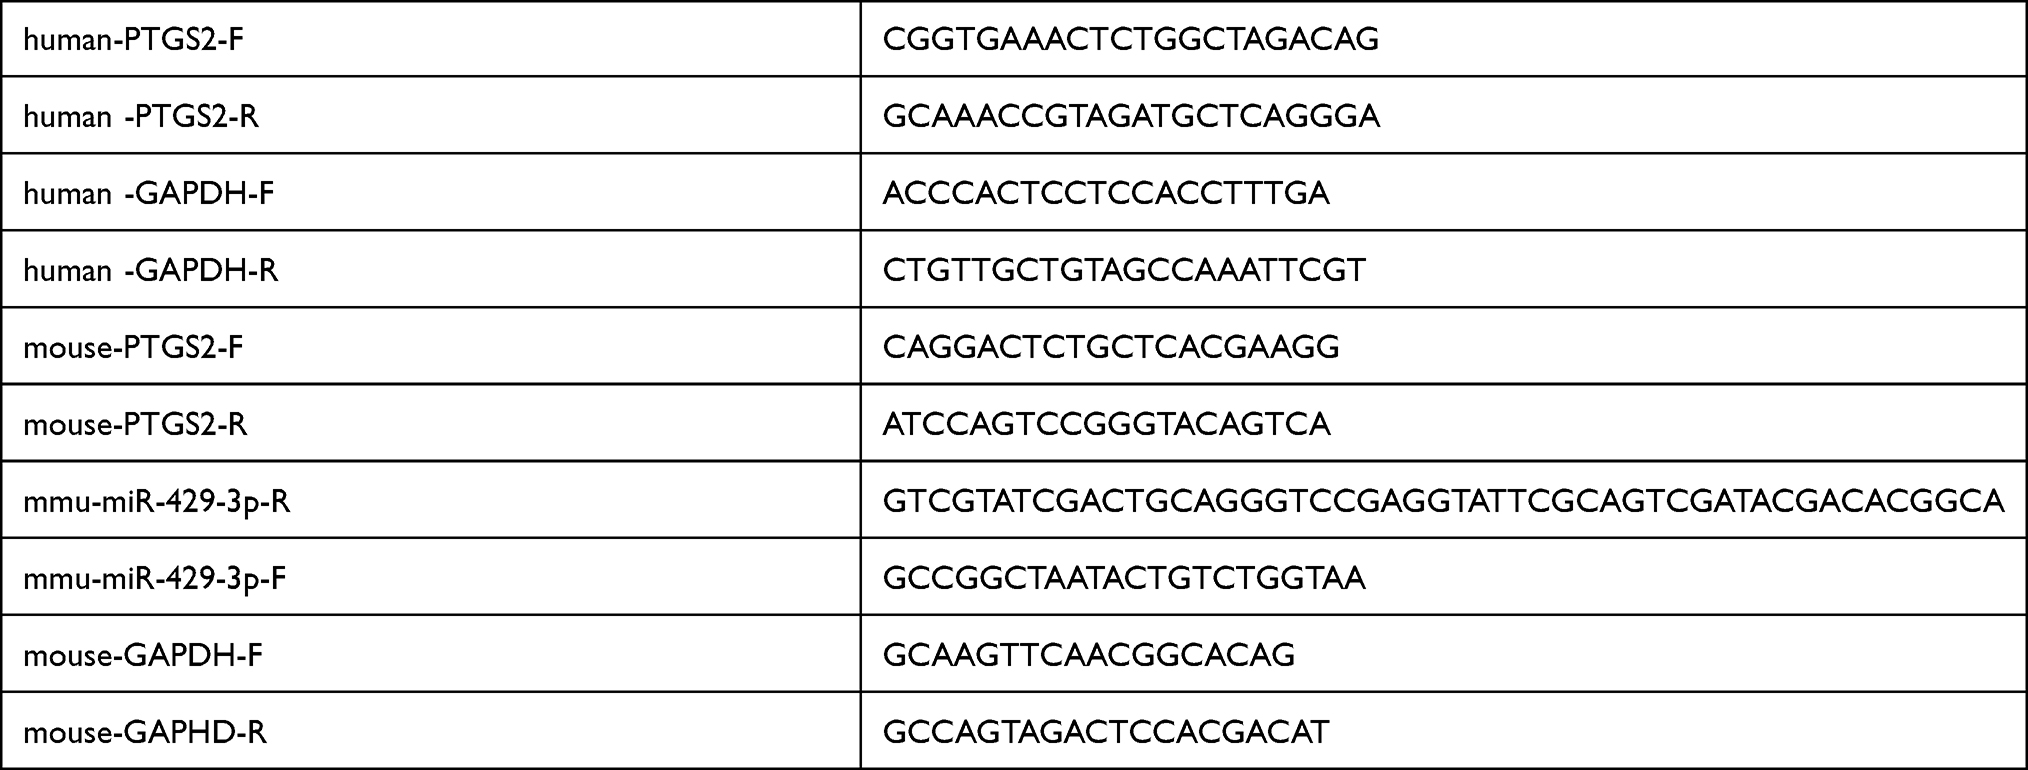 |
Table 1 The Sequences of Primers |
Results
Differential Gene Expression and Enrichment Analysis
The expression of mRNAs from the GEO dataset was explored. We found 248 significantly upregulated DEmRNAs and 162 significantly downregulated DEmRNAs from 55 CD tissues and 12 normal tissues. Figure 2A shows the distribution of all the DEmRNAs on the two dimensions of -log10 (false discovery rate, FDR) and log2 (fold change, FC) through a volcano plot. To explore the biological function of DEmRNAs, GO analysis were used, and the top 10 biological processes (BP), cellular components (CC), and molecular functions (MF) are shown in Figure 2B. These terms indicate that DEmRNAs of CD are associated with “response to bacterium”, “regulated exocytosis”, and ”leukocyte migration” in BP. The top three terms of CC were ”extracellular matrix”, ”apical part of cell”, and ”apical plasma membrane”. In categories of MF, “receptor regulator activity”, “anion transmembrane transporter activity”, and “organic anion transmembrane transporter activity” were major terms. Several inflammatory-associated BPs were observed, including “myeloid leukocyte activation”, “regulation of inflammatory response”, “response to molecule of bacterial origin”, and ”leukocyte chemotaxis”. KEGG pathway analysis suggested that DEmRNAs were mainly enriched in “cytokine–cytokine receptor interaction”, “protein digestion and absorption”, and “chemokine signaling pathway”, as shown in Figure 2C and D.
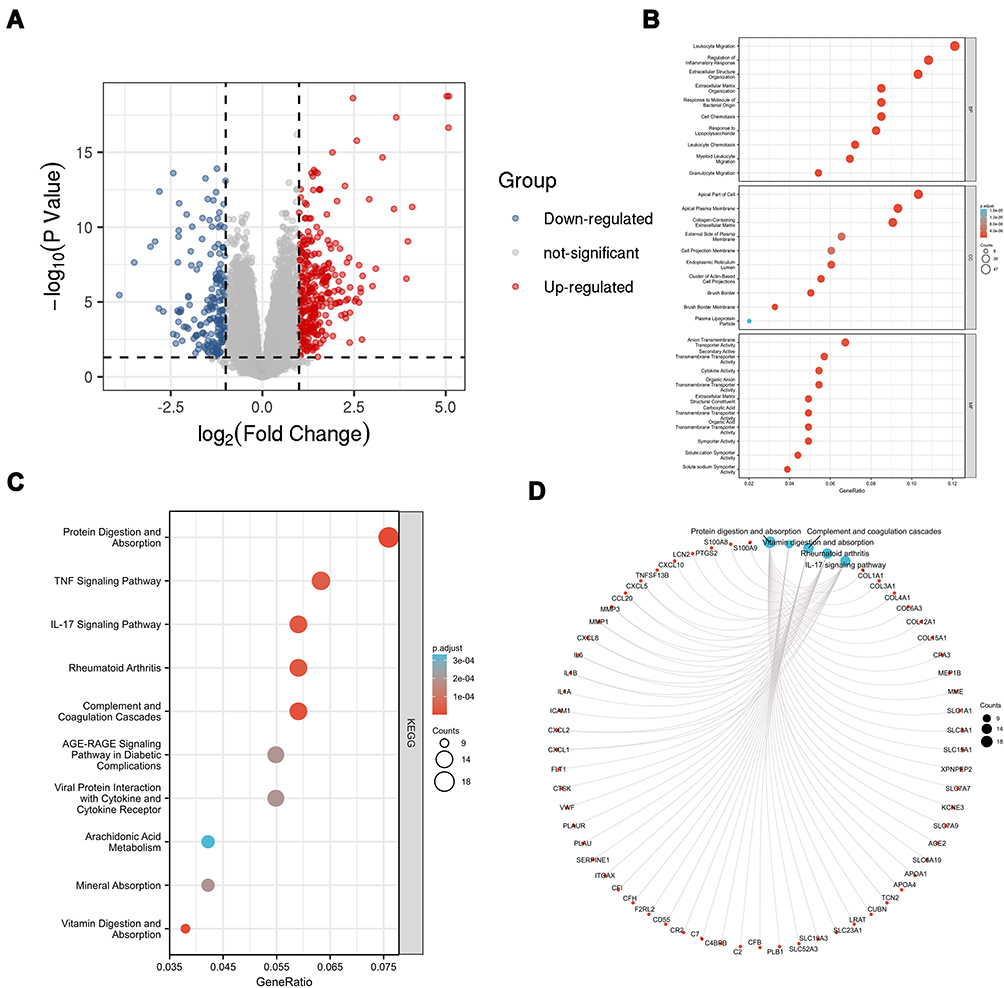 |
Figure 2 DEmRNA screening and enrichment analysis. (A) Volcano plot of DEmRNA. (B) Top 10 GO enrichment. (C) Top 10 KEGG enrichment. (D) KEGG chord plot of top 10 terms. |
WGCNA Was Applied to Analyze Gene Modules
Gene modules were analyzed by using the WGCNA among the top 2,000 mRNAs by variance comparison. As shown in Figure 3A, R2 cut at 0.8, while 8 was chosen as a soft threshold. Eight gene modules were identified, which were used to analyze module-trait (CD and normal) co-expression similarity and adjacency (Figure 3B). Yellow and turquoise modules are shown as strongly positive (module trait correlation=0.626) and negative (−0.561) correlation to CD, respectively (Figure 3C). Moreover, the miRWalk database was used to predict mRNA targeted by DEmiRNAs (Supplementary Figure S1 and Table 2). The overlap of DEmRNAs, WGCNA modules, and DEmiRNA-predict-mRNA were further analyzed (Figure 4A), and the heatmap of these 82 mRNAs are shown in Figure 4B.
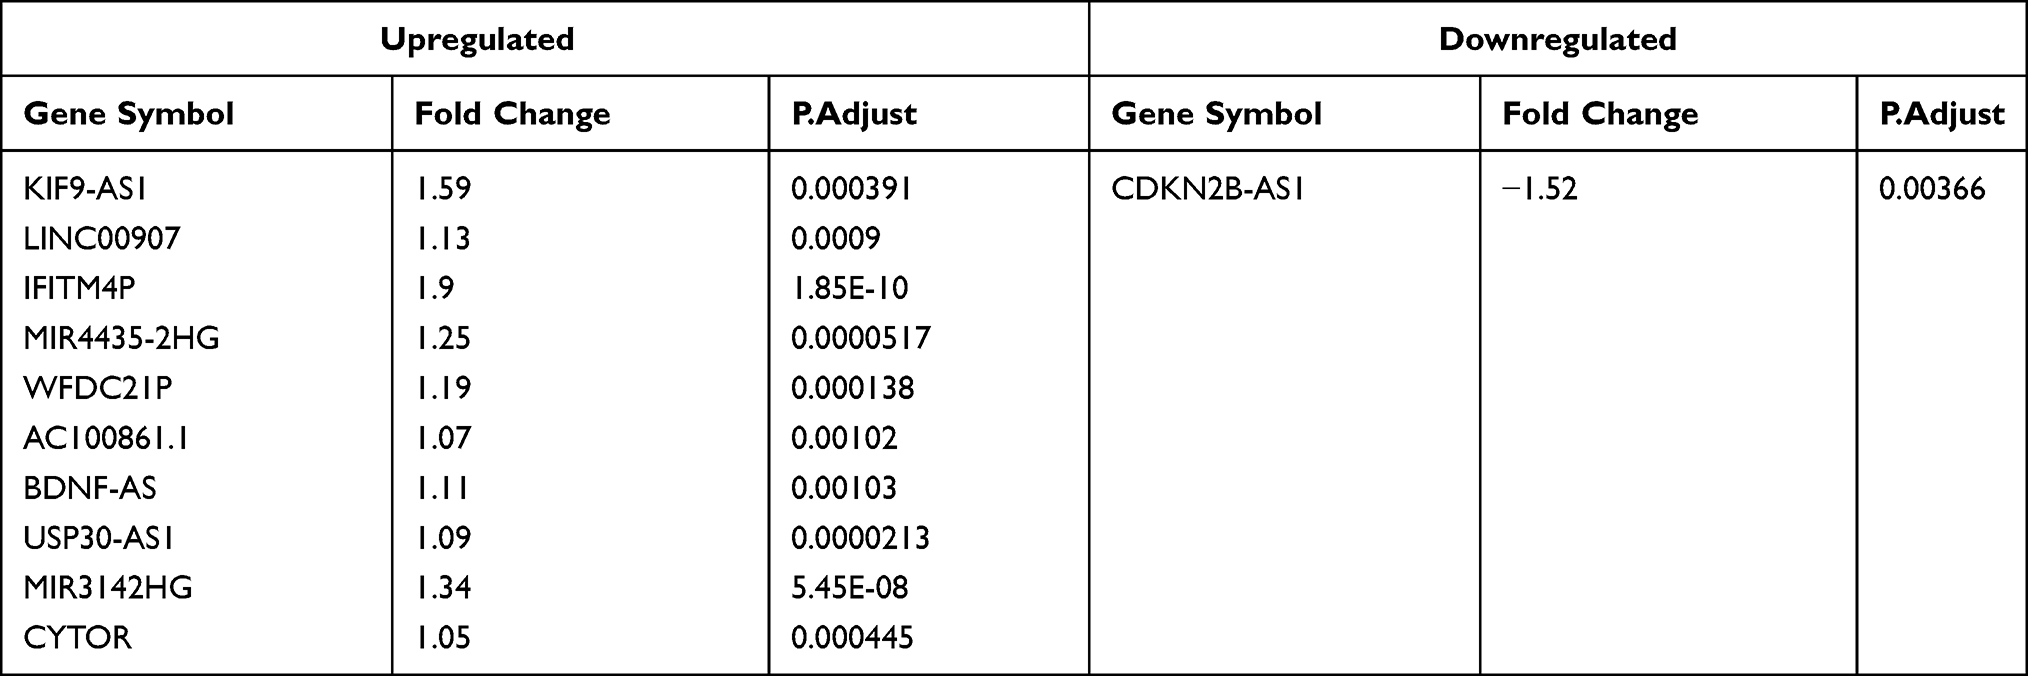 |
Table 2 The DEmiRNAs |
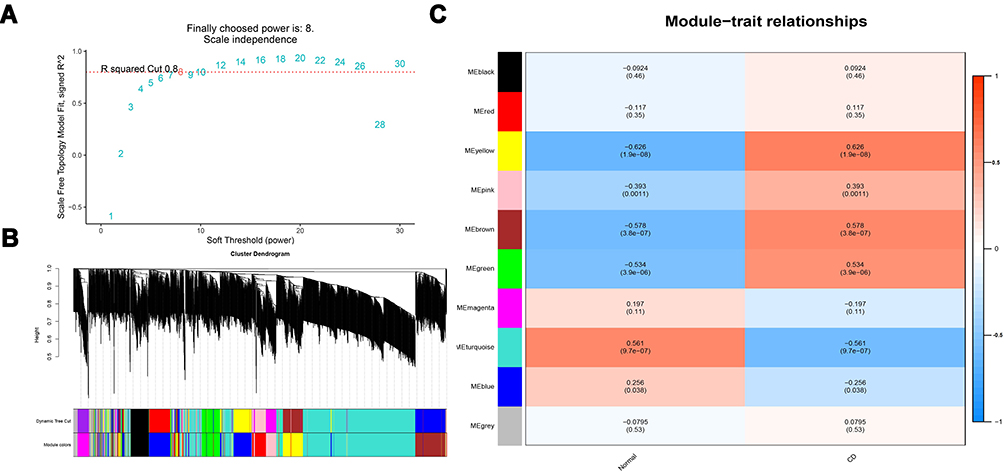 |
Figure 3 mRNA modules analyzed by WGCNA. (A) Determination of soft-thresholding power. (B) Clustering dendrogram. (C) The module-trait relationships. |
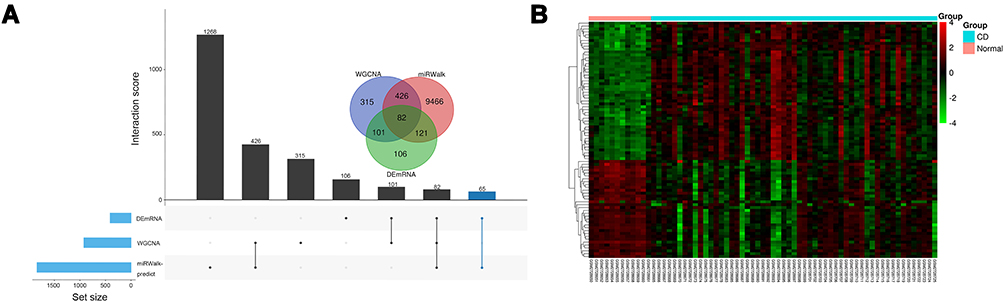 |
Figure 4 Identification of candidate overlapping mRNA. (A) Intersection of DEmRNAs, WGCNA modules, and miRwalk-predict. (B) Heatmap of overlapping mRNA. |
PPI Analysis
To explore the functions of these mRNAs, we constructed the PPI network of proteins encoded by these 82 mRNAs via STRING with high confidence (Figure 5A), line color indicated the type of interaction evidence. Total 41 mRNAs were filtered into the PPI network, which contained 41 nodes and 57 edges. Furthermore, hub genes with highest degrees of connectivity in the PPI network were identified by Cytohubba plugin of Cytoscape. As shown in Figure 5B, the top 10 hub genes were CXCL10, STAT1, IL1B, CXCL8, PTGS2, CXCL9, ICAM1, SOCS3, CXCL5, and IDO1. Then, GO and KEGG enrichment analyses were performed for these 82 mRNAs. GO enrichment is shown in Figure 5C and Supplementary Table S1, the relationships between mRNAs and GO terms is exhibited in Figure 5D. The top 10 KEGG terms are shown in Figure 5E, which indicates these genes are associated with protein digestion and absorption, the TNF signaling pathway, the NOD-like receptor signaling pathway, complement and coagulation cascades, the IL-17 signaling pathway, the NF-kappa B signaling pathway, and the Toll-like receptor signaling pathway. The relationships between mRNAs and enriched KEGG pathways are shown in Figure 5F.
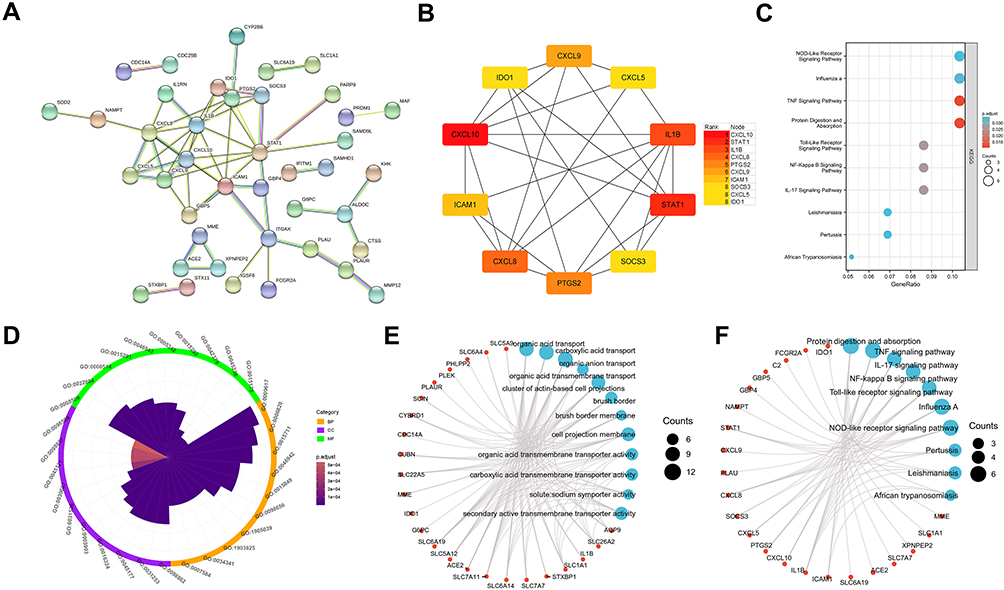 |
Figure 5 The overlapping mRNA function annotation. (A) PPI network. (B) hub gene identified via cytohubba. (C) KEGG enrichment. (D) GO enrichment. (E) GO chord plot of top 10 term. (F) KEGG chord plot of top 10 term. Lollipop chart. |
LncRNA Module Analyzed by WGCNA
Differential expression analysis of lncRNAs from the GEO dataset was performed. As shown in Figure 6A, 424 upregulated and 137 downregulated DElncRNAs were found. We analyzed the top 2,000 lncRNAs via WGCNA. R2 was set as 0.8, while the soft threshold was 9 (Figure 6B). The resulting gene dendrograms and module colors are shown in Figure 6C, in total 13 gene modules were identified. As shown in Figure 6D, the turquoise module exhibited a strongly positive correlation (module trait correlation=0.848), while the green module shows a strongly negative correlation (module trait correlation=−0.781) with CD. The overlap of DElncRNAs, WGCNA modules, and DEmiRNA-predict-lncRNA were further used to construct the ceRNA network (Figure 6E and Table 3).
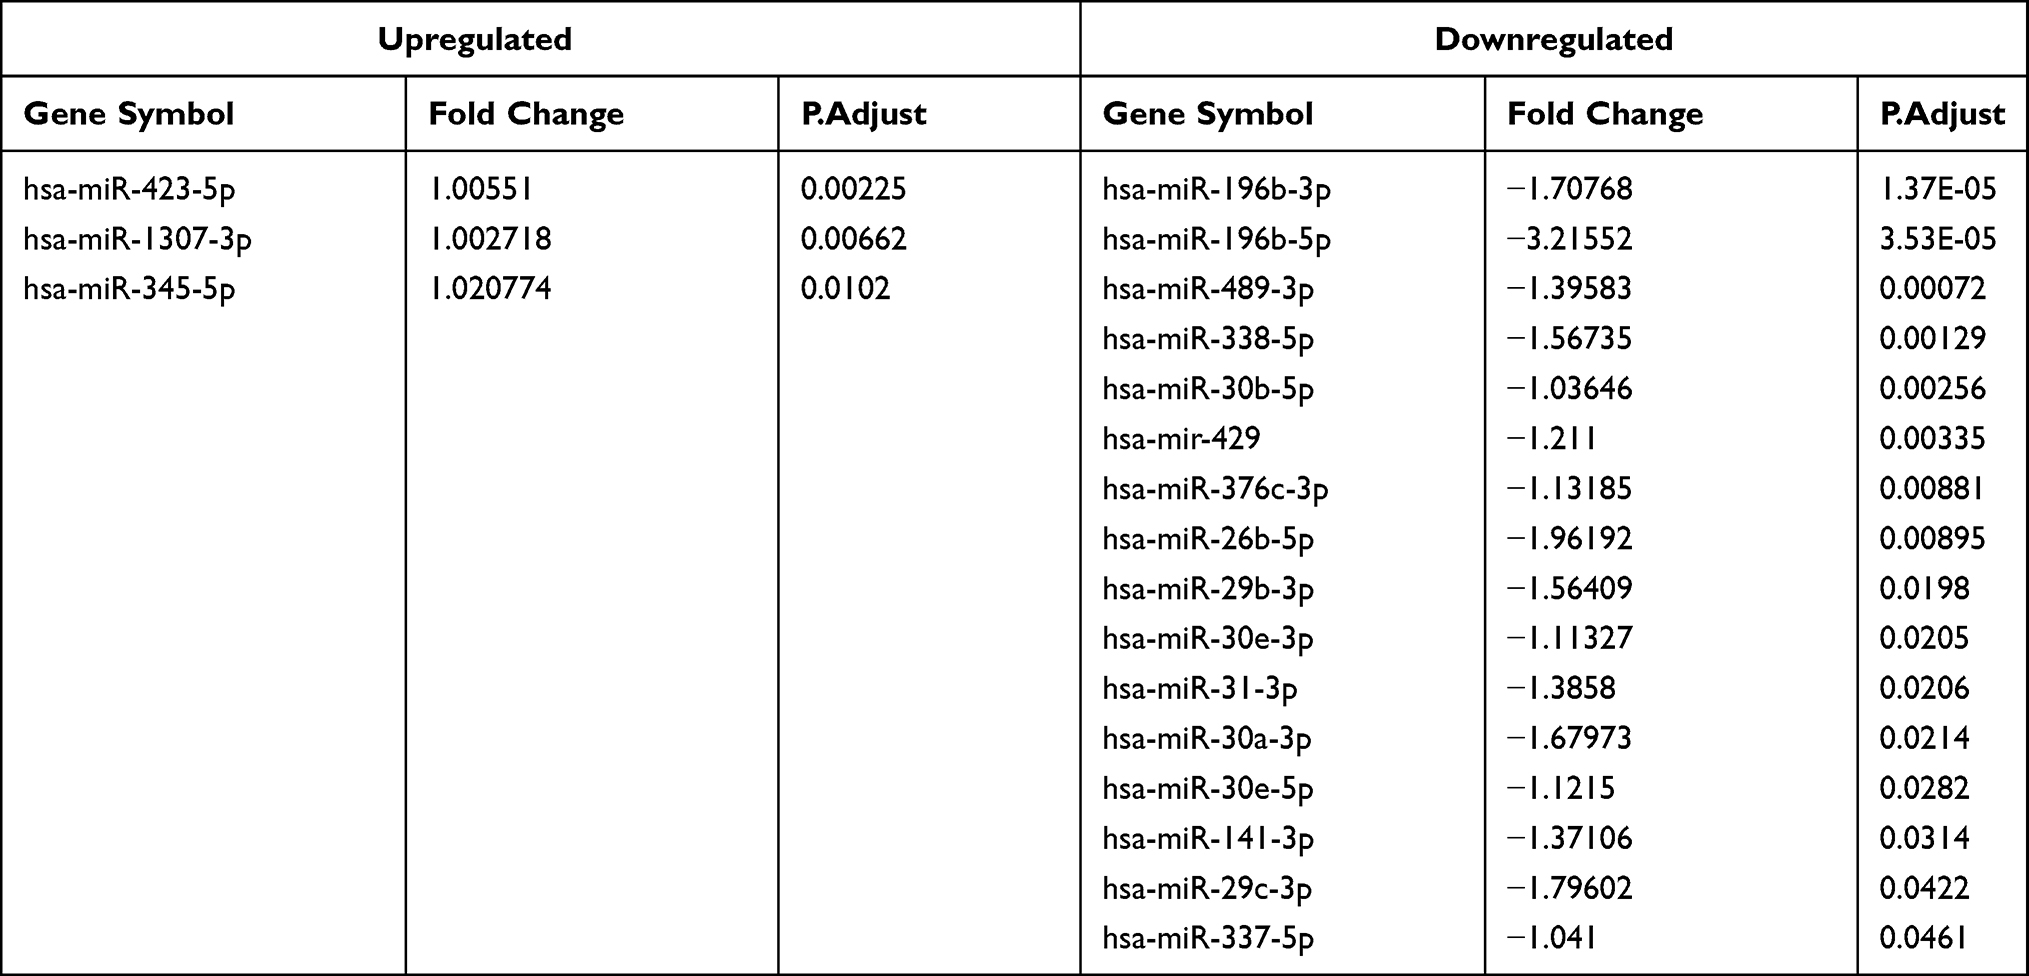 |
Table 3 The DElncRNAs |
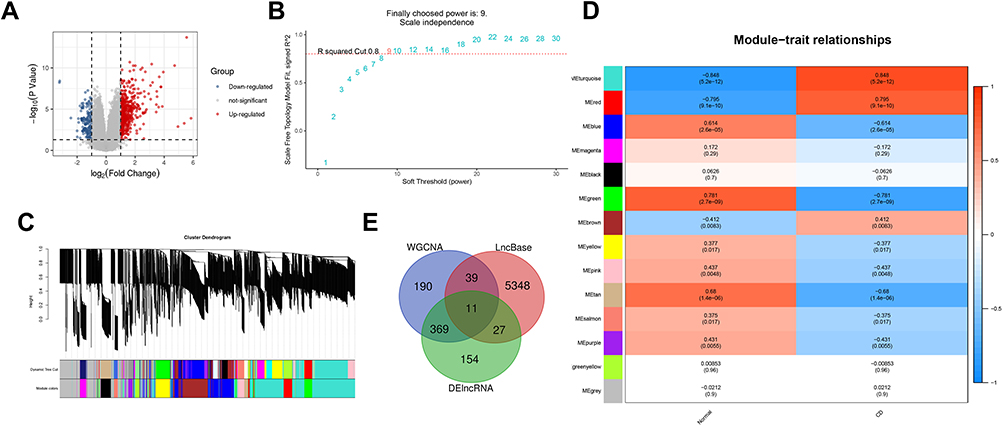 |
Figure 6 DElncRNA screening. (A) Volcano plot of DElncRNA. (B) Determination of soft-thresholding power. (C) Clustering dendrogram. (D) The module-trait relationships. (E) Intersection of DElncRNA, WGCNA, and LncBase-predict. |
CeRNA Network Constructed
According to the above analyses, miRNA-mRNA and lncRNA-miRNA relationship pairs were revealed. To explore how lncRNA regulates mRNA by binding to miRNA in CD, based on relationship pairs of miRNA-mRNA and lncRNA-miRNA obtained, the lncRNA-miRNA-mRNA ceRNA network was constructed via Cytoscape. The upregulation and downregulation of these nodes were also determined, and the ceRNA network is shown in Figure 7A. According to competition rule in the ceRNA network, the final regulation network, which included four lncRNAs, four miRNAs, and eight mRNAs, was obtained (Figure 7B).
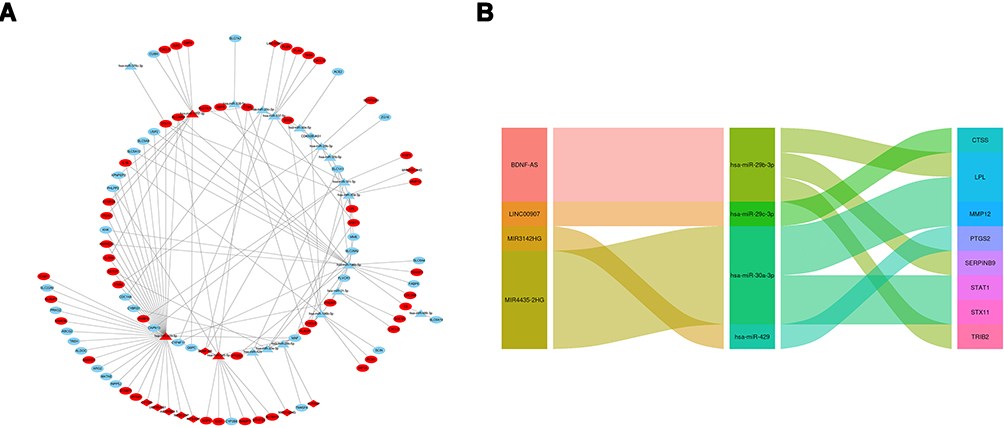 |
Figure 7 The construction of (A) ceRNA network, red color represents upregulate and blue represents downregulate, circle shape represents mRNAs, triangle represents miRNAs, and rhombus represents lncRNAs. (B) Sankey diagram of final ceRNA network. |
Receiver Operating Characteristic (ROC) Analysis and Validation
ROC curves of the gene in the final regulation network are shown in Figure 8A and B. In GSE75214 (tissues from ileum biopsies), except CTSS, AUCs of those gene were 0.75–1. AUCs of LPL, STAT1, TRIB2, and PTGS2, even beyond 0.9, which suggest those genes might have outstanding value for predicting the responsiveness in CD patients.
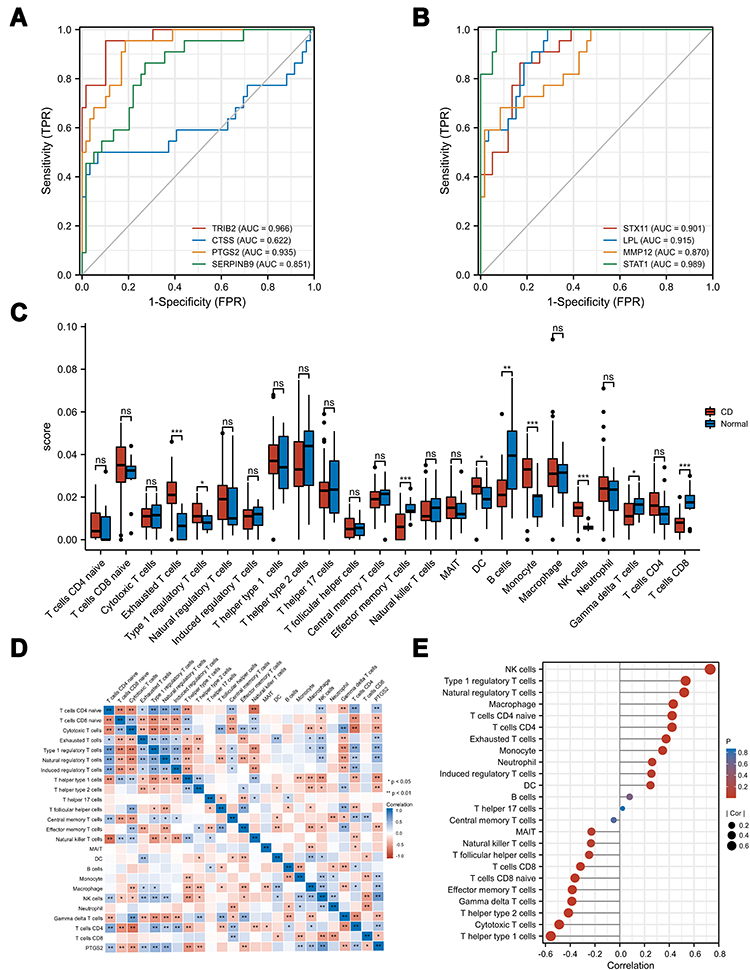 |
Figure 8 Validation and immune infiltration analysis. (A) and (B) ROC of mRNAs in the ceRNA network. (C) The differential of immune infiltration between CD and normal controls. (D) Correlation matrix of immune cell proportions and PTGS2. (E) Lollipop chart of correlation between immune cell and PTGS2. *p<0.05, **p<0.01, ***p<0.001. Abbreviation: ns, not significant. |
Immune Infiltration Analysis
The ImmuCellAI database was applied to assess the composition of immune cells in CD and normal tissues. As shown in Figure 8C, CD tissues showed a higher fraction of Exhausted T-cells, Type 1 regulatory T-cells, Monocytes, Natural Killer (NK) cells, and a lower fraction of effector memory T-cells, Gamma delta T-cells, and T-cells CD8. As shown in Figure 8D and E, in CD tissues, the expression of PTGS2 exhibited high correlation with critical immune cells in the pathogenesis of CD, like Natural regulatory T-cells, Type 1 regulatory T-cells, Th1 helper cells, and Th2 helper cells (p<0.01).
TNBS Induced Mice Model Validation
The expression of PTGS2 and mir-429 were measured by qRT-PCR in an experimental colitis mice model. Compared with the control group, PTGS2 was high expressed, while mmu-mir-429 was low expressed in the experimental colitis group (Figure 9A and B). The raw data are available in Table S3.
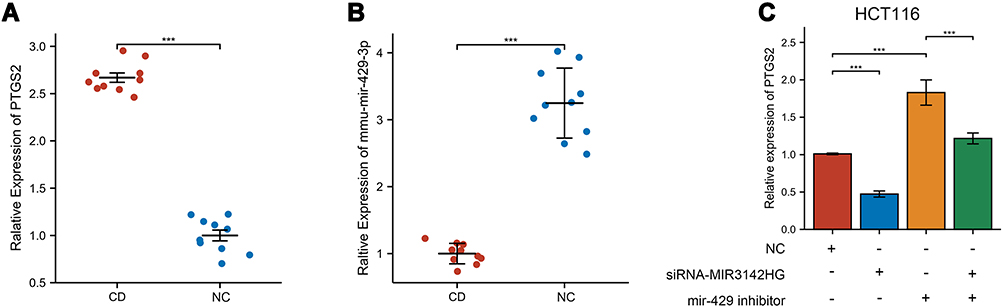 |
Figure 9 The relative expression validated via qRT-PCR. (A) The relative expression of PTGS2 in TNBS-induced mice and control mice. (B) The relative expression of mmu-mir-429 in TNBS-induced mice and control mice. (C) The relative expression of PTGS2 in HCT116 cells transfected with NC, si-MIR3142HG, and mir-429 inhibitor. ***p<0.001. |
RNAi and Transfection
To validate the MIR3142HG/mir-429/PTGS2 ceRNA network, a series of experiments were designed and conducted by using siRNA and miRNA inhibitors. Results of qRT-PCR demonstrated that knockout of MIR3142HG decreased the mRNA level of PTGS2, whereas inhibition of mir-429 increased the mRNA level of PTGS2 in HCT116. Furthermore, the co-transfection of si-MIR3142HG and mir-429 inhibitor could eliminate effects (Figure 9C).
Discussion
CD is a chronic inflammatory disease of the gastrointestinal tract, due to the increasing incidence worldwide, understanding the molecular mechanism, identifying diagnostic biomarkers as well as treatment of CD are of urgent concern.4 Recent reports have described lncRNAs which act as ceRNAs or miRNA sponges by competing for binding to shared miRNAs that are important post-transcriptional regulators of gene expression.12 CeRNAs regulatory network has been reported to be involved in development and progression of many kinds of diseases. Exploring key ceRNA networks will benefit in CD therapy. For instance, Lnc-ITSN1-2 serve as ceRNA for IL-23R via sponging mir-125a in IBD.19 In addition, circRNA_103765 functions as a ceRNA to promote DLL4-mediated cell apoptosis by decoying the miR-30 family in CD.31 Therefore, the construction of the ceRNA to understand regulation mechanisms and explore potential biomarkers is essential.
In this study, we identified DEmRNAs, DEmiRNAs, and DElncRNAs between CD and normal ileum tissues from GSE102134 and GSE67106, respectively. Then, WGCNA was performed to select enrich modules related to CD. Furthermore, DEmiRNAs were used to predict interacted mRNAs and lncRNAs in the miRwalk and LncBase database. The intersection of DEmRNAs, mRNAs in WGCNA module and predicted mRNAs defined as intersection-mRNAs, intersection-lncRNAs were obtained similarly like intersection-mRNAs. Finally, intersection-mRNAs, intersection-lncRNAs, and DEmiRNA were used to construct the ceRNA regulatory network. According to competition rule in the ceRNA network, a final regulation network, which included four lncRNAs, four miRNAs, and eight mRNAs was obtained. To access the possibility of eight mRNAs in ceRNA act as CD biomarkers, validation was carried out by ROC analysis in GSE75214 from ileum tissues. The AUCs of LPL, STAT1, TRIB2, and PTGS2, even beyond 0.9, suggested those genes would be promising biomarkers in CD.
PTGS2 encodes an enzyme, which converts arachidonic acid to prostaglandin endoperoxide H2 in humans. It is one of the key factors in the cellular response to the inflammation and epithelial regeneration.32 PTGS2 is involved in the production of prostaglandin associated with the mediation of inflammation and exacerbate inflammation.33,34 It has been reported to be significantly upregulated in inflamed mucosa of CD patients, and resulted in activation of the prostaglandin D2 (PGD2) metabolic pathway. PGD2 is a major inflammatory mediator, which participated in inflammation response in CD.35 The results of immune infiltration analysis indicated that PTGS2 might be involved in immunomodulatory CD, due to the high correlation with critical immune cells. Moreover, intestinal immune cell trafficking has been identified as a central event in the pathogenesis of CD.36 The expression of PTGS2 shows a positive correlation with regulator T-cells and T-cells in CD4, which were reported to be associated with a more complicated disease course with strictures or penetration, and a trend was observed towards more abdominal surgeries.37 The increase in the number of macrophages and monocytes secretes more pro-inflammatory factors, maintains or promotes the pathological environment, and forms a vicious circle of inflammation in CD patents, which is positively correlated with the expression of PTGS2. Consistent with a previous study, the fraction of T-cells CD8 was decreased in CD patients, which is a negative correlation with PTGS2.38 These results indicated that PTGS2 can be the immune-related biomarker candidate of CD.
The expression of PTGS2 was regulated via the MIR3142HG/mir-429/PTGS2 ceRNA network constructed in this work. LncRNA MIR3142HG functions as a posttranscriptional modulator via interacting with mir-429, which was reported to regulate inflammation response.39 A recent study showed that downregulated mir-429 induces myristoylated alanine-rich protein kinase C substrate upregulated, and may act as a protection mechanism to repair active inflammation and inhibit the cellular breakdown of the epithelial barrier in a mice model.40 PTGS2 (AUC 0.927) plays a key role in the cellular response to inflammation, which is typically induced by inflammation and potentially impairs the reestablishment of a functional epithelial barrier in IBD.32
TNBS induced colitis offers an alternative method to study the pathobiology of CD, since it resembles human CD. Therefore, we established a TNBS induced colitis model and validated the expression of mir-429 and PTGS2 in the mice model. The expression of PTGS2 was significantly upregulated while mir-429 was downregulated in the TNBS mice model, which were consistent with the previous bioinformatics analysis. Furthermore, to validate the MIR3142HG/mir-429/PTGS2 ceRNA network predicted in this study, we conducted RNAi. As previously analyzed, knockout of MIR3142HG decreased the mRNA level of PTGS2, whereas inhibition of mir-429 increased the mRNA level of PTGS2 in HCT116, while the co-transfection of si-MIR3142HG and mir-429 inhibitor could rescue the mRNA level of PTGS2. It demonstrated that the MIR3142HG/mir-429/PTGS2 ceRNA network may play a role in development of CD.
Conclusion
In summary, we identified a ceRNA network in CD, which included four lncRNAs, four miRNAs, and eight mRNAs. It will be of benefit in understanding the regulatory mechanism in CD. Furthermore, four mRNAs in this ceRNA network showed promising diagnostic accuracy (AUC >0.9), used to investigate the effect in regulation of immune cells. PTGS2 exhibited a high correlated with immune cells, which were related to the development of CD. These results reveal PTGS2 may be a potential diagnostic biomarker and the MIR3142HG/mir-429/PTGS2 ceRNA network was involved in the pathogenesis of CD. However, this study still has some limitations, and, owing to the lack of lncRNA and miRNA datasets of CD, the lncRNAs and miRNAs identified in the ceRNA network cannot be validated. We cannot measure the expression of MIR3142HG in the TNBS induced mice model, due to the lack of sequence of lncRNA MIR3142HG of mice in the NCBI database. Despite these drawbacks, our results still benefit in further understanding the pathogenesis and explore the immune-related diagnostic biomarker of CD.
Data Sharing Statement
The data used to support the findings of this study and qRT-PCR raw data are available in the Supplementary Materials and from the corresponding author (Sizhe Zhu, [email protected]) upon request.
Ethics Approval
The studies involving human participants and animals were reviewed and approved by the Medical Ethical Committee of Tongji Hospital, Tongji Medical College, Huazhong University of Science and Technology.
Funding
This work was supported by the Fundamental Research Funds for the Central Universities (No. 2042020kf0078), Tongji Hospital Scientific Research Fund (No. 2201831058).
Disclosure
The authors report no conflicts of interest in this work.
References
1. Ramos GP, Papadakis KA. Mechanisms of disease: inflammatory bowel diseases. Mayo Clin Proc. 2019;94(1):155–165. doi:10.1016/j.mayocp.2018.09.013
2. Feuerstein JD, Cheifetz AS. Crohn disease: epidemiology, diagnosis, and management. Mayo Clin Proc. 2017;92(7):1088–1103. doi:10.1016/j.mayocp.2017.04.010
3. Roda G, Chien NS, Kotze PG, et al. Crohn’s disease. Nat Rev Dis Primers. 2020;6(1):22. doi:10.1038/s41572-020-0156-2
4. Torres J, Mehandru S, Colombel JF, Peyrin-Biroulet L. Crohn’s disease. Lancet. 2017;389(10080):1741–1755. doi:10.1016/S0140-6736(16)31711-1
5. Roda G, Jharap B, Neeraj N, Colombel JF. Loss of Response to Anti-TNFs: definition, Epidemiology, and Management. Clin Transl Gastroenterol. 2016;7:e135. doi:10.1038/ctg.2015.63
6. Axelrad JE, Lichtiger S, Yajnik V. Inflammatory bowel disease and cancer: the role of inflammation, immunosuppression, and cancer treatment. World J Gastroenterol. 2016;22(20):4794–4801. doi:10.3748/wjg.v22.i20.4794
7. Ng SC, Shi HY, Hamidi N, et al. Worldwide incidence and prevalence of inflammatory bowel disease in the 21st century: a systematic review of population-based studies. Lancet. 2017;390(10114):2769–2778. doi:10.1016/S0140-6736(17)32448-0
8. Rogler G, Singh A, Kavanaugh A, Rubin DT. Extraintestinal Manifestations of Inflammatory Bowel Disease: current Concepts, Treatment, and Implications for Disease Management. Gastroenterology. 2021;161(4):1118–1132. doi:10.1053/j.gastro.2021.07.042
9. Cushing K, Higgins PDR. Management of Crohn Disease: a Review. JAMA. 2021;325(1):69–80. doi:10.1001/jama.2020.18936
10. Li Y, Chen B, Gao X, et al. Current diagnosis and management of Crohn’s disease in China: results from a multicenter prospective disease registry. BMC Gastroenterol. 2019;19(1):145. doi:10.1186/s12876-019-1057-2
11. Gomollon F, Dignass A, Annese V, et al. 3rd European Evidence-based Consensus on the Diagnosis and Management of Crohn’s Disease 2016: part 1: diagnosis and Medical Management. J Crohns Colitis. 2017;11(1):3–25. doi:10.1093/ecco-jcc/jjw168
12. Tay Y, Rinn J, Pandolfi PP. The multilayered complexity of ceRNA crosstalk and competition. Nature. 2014;505(7483):344–352. doi:10.1038/nature12986
13. Chan JJ, Tay Y. Noncoding RNA:RNA Regulatory Networks in Cancer. Int J Mol Sci. 2018;19:5. doi:10.3390/ijms19051310
14. Du Z, Sun T, Hacisuleyman E, et al. Integrative analyses reveal a long noncoding RNA-mediated sponge regulatory network in prostate cancer. Nat Commun. 2016;7:10982. doi:10.1038/ncomms10982
15. Zhang X, Zhou Y, Chen S, Li W, Chen W, Gu W. LncRNA MACC1-AS1 sponges multiple miRNAs and RNA-binding protein PTBP1. Oncogenesis. 2019;8(12):73. doi:10.1038/s41389-019-0182-7
16. Cheng W, Li XW, Xiao YQ, Duan SB. Non-coding RNA-Associated ceRNA Networks in a New Contrast-Induced Acute Kidney Injury Rat Model. Mol Ther Nucleic Acids. 2019;17:102–112. doi:10.1016/j.omtn.2019.05.011
17. Zhang S, Zhu D, Li H, Li H, Feng C, Zhang W. Characterization of circRNA-Associated-ceRNA Networks in a Senescence-Accelerated Mouse Prone 8 Brain. Mol Ther. 2017;25(9):2053–2061. doi:10.1016/j.ymthe.2017.06.009
18. Liang H, Su X, Wu Q, et al. LncRNA 2810403D21Rik/Mirf promotes ischemic myocardial injury by regulating autophagy through targeting Mir26a. Autophagy. 2020;16(6):1077–1091. doi:10.1080/15548627.2019.1659610
19. Nie J, Zhao Q. Lnc-ITSN1-2, Derived From RNA Sequencing, Correlates With Increased Disease Risk, Activity and Promotes CD4(+) T Cell Activation, Proliferation and Th1/Th17 Cell Differentiation by Serving as a ceRNA for IL-23R via Sponging miR-125a in Inflammatory Bowel Disease. Front Immunol. 2020;11:852. doi:10.3389/fimmu.2020.00852
20. Liu H, Li T, Zhong S, Yu M, Huang W. Intestinal epithelial cells related lncRNA and mRNA expression profiles in dextran sulphate sodium-induced colitis. J Cell Mol Med. 2021;25(2):1060–1073. doi:10.1111/jcmm.16174
21. Mirza AH, Berthelsen CH, Seemann SE, et al. Transcriptomic landscape of lncRNAs in inflammatory bowel disease. Genome Med. 2015;7(1):39. doi:10.1186/s13073-015-0162-2
22. Verstockt S, De Hertogh G, Van der Goten J, et al. Gene and Mirna Regulatory Networks During Different Stages of Crohn’s Disease. J Crohns Colitis. 2019;13(7):916–930. doi:10.1093/ecco-jcc/jjz007
23. Vancamelbeke M, Vanuytsel T, Farre R, et al. Genetic and Transcriptomic Bases of Intestinal Epithelial Barrier Dysfunction in Inflammatory Bowel Disease. Inflamm Bowel Dis. 2017;23(10):1718–1729. doi:10.1097/MIB.0000000000001246
24. Langfelder P, Horvath S. WGCNA: an R package for weighted correlation network analysis. BMC Bioinform. 2008;9:559. doi:10.1186/1471-2105-9-559
25. Zhou Y, Zhou B, Pache L, et al. Metascape provides a biologist-oriented resource for the analysis of systems-level datasets. Nat Commun. 2019;10(1):1523. doi:10.1038/s41467-019-09234-6
26. Szklarczyk D, Gable AL, Nastou KC, et al. The STRING database in 2021: customizable protein-protein networks, and functional characterization of user-uploaded gene/measurement sets. Nucleic Acids Res. 2021;49(D1):D605–D612. doi:10.1093/nar/gkaa1074
27. Sticht C, De La Torre C, Parveen A, Gretz N. miRWalk: an online resource for prediction of microRNA binding sites. PLoS One. 2018;13(10):e0206239. doi:10.1371/journal.pone.0206239
28. Karagkouni D, Paraskevopoulou MD, Tastsoglou S, et al. DIANA-LncBase v3: indexing experimentally supported miRNA targets on non-coding transcripts. Nucleic Acids Res. 2020;48(D1):D101–D110. doi:10.1093/nar/gkz1036
29. Miao YR, Zhang Q, Lei Q, et al. ImmuCellAI: a Unique Method for Comprehensive T-Cell Subsets Abundance Prediction and its Application in Cancer Immunotherapy. Adv Sci. 2020;7(7):1902880. doi:10.1002/advs.201902880
30. Antoniou E, Margonis GA, Angelou A, et al. The TNBS-induced colitis animal model: an overview. Ann Med Surg. 2016;11:9–15. doi:10.1016/j.amsu.2016.07.019
31. Ye Y, Zhang L, Hu T, et al. CircRNA_103765 acts as a proinflammatory factor via sponging miR-30 family in Crohn’s disease. Sci Rep. 2021;11(1):565. doi:10.1038/s41598-020-80663-w
32. Li Y, Soendergaard C, Bergenheim FH, et al. COX-2-PGE2 Signaling Impairs Intestinal Epithelial Regeneration and Associates with TNF Inhibitor Responsiveness in Ulcerative Colitis. EBioMedicine. 2018;36:497–507. doi:10.1016/j.ebiom.2018.08.040
33. Singer II, Kawka DW, Schloemann S, Tessner T, Riehl T, Stenson WF. Cyclooxygenase 2 is induced in colonic epithelial cells in inflammatory bowel disease. Gastroenterology. 1998;115(2):297–306. doi:10.1016/s0016-5085(98)70196-9
34. O’Connor PM, Lapointe TK, Beck PL, Buret AG. Mechanisms by which inflammation may increase intestinal cancer risk in inflammatory bowel disease. Inflamm Bowel Dis. 2010;16(8):1411–1420. doi:10.1002/ibd.21217
35. Le Loupp AG, Bach-Ngohou K, Bourreille A, et al. Activation of the prostaglandin D2 metabolic pathway in Crohn’s disease: involvement of the enteric nervous system. BMC Gastroenterol. 2015;15:112. doi:10.1186/s12876-015-0338-7
36. Zundler S, Becker E, Schulze LL, Neurath MF. Immune cell trafficking and retention in inflammatory bowel disease: mechanistic insights and therapeutic advances. Gut. 2019;68(9):1688–1700. doi:10.1136/gutjnl-2018-317977
37. Smids C, Horjus Talabur Horje CS, Drylewicz J, et al. Intestinal T Cell Profiling in Inflammatory Bowel Disease: linking T Cell Subsets to Disease Activity and Disease Course. J Crohns Colitis. 2018;12(4):465–475. doi:10.1093/ecco-jcc/jjx160
38. Noble A, Durant L, Hoyles L, et al. Deficient Resident Memory T Cell and CD8 T Cell Response to Commensals in Inflammatory Bowel Disease. J Crohns Colitis. 2020;14(4):525–537. doi:10.1093/ecco-jcc/jjz175
39. Hadjicharalambous MR, Roux BT, Feghali-Bostwick CA, Murray LA, Clarke DL, Lindsay MA. Long Non-coding RNAs Are Central Regulators of the IL-1beta-Induced Inflammatory Response in Normal and Idiopathic Pulmonary Lung Fibroblasts. Front Immunol. 2018;9:2906. doi:10.3389/fimmu.2018.02906
40. Mo JS, Alam KJ, Kim HS, Lee YM, Yun KJ, Chae SC. MicroRNA 429 Regulates Mucin Gene Expression and Secretion in Murine Model of Colitis. J Crohns Colitis. 2016;10(7):837–849. doi:10.1093/ecco-jcc/jjw033
 © 2021 The Author(s). This work is published and licensed by Dove Medical Press Limited. The full terms of this license are available at https://www.dovepress.com/terms.php and incorporate the Creative Commons Attribution - Non Commercial (unported, v3.0) License.
By accessing the work you hereby accept the Terms. Non-commercial uses of the work are permitted without any further permission from Dove Medical Press Limited, provided the work is properly attributed. For permission for commercial use of this work, please see paragraphs 4.2 and 5 of our Terms.
© 2021 The Author(s). This work is published and licensed by Dove Medical Press Limited. The full terms of this license are available at https://www.dovepress.com/terms.php and incorporate the Creative Commons Attribution - Non Commercial (unported, v3.0) License.
By accessing the work you hereby accept the Terms. Non-commercial uses of the work are permitted without any further permission from Dove Medical Press Limited, provided the work is properly attributed. For permission for commercial use of this work, please see paragraphs 4.2 and 5 of our Terms.