")
Back to Journals » International Journal of General Medicine » Volume 15
Construction of a Risk Model to Predict the Prognosis and Immunotherapy of Low-Grade Glioma Ground on 7 Ferroptosis-Related Genes
Authors Sun L, Li B, Wang B, Li J, Li J
Received 5 January 2022
Accepted for publication 16 March 2022
Published 5 May 2022 Volume 2022:15 Pages 4697—4716
DOI https://doi.org/10.2147/IJGM.S352773
Checked for plagiarism Yes
Review by Single anonymous peer review
Peer reviewer comments 2
Editor who approved publication: Dr Scott Fraser
Liwei Sun,1,* Bing Li,2,* Bin Wang,3 Jinduo Li,3 Jing Li3
1Department of Intervention, Tianjin Huanhu Hospital, Tianjin Key Laboratory of Cerebral Vascular and Neurodegenerative Disease, Tianjin Neurosurgical Institute, Tianjin, People’s Republic of China; 2Department of Neurosurgery, Tianjin Huanhu Hospital, Tianjin Key Laboratory of Cerebral Vascular and Neurodegenerative Diseases, Tianjin Neurosurgical Institute, Tianjin, People’s Republic of China; 3Department of Intervention, Tianjin Huanhu Hospital, Tianjin, People’s Republic of China
*These authors contributed equally to this work
Correspondence: Bing Li, Department of Neurosurgery, Tianjin Huanhu Hospital, Tianjin Key Laboratory of Cerebral Vascular and Neurodegenerative Diseases, Tianjin Neurosurgical Institute, Tianjin, People’s Republic of China, Tel +86-13299998993, Email [email protected] Liwei Sun, Department of Intervention, Tianjin Huanhu Hospital, Tianjin Key Laboratory of Cerebral Vascular and Neurodegenerative Disease, Tianjin Neurosurgical Institute, Tianjin, People’s Republic of China, Tel +86-13502135838, Email [email protected]
Purpose: Ferroptosis is closely associated with tumors. The purpose of this study was to investigate the correlation between ferroptosis and prognosis of low grade glioma (LGG) via construction and verification of a risk model.
Patients and Methods: The data of LGG were downloaded from public databases. Through LASSO analysis of characteristic genes, a gene signature was constructed. Patients into were divided two groups based on risk score. Subsequently, survival, clinical phenotype, functional enrichment, immune cell infiltration and somatic mutation analysis were performed. In addition, whether ferroptosis-related genes (FRGs) signature can predict the patient’s response to anti-PD-1/PD-L1 immunotherapy was also investigated.
Results: FRGs signature had strong prognostic assessment ability, and high risk score was associated with poor overall survival (OS) of LGG. The high risk score group had higher degree of immune cell infiltration, stronger stromal activity, higher immune score, and high expression of immune checkpoint. In low risk score group anti-PD-1/PD-L1 immunotherapy has significant therapeutic advantages and clinical response. Genes and frequency of somatic mutations and clinical phenotypes in the high and low risk score groups were significantly different.
Conclusion: A prognostic model based on 7 FRGs can be used to predict the prognosis and immunotherapeutic response of LGG.
Keywords: low grade glioma, ferroptosis, ferroptosis-related genes, risk score, overall survival
Introduction
Glioma are common primary malignant brain tumors originating from glial cells.1 It leads to significant mortality and morbidity.2 The main clinical symptoms of glioma are intracranial hypertension, focal neurologic deficits, and epilepsy. These symptoms have a great negative impact on the life of the patient.3 According to the standards of World Health Organization (WHO), glioma is classified as grade 1 (pilocytic astrocytomas, pleomorphic xanthoastrocytomas, and subependymal giant cell astrocytomas), 2 (oligodendrogliomas and astrocytomas), 3 (anaplastic oligodendrogliomas, anaplastic astrocytomas, anaplastic oligoastrocytomas, anaplastic ependymomas) and 4 (glioblastomas).4 The previously often used term of “low-grade glioma”, which referred to grade 2 gliomas, has now been replaced by the phrase “lower-grade glioma” to encompass both grade 2 and 3 tumors, consistent with the Cancer Genome Atlas Project categorization.5–7 Compared with high-grade glioma, LGG generally have an indolent course with longer-term survival. Molecular and genetic characteristics of tumor cells, immunohistochemical markers of tumor cell proliferation, and patient characteristics can all be used to predict patient prognosis.8 Standard treatment for LGG includes observation, surgery, chemotherapy, and/or radiation.9 However, some patients still experience recurrence and malignant transformation into high-grade glioma.10 Previous studies have established prognostic models based on the characteristics of coke death related genes, laying a theoretical foundation for exploring the prognosis and immunotherapy of LGG.11 In LGG, genetic mutations are associated with survival and have important prognostic value.12 Therefore, effective assessment of prognostic heterogeneity of LGG plays an important role in preventing the progression of disease.
Ferroptosis is a kind of iron-dependent programmed cell death.13 Ferroptosis involves multiple pathways, for example mevalonic acid, iron, sugar and lipid metabolism.14,15 Ferroptosis is closely related to cancer, blood diseases, immune system diseases, heart disease, brain and neurodegenerative diseases.16 In order to promote growth, cancer cells need more iron than normal non-cancerous cells. As a result, the death of cancer cells is more susceptible to iron catalysis.17 Due to cancer cells are sensitive to ferroptosis, the development of therapeutic methods for tumor ferroptosis has received increasing attention.18 Ferroptosis is associated to tumor necrosis and low survival rate in patients with glioblastoma.19 In glioma samples, the expression level of ferroptosis-related genes (FRGs) is different from that in normal samples, and plays an important role in glioma disease progression.20 Ferroptosis may also be associated with overall survival (OS) in glioma.21 Recent studies have found that targeted treatment of ferroptosis may be a way to treat glioma and provide new insights for future research.22 However, the specific regulatory mechanism of ferroptosis in LGG is still unclear. In order to understand the pathogenesis of ferroptosis in LGG and provide ideas for the development of new anti-glioma drugs, further in-depth research is needed. Therefore, it is important to analyze the expression pattern, prognostic value and clinical significance of FRGs signature in LGG.
In our study, the RNA sequencing (RNA-seq) dataset and the corresponding clinical of LGG were downloaded from public database. Then, the prognosis model of FRGs signature was constructed. LGG patients were divided into high and low risk score groups according to the risk score. Subsequently, characteristics of FRGs in LGG were systematically analyzed. The correlation between FRGs death and the prognosis of LGG was explored. Finally, we found that FRGs signature showed strong prognostic assessment ability in LGG. In addition, ferroptosis also played an important role in the tumor immune microenvironment (TIME).
Materials and Methods
Data Source and Preprocessing
The RNA sequencing dataset (mRNAseq_693 and 325) and the corresponding clinical (sex, age, grade, subtype, survival information) and molecular information of LGG were downloaded from the CGGA database (http://www.cgga.org.cn/). Comparably, the TCGA RNA-seq dataset and corresponding information were downloaded from the UCSC Xena browser (https://gdc.xenahubs.net). Samples with incomplete clinical information and follow-up of less than 30 days were removed. The CGGA and TCGA databases obtained 590 and 495 samples, respectively. Raw data from CGGA or TCGA were displayed as fragments per kilobase of exon model per million mapped fragments (FPKM). Then, the FPKM value was converted into a transcript per kilobase million (TPM) values. The “ComBat” algorithm of the sva software package was used to correct the batch effect caused by non-biological technology deviations in mRNAseq_693 and mRNAseq_325. The CGGA cohort was used as training set, and the TCGA cohort was used as verification set. In addition, we also used the CGGA.mRNA_array_301 dataset for (159 patients with LGG) further verification.
Generation of FRGs
FerrDb database (http://www.zhounan.org/ferrdb/index.html) is the world’s first database of ferroptosis. Detailed inclusion criteria for FRGs were as follows: (1) Inhibitors or activators of genes can regulate ferroptosis; (2) Down/up-regulation of genes can regulate ferroptosis, excluding non-coding RNA and ferroptosis markers; (3) To ensure accuracy and stability of the model, only proven genes relevant to humans were included.
Genes Signature Identification and Risk Score Construction
Univariate Cox regression analysis was used to determine FRGs related to prognosis in the CGGA cohort (P<0.01). We used the “glmnet” software package in R to construct a gene signature that predicted the prognosis of LGG patients through Cox regression analysis and Lasso methods. In this analysis, the lasso penalty was applied, with both shrinkage and variable selection taken into account. Through 10 cross-validation, the optimal value of the lambda penalty parameter was determined. Then, we used the formula 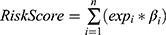 to calculate the risk score of LGG patients (n, number of prognostic genes; expi: expression value of gene i, βi: regression coefficient of gene i). According to the risk score median, patients were divided into high risk score group and low risk score group.
Survival Analysis
“Survival” and “Survminer” software packages in R were used to analyze and compare the OS of the high and low risk score groups by Kaplan-Meier. Univariate and multivariate Cox analysis were used to determine the correlation between the risk score and OS. The “timeROC” software package in R was used to generate the receiver operator characteristic (ROC) curve. The ROC curve was used to verify the accuracy of the risk model for predicting patient survival.
Enrichment Analysis
In order to investigate the differences in biological processes of LGG patients in high and low risk score groups. The “GSVA” package in R was used to performed Gene set variation analysis (GSVA). We downloaded the “c2.cp.kegg.v7.2.symbols” gene set from the MSigDB database for GSVA analysis. The “limma” was used to calculate differentially expressed pathways. Log2|foldchange| (log2|FC|)>0.2 and false discovery rate (FDR) <0.01 were considered to be statistically significant.
Estimation of TIME Cell Infiltration
Firstly, from Charoentong’s research, we obtained a set of genes that mark each TIME infiltrating immune cell type.23,24 Then, in order to quantify the relative abundance of each cell infiltration in the LGG TIME, we performed the single sample gene set enrichment (ssGSEA) analysis algorithm. Subsequently, we used the ESTIMATE algorithm in the ESTIMATE software to calculate the immune score of each LGG patient.
Analysis of Immune Checkpoint and Somatic Mutation
Based on previous studies, we obtained 9 immune checkpoints.25 In order to further understand the relationship between tumor microenvironment and clinical immunotherapy, the expression of 9 immune checkpoints including PDCD1 (PD1), CD274 (PDL1), CTLA4, VISTA, TIM3, NKG2A, LAG3, TIGIT and TNFRSF9 were analyzed in the high and low risk score groups. Subsequently, in order to clarify the mutation status in the high and low risk score groups, we downloaded somatic mutation data from the TCGA database for patients with LGG. OncoPlot was used to visualize the number of variant types and classifications.
Analysis of Immune Checkpoint Blocking Genome
We searched for immune checkpoint blocking gene expression profiles, which have complete clinical information. We downloaded the immunotherapy cohort GSE78220 for metastatic melanoma treated with the anti-PD-1 antibody (pembrolizumab) from the Gene Expression Omnibus (GEO) database.26 Subsequently, the limma software package was used to standardize the cohort, and the FPKM data of gene expression profiles were transformed into the more comparable TPM data among samples.
Expression Validation
The GSE4290 dataset (involving 76 cases and 23 normal controls) were obtained from the GEO database (https://www.ncbi.nlm.nih.gov/geo/). We downloaded the original “CEL” file for the GSE4290 dataset. Background adjustment and quantile normalization were performed using the RMA algorithm in the “affy” software package. The annotation file was then used for annotation. The Wilcoxon test was used to calculate the significance of differences in risk model genes at mRNA expression. Then, Gene Expression Profiling Interactive Analysis (GEPAI, http://gepia.cancer-pku.cn/detail.php) was used to analyze the expression of 7 risk model genes in TCGA and Genotype-Tissue Expression (GTEx) datasets. In addition, we also verified the protein expression level of model genes in The Human Protein Atlas (THPA) database (https://www.proteinatlas.org/).
The detailed inclusion criteria for patients with LGG were as follows: (1) patients were initially diagnosed as LGG by pathological examination; (2) patients had not received radiotherapy, chemotherapy, immunotherapy or molecular targeted therapy before diagnosis; (3) patients had no other malignant tumors. The detailed exclusion criteria for patients with LGG were as follows: (1) patients were complicated with other malignant tumors; (2) patients were received adjuvant chemotherapy, radiotherapy or targeted therapy; (3) patients with incomplete clinical data; (4) patients had history of other malignant tumors; (5) patients were relapsed. According to the above criteria, 4 patients with LGG were selected in this study. Cancer and adjacent tissue samples were detected by reverse transcription-quantitative PCR (RT-qPCR). Total RNA was extracted using a TRIzol kit. FastKing cDNA First strand Synthesis Kit (KR106; Tiangen Biotech Co., Ltd.) and SuperReal PreMix Plus (SYBR Green) were used for mRNA reverse transcription and RT-PCR, respectively. Glyceraldehyde-3-phosphate dehydrogenase (GAPDH) and actin beta (ACTB) were used as internal control for gene detection. The relative gene expression levels were calculated using the 2−ΔΔCt method.27 This study was approved by the ethics committee Tianjin Huanhu Hospital (2021–122). All participants were informed as to the purpose of this study, and that this study complied with the Declaration of Helsinki.
Statistical Analysis
R package (version 3.5.3) was used for all statistics. The Wilcoxon test was used to calculate the significance of differences in immune cell infiltration, gene expression, and immune scores between high and low risk score groups. Kaplan-Meier survival analysis was performed, and the differences between groups were analyzed by Log rank test. P<0.05 was statistically significant.
Results
Construction of FRGs Signature Risk Model
A total of 121 FRGs were included. To investigate the prognostic role of FRGs in LGG patients, we conducted univariate Cox regression analysis of 121 FRGs, and screened out the genes correlated with the prognosis of LGG (Figure 1A). After that, LASSO analysis was performed on the characteristic genes (Figure 1B and C). A seven-gene risk model consisting of AKR1C3, ALOX5, HELLS, JUN, SCD, SLC1A5 and TGFBR1 was constructed. We used the coefficients calculated by the Lasso regression analysis to calculate the risk score. Risk Score = (−0.221×AKR1C3) + (0.025×ALOX5) + (0.143×HELLS) + (0.175×JUN) + (−0.115×SCD) + (0.186×SLC1A5) + (0.036×TGFBR1). In addition, correlation analysis showed that there was a significant positive correlation among these 7 FRGs (Figure 1D and E).
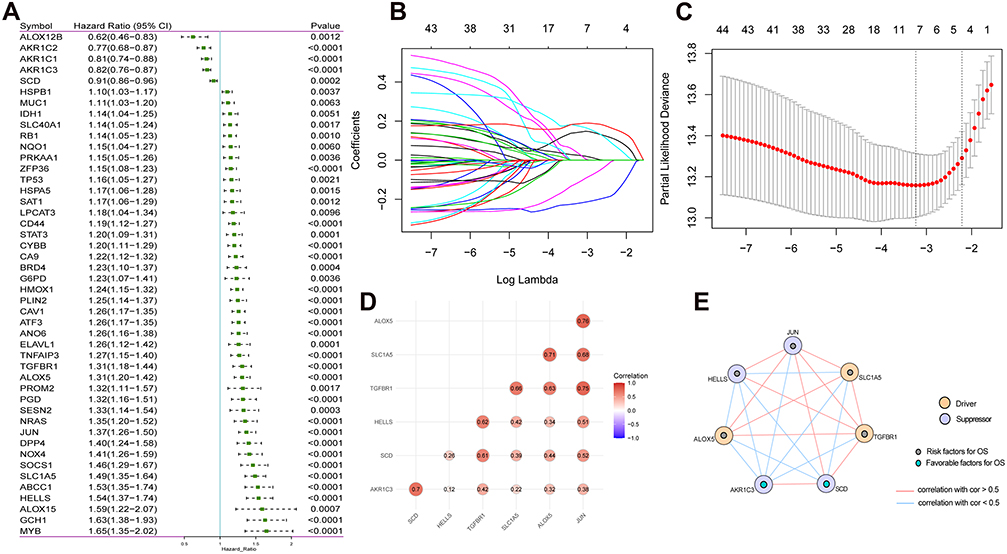 |
Figure 1 FRGs signature in LGG. (A) Univariate Cox regression analysis screened out FRGs that were significantly correlated with LGG prognosis. (B) The LASSO regression model was constructed; (C) The optimal value of the lambda penalty parameter was determined by 10-cross validation; (D) Correlation analysis of 7 FRGs; (E) Protein–Protein Interaction interactions among 7 FRGs. |
Prognostic Value
According to the risk score median, patients were divided into high risk score group and low risk score group. To investigate the prognostic value of FRGs signature, we performed survival analysis. Our data showed that the survival time of patients in the high risk score group was significantly lower than that in the low risk score group (Figure 2A–D). The heat map results showed that SLC1A5, ALOX5, JUN, HELLS and TGFBR1 were highly expressed in the high risk score group, while AKR1C3 and SCD were low expressed (Figure 2E and F). Kaplan-Meier analysis assessed the prognostic value of FRGs signature. The results showed that the survival ability of patients in the low risk score group was significantly higher than that in the high risk score group (Figure 2G and H). In addition, we performed further verification in the CGGA.mRNA_array_301 dataset, and the results were consistent with the results of the training set and verification set (Supplementary Figure 1A–D). In addition, survival analysis of model genes was performed in the high and low risk score group. The results showed SLC1A5, ALOX5, JUN, HELLS, TGFBR1, AKR1C3 and SCD were significantly actively correlated with survival (Figures 3 and 4).
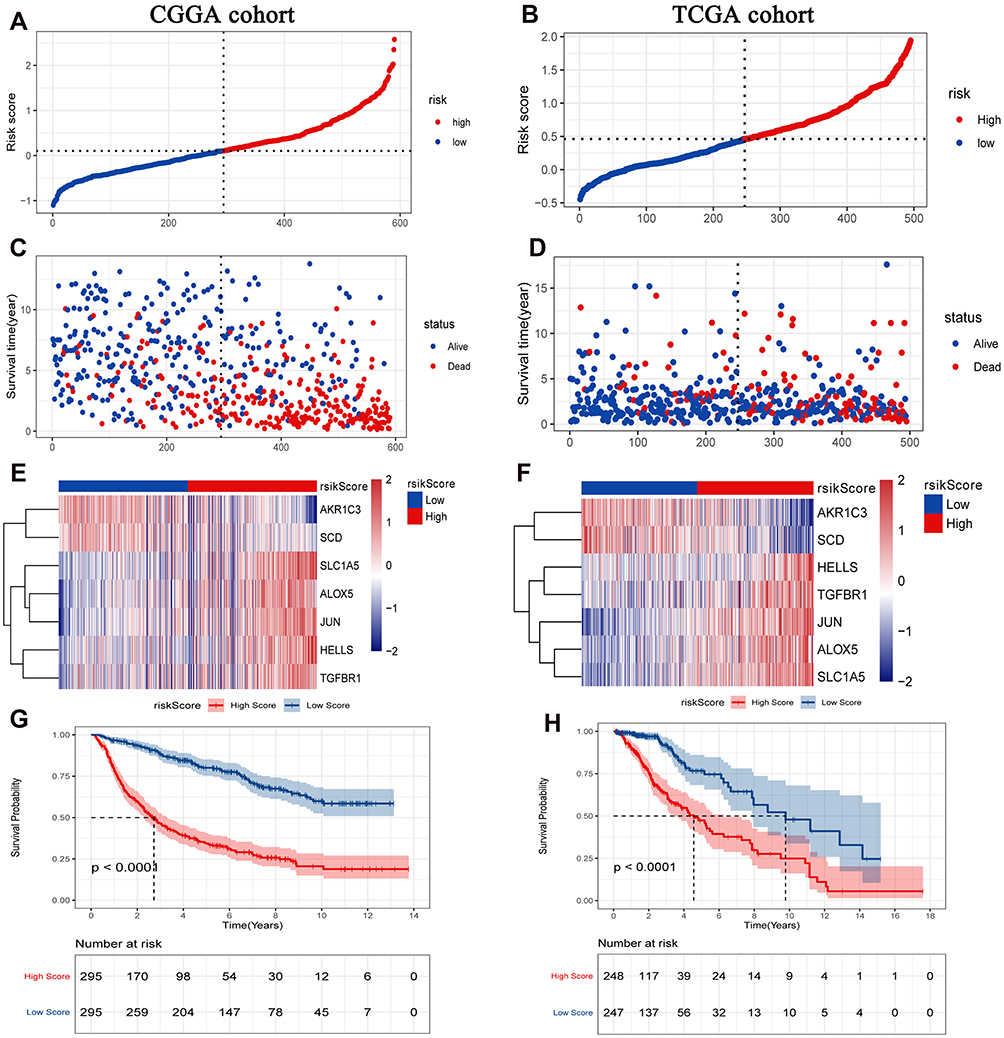 |
Figure 2 Prognostic analysis of FRGs signature. (A) The distribution and optimal cutoff value of the risk scores in the CGGA cohort; (B) The distribution and optimal cutoff value of the risk scores in the TCGA cohort; (C) The distribution and optimal cutoff value of the OS status in the CGGA cohort; (D) The distribution and optimal cutoff value of the OS status in the TCGA cohort; (E) Heat map of FRGs signature in the CGGA cohort; (F) Heat map of FRGs signature in the TCGA cohort; (G) The Kaplan-Meier survival analysis of OS between the high and low risk score groups in the CGGA cohort; (H) The Kaplan-Meier survival analysis of OS between the high and low risk score groups in the TCGA cohort. The CGGA cohort was used as training set, and the TCGA cohort was used as verification set. P < 0.05 was considered statistically significant. Abbreviations: OS, overall survival; FRGs, ferroptosis-related genes. |
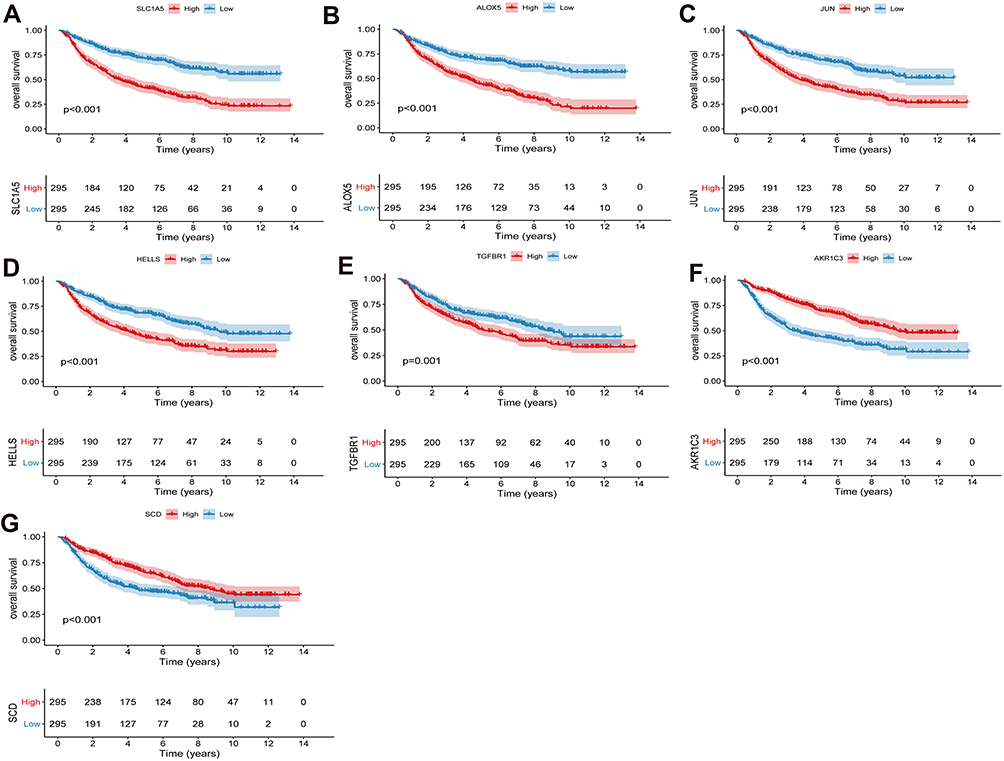 |
Figure 3 Prognostic analysis of SLC1A5 (A), ALOX5 (B), JUN (C), HELLS (D), TGFBR1 (E), AKR1C3 (F) and SCD (G) in high and low risk score groups in the CGGA cohort. P < 0.05 was considered statistically significant. |
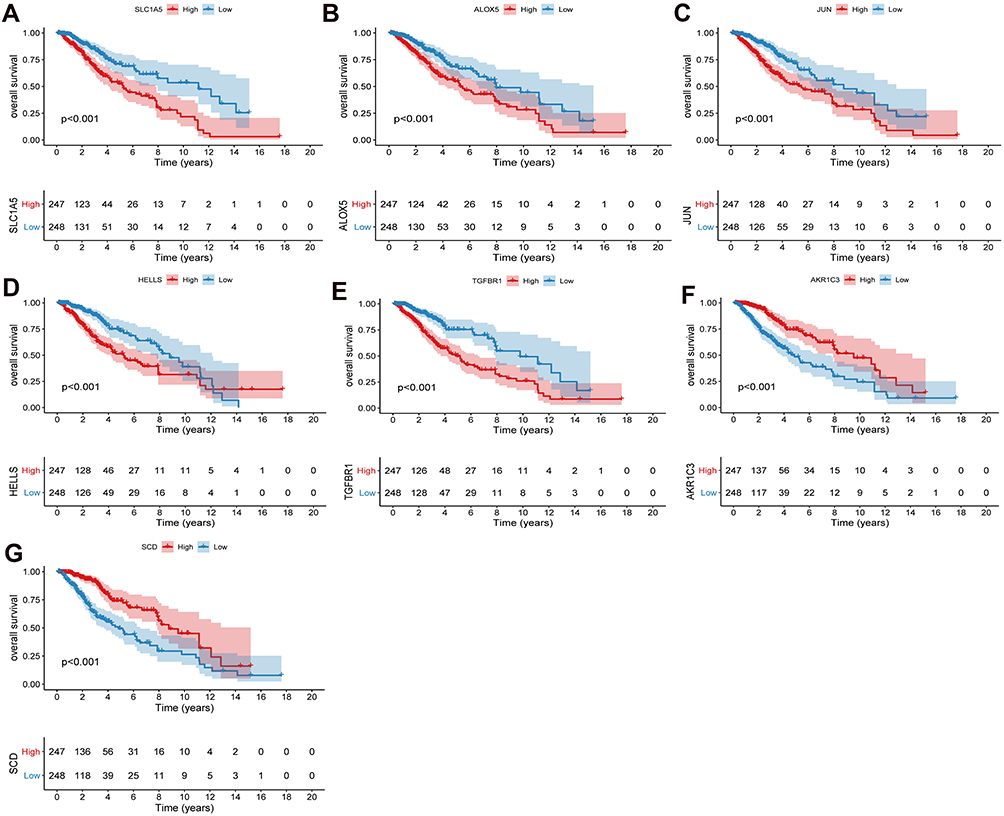 |
Figure 4 Prognostic analysis of SLC1A5 (A), ALOX5 (B), JUN (C), HELLS (D), TGFBR1 (E), AKR1C3 (F) and SCD (G) in high and low risk score groups in the TCGA cohort. P < 0.05 was considered statistically significant. |
FRGs Signature Shows Strong Prognostic Assessment Capability
In order to clarify the predictive efficiency of FRGs signature in 1-, 3-, and 5-year survival rates, we performed ROC analysis. In the training set, the area under curve (AUC) was 0.772 at 1 year, 0.813 at 3 years, and 0.797 at 5 years (Figure 5A). In the verification set, the AUC was 0.843 at 1 year, 0.777 at 3 years, and 0.69 at 5 years (Figure 5B). In addition, we performed further verification in the CGGA.mRNA_array_301 dataset, and the results were basically consistent with the results of the training set and verification set (Supplementary Figure 1E). Verification sets were slightly lower, which may be caused by the difference in the data platform or sequencing method. This indicates that the predicted value of FRGs signature is higher. Univariate Cox analysis showed that high risk score was associated with poor OS (Figure 5C and D). Multivariate Cox analysis showed that the risk score was associated with poor OS and could be used as an independent prognostic factor in LGG patients (Figure 5E and F).
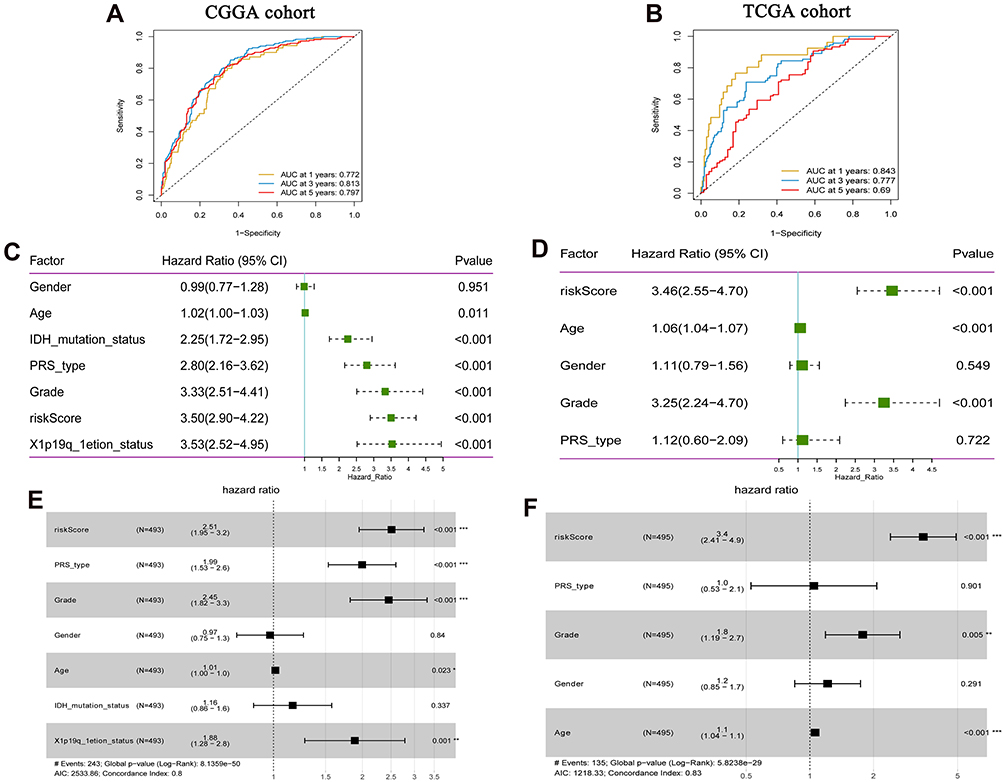 |
Figure 5 Prognostic value of FRGs signature in LGG. (A) Time-dependent ROC analysis of FRGs signature in the CGGA cohort; (B) Time-dependent ROC analysis of FRGs signature in the TCGA cohort; (C) Univariate Cox analysis showed that risk Score was correlated with OS in the CGGA cohort; (D) Univariate Cox analysis showed that risk Score was correlated with OS in the TCGA cohort; (E) Multivariate Cox analysis showed that risk score was correlated with OS in the CGGA cohort; (F) Multivariate Cox analysis showed that risk score was correlated with OS in the TCGA cohort. The CGGA cohort was used as training set, and the TCGA cohort was used as verification set. *P<0.05; **P<0.01; ***P<0.001. P <0.05 was considered statistically significant. Abbreviations: OS, overall survival; FRGs, ferroptosis-related genes; ROC, receiver operator characteristic; AUC, area under curve. |
Clinical Phenotypic Differences Between the Two Groups
In order to explore the differences of clinical phenotypes between the two groups, we analyzed clinical phenotypes. The results showed that the anaplastic astrocytoma (AA) subtype was dominant in the high risk score group, while the oligodendroglioma (O) subtype was dominant in the low risk score group (Figure 6A). Moreover, the high risk score group showed a higher risk of tumor recurrence (Figure 6B). We also performed a separate analysis of astrocytoma and found that patients with astrocytoma in the high risk score group had a higher risk of recurrence and also had lower survival than those in the low risk score group (Supplementary Figure 2). High and low risk score groups have significant differences in clinical phenotypes. Based on TCGA data, we analyzed the distribution of disease progression (PD/SD) and disease remission (CR/PR) in high and low risk groups. The results showed that the CR/PR in the low risk score group was significantly better than that in the high risk score group (Supplementary Figure 3A). The survival advantage of patients with CR/PR was significantly higher than that of patients with PD/SD (Supplementary Figure 3B). Previous studies found that IDH mutation combined with MGMT methylation had a favorable impact on OS of LGG compared with IDH wild type. Further combination of IDH mutation and MGMT methylation with 1p19q co-deletion resulted in an even greater survival benefit.28 We analyzed the distribution of isocitrate dehydrogenase (IDH) mutation, O-6-methylguanine-DNA methyltransferase (MGMT) methylation and 1p/19q co-deletion in high and low risk score groups. The results showed that IDH mutation, MGMT methylation and 1p/19q co-deletion status in the low risk score group were higher than those in the high risk score group, and there were significant differences in IDH mutation and 1p/19q co-deletion between the two groups (Supplementary Figure 4). Subsequently, we examined whether adjuvant radiotherapy and chemotherapy affect the predictive ability of the risk score. The result showed adjuvant radiotherapy and chemotherapy did not interfere with the predictive ability of the risk score. Regardless of whether or not to receive radiotherapy and chemotherapy, the low risk score group always shows a clear survival advantage (Figure 6C and D).
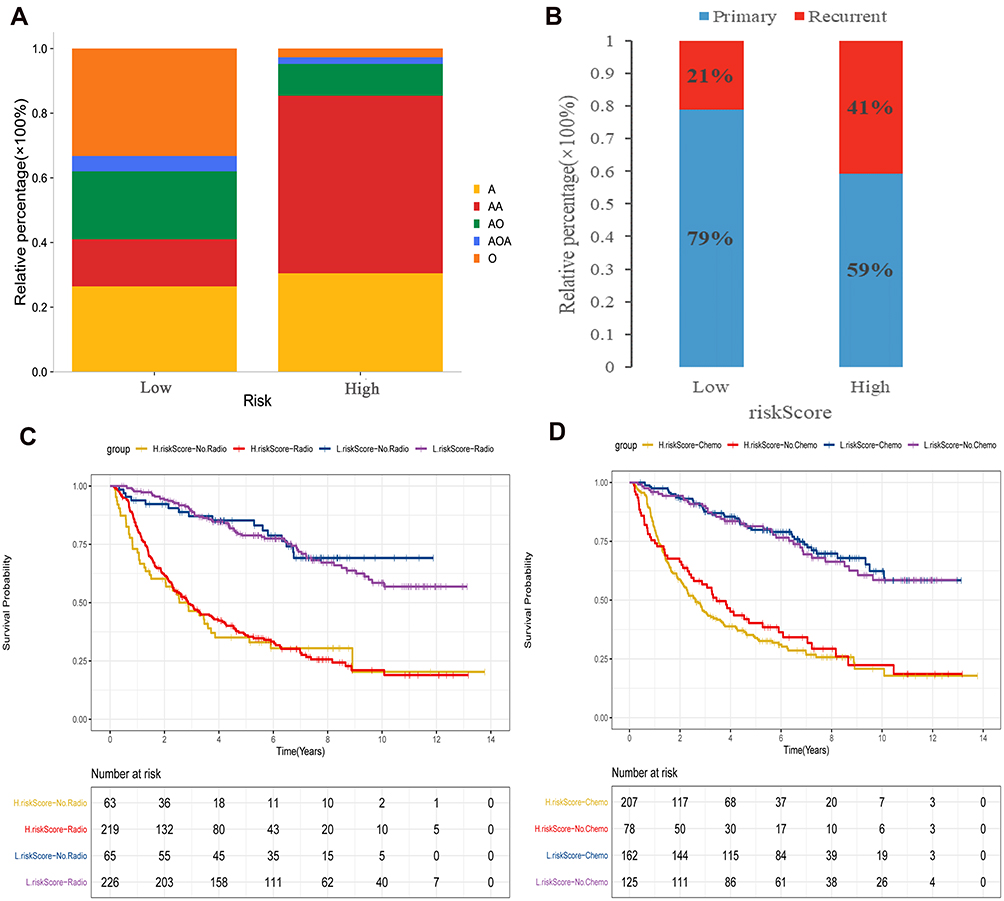 |
Figure 6 Clinical phenotypic differences between high and low risk score groups in CGGA cohort. (A) Differences in clinical subtypes between high and low risk score groups; (B) Comparison of recurrent and primary samples in high and low risk score groups; (C) The effect of radiotherapy on the risk score assessment of survival ability; (D) Effect of chemotherapy on the risk score assessment of survival ability. Abbreviations: AA, anaplastic astrocytoma; O, oligodendroglioma; A, astrocytoma; AO, anaplastic oligodendrocytes; AOA, anaplastic oligodendroid astrocytoma. |
Cell Infiltration Characteristics of TIME in the Two Groups
In order to study the differences in the biological processes of LGG patients in the two groups, we performed GSVA analysis (log2|FC|>0.2, FDR<0.01). In high risk score group, the activity of pathways related to tumor progression was significantly increased, for example cell cycle, p53 signaling pathway, DNA replication, etc (Figure 7). Subsequently, we analyzed the cell infiltration in the TIME and found that the degree of immune cell infiltration was higher in the high risk score group (Figure 8A and B). Results of the ESTIMATE algorithm also showed that the immune score of patients in the high risk score group were significantly higher (Figure 8C and D). However, the high risk score group did not have a good survival advantage. Tumors with an immune rejection phenotype also exhibit the presence of a large number of immune cells that remain in the stromal surrounding tumor cell nests rather than penetrate its parenchyma. Stromal activation in TME was thought to inhibit T cells.29,30 Therefore, we analyzed the stromal activation pathways in high and low risk score groups. The stromal activity in the high risk score group was significantly enhanced (Figure 9A and B). SMAD9, TWIST1, CLDN3, TGFBR2, ACTA2, COL4A1, ZEB1 and VIM are thought to be associated with the transcript of the transforming growth factor β (TGFb)/EMT pathway. Therefore, we studied their expression in the high and low risk score groups. The results showed that most of them were up-regulated in the high score group (Figure 9C and D). This further indicated that the stromal activity of the high-risk score group was enhanced. Subsequently, we investigated the expression of VISTA, CD274, CTLA4, TIM3, NKG2A, LAG3, PDCD1 and TIGIT immune checkpoints in the high and low risk score groups. The results showed that the expression in high risk score group was significantly higher than that in low risk score group (Figure 9E and F). This suggests that high risk score group may suppress immune function by up-regulation of immune checkpoints.
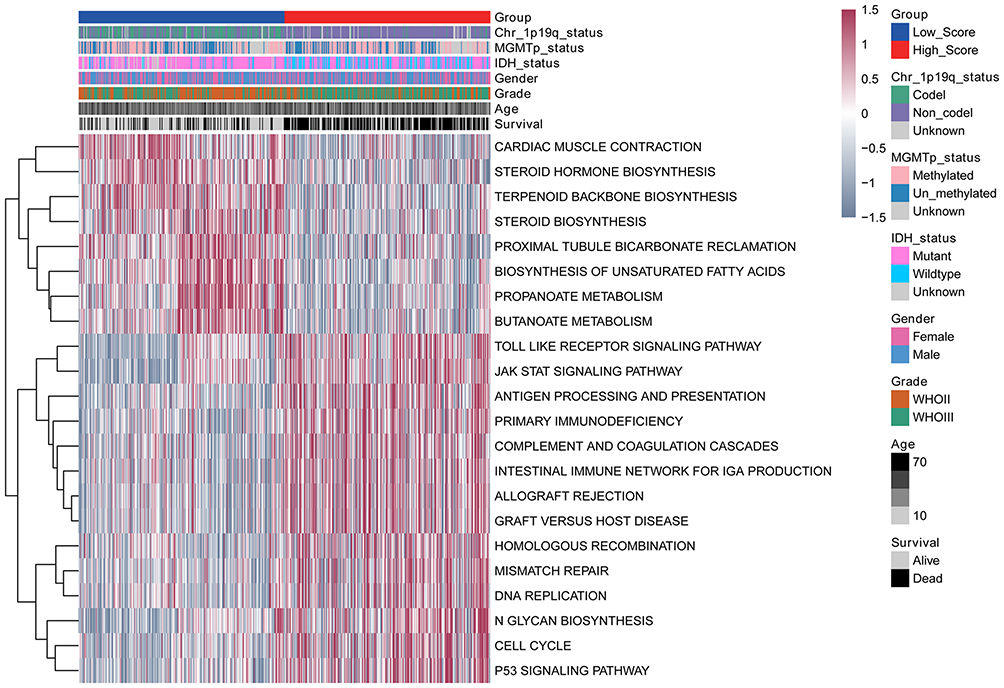 |
Figure 7 Comparison of differential pathways in high and low risk score groups. |
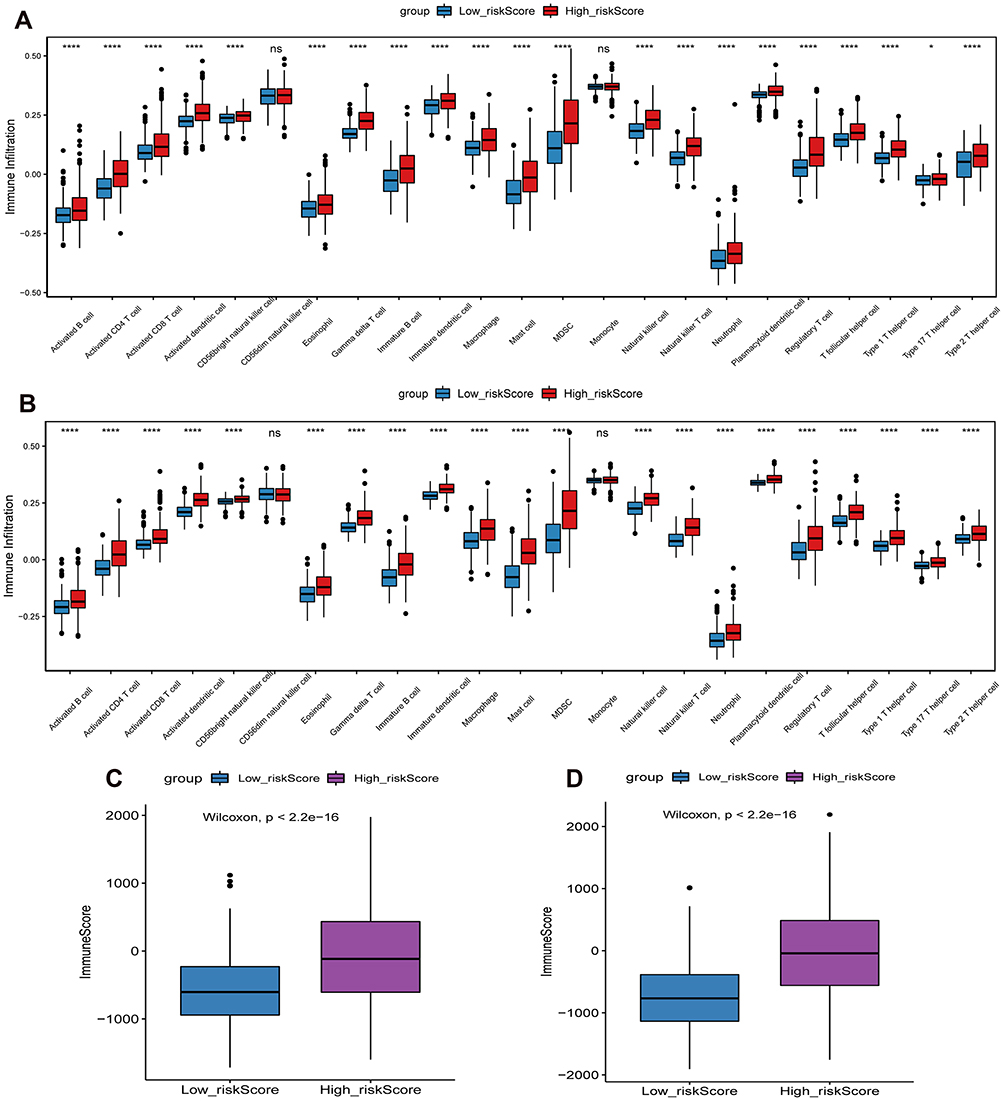 |
Figure 8 Differences in immune cell infiltration and immune score between high and low risk score groups. (A) The difference of immune cell infiltration between high and low risk score groups in CGGA cohort; (B) The difference of immune cell infiltration between high and low risk score groups in TCGA cohort; (C) The difference of immune score between high and low risk score groups in CGGA cohort; (D) The difference of immune score between high and low risk score groups in TCGA cohort. *P<0.05; ****P<0.0001. P <0.05 was considered statistically significant. Abbreviation: ns, no statistical significance. |
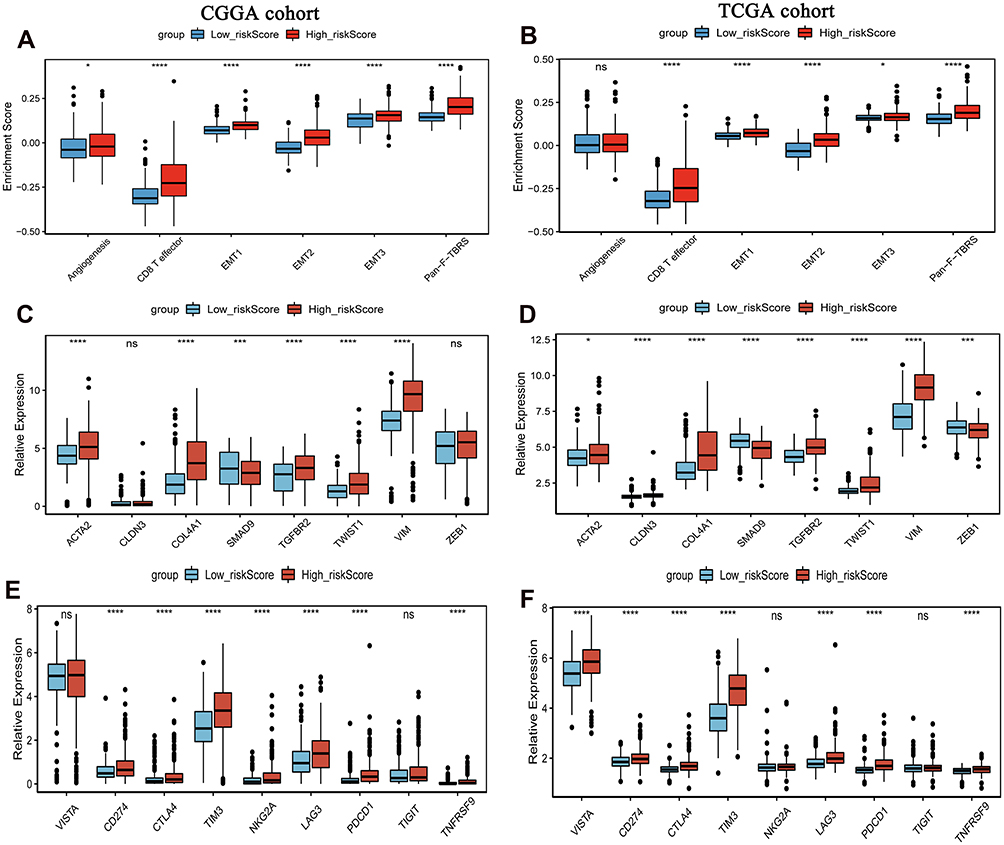 |
Figure 9 Expression of chemokines and cytokines in high and low risk score groups. (A) Differences in stromal activation pathways between high and low risk score groups in the CGGA cohort; (B) Differences in stromal activation pathways between high and low risk score groups in the TCGA cohort; (C) Expression of the TGFβ- EMT pathway related gene expression in high and low risk score groups in the CGGA cohort; (D) Expression of the TGFβ- EMT pathway related gene expression in high and low risk score groups in the TCGA cohort; (E) Expression of immune checkpoints in high and low risk score groups in the CGGA cohort; (F) Expression of immune checkpoints in high and low risk score groups in the TCGA cohort. The CGGA cohort was used as training set, and the TCGA cohort was used as verification set. *P<0.05; ***P<0.001; ****P<0.0001. P <0.05 was considered statistically significant. Abbreviation: ns, no statistical significance. |
Tumor Somatic Mutations in Different Risk Score Groups
The “maftools” package was used to analyze the distribution of somatic mutations between high and low risk score groups in the TCGA cohort. The results showed that both groups showed high levels of somatic mutations (Figure 10A and B). However, genes and frequencies of somatic mutations in the two groups were significantly different. In the low risk score group, the frequency of IDH1 gene mutation was up to 90%, while in the high risk score group, the frequency was 64%. Secondly, the frequency of CIC gene mutation was 37% in the low risk score group and only 4% in the high risk score group.
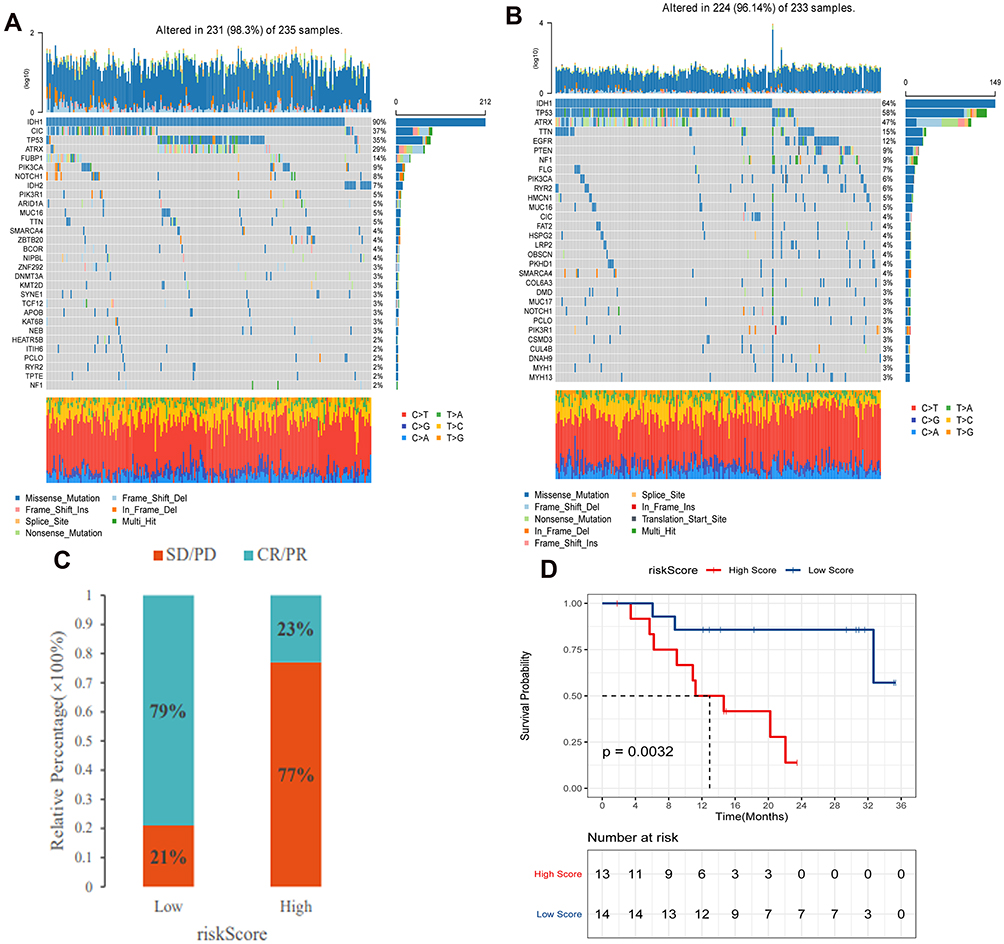 |
Figure 10 Tumor somatic mutations and anti-immunotherapy in high and low risk score group. (A) The frequency of gene mutations in the low risk score group in the TCGA cohort; (B) The frequency of gene mutations in the high risk score group in the TCGA cohort; (C) The proportion of patients with response to PD-L1 blockade immunotherapy in high and low risk score group. (D) Survival differences between low and high risk score group in the anti-PD1 immunotherapy cohort. Abbreviations: SD, stable disease; PD, progressive disease; CR, complete response; PR, partial response. |
The Role of Risk Score in Anti-PD-1/L1 Immunotherapy
Immunotherapy represented by PD-L1 and PD-1 blocking plays an important role in cancer treatment. We investigated whether FRGs signature can predict patient response to immune checkpoint lockdown therapy based on the GSE78220 cohort. The results showed that patients in the low risk score group showed significant clinical benefits and significantly prolonged survival (Figure 10C and D). This confirms that patients with low risk scores have significant therapeutic advantages and clinical responses to anti-PD-1/L1 immunotherapy compared to patients with high risk scores.
Expression Validation of Risk Model Genes
Electronic expression validation of 7 risk model genes (SLC1A5, ALOX5, JUN, HELLS, TGFBR1, AKR1C3 and SCD) were performed in GSE4290, TCGA and GTEx datasets. The results showed that 7 risk model genes were highly expressed at the mRNA level in the LGG group (Figure 11). Subsequently, we verified the protein expression levels of 7 risk model genes in the THPA dataset. Compared with the normal control group, the protein expression levels of the 7 risk model genes in glioma brain tissue were up-regulated (Figure 12). In addition, genes SLC1A5, ALOX5, JUN, HELLS, TGFBR1, AKR1C3 and SCD in the model were verified by RT-PCR. Primers were shown in Table 1. The results showed that the expression levels of SLC1A5, JUN, HELLS, TGFBR1, AKR1C3 and SCD had up-regulated trend in the LGG group compared with the normal control group (Figure 13), which was consistent with electronic expression verification. However, ALOX5 was down-regulated in the LGG group compared with the normal control group (Figure 13), which was opposite with electronic expression verification. Further research is needed.
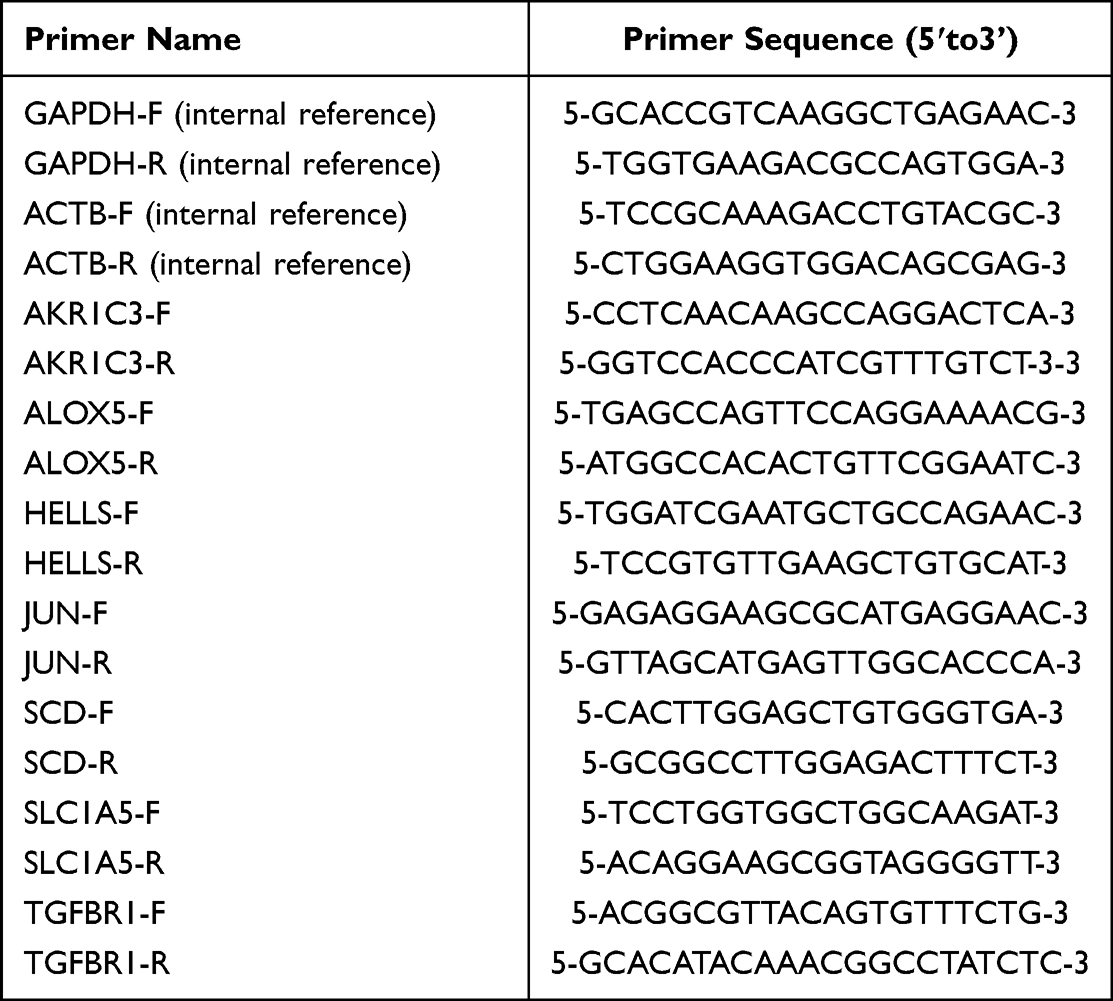 |
Table 1 Primer Sequence in the RT-PCR |
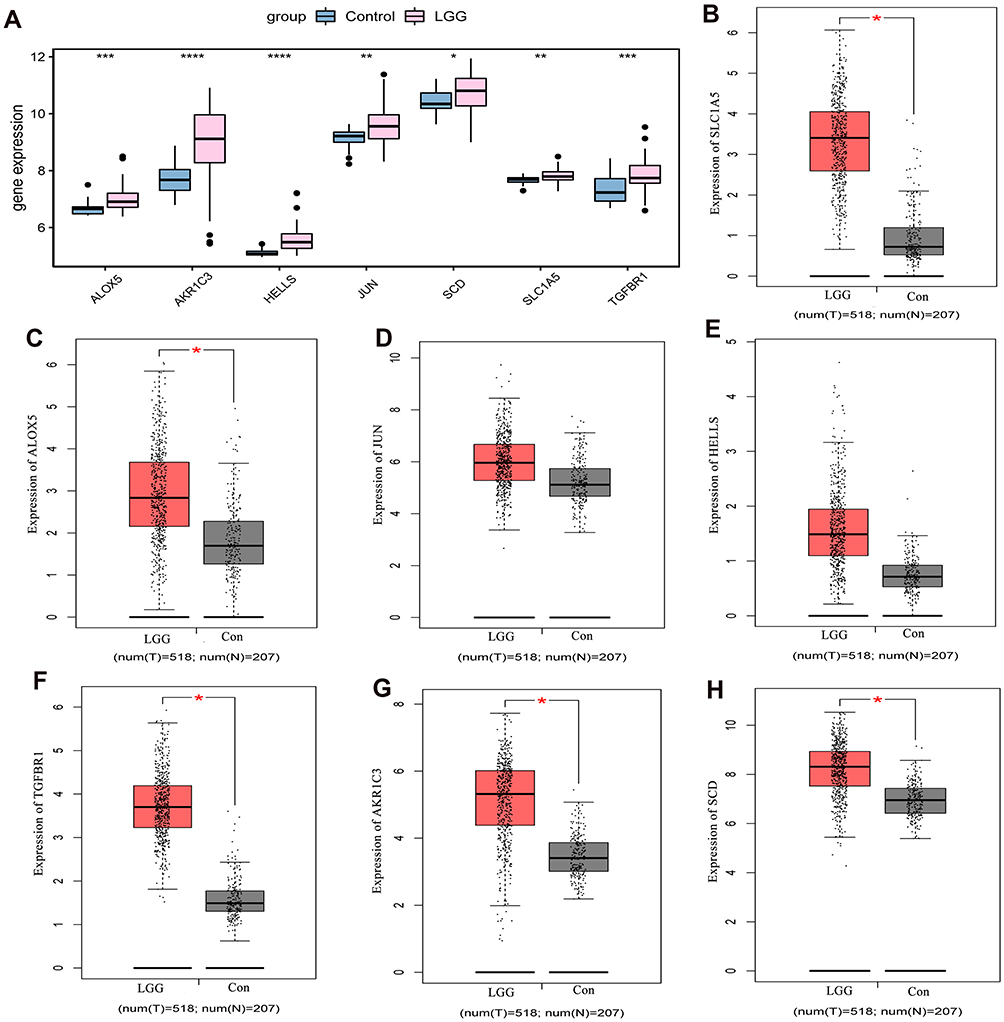 |
Figure 11 Expression validation of risk model genes in normal control tissue and LGG tissue groups at the mRNA level. (A) Expression validation of risk model genes in normal control tissue and LGG tissue groups in GSE4290 dataset; (B) Expression validation of SLC1A5 in normal control tissue and LGG tissue groups in TCGA and GTEx datasets; (C) Expression validation of ALOX5 in normal control tissue and LGG tissue groups in TCGA and GTEx datasets; (D) Expression validation of JUN in normal control tissue and LGG tissue groups in TCGA and GTEx datasets; (E) Expression validation of HELLS in normal control tissue and LGG tissue groups in TCGA and GTEx datasets; (F) Expression validation of TGFBR1 in normal control tissue and LGG tissue groups in TCGA and GTEx datasets; (G) Expression validation of AKR1C3 in normal control tissue and LGG tissue groups in TCGA and GTEx datasets; (H) Expression validation of SCD in normal control tissue and LGG tissue groups in TCGA and GTEx datasets. Red and gray represent LGG and control groups, respectively. *P<0.05; **P<0.01, ***P<0.001; ****P<0.0001. P <0.05 was considered statistically significant. |
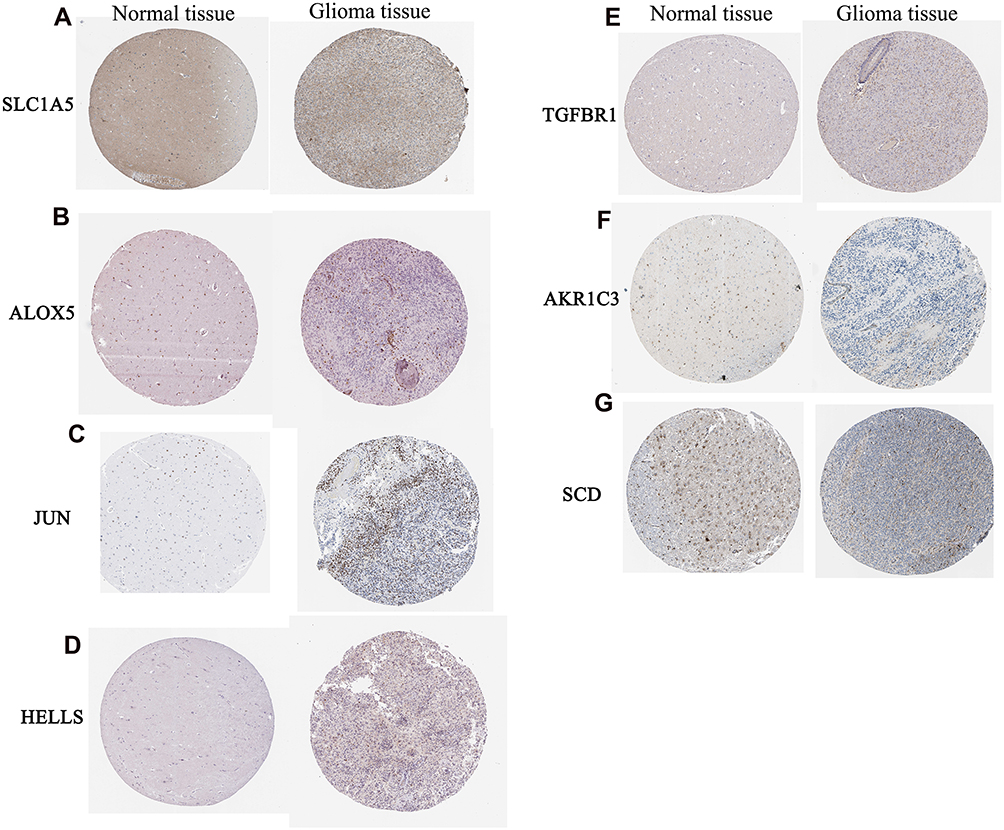 |
Figure 12 Expression validation of SLC1A5 (A), ALOX5 (B), JUN (C), HELLS (D), TGFBR1 (E), AKR1C3 (F) and SCD (G) in normal control tissue and glioma brain tissue groups at the protein level. |
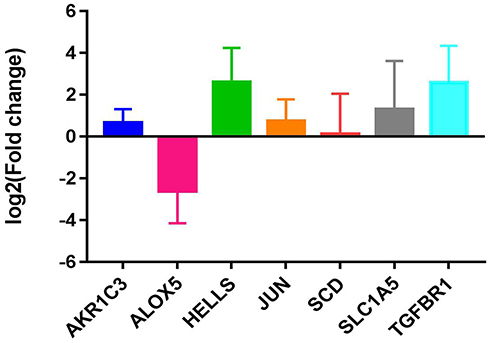 |
Figure 13 RT-qPCR validation of SLC1A5, ALOX5, JUN, HELLS, TGFBR1, AKR1C3 and SCD in tissues samples. |
Discussion
LGG grow more slowly than high grade glioma. They account for 10–20% of all primary brain tumors.31 In adults, LGG can become high grade glioma, which has a poor prognosis.32,33 Scientists have found that ferroptosis plays a vital role in tumor treatment.34 However, there are few studies on the relationship between ferroptosis and survival or other clinical transformations in LGG. To better understand the prognosis of LGG, we explored the correlation between ferroptosis and LGG. Our current work was to build a risk model for LGG ground on 7 FRGs and validate it in public database.
In this study, the proposed prognostic model consisted of 7 FRGs. Aldo-keto reductase family 1 member C3 (AKR1C3) is associated with survival and OS of glioblastoma.35 The expression level of AKR1C3 in central nervous system tumor tissues is significantly different from that in normal tissues.36 Arachidonate 5-lipoxygenase (ALOX5) is significantly associated with tumor purity, methylation and survival in LGG. It is significantly different in healthy brain tissue and glioma.21 The expression of helicase, lymphoid specific (HELLS) is related to the progression of glioma and is highly expressed in glioblastoma. In addition, the carcinogenic effect of HELLS in glioblastoma may be mediated through the interaction with E2F transcription factor 3 (E2F3) and MYC proto-oncogene, bHLH transcription factor (MYC).37 As a downstream target of lRP6-GSK3 β-E2F1 signaling pathway, HELLS is associated with glioma progression.38 The enhancement of Jun proto-oncogene, AP-1 transcription factor subunit (JUN, also known as c-jun) transcription activity can induce the progression of glioma.39 Moreover, the miR-497/Wnt3a/c-jun pathway involved in the regulation of c-jun can regulate the growth of glioma cells.40 Stearoyl-CoA desaturase (SCD) is abnormally expressed in glioblastoma multiforme and is associated with patient prognosis.41 SCD is overexpressed in glioma cells and can regulate lipid metabolism and organelle morphology, which has unique therapeutic significance.42 Solute carrier family 1 member 5 (SLC1A5) is abnormally expressed in glioma, and the overexpression of SLC1A5 can eliminate the inhibitory effect of lncRNA-XIST down-regulation on glioma activity and tumorigenesis.43 Transforming growth factor beta receptor (TGFBR) 1 belongs to the TGFBR family. The inhibition of TGFBR can inhibit the growth and invasion of glioma cells.44,45 In summary, 7 FRGs in the prognostic model may play a vital regulatory role in glioma. Therefore, the model constructed with these 7 FRGs in LGG has potential reliability.
Ferroptosis is significantly associated with diagnostic and prognostic factors for LGG, and tumor cells are more sensitive to ferroptosis than normal cells.21 In our study, FRGs signature showed strong prognostic evaluation ability in LGG. The high risk score group had significantly poorer survival time and OS. This is consistent with previous studies.46 Previous studies have found that mutual regulation between ferroptosis and TIME plays a vital role in tumor progression and treatment.47,48 In order to investigate the correlation between ferroptosis and TIME in LGG, we performed immune cell infiltration and immune checkpoint analysis. The high risk score group contained abundant immune cell infiltration, but the activation of the stromal inhibits the immune activity, thus showing immune rejection.30 This suggests that ferroptosis has a broad regulatory mechanisms on the anti-tumor effect of immune cells. Immune checkpoints and their ligands are often up-regulated in the microenvironment of various tumors to regulate tumor immune escape.49 Immune checkpoint inhibitors have been reported to improve survival in clear cell renal cell carcinoma patients.50 In the high risk score group, we observed high expression of immune checkpoints. Therefore, identifying the underlying mechanism of action between immune checkpoints and iron death can help determine potential therapeutic targets for LGG. With the deepening of research on tumor immunity, immunotherapy has made breakthrough progress in tumor treatment, in particular, the development of inhibitors of PD-1/PD-L1.51,52 Therefore, we investigated whether FRGs signature could predict patient response to immune checkpoint lockdown therapy. Patients with low risk scores had significant therapeutic advantages and clinical responses to anti-PD-1/L1 immunotherapy compared to patients with high risk scores. In summary, ferroptosis was associated with immunity to LGG.
This experiment also has some limitations. Firstly, our prognostic model was constructed and validated using data in public database. We need to collect a large amount of real-world clinical data for verification. Secondly, our research only initially revealed the correlation between ferroptosis and prognosis and immunity in glioma, and its underlying specific mechanisms need further in-depth study. Thirdly, the RT-PCR verification sample size is too small, which leads to errors in the verification results and electronic expression verification. The sample needs to be expanded for further verification.
Conclusions
We identified 7 FRGs that significantly associated with the prognosis of LGG. Based on these 7 genes, we constructed a prognostic model. This model has been proved to be related to the OS of LGG patients in both the TCGA and CGGA databases. In addition, this model analyzed the clinical phenotype, TIME cell infiltration characteristics, anti-PD-1/L1 immunotherapy and somatic mutations of LGG, which provided an important idea for further understanding the immunotherapy and ferroptosis treatment of LGG. This article only provides a potential theoretical basis, and we will do further research on the specific molecular mechanism in the later stage.
Data Sharing Statement
The datasets during and/or analyzed during the current study available from the corresponding author (Liwei Sun) on reasonable request.
Ethics Approval and Informed Consent
This study was approved by the ethics committee Tianjin Huanhu Hospital (2021-122). All participants were informed as to the purpose of this study, and that this study complied with the Declaration of Helsinki.
Consent for Publication
The subjects gave written informed consent for the publication of any associated data and accompanying images.
Author Contributions
All authors made a significant contribution to the work reported, whether that is in the conception, study design, execution, acquisition of data, analysis and interpretation, or in all these areas; took part in drafting, revising or critically reviewing the article; gave final approval of the version to be published; have agreed on the journal to which the article has been submitted; and agree to be accountable for all aspects of the work.
Funding
There is no funding to report.
Disclosure
The authors indicated no potential conflicts of interest.
References
1. Kiran M, Chatrath A, Tang X, et al. A prognostic signature for lower grade gliomas based on expression of long non-coding RNAs. Mol Neurobiol. 2019;56(7):4786–4798. doi:10.1007/s12035-018-1416-y
2. Ostrom QT, Bauchet L, Davis FG, et al. The epidemiology of glioma in adults: a “state of the science” review. Neuro-Oncology. 2014;16(7):896–913. doi:10.1093/neuonc/nou087
3. IJzerman-Korevaar M, Snijders TJ. Prevalence of symptoms in glioma patients throughout the disease trajectory: a systematic review. J Neurooncol. 2018;140(3):485–496. doi:10.1007/s11060-018-03015-9
4. Chen R, Smith-Cohn M, Cohen AL, et al. Glioma subclassifications and their clinical significance. Neurotherapeutics. 2017;14(2):284–297. doi:10.1007/s13311-017-0519-x
5. Tom MC, Cahill DP, Buckner JC, et al. Management for different glioma subtypes: are all low-grade gliomas created equal? Am Soc Clin Oncol Edu Book. 2019;39:133–145. doi:10.1200/EDBK_238353
6. Mukasa A. [Precision medicine for IDH-mutant diffuse glioma(Lower-grade Glioma)]. No Shinkei Geka. 2022;50(1):8–18. Japanese. doi:10.11477/mf.1436204527
7. Wesseling P, Capper D. WHO 2016 classification of gliomas. Neuropathol Appl Neurobiol. 2018;44(2):139–150. doi:10.1111/nan.12432
8. Forst DA, Nahed BV, Loeffler JS, et al. Low-grade gliomas. Oncologist. 2014;19(4):403–413. doi:10.1634/theoncologist.2013-0345
9. Wang TJC, Mehta MP. Low-grade glioma radiotherapy treatment and trials. Neurosurg Clin N Am. 2019;30(1):111–118. doi:10.1016/j.nec.2018.08.008
10. Chaichana KL, McGirt MJ, Laterra J, et al. Recurrence and malignant degeneration after resection of adult hemispheric low-grade gliomas. J Neurosurg. 2010;112(1):10–17. doi:10.3171/2008.10.JNS08608
11. Zhou Z, Wei J, Lu B, et al. Comprehensive characterization of pyroptosis patterns with implications in prognosis and immunotherapy in low-grade gliomas. Front Genet. 2021;12:763807. doi:10.3389/fgene.2021.763807
12. Lin WW, Ou GY. Mutational profiling of low-grade gliomas identifies prognosis and immunotherapy-related biomarkers and tumour immune microenvironment characteristics. J Cell Mol Med. 2021;25(21):10111–10125. doi:10.1111/jcmm.16947
13. Hirschhorn T, Stockwell BR. The development of the concept of ferroptosis. Free Radic Biol Med. 2019;133:130–143. doi:10.1016/j.freeradbiomed.2018.09.043
14. Stockwell BR, Friedmann Angeli JP, Bayir H, et al. Ferroptosis: a regulated cell death nexus linking metabolism, redox biology, and disease. Cell. 2017;171(2):273–285. doi:10.1016/j.cell.2017.09.021
15. Liu J, Kuang F, Kroemer G, et al. Autophagy-dependent ferroptosis: machinery and regulation. Cell Chem Biol. 2020;27(4):420–435. doi:10.1016/j.chembiol.2020.02.005
16. Qiu Y, Cao Y, Cao W, et al. The application of ferroptosis in diseases. Pharmacol Res. 2020;159:104919. doi:10.1016/j.phrs.2020.104919
17. Hassannia B, Vandenabeele P, Vanden Berghe T. Targeting ferroptosis to iron out cancer. Cancer Cell. 2019;35(6):830–849. doi:10.1016/j.ccell.2019.04.002
18. Friedmann Angeli JP, Krysko DV. Ferroptosis at the crossroads of cancer-acquired drug resistance and immune evasion. Nat Rev Cancer. 2019;19(7):405–414. doi:10.1038/s41568-019-0149-1
19. Yee PP, Wei Y, Kim SY. Neutrophil-induced ferroptosis promotes tumor necrosis in glioblastoma progression. Nat Commun. 2020;11(1):5424. doi:10.1038/s41467-020-19193-y
20. Liu HJ, Hu HM, Li GZ, et al. Ferroptosis-related gene signature predicts glioma cell death and glioma patient progression. Front Cell Develop Biol. 2020;8:538. doi:10.3389/fcell.2020.00538
21. Liu Y, Xu Z, Jin T, et al. Ferroptosis in low-grade glioma: a new marker for diagnosis and prognosis. Med Sci Monitor. 2020;26:e921947. doi:10.12659/MSM.921947
22. Huang R, Dong R. Adaptive changes allow targeting of ferroptosis for glioma treatment. Cell Mol Neurobiol. 2021. doi:10.1007/s10571-021-01092-5
23. Natalia P, Stephanie S, Justin J-LW. Aberrant expression of enzymes regulating m 6 A mRNA methylation: implication in cancer. Cancer Biol Med. 2018;15(4):323–334. doi:10.20892/j.issn.2095-3941.2018.0365
24. Tong J, Cao G, Zhang T, et al. m(6)A mRNA methylation sustains Treg suppressive functions. Cell Res. 2018;28(2):253–256. doi:10.1038/cr.2018.7
25. Wang Z, Guo X, Gao L, et al. Glioblastoma cell differentiation trajectory predicts the immunotherapy response and overall survival of patients. Aging. 2020;12(18):18297–18321. doi:10.18632/aging.103695
26. Hugo W, Zaretsky JM, Sun L, et al. Genomic and transcriptomic features of response to Anti-PD-1 therapy in metastatic melanoma. Cell. 2016;165(1):35–44. doi:10.1016/j.cell.2016.02.065
27. Livak KJ, Schmittgen TD. Analysis of relative gene expression data using real-time quantitative PCR and the 2(-Delta Delta C(T)) Method. Methods. 2001;25(4):402–408. doi:10.1006/meth.2001.1262
28. Chen R, Ravindra VM, Cohen AL, et al. Molecular features assisting in diagnosis, surgery, and treatment decision making in low-grade gliomas. Neurosurg Focus. 2015;38(3):E2. doi:10.3171/2015.1.FOCUS14745
29. Chen DS, Mellman I. Elements of cancer immunity and the cancer-immune set point. Nature. 2017;541(7637):321–330. doi:10.1038/nature21349
30. Zhang B, Wu Q, Li B, et al. m(6)A regulator-mediated methylation modification patterns and tumor microenvironment infiltration characterization in gastric cancer. Mol Cancer. 2020;19(1):53. doi:10.1186/s12943-020-01170-0
31. Kumthekar P, Raizer J, Singh S. Low-grade glioma. Cancer Treat Res. 2015;163:75–87.
32. Braunstein S, Raleigh D, Bindra R, et al. Pediatric high-grade glioma: current molecular landscape and therapeutic approaches. J Neurooncol. 2017;134(3):541–549. doi:10.1007/s11060-017-2393-0
33. De Bonis P, Lofrese G, Anile C, et al. Radioimmunotherapy for high-grade glioma. Immunotherapy. 2013;5(6):647–659.
34. Xu T, Ding W, Ji X, et al. Molecular mechanisms of ferroptosis and its role in cancer therapy. J Cell Mol Med. 2019;23(8):4900–4912. doi:10.1111/jcmm.14511
35. Serão NV, Delfino KR, Southey BR, et al. Cell cycle and aging, morphogenesis, and response to stimuli genes are individualized biomarkers of glioblastoma progression and survival. BMC Med Genomics. 2011;4:49. doi:10.1186/1755-8794-4-49
36. Park AL, Lin HK, Yang Q, et al. Differential expression of type 2 3α/type 5 17β-hydroxysteroid dehydrogenase (AKR1C3) in tumors of the central nervous system. Int J Clin Exp Pathol. 2010;3(8):743–754.
37. Zhang G, Dong Z, Prager BC, et al. Chromatin remodeler HELLS maintains glioma stem cells through E2F3 and MYC. JCI Insight. 2019;4(7). doi:10.1172/jci.insight.126140
38. Xiao D, Huang J, Pan Y, et al. Chromatin remodeling factor LSH is upregulated by the LRP6-GSK3β-E2F1 axis linking reversely with survival in gliomas. Theranostics. 2017;7(1):132–143. doi:10.7150/thno.17032
39. Liu L, Guan H, Li Y, et al. Astrocyte elevated gene 1 interacts with acetyltransferase p300 and c-Jun to promote tumor aggressiveness. Mol Cell Biol. 2017;37(5). doi:10.1128/MCB.00456-16
40. Lu F, Ye Y, Zhang H, et al. miR-497/Wnt3a/c-jun feedback loop regulates growth and epithelial-to-mesenchymal transition phenotype in glioma cells. Int J Biol Macromol. 2018;120(Pt A):985–991. doi:10.1016/j.ijbiomac.2018.08.176
41. Korbecki J, Kojder K, Jeżewski D. Expression of SCD and FADS2 is lower in the necrotic core and growing tumor area than in the peritumoral area of glioblastoma multiforme. Biomolecules. 2020;10(5). doi:10.3390/biom10050727
42. Lita A, Pliss A, Kuzmin A, et al. IDH1 mutations induce organelle defects via dysregulated phospholipids. Nat Commun. 2021;12(1):614. doi:10.1038/s41467-020-20752-6
43. Sun Y, Lv B, Zhang X. RETRACTED ARTICLE: knock-down of LncRNA-XIST induced glioma cell death and inhibited tumorigenesis by regulating miR-137/SLC1A5 axis-mediated ROS production. Naunyn-Schmiedeberg’s arch Pharmacol. 2021;394(3):557. doi:10.1007/s00210-020-01831-3
44. Hjelmeland MD, Hjelmeland AB, Sathornsumetee S, et al. SB-431542, a small molecule transforming growth factor-beta-receptor antagonist, inhibits human glioma cell line proliferation and motility. Mol Cancer Ther. 2004;3(6):737–745.
45. Uhl M, Aulwurm S, Wischhusen J, et al. SD-208, a novel transforming growth factor beta receptor I kinase inhibitor, inhibits growth and invasiveness and enhances immunogenicity of murine and human glioma cells in vitro and in vivo. Cancer Res. 2004;64(21):7954–7961. doi:10.1158/0008-5472.CAN-04-1013
46. Zheng Y, Ji Q, Xie L, et al. Ferroptosis-related gene signature as a prognostic marker for lower-grade gliomas. J Cell Mol Med. 2021;25(6):3080–3090. doi:10.1111/jcmm.16368
47. Yang C, Huang S, Cao F, et al. Role of ferroptosis-related genes in prognostic prediction and tumor immune microenvironment in colorectal carcinoma. PeerJ. 2021;9:e11745. doi:10.7717/peerj.11745
48. Xu H, Ye D, Ren M, et al. Ferroptosis in the tumor microenvironment: perspectives for immunotherapy. Trends Mol Med. 2021;27(9):856–867. doi:10.1016/j.molmed.2021.06.014
49. Toor SM, Sasidharan Nair V, Decock J, et al. Immune checkpoints in the tumor microenvironment. Semin Cancer Biol. 2020;65:1–12. doi:10.1016/j.semcancer.2019.06.021
50. Miao D, Margolis CA, Gao W. Genomic correlates of response to immune checkpoint therapies in clear cell renal cell carcinoma. Science. 2018;359(6377):801–806. doi:10.1126/science.aan5951
51. Riley RS, June CH, Langer R, Mitchell MJ. Delivery technologies for cancer immunotherapy. Nat Rev Drug Discovery. 2019;18(3):175–196. doi:10.1038/s41573-018-0006-z
52. Li JX, Huang JM, Jiang ZB, et al. Current clinical progress of PD-1/PD-L1 immunotherapy and potential combination treatment in non-small cell lung cancer. Integr Cancer Ther. 2019;18:1534735419890020. doi:10.1177/1534735419890020
 © 2022 The Author(s). This work is published and licensed by Dove Medical Press Limited. The full terms of this license are available at https://www.dovepress.com/terms.php and incorporate the Creative Commons Attribution - Non Commercial (unported, v3.0) License.
By accessing the work you hereby accept the Terms. Non-commercial uses of the work are permitted without any further permission from Dove Medical Press Limited, provided the work is properly attributed. For permission for commercial use of this work, please see paragraphs 4.2 and 5 of our Terms.
© 2022 The Author(s). This work is published and licensed by Dove Medical Press Limited. The full terms of this license are available at https://www.dovepress.com/terms.php and incorporate the Creative Commons Attribution - Non Commercial (unported, v3.0) License.
By accessing the work you hereby accept the Terms. Non-commercial uses of the work are permitted without any further permission from Dove Medical Press Limited, provided the work is properly attributed. For permission for commercial use of this work, please see paragraphs 4.2 and 5 of our Terms.