")
Back to Journals » International Journal of General Medicine » Volume 15
Construction of a Pyroptosis-Related Signature for Prognostic Prediction and Characterization of Immune Microenvironment in Acute Myelogenous Leukemia
Authors Liu S, Luo D, Luo J, Liang H, Zhi Y, Wang D, Xu N
Received 15 December 2021
Accepted for publication 28 January 2022
Published 12 March 2022 Volume 2022:15 Pages 2913—2927
DOI https://doi.org/10.2147/IJGM.S352062
Checked for plagiarism Yes
Review by Single anonymous peer review
Peer reviewer comments 2
Editor who approved publication: Dr Scott Fraser
Songyang Liu,1,* Dongmei Luo,2,* Jie Luo,2 Hanyin Liang,2 Yunfei Zhi,1 Dong Wang,3 Na Xu2
1The First School of Clinical Medicine, Southern Medical University, Guangzhou, 510515, Guangdong, People’s Republic of China; 2Department of Hematology, Nanfang Hospital, Southern Medical University, Guangzhou, 510515, Guangdong, People’s Republic of China; 3Department of Bioinformatics, Basic Medical College of Southern Medical University, Guangzhou, Guangdong, 510515, People’s Republic of China
*These authors contributed equally to this work
Correspondence: Dong Wang, Department of Bioinformatics, Basic Medical College of Southern Medical University, 1838 Guangzhou Da Dao North, Guangzhou, Guangdong, 510515, People’s Republic of China, Email [email protected] Na Xu, Department of Hematology, Nanfang Hospital, Southern Medical University, 1838 Guangzhou Da Dao North, Guangzhou, 510515, Guangdong, People’s Republic of China, Email [email protected]
Background: Acute myelogenous leukemia (AML) is a common and fatal disease in hematology with frequent relapses and a poor prognosis. Pyroptosis, a programmed cell death mediated by inflammasomes, has been shown to be associated with leukemia recently. However, the role of pyroptosis for diagnosis and prognosis in AML remained less understood.
Methods: We downloaded three public datasets and constructed a signature of TCGA cohort using the least absolute shrinkage and selection operator (LASSO) Cox regression model to predict the overall survival of AML patients. Samples from the GEO database were treated as a validation cohort. Gone through LASSO-Cox regression analysis, an 8-PRG-related signature was developed. Used the median score from the signature, we classified patients in two subgroups. Subsequently, we employed univariate COX, multivariate Cox regression, ROC analysis and constructed a nomogram, Finally, differential analysis, GO and KEGG functional analysis, ESTIMATE algorithm and CIBERSORT algorithm were used to explore the difference between two groups.
Results: The expression levels of 90.9% pyroptosis-related genes (PRGs) had significant difference compared AML with normal tissues. The results of univariate COX regression analysis demonstrated 10 differentially expressed genes (DEGs) were associated with patients’ OS (p < 0.05). Then, we found OS of patients in the low-risk group was more likely to be lengthened compared with their high-risk counterparts (P < 0.05 both in the TCGA and GEO cohort). After controlling clinical factors, the risk score could still remain an independent predictive element (HR > 1, P < 0.001) of OS in multivariate Cox regression analysis. Furthermore, a nomogram with prognostic value for AML was thus established. Time-dependent ROC analysis proved the predictive power of the signature. Functional analysis suggested that DEGs were mainly concentrated in immune-related pathways, such as humoral immune response and T cell proliferation. TME scores and risk scores were strongly correlated and immune status differed between the risk subgroups.
Conclusion: A novel PRG-related signature was established to forecast the prognosis in AML, and pyroptosis may be a potential therapeutic target for AML.
Keywords: acute myelogenous leukemia, pyroptosis, gene signature, tumor immune micro-environment, prognosis
Introduction
Acute myelogenous leukemia (AML), known as an aggressive hematological malignancy, is generated by abnormal proliferous and differential aberrations of myeloid progenitor cells.1 It is AML that makes up the most of acute leukemia in adults, expected to increase by 20,240 new cases (1.1% of all new cancer cases) in 2021 in the United States.2
Most AML patients can achieve leukemia cell reduction through cytarabine and anthracycline chemotherapy as the development of therapeutic approaches, however, there is still no remarkably long-term improvement for more than 30 years, for which the 5-year overall survival rates of patients under 60 years of age continued less than 40%.3 Targeted molecules and combination therapies had brought new breakthroughs in the treatment of AML, but the outcomes remain unsatisfactory due to off-target, drug resistance, and high relapse rates.4 Therefore, more efforts are needed to ferret out some promising biomarkers, which can track prognosis of patients as well as provide more efficient treatment strategies.
Pyroptosis, defined as a pro-inflammatory programmed cell death that can lead to rapid lysis of affected cells, was first described in myeloid cells infected by pathogens or bacteria in 1992.5 In previous studies, it was found that there are two mainly activated mechanisms of pyroptosis, one through the classical caspase-1 inflammatory pathways, and the other through the non-classical caspase-4/5/11 inflammatory pathways.6 In classical pathways, inflammasomes are activated in response to stimulation by diverse danger signals during infections, tissue damage or metabolic imbalances, such as viral infection.7,8 The inflammasomes facilitates caspase-1 dimerization and activation by forming a protein complex with adapter protein apoptosis-associated speck like proteins (ASC).9 Activated Caspase-1 cleaves Gasdermin D (GSDMD) into two parts: GSDMD-NT and GSDMD-CT. The former could trigger cell swelling, cell rupture, and promote the inflammation.10,11 Besides, other important role of activated caspase-1 is to induce the ripeness and release of IL-18 and IL-1β, which have ability to aggregate inflammatory response.12 Recently, pyroptosis has become a new topic in cancer research, many studies found that pyroptosis plays an essential regulator in tumor invasion, proliferation and metastasis.13
To further understand pyroptosis, we focused on the effect of pyroptosis on the survival prognosis of AML. In our research, AML patients’ information collected from The Cancer Genome Atlas (TCGA) database and 33 pyroptosis-related genes (PRGs) were involved to construct a robust multigene signature and build a nomogram to quantify their predictive power for predicting patient prognosis in the TCGA cohort. A Gene Expression Omnibus (GEO) cohort (GSE71014) was served as validation set of the signature. In addition, to explore potential mechanisms between high- and low-risk groups, we performed differential expression analysis, functional enrichment analysis, and explored the relationships between risk groups and the proportion of 22 immune cell types. Our study provides new evidence of the potentially prognostic significance of PRGs in AML patients.
Materials and Methods
Data Collection
The training cohort included 151 AML samples was downloaded from the TCGA database (https://portal.gdc.cancer.gov/) up to July 29, 2021. Microarray datasets of GSE7101414 were downloaded from the GEO website (https://www.ncbi.nlm.nih.gov/geo/) and treated as the validation cohort. Additionally, the normal control datasets (GTEx, Whole Blood (n = 337)) were obtained from UCSC Xena website (https://xenabrowser.net/datapages/). The counts of three databases were displayed as Table 1.
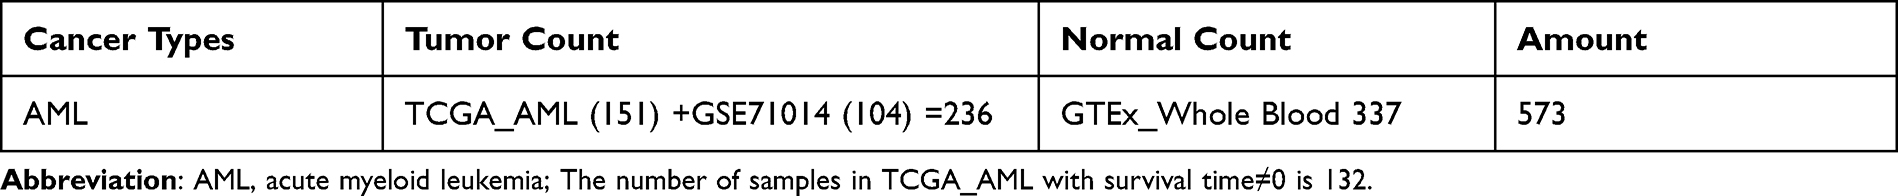 |
Table 1 | RNA-Seq Datasets of AML Group and Control Group |
Identification of Differentially Expressed PRGs
First of all, a total of 33 PRGs were collected from previous reviews8 and research,15 which are displayed in Supplementary Table S2. Before comparison, TCGA datasets and GTEx datasets were normalized by “normalizeBetweenArrays” function via limma package and converted to FPKM values. The “limma” package was also employed to identify differentially expressed genes (DEGs) with a adjust P value <0.05.16 The correlation coefficient of the DEGs was calculated by Pearson analysis. Furthermore, a protein-protein interaction (PPI) network was formulated using the Search Tool for the Retrieval of Interacting Genes (STRING)17 to reveal the potential interaction of differentially expressed PRGs, and the hub gene was further identified by the MCC method in Cytoscape software.18
Construction and Confirmation of PRG-Related Prognostic Model
Aiming for establish a prognosis-related PRGs model of the training dataset, we firstly employed Univariate Cox proportional hazards regression analysis to identify the pyroptosis-related genes with prognostic significance and “forestplot” package was applied to show the results. Then, the PRGs with P<0.05 entered LASSO-penalized Cox regression analysis (“glmnet” R package) to screen the hub prognostic genes. The risk score signature was calculated as follows:
(“n”: the number of PRGs in the signature, “i”: the PRG that comprised of the signature, “Coef”: the regression coefficient, “Exp”: the expression value of the each PRG in the signature.)
Subsequently, We used the time-dependent receiver operating characteristic (ROC) curve to access the predictive performance of the PRG-related signature.19 Based on the median value of risk scores calculated by lasso-cox model as the boundary, the AML patients were stratified into low- and high-risk groups. Kaplan–Meier method with Log rank test was employed to perform survival analysis and “survminer” package was used to display the difference between the two subgroups. Furthermore, we developed a nomogram depended on risk score and clinical variables to forecast the survival rate of 1-, 3-, and 5-year for AML patients (“rms” packages). Its predictive power was evaluated by the consistency index (C Index). To estimate the consistency between actual and predicted survival, calibration plots were also drawn.
Further, to validate the predictive performance of the PRG-related model, another AML cohort (GSE71014) was downloaded. The risk score of each AML patient was obtained from signature of training set, and AML patients was divided into two groups by the median risk score. The Kaplan–Meier curve was employed to reflect the survival performance of two groups.
Identification of Differentially Expressed Genes (DEGs) and Functional Enrichment Between the Low- and High-Risk Groups
To identify differential expressed genes (HTSeq-Counts) within two subgroups, the edgeR package20 was conducted with thresholds |log2FoldChange| >1 as well as false discovery rate (FDR)<0.05. To annotate the functional pathways the DEGs involved, we employed the “clusterProfiler” R package21 to perform Gene Ontology (GO) analysis and Kyoto Encyclopedia of Genes and Genomes (KEGG) analysis, in which the pathways with adjust p value<0.05 were remained.
TME Immune Cell Infiltration Analysis
ESTIMATE scores, immune scores, and stromal scores for each AML patient were calculated by ESTIMATE algorithm.22 CIBERSORT algorithm23 was employed to analyze the gene expression data (FPKM) to identify the fraction of the different types of immune cells (Table S5) infiltrated in AML patients. The analysis was performed with 500 permutations (parameters: perm=500) to improve the accuracy of the results. AML patients with P < 0.05 were considered to be applicable for further analysis. The relationships between 22 immune cells were defined using the Pearson correlation analysis (“corrplot” package). According to the median of the fraction of specific immune cell, the survival analysis of immune cell subtype was established.
Statistical Analysis
All statistical analyses are accomplished with R language 4.0.4 version and attached packages. Kaplan–Meier method with a Log rank test was employed to compare the OS of AML patients between subgroups. Kruskal–Wallis or Wilcoxon test were applied to test associations between categorical and continuous variables with p < 0.05 for statistically significant.
Results
Identification of DEGs Between Normal and AML Samples
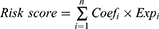
Compared 337 normal with 151 AML tissues in the unifying data as described in the methods section, 90.9% (30/33) of the pyroptosis-related genes showed different expression levels (all adjust P< 0.05), among which, 16 genes (PRKACA, CASP4, NLRP6, CASP5, GSDMD, PLCG1, CASP1, PYCARD, NLRC4, AIM2, NLRP1, NOD2, GSDMB, CASP9, IL6, and NLRP2) were down-regulated while 14 other genes (CASP3, CASP6, SCAF11, PJVK, IL18, NOD1, TIRAP, GSDMC, GSDME, ELANE, IL1B, TNF, NLRP7, and GPX4) were up-regulated in the AML patients (Table S1, Figure 1A). The correlation network containing 30 pyroptosis-related DEGs is presented in Figure 1C. It was found that the correlation of differentially expressed PRGs was from weak to strong. CASP3 was positively correlated with CASP6 with correlation coefficient 0.87, and PRKACA was negatively correlated with CASP6 (correlation coefficient = −0.82). Moreover, to illustrate the relationship between each DEGs, we mapped a protein-protein interaction (PPI) network (Figure 1B), which consisted of 30 nodes and 46 edges. More, IL1B, IL18, PYCARD, CASP1, AIM2, NLRC4, TNF, CASP4, and NLRP1 were determined as hub genes by Cytoscape software via MCC method.
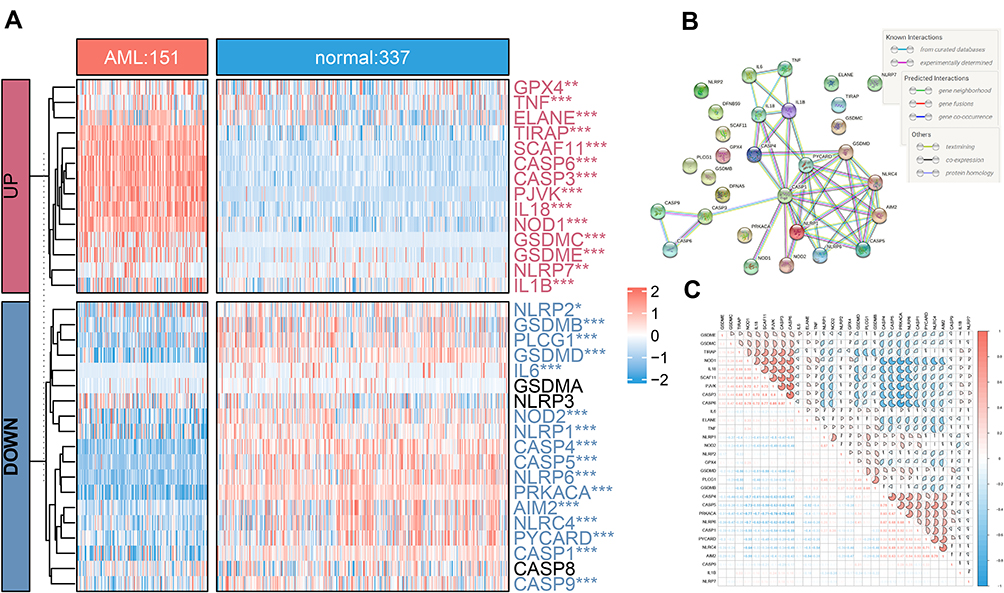 |
Figure 1 Distribution of 33 PRGS in normal and acute myelocytic leukemia (AML) tissues. (A) The heatmap of expression of 33 PRGs in normal and AML samples (*P < 0.05; **P < 0.01; ***P < 0.001; adjust p value of limma). (B) The PPI network showing the interactions among 30 pyroptosis DEGs. (C) The “corrplot” showing the correlation of the 30 DEGs’ expression in AML. |
Construction and Evaluation of Prognostic Risk Model Based on TCGA-AML
To further illustrate what were PRGs act as in AML prognosis, we performed univariate Cox regression analysis on all AML patients based on the expression levels of 33 common PRGs in the training set——TCGA dataset (Figure 2A). The 10 PRGs (PYCARD, GPX4, CASP1, ELANE, CASP9, AIM2, CASP6, GSDMB, CASP3, and PRKACA) had strong relevance to overall survival (OS) of AML patients (P< 0.05) and selected for further analysis. Among these ten genes, the hazard ratios (HRs) of 6 genes (PYCARD, GPX4, CASP1, CASP9, AIM2, and PRKACA) were higher than 1, which indicated they were harmful genes, conversely, the other four genes (ELANE, CASP6, GSDMB, and CASP3) with HRs <1 were protective genes, and all of ten genes were DEGs between normal and AML samples (Figure 2D). Then, the least absolute shrinkage and selection operator (LASSO) Cox regression analysis based on the remained 10 PRGs was performed, eight optimal PRGs were determined based on the optimum lambda value (0.053, Figure 2B and C). The patients’ risk scores were defined as follows:

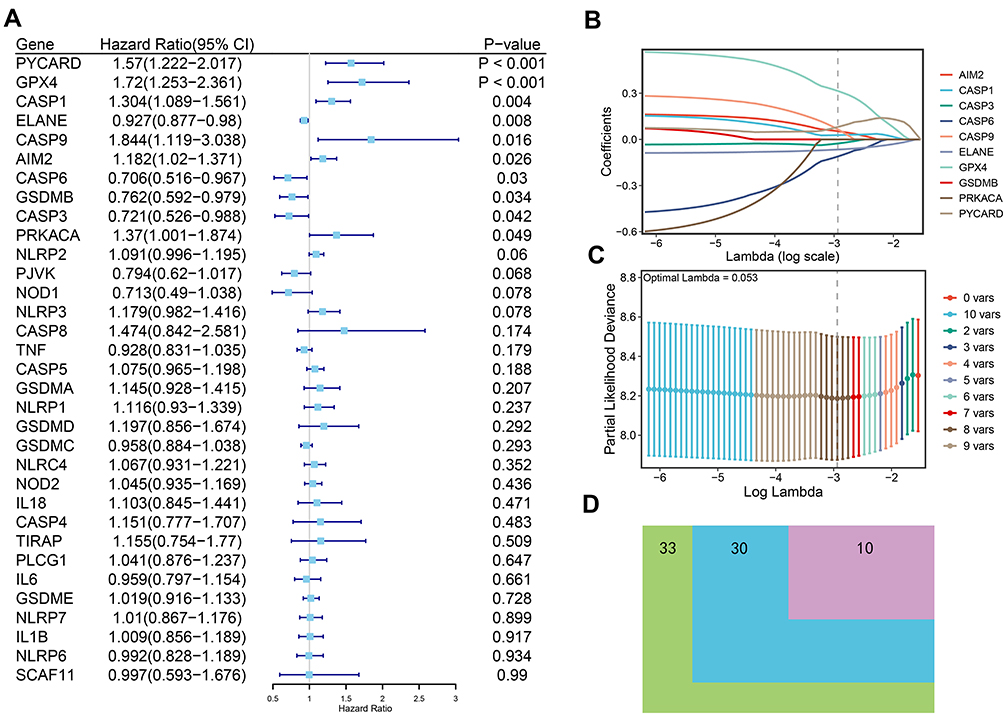 |
Figure 2 Construction of the survival model to screen hub PRGs. (A) Forest map of univariate Cox proportional hazards regression: 8 hub PRGs with P < 0.05 were selected from 33 common PRGs. (B and C) LASSO regression of the 8 OS-related PRGs. (D) Venn diagram showing the differentially expressed PRGs between normal and AML tissues that were related to OS (green: 33 common PRGs, blue: 30 DEGs, pink: 10 RPGs related to OS). |
We divided AML samples into low- and high-risk groups by median score obtained from the formula (Figure 3A). The principal component analysis (PCA) analysis showed that the patients in two subgroups could be divided well into different clusters (Figure S1A). In addition, the prognosis of patients in high-risk group was more unfavorable than those with low risk (Figure 3B). Kaplan-Meier curve suggested that patients in the high-risk group had a significantly poor prognosis compared to those with low risk (Figure 3D, P < 0.0001). To assess the accuracy of risk model on OS prediction performance, we employed time-dependent receiver operating characteristic (ROC) analysis and found that the area under the ROC curve (AUC) reached 0.734 at 1 year, 0.811 at 3 years, and 0.874 at 5 years (Figure 3E). As shown in Figure 3C, the heatmap of 8-PRG expression levels revealed that the ELANE, CASP3, and CASP6 genes had higher expression levels in the low-risk group than those in high-risk group, in contract, GPX4, CASP1, CASP9, AIM2, and PYCARD were lower expressed. Subsequently, we explored the clinical relevance of our 8-PRG signature and evaluated the correlation between the risk scores and clinical factors of AML patients in the TCGA dataset. The results showed that risks scores had significant difference in some clinical factors, such as survival status (“alive” or “dead”), age and eight FAB classifications (p<0.05, Figure S1B, D and E), but there is no obvious difference in sex and race of AML patients (Figure S1C and F).
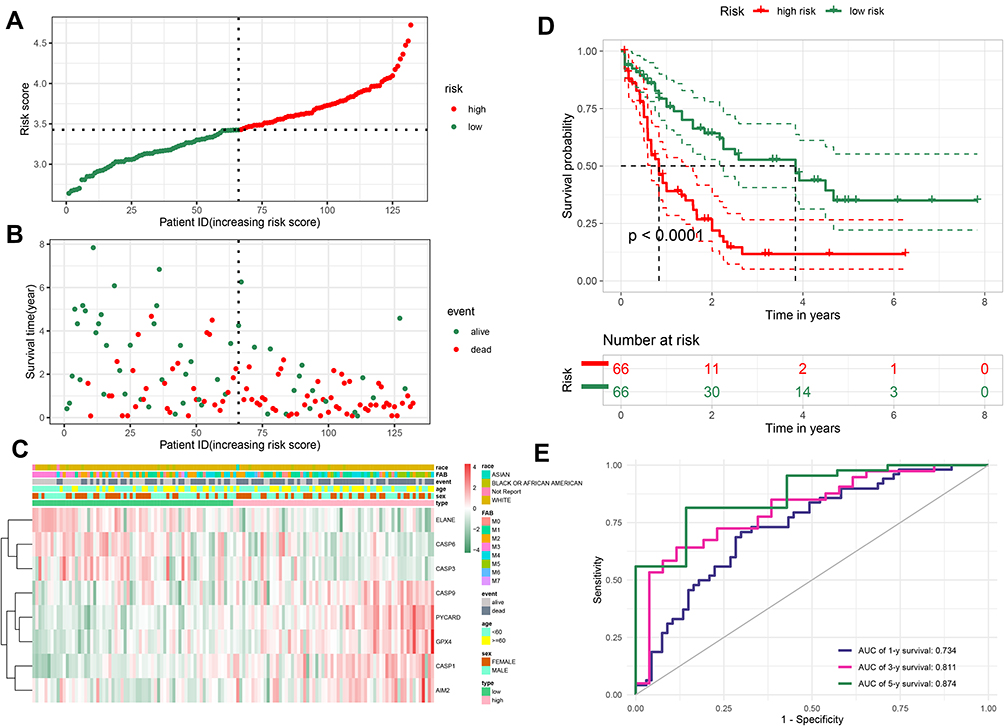 |
Figure 3 Evaluation the prognostic value of the PRG signature in the training set. (A) Distribution of the risk scores calculated by 8-PRG model. (B) Patient distribution in the low- and high-risk score groups based on survival status. (C) Heatmap of 8 PRGs expression profiles based on the TCGA data. (D) Overall survival curves stratified by the low- and high-risk group. (E) Time-dependent ROC curves for PRG-based overall survival prediction. |
Independent Prognostic Value of the Risk Model
The results of Univariate Cox regression indicated that risk score and age were independent indicators for prognosis, with a risk score’s HR of 3.887 (95% CI: 2.361–6.399, Figure 4A). After bringing into multiple factors such as FAB classifications, gender and age, risk score still remained an independent prognostic factor in multivariate Cox regression analysis (Figure 4B, HR=3.70). To provide a quantitative approach for prognosis of AML, a nomogram concluded risk score, gender, age, and FAB classifications was constructed (Figure 4C). As indicated in the nomogram, risk score and age contributed largest to 1-, 3- and 5-year OS of AML patients, and the C-index of the prognostic model was 0.708 (95% CI: 0.64822–0.76778). Besides, the AUC of 5-year OS rate confirmed the prediction performance of risk score (0.874) and age (0.777, Figure 4D). The calibration curves indicated excellent consistency with the standard curve in predicting 5-year OS for AML patients (Figure 4E). This indicates that the nomogram made up with the risk score and clinical parameters could better predict the long-term survival rate of AML patients.
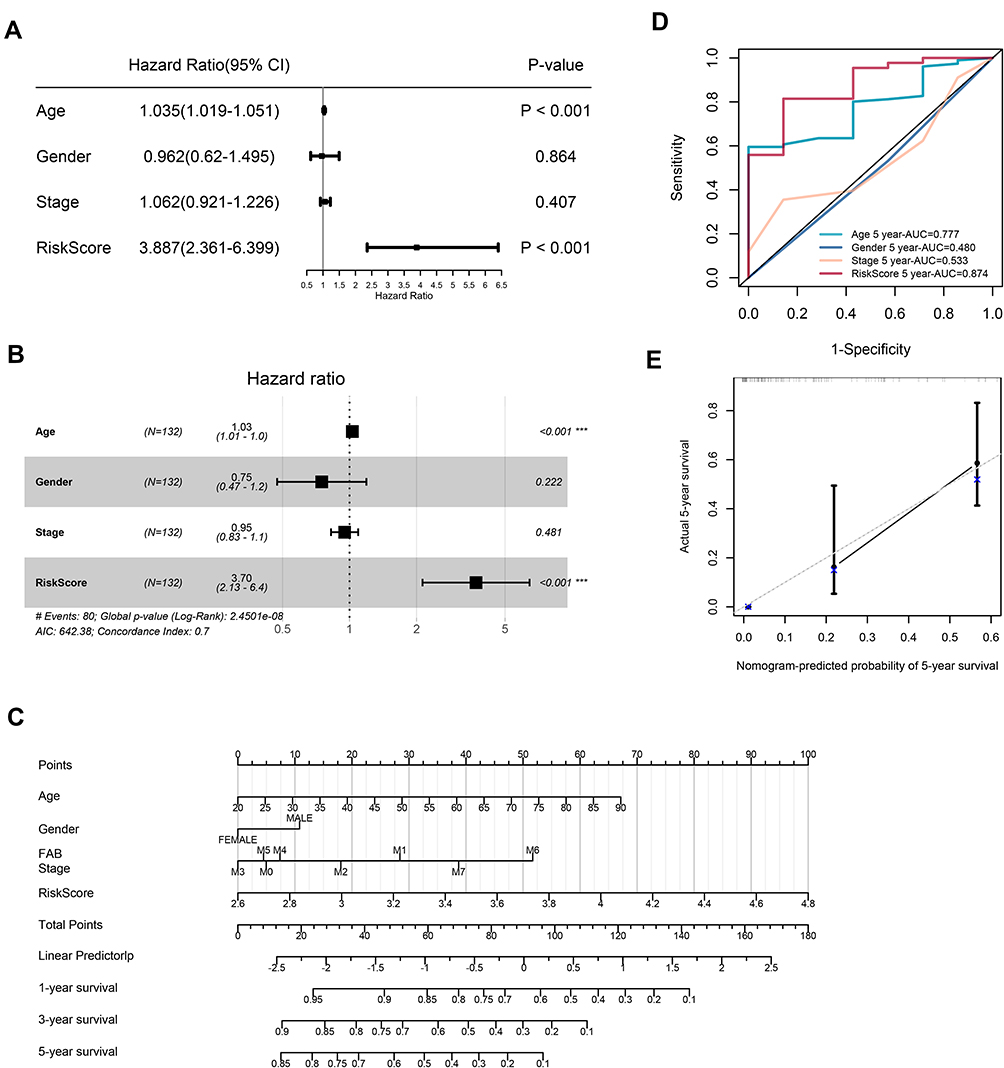 |
Figure 4 Univariate and multivariate Cox regression analyses for the risk score. (A) Univariate Cox regression analysis of signature and other clinical parameters. (B) Multivariate Cox regression analysis of signature and other clinical parameters. (C) The nomogram of 1-year, 3-year or 5-year OS based on risk score, age, gender and FAB stage. (D) The ROC curves analysis based on risk score and other clinicopathologic parameters. (E) Calibration plots for assessing the conformance between the predicted and the actual OS for the prognostic nomogram model. |
Prognostic Value of the 8-PRG Model in the Validation Set
To validate the predictive ability of the TCGA cohort’ prognostic model, we served the GEO cohort (GSE71014) as a validation set. Based on the 8-PRG model, risk score of each AML patient was calculated. Additionally, the patients were divided into high- (n = 52) and low-risk (n = 52) groups according to the median score. The distribution of risk scores was displayed in Figure 5A. In consistent with the results of TCGA cohort, the patients with high risk had a probability of worse OS (Figure 5B). Corresponding heatmap of the expression level of PRGs were displayed in Figure 5C, which we could find the same conclusion: in the low-risk group, the ELANE, CASP3, and CASP6 genes were also enriched, while genes (GPX4, CASP1, CASP9, AIM2, and PYCARD) were down-regulated. The results of PCA analysis also indicated that there were significant differences between two groups (Figure S1G). In addition, Kaplan–Meier analysis also revealed patients in high-risk subgroup had lower survival rates and shorter survival times (Figure 5D, P=0.048). The ROC curve analysis showed the AUC of 1-year, 3-year, and 5-year survival was 0.650, 0.682, and 0.535 respectively, which corroborated the predictive performance of our model (Figure 5E). And the risk scores had difference between “alive” and “dead” survival status (Figure S1H). In general, these results indicate that the 8-PRG model has good accuracy in predicting the occurrence and development of AML.
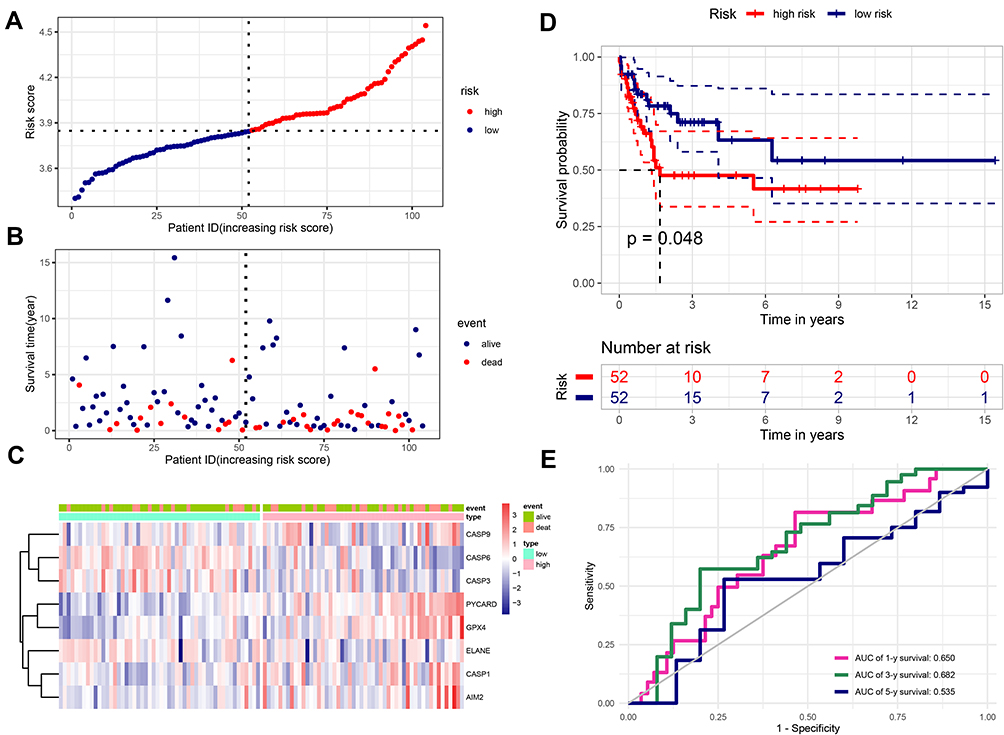 |
Figure 5 Verification the prognostic value of the 8-PRG signature in the validation set (GSE71014). (A) Distribution of the risk scores calculated by the 8-PRG model. (B) Patient distribution in the low- and high-risk score groups based on survival status. (C) Heatmap of 8 PRGs expression profiles based on the GEO data. (D) Overall survival curves stratified by the low- and high-risk group. (E) Time-dependent ROC curves for PRG-based overall survival prediction. |
Functional Enrichment Analysis of Differentially Expressed Genes (DEGs) Between High- and Low-Risk Groups
Through the analysis above, we discovered there were notable differences in the survival time and survival rate between two groups in both cohorts. To further explore the differences in the gene functions and pathways, in TCGA dataset, we identified 1435 DEGs (652 up-regulated and 783 down-regulated, Figure 6C) using the edgeR package with the FDR< 0.05 and |log2 FC |≥ 1. The heatmap of total DEGs expression was displayed by Figure 6A. As expected, the GO term analysis (Table S3) revealed that the DEGs were mostly associated with skeletal system morphogenesis, regulation of myeloid leukocyte mediated immunity pathways, neutrophil activation involved in humoral immune response, regulation of immune effector process, and T cell proliferation (Figure 6B). KEGG pathways (Table S4) suggested that the DEGs were mainly enriched in the pathways of cytokine-cytokine receptor interaction, phagosome, viral protein interaction with cytokine and cytokine receptor, osteoclast differentiation, and B cell receptor signaling pathway (Figure 6D). All of them are related to AML progression and immune response.
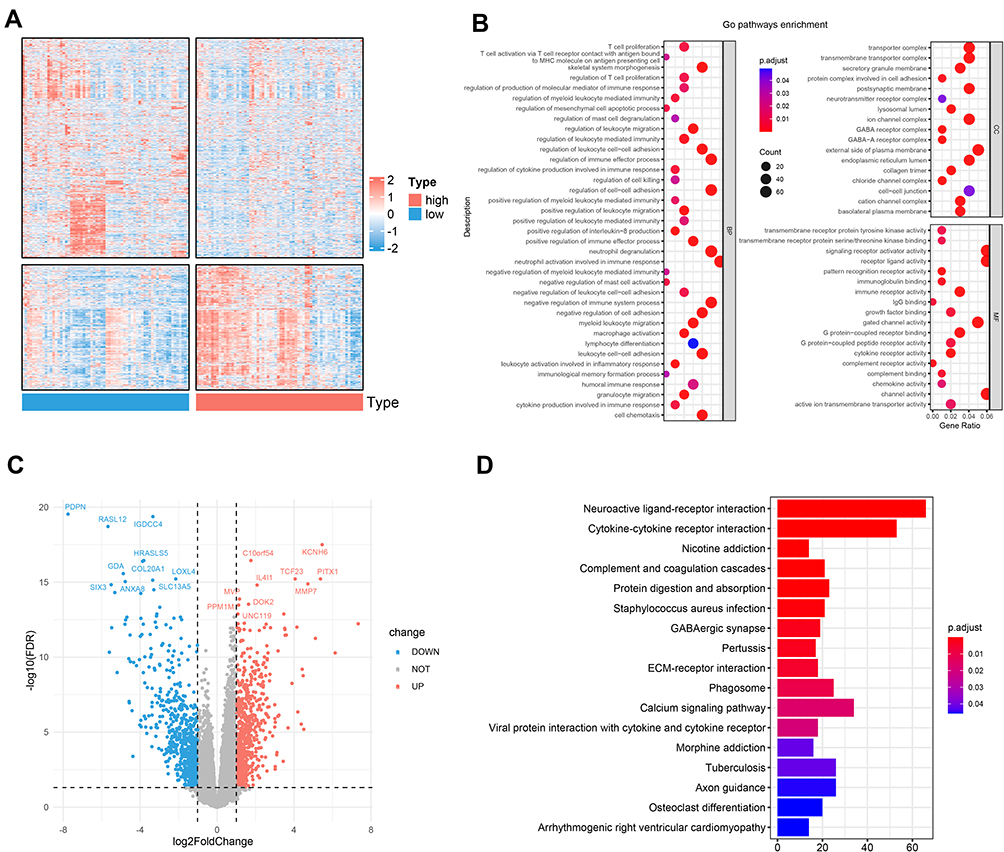 |
Figure 6 Functional enrichment analysis of differentially expressed genes (DEGs) between the high- and the low-risk groups. (A) Heatmap of the DEGs between the two subgroups. (B) Significantly enriched GO terms of the DEGs. (C) Volcano plot of the DEGs between high- and low-risk groups. (D) Significantly enriched KEGG pathways of the DEGs. |
Identification of Differentially Expressed Infiltrating Immune Cells Between High- and Low-Risk Group
As the DEGs between two subgroups of AML patients were apparently concentrated in multiple pathways related to immunity (GO and KEGG analysis), we then explored the association between tumor microenvironment (TME) and our 8-PRG related signature. Firstly, ESTIMATE analysis was used for calculating the estimate scores, immune scores, and stromal scores. And the results implicated there was strong correlation between TME scores and risk scores (Figure 7D–F): Among AML samples, the high-risk group scored much higher compared to those with low risk in the three scores, and there was significantly statistical difference in immune scores and estimate scores (Figure 7A–C).
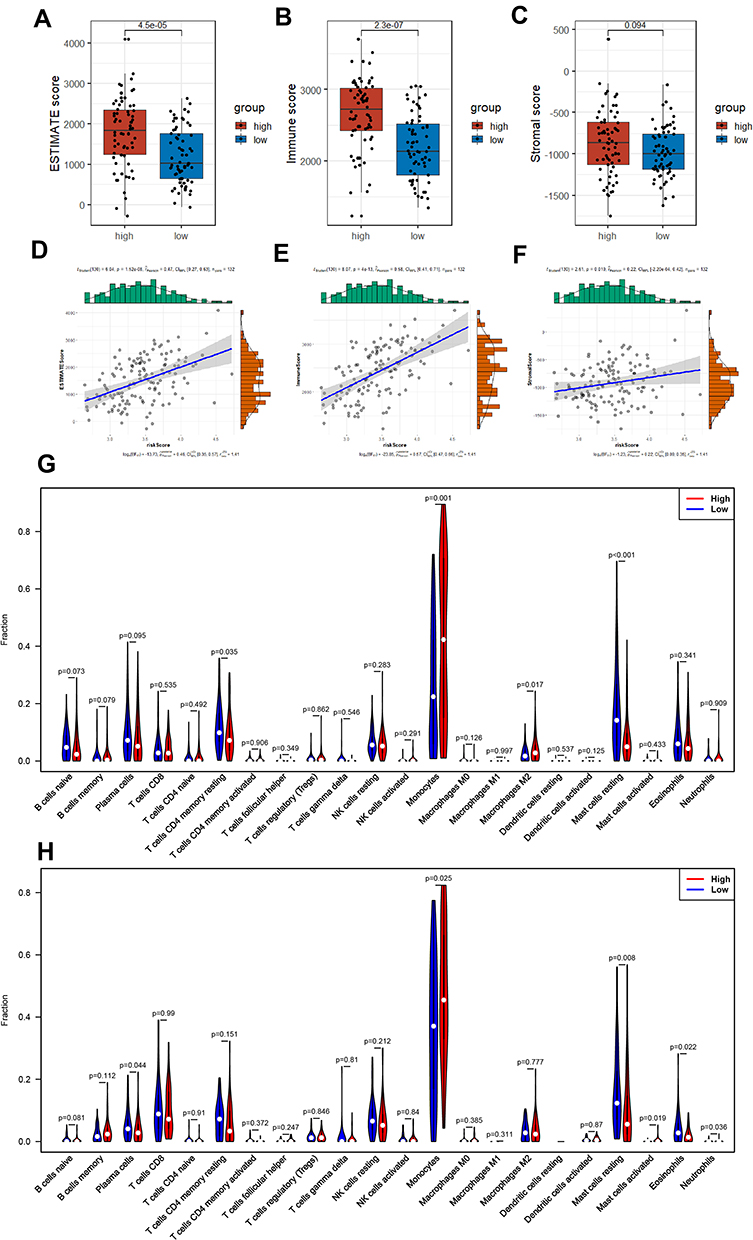 |
Figure 7 AML-immune microenvironment analysis of the high- and low-risk groups. (A–C) Boxplot of the TME scores between low- and high-risk group. (D–F) Verifying the correlation between three scores and risk scores. (G and H) Violin plot showing the difference between AML-infiltrating immune cells. (The blue violin reflects the low-risk group and the red violin represents the high-risk group. (G) TCGA cohort, (H) GEO cohort.). |
Furthermore, we studied the composition of the 22 infiltrating immune cells between high- and low-risk group, respectively in TCGA cohort and GEO cohort. In the two cohorts, only the AML samples qualified with CIBERSORT p<0.05 were chosen. Violin plot, barplot and heatmap were used to show the difference of immune cells’ radio between two subgroups (Figure 7G and H; Figure S2A–D). Both cohorts showed a consistent result that monocytes and resting mast cells rather than other cells accounted for the highest of fraction, while the activated dendritic cells accounted for the lowest proportion. Additionally, eosinophils, plasma cells, resting mast cells, and resting CD4+ memory T cells were activated at high levels in the low-risk group, on the contrary, monocytes, Neutrophils and M2 macrophages were significantly increased in the high-risk samples.
The correlations of the infiltrating immune cells were displayed as Figure 8A and B and their corresponding Pearson coefficients were appeared in Figure S2E and F. Plasma cells was positively related with activated Mast cells, and CD8+ T cells was positively related with resting NK cells; monocytes were negatively correlated with resting CD4+ T memory cells and plasma cells with correlation coefficient < −0.5 in the TCGA cohorts, which reached consistency with the results of the GEO cohort. Moreover, we investigated the relationships between the fraction of immune cells and AML patients’ OS. In the TCGA cohort, high percentages of resting Mast cells and activated Mast cells were correlated with the higher survival rate (Figure 8C and D). But in GEO cohort, we only found high fraction of plasma cells may indicate a better prognosis (Figure 8E).
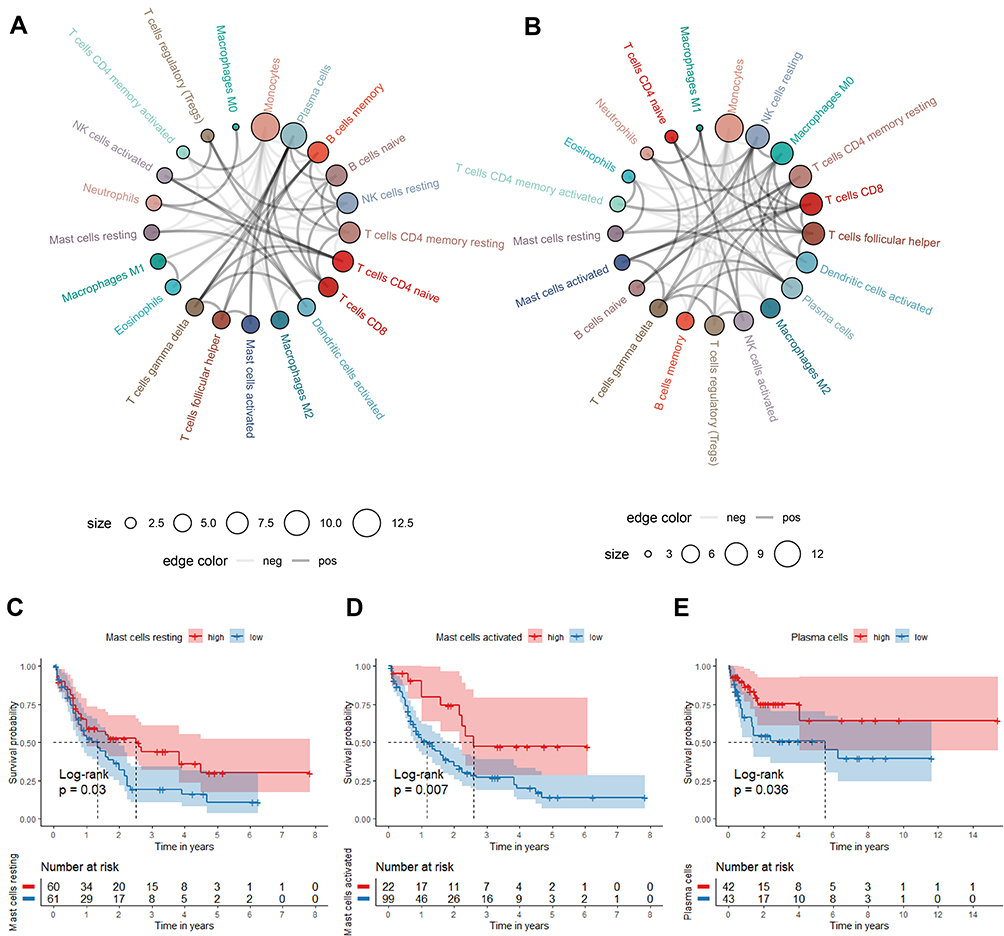 |
Figure 8 The correlation and prognostic value of the infiltrating immune cells in TCGA and GEO cohorts. (A and B) Circle plot for showing the Pearson correlation of the immune cells (only the correlation coefficient>0.15 was remained. The gray and black line represents the positive and negative correlation, respectively. The larger size of the point, the more correlation with other immune cells). (C–E) Survival curve of immune cells stratified by fraction ((C and D) in TCGA cohort, (E) in GEO cohort). |
Discussion
Recent studies suggested that pyroptosis which may influence tumorigenesis and tumor progression has become an emerging topic in oncology research. Pyroptosis may act as a tumor suppressor.24 But in some instances, inflammatory mediators produced during pyroptosis may promote tumorigenesis and may be associated with tumor drug resistance.25 Overall, it is proposed that pyroptosis may act as dual role in tumor pathogenesis. The introduction of pyroptosis may also be an effective way to re-challenge anti-apoptotic cancers.
Previous studies have identified novel models for PRGs to predicting prognosis in several tumors.15 However, how pyroptosis is associated with AML remains unknown. Investigating the expression pattern of PRGs is essential to understand the performance of pyroptosis process in AML. Thus, in our study, PRGs’ impact on the prognosis of AML patients was systematically evaluated. We elucidated the expression of PRGs and surprisingly found that 30 of 33 PRGs were differentially expressed between AML and normal tissues. Next, we applied univariate Cox regression analysis and LASSO algorithm to evaluate the expression levels of PRGs in the TCGA dataset and constructed a prognostic model based on eight prognostic PRGs (PYCARD, GPX4, CASP1, ELANE, CASP9, AIM2, CASP6, and CASP3), which could predict AML patients’ OS with medium to high accuracy. This model was validated in an external cohort. In addition, a nomogram that shows good calibration and differentiation had been developed for accurate clinical determination of five-year survival prognosis in AML.
Few of nodes involved in our prognostic model have been reported to be associated with the progression of AML through modulation pyroptosis.26 For example, in the Cancer Genome Atlas,27,28 the highest median expression level of caspase-1 mRNA was found in primary AML rather than any other cancer, which is correlated with poor prognoses of primary AML. However, the roles of OS-related PRGs, such as PYCARD, GPX4, ELANE, CASP9, AIM2, CASP6, and CASP3, in the regulation of AML have not been elucidated. GPX4, one of the glutathione peroxidases (GPXs), is capable of reducing phospholipid hydroperoxides in cell membranes, keeping cells away from damage by oxidation, meanwhile, it attributes a lot to maintain redox homeostasis for survival and function of cells.29 Noteworthy, some studies have evidenced that programmed cell death could be modulated by lipid peroxidation.30,31 One study showed that GPX4 has the ability to reduce lipid peroxidation, negatively regulate macrophage pyroptosis and sepsis lethality in mice.32 The results of other researches also showed that GPX4 presents in ferroptotic cancer cell death as a key mediator and is particularly sensitive in diffuse large B-cell lymphoma as well as renal cell carcinoma.33,34 In AML, the newly developed drug APR-246 promotes cell death in vivo and in vitro through genetic inactivation of GPX4-induced ferroptosis.35 However, the accurate mechanism of molecule through which pyroptosis driven by GSDMD is accelerated by lipid peroxidation still poorly understood.36 In our study, we found that GPX4 is one of the prognostic biomarkers associated with focal ptosis in AML, and low expression of GPx4 appears to be associated with a better survival prognosis.
Caspase-1, caspase-3, caspase-6 and caspase-9 belong to the family of cysteine proteases, which can mediate apoptosis and pyroptosis of regulated cells. Active caspase-1 is in charge of GSDMD-driven pyroptosis through caspase-1-GSDMD pathway.37 Reports have demonstrated that upregulated expression of caspase-1 is upregulated along with AML patients who had poor prognosis,38 which is consistent with our observations. ASC is a bipartite protein composed of a pyrin domain (PYD) and a caspase recruitment domain (CARD), also called PYDCARD.39 Absent in melanoma 2 (AIM2) has been reported to be mediated by ASC.39 The connexin activates CASP-1, which accelerates IL-1β and IL-8 maturating and releasing in order to promotes pyrolysis. In this study, PYDCARD, AIM2, CASP-1 and CASP-9 were upregulated along with high-risk group, which was relevant to poor prognosis. Moreover, the interaction mechanism of each molecule has not been clarified.
Caspase-3 plays an essential role in either apoptosis or pyroptosis. Studies showed that in cancer, apoptosis can change into pyroptosis through the caspase-3/GSDME signal pathway.40 This study found that CASP-3 was low expressed in AML in the high-risk group, with low expression portending a poor prognosis, which indicates that CASP-3 may emerge as a tumor suppressor gene in AML. GSDMD cleavage mediated by neutrophil-specific serine protease, neutrophil elastase (ELANE) is located on the side of caspase, by which an activated NT fragment driven by ELANE (GSDMD-eNT) is produced, is which working as efficiently as caspase GSDMD-cNT in inducing cell death and lysing cells. ELANE is generated in cytoplasmic granules and is delivered into the cytoplasm in senescent neutrophils. However, ELANE is only expressed in neutrophils and not in mononuclear macrophages.41–43In this study, the low expression of ELANE is associated with poor OS, which may be due to the suppression of neutrophils in AML, further showing that ELANE may exist as a cancer suppressor gene in AML.
To further investigate the whether PRGs-mediated mechanism is different in patients with AML, we used the GO as well as KEGG enrichment analysis on low- and high-risk groups. Unexpectedly, we found that most PRGs were enriched in biological processes and pathways which are related to immunity. It can be presumed that cancer immunization is closely implicated in pyroptosis process. Since pyroptosis-induced inflammation could trigger robust antitumor immunity,44 we next investigated the relationship between pyroptosis and the immune microenvironment, finding that the risk scores calculated from the our 8-PRG model were positively correlated with the TME scores and that there were significant differences between high- and low-risk subgroups in ESTIMATE scores and immune scores. Therefore, to further explore their relationship, we continued to analyze the association between infiltrated status of immune cells and 8-PRG signature.
Our observations suggested that a strong positive correlation was shown between the high-risk group and high percentage of infiltration of monocytes, Neutrophils and M2 macrophages. Meanwhile, levels of the plasma cells, resting CD4+ memory T cells, eosinophils and resting mast cells were significantly increased in patients among the low-risk group.
A recent study has recently evidenced that M2 macrophages could facilitate tumor growth by inducing immune suppression,45 and higher M2 macrophages predicted the worse survival status of patients.46 In TCGA cohort, high-risk group had significantly more M2 macrophages than low-risk group (p<0.05). AML patients with high percentage of M2 macrophages were associated with poor prognosis, but no significant difference was found compared them to low (p=0.151). Monocytes which had been considered as the reservoir for renewal of tissue macrophages,47 preferentially differentiated into immunosuppressive tumor- associated macrophages,48 and that would suppress the anti-tumor immune response. In our study, it was surprisingly to found that the monocytes’ ratio was the highest of all cell types with a higher percentage in high-risk group compared to the low-risk group. During pyroptosis, the release of IL-18 and IL-1β in the form of exosomes could recruit and activate mast cells, which induced inflammation and cell damage,49 but the mechanism had not been elucidated in AML. However, we found that the fraction of mast cells had a strong positive relevance to low-risk group while the high-risk group showed contrary, and the patients with a high proportion of mast cells had a better prognosis (p<0.05). Finally, by exploring immune cells and survival prognosis of AML patients, we found that high expression of activated and resting mast cells in the TCGA cohort may be associated with patients’ good prognosis, but in the GEO cohort high expression of plasma cells was found to lead to a good prognosis. Therefore, we would further explore the clinical relevance of immune cell types and their relationship with prognosis.
Yet, there are some limitations in this study. First, the sample numbers of M6 and M7 in FAB staging in the TCGA cohort is too small, for which the nomogram were constructed may lead to little error in the indicator of FAB classification, so we should use more independent AML datasets in the future to improve the accuracy of prognostic model. Second, vitro and vivo experimentation is needed to prove the results. Therefore, we need further studies to inspect the mechanisms underlying the PRGs identified in AML.
In conclusion, we identified 30 PRGs differently expressed in AML and normal samples, and developed an 8-PRG prognostic model for predicting the OS of AML patients, which was also validated by a GEO cohort. The results of multivariate cox analysis demonstrated the model can be treat as an independent prognostic factor, and a nomogram was thus constructed. In the end, we characterized pyroptosis might relate with AML immune microenvironment.
Data Sharing Statement
The data can be downloaded from: https://portal.gdc.cancer.gov/, https://xenabrowser.net/, and https://www.ncbi.nlm.nih.gov/geo/; GSE71014.
Ethical Approval
The study was reviewed by the Medical Ethics Committee of Southern Medical University Nanfang Hospital, and confirmed the research range as part of “can be exempted from medical ethical review on” the article 3: for always archived data file records pathological specimens or diagnostic specimen collection or research, and these resources are public resources, or in the way they were unable to contact (directly or through identifier) records the information. Therefore, the application for exemption from Medical ethics review of this study was approved.
Acknowledgments
Songyang Liu and Dongmei Luo contributed equally to the work as co-first authors.
Funding
This work was supported by the National Natural Science Foundation of China (No. 81700104) and Natural Science Foundation of Guangdong, China (No. 2019A043135067).
Disclosure
The authors declare no conflicts of interest for this work..
References
1. Short NJ, Rytting ME, Cortes JE. Acute myeloid leukaemia. Lancet. 2018;392:593–606. doi:10.1016/S0140-6736(18)31041-9
2. Cancer stat facts: leukemia—acute myeloid leukemia (AML). Available from: https://seer.cancer.gov/statfacts/html/amyl.html.
3. Dohner H, Estey EH, Amadori S, et al. Diagnosis and management of acute myeloid leukemia in adults: recommendations from an international expert panel, on behalf of the European LeukemiaNet. Blood. 2010;115:453–474. doi:10.1182/blood-2009-07-235358
4. Tamamyan G, Kadia T, Ravandi F, et al. Frontline treatment of acute myeloid leukemia in adults. Crit Rev Oncol Hematol. 2017;110:20–34. doi:10.1016/j.critrevonc.2016.12.004
5. Zychlinsky A, Prevost MC, Sansonetti PJ. Shigella flexneri induces apoptosis in infected macrophages. Nature. 1992;358:167–169. doi:10.1038/358167a0
6. Wang YY, Liu XL, Zhao R. Induction of pyroptosis and its implications in cancer management. Front Oncol. 2019;9:971. doi:10.3389/fonc.2019.00971
7. Kanneganti TD, Body-Malapel M, Amer A, et al. Critical role for Cryopyrin/Nalp3 in activation of caspase-1 in response to viral infection and double-stranded RNA. J Biol Chem. 2006;281:36560–36568. doi:10.1074/jbc.M607594200
8. Latz E, Xiao TS, Stutz A. Activation and regulation of the inflammasomes. Nat Rev Immunol. 2013;13:397–411. doi:10.1038/nri3452
9. Boucher D, Monteleone M, Coll RC, et al. Caspase-1 self-cleavage is an intrinsic mechanism to terminate inflammasome activity. J Exp Med. 2018;215:827–840. doi:10.1084/jem.20172222
10. Liu X, Zhang Z, Ruan J, et al. Inflammasome-activated gasdermin D causes pyroptosis by forming membrane pores. Nature. 2016;535:153–158. doi:10.1038/nature18629
11. Ji N, Qi Z, Wang Y, et al. Pyroptosis: a new regulating mechanism in cardiovascular disease. J Inflamm Res. 2021;14:2647–2666. doi:10.2147/JIR.S308177
12. Man SM, Karki R, Kanneganti TD. Molecular mechanisms and functions of pyroptosis, inflammatory caspases and inflammasomes in infectious diseases. Immunol Rev. 2017;277:61–75. doi:10.1111/imr.12534
13. Fang Y, Tian S, Pan Y, et al. Pyroptosis: a new frontier in cancer. Biomed Pharmacother. 2020;121:109595. doi:10.1016/j.biopha.2019.109595
14. Chuang MK, Chiu Y-C, Chou W-C, et al. An mRNA expression signature for prognostication in de novo acute myeloid leukemia patients with normal karyotype. Oncotarget. 2015;6:39098–39110. doi:10.18632/oncotarget.5390
15. Ye Y, Dai Q, Qi H. A novel defined pyroptosis-related gene signature for predicting the prognosis of ovarian cancer. Cell Death Discov. 2021;7:71. doi:10.1038/s41420-021-00451-x
16. Ritchie ME, Phipson B, Wu D, et al. limma powers differential expression analyses for RNA-sequencing and microarray studies. Nucleic Acids Res. 2015;43:e47. doi:10.1093/nar/gkv007
17. Szklarczyk D, Gable AL, Lyon D, et al. STRING v11: protein-protein association networks with increased coverage, supporting functional discovery in genome-wide experimental datasets. Nucleic Acids Res. 2019;47:D607–D613. doi:10.1093/nar/gky1131
18. Shannon P, Markiel A, Ozier O, et al. Cytoscape: a software environment for integrated models of biomolecular interaction networks. Genome Res. 2003;13:2498–2504. doi:10.1101/gr.1239303
19. Heagerty PJ, Lumley T, Pepe MS. Time-dependent ROC curves for censored survival data and a diagnostic marker. Biometrics. 2000;56:337–344. doi:10.1111/j.0006-341x.2000.00337.x
20. Robinson MD, McCarthy DJ, Smyth GK. edgeR: a bioconductor package for differential expression analysis of digital gene expression data. Bioinformatics. 2010;26:139–140. doi:10.1093/bioinformatics/btp616
21. Metsalu T, Vilo J. ClustVis: a web tool for visualizing clustering of multivariate data using principal component analysis and heatmap. Nucleic Acids Res. 2015;43:W566–570. doi:10.1093/nar/gkv468
22. Yoshihara K, Shahmoradgoli M, Martínez E, et al. Inferring tumour purity and stromal and immune cell admixture from expression data. Nat Commun. 2013;4:2612. doi:10.1038/ncomms3612
23. Newman AM, Liu CL, Green MR, et al. Robust enumeration of cell subsets from tissue expression profiles. Nat Methods. 2015;12:453–457. doi:10.1038/nmeth.3337
24. Thi HTH, Hong S. Inflammasome as a therapeutic target for cancer prevention and treatment. J Cancer Prev. 2017;22:62–73. doi:10.15430/JCP.2017.22.2.62
25. Xia X, Wang X, Cheng Z, et al. The role of pyroptosis in cancer: pro-cancer or pro-”host”? Cell Death Dis. 2019;10:650. doi:10.1038/s41419-019-1883-8
26. Johnson DC, Taabazuing CY, Okondo MC, et al. DPP8/DPP9 inhibitor-induced pyroptosis for treatment of acute myeloid leukemia. Nat Med. 2018;24:1151–1156. doi:10.1038/s41591-018-0082-y
27. Gao J, Aksoy BA, Dogrusoz U, et al. Integrative analysis of complex cancer genomics and clinical profiles using the cBioPortal. Sci Signal. 2013;6:pl1. doi:10.1126/scisignal.2004088
28. Cerami E, Gao J, Dogrusoz U, et al. The cBio cancer genomics portal: an open platform for exploring multidimensional cancer genomics data. Cancer Discov. 2012;2:401–404. doi:10.1158/2159-8290.CD-12-0095
29. Ayala A, Munoz MF, Arguelles S. Lipid peroxidation: production, metabolism, and signaling mechanisms of malondialdehyde and 4-hydroxy-2-nonenal. Oxid Med Cell Longev. 2014;2014:360438. doi:10.1155/2014/360438
30. Zhu H, Santo A, Jia Z, Robert Li Y. GPx4 in bacterial infection and polymicrobial sepsis: involvement of ferroptosis and pyroptosis. React Oxyg Species (Apex). 2019;7:154–160. doi:10.20455/ros.2019.835
31. Gaschler MM, Stockwell BR. Lipid peroxidation in cell death. Biochem Biophys Res Commun. 2017;482:419–425. doi:10.1016/j.bbrc.2016.10.086
32. Kang R, Zeng L, Zhu S, et al. Lipid peroxidation drives gasdermin D-mediated pyroptosis in lethal polymicrobial sepsis. Cell Host Microbe. 2018;24:97–108 e104. doi:10.1016/j.chom.2018.05.009
33. Imai H, Matsuoka M, Kumagai T, Sakamoto T, Koumura T. Lipid peroxidation-dependent cell death regulated by GPx4 and ferroptosis. Curr Top Microbiol Immunol. 2017;403:143–170. doi:10.1007/82_2016_508
34. Yang WS, SriRamaratnam R, Welsch M, et al. Regulation of ferroptotic cancer cell death by GPX4. Cell. 2014;156:317–331. doi:10.1016/j.cell.2013.12.010
35. Birsen R, Larrue C, Decroocq J, et al. APR-246 induces early cell death by ferroptosis in acute myeloid leukemia. Haematologica. 2021;107:403–416. doi:10.3324/haematol.2020.259531
36. Russo AJ, Rathinam VAK. Lipid peroxidation adds fuel to Pyr(optosis). Cell Host Microbe. 2018;24:8–9. doi:10.1016/j.chom.2018.06.010
37. Shalini S, Dorstyn L, Dawar S, Kumar S. Old, new and emerging functions of caspases. Cell Death Differ. 2015;22:526–539. doi:10.1038/cdd.2014.216
38. Bagger FO, Sasivarevic D, Sohi SH, et al. BloodSpot: a database of gene expression profiles and transcriptional programs for healthy and malignant haematopoiesis. Nucleic Acids Res. 2016;44:D917–924. doi:10.1093/nar/gkv1101
39. Dick MS, Sborgi L, Ruhl S, Hiller S, Broz P. ASC filament formation serves as a signal amplification mechanism for inflammasomes. Nat Commun. 2016;7:11929. doi:10.1038/ncomms11929
40. Wang Y, Gao W, Shi X, et al. Chemotherapy drugs induce pyroptosis through caspase-3 cleavage of a gasdermin. Nature. 2017;547:99–103. doi:10.1038/nature22393
41. Kambara H, Liu F, Zhang X, et al. Gasdermin D exerts anti-inflammatory effects by promoting neutrophil death. Cell Rep. 2018;22:2924–2936. doi:10.1016/j.celrep.2018.02.067
42. Jiang M, Qi L, Li L, Li Y. The caspase-3/GSDME signal pathway as a switch between apoptosis and pyroptosis in cancer. Cell Death Discov. 2020;6:112. doi:10.1038/s41420-020-00349-0
43. Shen X, Wang H, Weng C, Jiang H, Chen J. Caspase 3/GSDME-dependent pyroptosis contributes to chemotherapy drug-induced nephrotoxicity. Cell Death Dis. 2021;12:186. doi:10.1038/s41419-021-03458-5
44. Tang R, Xu J, Zhang B, et al. Ferroptosis, necroptosis, and pyroptosis in anticancer immunity. J Hematol Oncol. 2020;13:110. doi:10.1186/s13045-020-00946-7
45. Mehla K, Singh PK. Metabolic regulation of macrophage polarization in cancer. Trends Cancer. 2019;5:822–834. doi:10.1016/j.trecan.2019.10.007
46. Xu ZJ, Gu Y, Wang C-Z, et al. The M2 macrophage marker CD206: a novel prognostic indicator for acute myeloid leukemia. Oncoimmunology. 2020;9:1683347. doi:10.1080/2162402X.2019.1683347
47. Italiani P, Boraschi D. From monocytes to M1/M2 macrophages: phenotypical vs. functional differentiation. Front Immunol. 2014;5:514. doi:10.3389/fimmu.2014.00514
48. Devalaraja S, To TKJ, Folkert IW, et al. Tumor-derived retinoic acid regulates intratumoral monocyte differentiation to promote immune suppression. Cell. 2020;180:1098–1114 e1016. doi:10.1016/j.cell.2020.02.042
49. Wu Z, Li Y, Liu Q, et al. Pyroptosis engagement and bladder urothelial cell-derived exosomes recruit mast cells and induce barrier dysfunction of bladder urothelium after uropathogenic E. coli infection. Am J Physiol Cell Physiol. 2019;317:C544–C555. doi:10.1152/ajpcell.00102.2019
 © 2022 The Author(s). This work is published and licensed by Dove Medical Press Limited. The full terms of this license are available at https://www.dovepress.com/terms.php and incorporate the Creative Commons Attribution - Non Commercial (unported, v3.0) License.
By accessing the work you hereby accept the Terms. Non-commercial uses of the work are permitted without any further permission from Dove Medical Press Limited, provided the work is properly attributed. For permission for commercial use of this work, please see paragraphs 4.2 and 5 of our Terms.
© 2022 The Author(s). This work is published and licensed by Dove Medical Press Limited. The full terms of this license are available at https://www.dovepress.com/terms.php and incorporate the Creative Commons Attribution - Non Commercial (unported, v3.0) License.
By accessing the work you hereby accept the Terms. Non-commercial uses of the work are permitted without any further permission from Dove Medical Press Limited, provided the work is properly attributed. For permission for commercial use of this work, please see paragraphs 4.2 and 5 of our Terms.