")
Back to Journals » International Journal of General Medicine » Volume 15
Construction of a Prognostic Signature of 10 Autophagy-Related lncRNAs in Gastric Cancer
Authors Wang W, Pei Q, Wang L, Mu T, Feng H
Received 14 December 2021
Accepted for publication 25 February 2022
Published 5 April 2022 Volume 2022:15 Pages 3699—3710
DOI https://doi.org/10.2147/IJGM.S348943
Checked for plagiarism Yes
Review by Single anonymous peer review
Peer reviewer comments 2
Editor who approved publication: Dr Scott Fraser
Wenwen Wang,1,2 Qingshan Pei,1 Lifen Wang,1 Tong Mu,1 Hua Feng1
1Department of Gastroenterology, Shandong Provincial Hospital Affiliated to Shandong First Medical University, Jinan, Shandong, People’s Republic of China; 2Shandong Provincial Engineering and Technological Research Center for Liver Diseases Prevention and Control, Shandong Provincial Hospital Affiliated to Shandong First Medical University, Jinan, Shandong, People’s Republic of China
Correspondence: Hua Feng, Department of Gastroenterology, Shandong Provincial Hospital Affiliated to Shandong First Medical University, 324 Jing 5 Road, Jinan, Shandong, 250021, People’s Republic of China, Tel +86 531-68773293, Fax +86 531-87906348, Email [email protected]
Background: Autophagy plays a double-edged sword role in cancers. LncRNAs could regulate cancer initiation and development at various levels. However, the role of autophagy-related lncRNAs (ARlncs) in gastric cancer (GC) remains indistinct.
Methods: GC gene expression profile and clinical data were acquired from the Cancer Genome Atlas (TCGA). The prognostic signature composed of ARlncs was established via cox regression analysis. Kaplan–Meier (K-M) survival curve was adopted to show overall survival (OS). Independence and reliability of risk signature were visualized by cox regression analysis and ROC curve. A nomogram was constructed and the reliability was analyzed by ROC curve. Immune infiltrating cells and check points were also analyzed.
Results: A prognostic signature was constructed which stratified GC patients into high- and low-risk groups according to risk score calculated via the 10 ARlncs including LINC01094, AC068790.7, AC090772.1, AC005165.1, PVT1, LINC00106, AC026368.1, AC090912.3, AC013652.1, UICLM. Patients in high-risk group showed a poor prognosis (p< 0.001). Cox regression analysis showed signature was an independent prognostic factor (p< 0.001). Areas under curves (AUC) of ROC for risk signature for predicting OS outweighed age, gender, grade, T, M and N, which suggested the reliability of the signature. A nomogram was constructed with risk signature, T, M, N and age and its AUC of ROC for 1-, 3-, and 5-year was 0.700, 0.730, 0.757 respectively, which showed good reliability. Macrophage M2, T cell CD8+ and T cell CD4+ memory resting had greatest difference between the two risk groups according to CIBERSORE-ABS algorithm (p< 0.001). CD274 (PD-L1), PDCD1 (PD-1) and PDCD1LG2 (PD-L2) were expressed higher in the high-risk group (p< 0.05), which implied that immunotherapy may be a good choice for these patients.
Conclusion: The risk signature based on 10 ARlncs can serve as an efficacious prognostic predictor and guide the immunotherapies and precise treatment for GC patients.
Keywords: gastric cancer, autophagy, TCGA, prognostic signature, immunotherapy
Introduction
Gastric cancer (GC) is the fifth most common cancer and fourth fatal cancer globally with over one million new cases and an estimated 769,000 deaths (equating to one in every 13 deaths globally) in 2020. It is notable that the incidence of stomach cancer (cardia and noncardia gastric cancers combined) among young adults (aged <50 years) has increased in recent years.1 With the development of gene-sequencing, the promises of early detection and molecularly precise diagnosis for many cancers have been possible, which could allow patients to accept targeted, personalized treatment with better outcomes.2 As TCGA is a database based on gene sequencing, the prognostic signature based on TCGA may provide proof for precise treatment of patients. Up to now, large amounts of prognostic signatures for GC have been developed, including competing endogenous RNA (ceRNA)-based prognostic biomarkers,3 Long non-coding RNAs (lncRNAs)-based risk signature,4 immune prognostic signature5 and others. However, autophagy-related lncRNAs (ARlncs)-based prognostic signature has not been studied.
Autophagy is an evolutionarily conserved, normal physiological catabolic degradation process in cells which occurs in response to different forms of stress, for example, nutrient deprivation, growth factor depletion, infection and hypoxia.6 Dysregulated autophagy has implications in health, leading to human diseases, such as cancer.7 In gastric carcinoma, autophagy plays a dual role, including a tumor-suppressor role and a tumor-promoter role.8 As to the chemoresistance of GC, autophagy can contribute to the formation of chemoresistance9 and meanwhile, it can reverse chemoresistance by promoting apoptosis and/or inhibiting epithelial–mesenchymal transition (EMT).10 These may because multiple proteins and/or noncoding RNAs (ncRNAs) that regulated autophagy play various roles in gastric cancer. Therefore, modulating autophagy for cancer treatment is an interesting therapeutic approach currently under intense investigation.11 A series of genes, which are named autophagy-related genes (ARGs) are involved in the process, such as ULK1 complexes, PIK3C3, Beclin 1 and others12 and a number of noncoding RNAs including lncRNAs, miroRNAs (miRNAs) are also responsible for regulating the process of autophagy. LncRNAs are RNA transcripts longer than 200 nucleotides which are not code for proteins.13 They participate in almost all cellular processes, including regulation of transcription, translation, protein modification, the formation of RNA-protein or protein-protein complexes and signaling pathways.14 Their regulatory functions in pathological and physiological conditions, especially in tumorigenesis and development have received widespread attention. A number of lncRNAs have been identified to be abnormally expressed in gastric cancer and some of them have been found to regulate proliferation, migration, invasion, and metastasis of gastric cancer cells.15 Recent studies have proved that autophagy-related lncRNAs also play important roles in various cancers via different mechanisms.16–20 Therefore, the functions of ARlncs in GC need further study.
In our study, autophagy-related lncRNAs were screened to construct a prognostic signature to stratify GC patients into low- and high-risk groups. A nomogram was constructed with risk signature and clinical features. Signaling pathways enrichment, Kaplan-Meier survival, relevance between prognostic signature and clinicopathological parameters, immune cells infiltration, immune function, immune checkpoint were also analyzed. The results will help clinicians predict survival and formulate individualized and precise treatments for gastric cancer patients.
Materials and Methods
Datasets
The RNA sequencing profiles with clinical information were downloaded from The Cancer Genome Atlas (TCGA) (https://portal.gdc.cancer.gov/). The cohort contains 375 tumor tissues and 32 normal tissues. And GC patients with clinical information were enrolled for later study (Table S1). The perl language was adopted to transform gene names from Ensemble IDs to a profile of gene symbols. Autophagy-related genes (ARGs) were downloaded from HAD (Human Autophagy Database) (http://www.autophagy.lu/index.html). There were 232 ARGs acquired from the database in total. The Infiltration Estimation of immune cells for all TCGA tumors was downloaded from TIMER2.0 (http://timer.comp-genomics.org/). TCGA data are freely accessible and all above data acquired were fully complied with the access principles of the database. The present study was approved by the Biomedical Research Ethic Committee of Shandong Provincial Hospital (SWYX: NO. 2021-527).
Identification of Differentially Expressed lncRNAs (DElncs) in the TCGA Datasets
Based on the 232 ARGs sets obtained from HAD, we extracted 210 ARGs from the GC TCGA database and got 1215 ARlncs expression matrix on the base of co-expression analysis with corFilter=0.4 and p<0.001. Then the differentially expressed genes (DEGs) and lncRNAs between normal (n=32) and tumor (n=375) were obtained through R package to perform gene ontology (GO) and KEGG pathway enrichment analysis. The threshold value was set as |log fold change (FC)| >1 and fdr < 0.05.
Signature Development and Correlations with Clinicopathological Characteristics
Univariate cox regression analysis was performed on the candidate ARlncs through survival package of R to filtrate lncRNAs with significant prognostic value (P < 0.001). Then the prognostic signature was established based on the multivariable cox regression analysis. Ten ARlncs were extracted from TCGA database to stratify GC patients into low- and high-risk groups based on different risk score of each patient in order to construct the prognostic signature ultimately. The following formula was employed to calculate the risk score for each patient: ƸCoef ARlncs × Exp ARlncs. Exp ARlncs means the expression of ARlncs. The Kaplan–Meier survival curve was visualized by the R package to verify the predictive ability of the risk score. Whether the risk score was an independent prognostic indicator was examined by univariate and multivariate cox regression analysis. The areas under the receiver operating characteristic (ROC) curve (AUCs) for 1-year, 3-year, 5-year for the prognostic signature were calculated. Chi square test was conducted to investigate whether relevant clinicopathological characteristics were associated with risk signature in GC. The Gene set enrichment analysis (GSEA) was implemented to survey the diverse signaling pathways of the different risk groups using GSEA (version 4.1.0) software. The co-expression network of genes and lncRNAs was established via Cytoscape.
Construction of Nomogram
A nomogram that included T, M, N, age and risk score was established to visualize the specific method and showed the ability to predict overall survival (OS) at 1- year, 3-year and 5-year. In addition, the corresponding calibration curve of the nomogram to value its predictive power was implemented.
Results
Identification of ARlncs in GC
There were 19,573 mRNAs and 14,056 lncRNAs extracted from GC TCGA database in total. Based on the 232 ARGs obtained from HAD, we screened 210 ARGs in GC and 1215 ARlncs according to the co-expression analysis further with corFilter > 0.4 and p < 0.001 (Table S2). Among them, a total of 451 differently expressed lncRNAs (DElncRNAs) were recognized via |log FC > 1| and FDR < 0.05 compared to the normal tissue. The procedure was showed in Figure 1.
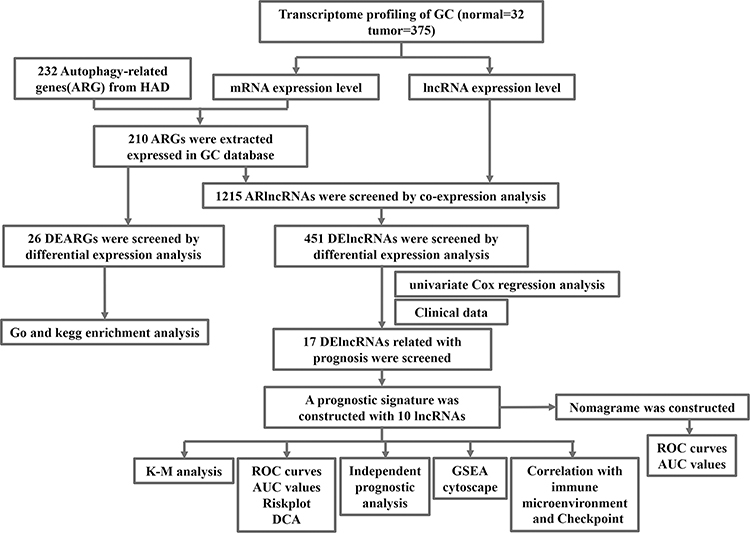 |
Figure 1 Flowchart of the analysis. |
Construction of Autophagy-Related lncRNA Prognostic Signature
Based on the differently expressed ARlncs, there were 17 ARlncs with prognosis value preliminary screened via univariate cox regression analysis with p<0.05 (Figure 2A). Among them, 10 ARlncs were filtered to construct a prognostic lncRNAs signature based on multivariable cox regression analysis. The risk score for predicting OS was calculated as follows: risk score = [LINC01094 × (0.4371)] + [AC068790.7 × (0.4167)] + [AC090772.1 × (0.7607)] + [AC005165.1 × (0.1492)] + [PVT1 × (−0.0881)] + [LINC00106 × (−0.2345)] + [AC026368.1 × (0.0583)] + [AC090912.3 × (0.2048)] + [AC013652.1 × (0.5587)] + [UICLM × (−0.3886)] (Table 1). Patients were divided into high-risk group (n = 185) and low-risk group (n = 186) on the basis of the optimal risk score cutoff value. The distributions of risk scores and survival status are shown in Figure 2B and C. The changing trends of expression levels of the 10 ARlncs as determined via heatmapping were consistent with their risk coefficient in the prognostic signature (Figure 2D). Kaplan–Meier curves suggested that patients in the low-risk group had a better OS than those in the high-risk group with p<0.001 (Figure 2E). In order to validate the reliability of the prognostic signature, the AUC of each ROC for each clinical characteristic and risk score were calculated. The AUC of the risk score for predicting 1, 3, and 5-year survival of GC was 0.707, 0.689, and 0.707, respectively (Figure 2F) and the AUC of the risk score outweighed age with 0.589, gender with 0.546, grade with 0.567, T with 0.564, M with 0.539 and N with 0.579 (Figure 2G). Decision Curve Analysis (DCA) showed that the distance between risk curve and all curve was the largest, suggesting that risk score was the best index to evaluate the prognosis (Figure 2H).
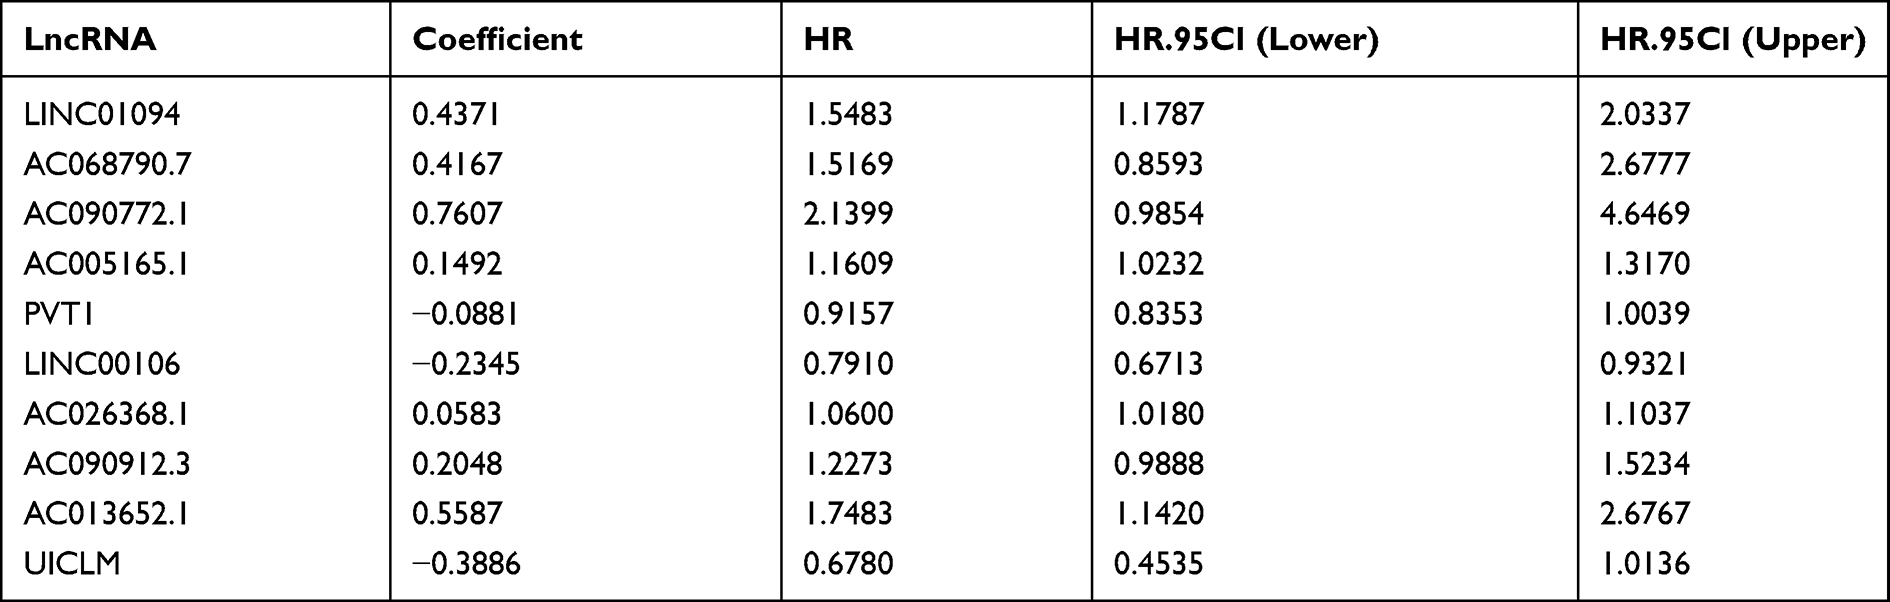 |
Table 1 Construction of Prognostic lncRNAs Signature Based on 10 ARlncs |
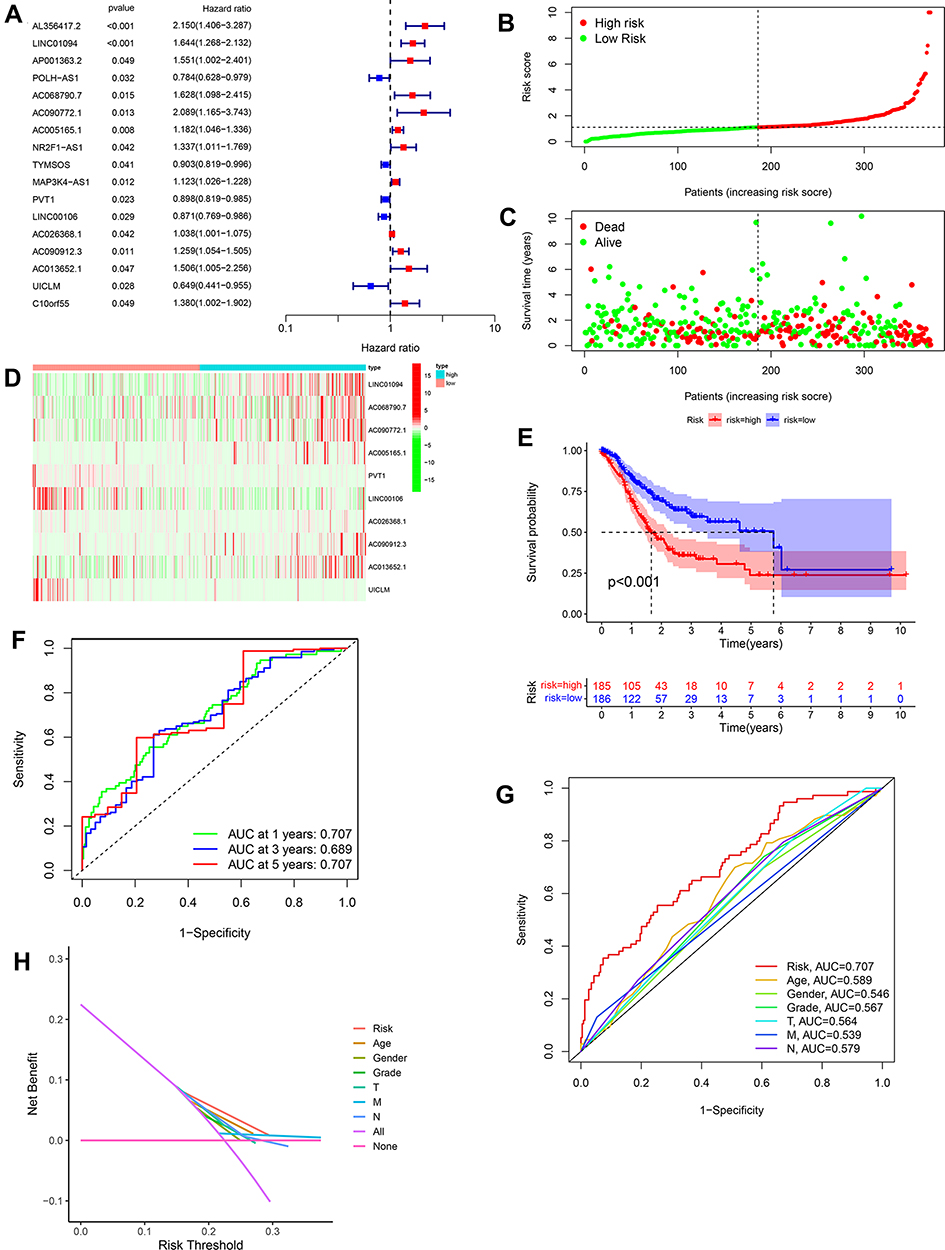 |
Figure 2 Construction of prognostic signature. (A) 17 ARlncs with prognosis value were preliminary screened via univariate cox regression analysis. (B and C) The distributions of risk scores and survival status of patients showed that with the increase of risk score, the number of death increased. (D) The heatmapping of different expression levels of the 10 ARlncs between the high- and low-risk groups. (E) Kaplan–Meier (K–M) analysis of patients in the high- and low-risk groups which displayed patients in the high-risk group had a poor prognosis compared to the low-risk group (p<0.001). (F) Verification of the prognostic value of the ARlncs signature by ROC analysis for 1-, 3-, 5-year. (G) The prognostic value of the ARlncs signature and other index, such as age, gender, grade, stage, T, M and N and ARlncs signature showed a good reliability. (H) Decision Curve Analysis (DCA) to identify the reliability of ARlncs signature. |
Validation of the Independent Prognostic Ability of the Prognostic Signature and Construction of the Predictive Nomogram with Risk Score
The univariate cox regression analysis was conducted which exhibited that age, T, M, N and risk score processed the prognostic value with p<0.05 (Figure 3A). The multivariate cox regression analysis was implemented on the basis of the former results which showed that age, M, N and risk score had the ability to be an independent prognostic factor with p<0.05 (Figure 3B). The relevance between risk score and clinical features was also assessed which displayed that T and grade were variable between low and high-risk groups (Figure 3C). A nomogram was then constructed for OS predication which consist of risk score and clinical features including T, M, N and age. It could be visualized to predict the survival probability of 1-, 3-, and 5-year (Figure 3D). In order to validate the reliability of the nomogram, the AUC of each ROC for 1-, 3-, and 5-year was calculated and the results were 0.700, 0.730, 0.757, respectively (Figure 3E). The calibration curve was also calculated which showed good accuracy of nomogram for prediction (Figure 3F).
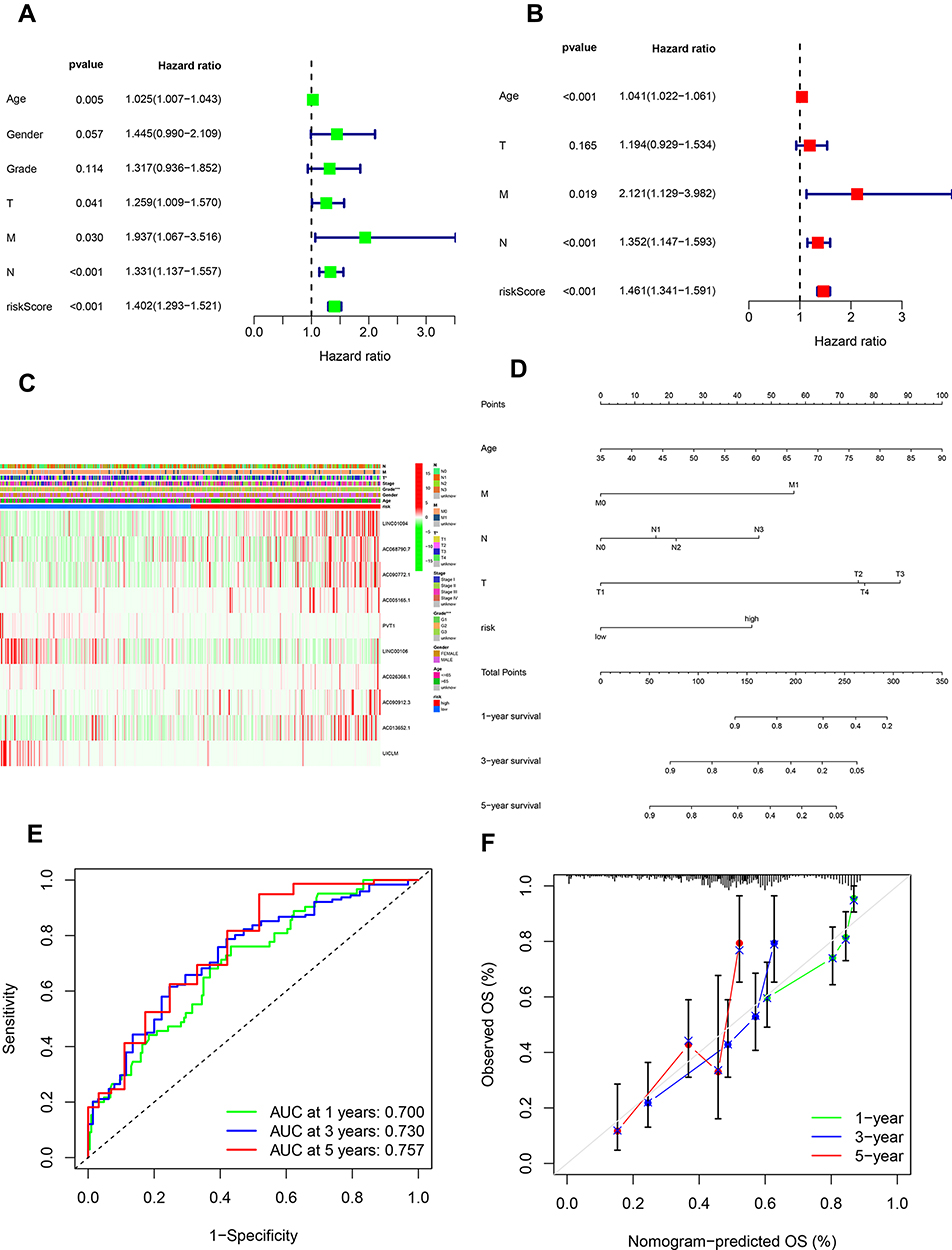 |
Figure 3 Validation of the prognostic signature and construction of the Nomogram. (A) Univariate cox regression analysis exhibited that age, T, M, N and risk score processed the prognostic value (p<0.05). (B) The multivariate cox regression analysis showed that age, M, N and risk score had the ability to be an independent prognostic factor (p<0.05). (C) Relevance between risk score and clinical features. (D) A nomogram consisted of risk score and clinical features including T, M, N and age was constructed. (E) The AUC of each ROC for 1-, 3-, and 5-year to validate the reliability of the nomogram. (F) Calibration curve for the predictive accuracy of the nomogram. |
Enrichment Analysis of DEGs, Gene Set Enrichment Analysis (GSEA) and Co-Expression Network
Based on the difference analysis, 26 genes were found differently expressed between normal and tumor tissue. Go and KEGG enrichment analysis were conducted with DEGs. As to biological process, the DEGs significantly enriched in cell growth, positive regulation of intracellular protein transport and neuron death. For cellular component, the DEGs significantly enriched in vacuolar membrane, mitochondrial outer membrane and organelle outer membrane. About molecular function, the DEGs significantly enriched in protein kinase regulator activity, kinase regulator activity, ubiquitin protein ligase binding and ubiquitin-like protein ligase binding (Figure 4A). In KEGG enrichment analysis, the DEGs significantly enriched in platinum drug resistance, apoptosis, ErbB signaling pathway and p53 signaling pathway. It also showed that the DEGs were related to several viral diseases and cancers which suggested it may play a significant role in the immune (Figure 4B). Further functional annotation was conducted through GSEA, and the results showed differences in biological functions between the high-risk and low-risk groups. GSEA analysis results showed that dilated cardiomyopathy, arrhythmogenic right ventricular, ECM receptor interaction, hypertrophic cardiomyopathy and focal adhesion (Figure 5A–E) were enriched in the high-risk group. And the base excision repair, spliceosome, glyoxylate and dicarboxylate metabolism, oxidative phosphorylation and DNA replication (Figure 5F–J) were enriched in the low-risk group.
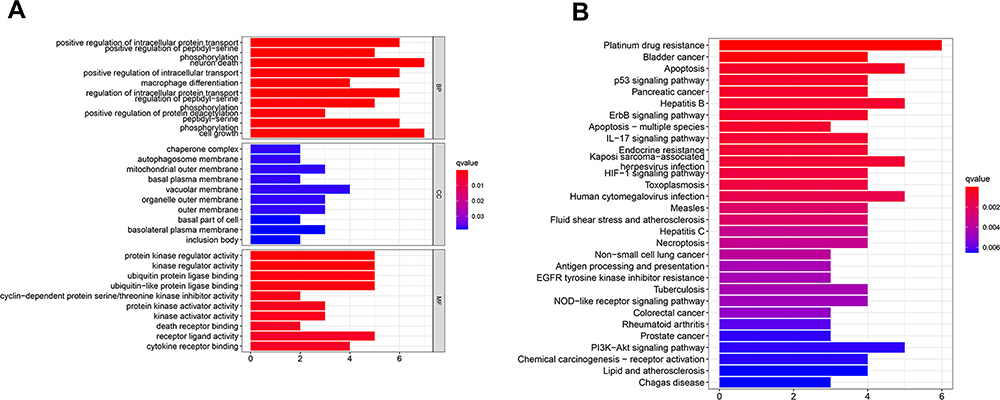 |
Figure 4 Go (A) and KEGG (B) enrichment analysis of DEGs. |
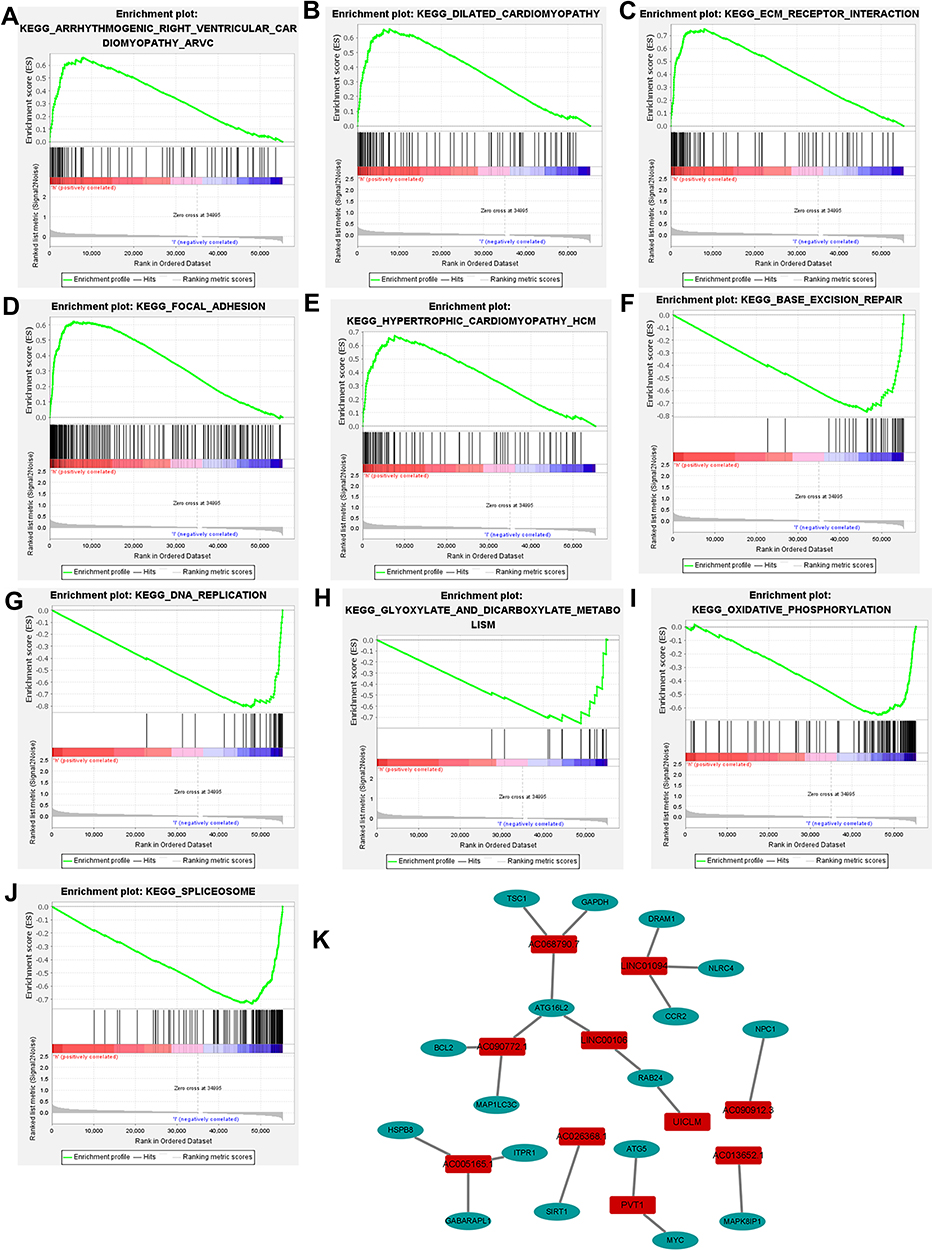 |
Figure 5 Distinct pathways enriched in the high-risk and low-risk groups and co-expression network of ARlncs. (A–E) Pathways enriched in the high-risk group. (F–J) Pathways enriched in the low-risk group. (K) Co-expression network of ARlncs. |
As to co-expression network, in order to present the connections and mechanisms linking prognosis-related ARlncs and related mRNAs better, the Cytoscape was used to visualize the results (Figure 5K).
Immune Microenvironment, Immune Function and Checkpoint
The difference of Stromal Score, Immune Score, microenvironment score and relative infiltration abundance of immune cells of the two risk groups were estimated based on the 7 algorithms such as TIMER, CIBERSORT, CIBERSORE-ABS, QUANTISEQ, MCPCOUNTER, XCELL and EPIC (Table S3). The results suggested that there were large amounts of microenvironment cells which had significant differences between the low- and high-risk group and most of them were enriched in high-risk group. According to the CIBERSORE-ABS algorithm, Macrophage M2, T cell CD8+ and T cell CD4+ memory resting were the types of cells with greatest difference between the two risk groups (Figure 6A). As to immune function, basically all the functions including APC co-inhibition, APC co-stimulation, CCR, checkpoint, cytolytic activity, HLA, inflammation promoting, parainflammation, T cell co-inhibition, T cell co-stimulation, Type-I IFN response and Type-II IFN response were enhanced in high-risk group except MHC-class I with no significant difference (Figure 6B). Given the importance of immune checkpoints in cancer treatment, the expression of checkpoint genes was compared between the two risk groups. We found TNFRSF25 had higher expressions in the low-risk group. Others including CD274 (PD-L1), PDCD1 (PD-1) and PDCD1LG2 (PD-L2) were expressed higher in the high-risk group (Figure 6C).
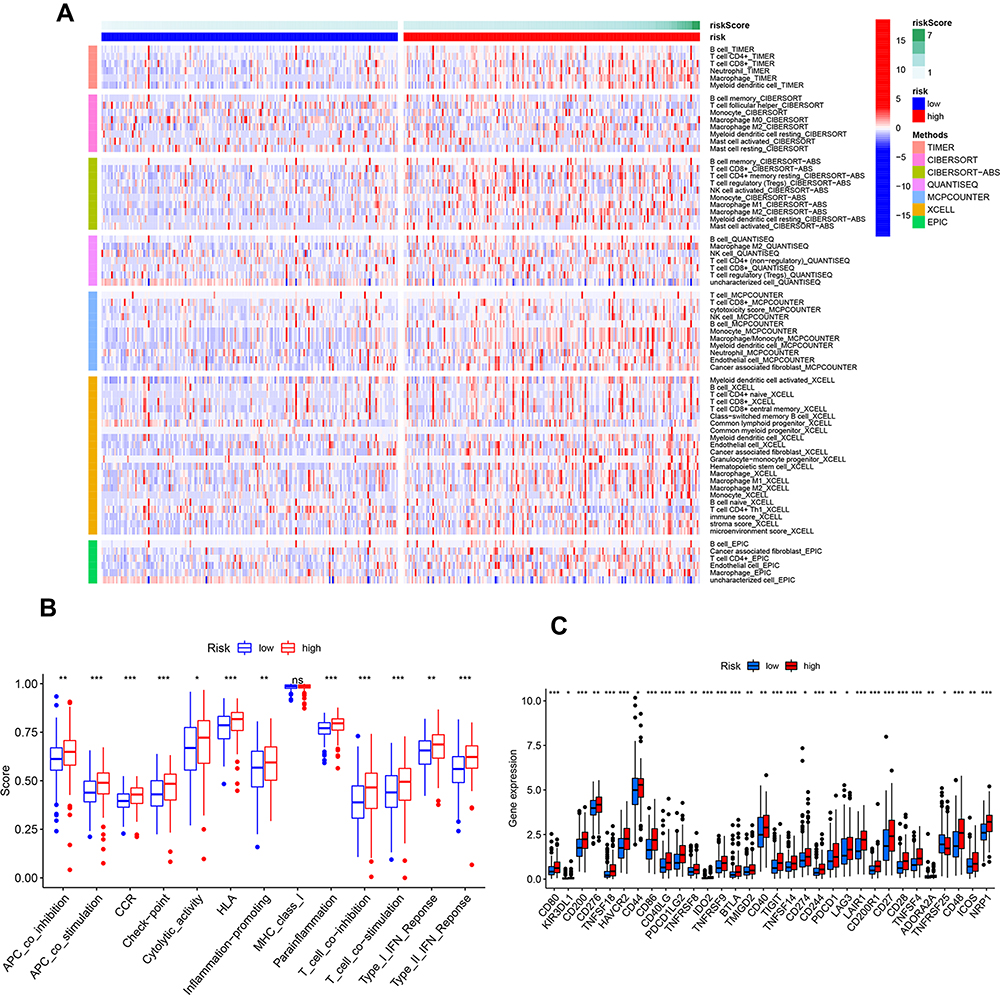 |
Figure 6 Immune microenvironment, immune functions and checkpoint genes in low- and high-risk group. (A) Heatmap of immune microenvironment revealed the immune cells and stromal score had significant differences between the two risk groups. (B) Differences of immune functions between the two risk groups. (C) Expression of immune checkpoint genes between high- and low-risk group. CD274 (PD-L1), PDCD1 (PD-1) and PDCD1LG2 (PD-L2) were expressed higher in the high-risk group. *p < 0.05, **p < 0.01, ***p < 0.001. |
Discussion
GC is the common malignant tumor with great risks to human health. Even though plenty of new methods and drugs for diagnosis and treatments have emerged in recent years, prognosis of GC was still unsatisfactory. Therefore, individualized and precise diagnosis and treatments are desperately needed for GC patients.
Mounting evidences have indicated that lncRNAs as regulatory molecules in gene expression were directly implicated in a wide range of functions in the development of various human diseases, especially many types of cancers.21 Studies have found that some lncRNAs were upregulated in GC and have an oncogenic effect by inducing proliferation and migration of GC cells.22 Meanwhile, some of them had tumor‐suppressive role by inhibiting GC cells migration and invasion.23 As a type II programmed cell death, autophagy also plays crucial roles in cancers.24 In GC, it displayed tumor-suppressor and a tumor-promoter roles via related signaling pathways, genes and ncRNAs.25 Importantly, numerous researches have indicated the vital roles of lncRNAs in autophagy-inducing progression or inhibition of GC.25,26 Therefore, constructing a prognosis signature composed with lncRNAs associated with autophagy will be of great practical value.
In our study, 17 ARlncs with prognostic value were extracted by the initial screen via univariate cox regression analysis and 10 of them were filtered to construct a prognostic lncRNAs signature based on multivariable cox regression analysis. The signature stratified patients into low- and high-risk groups via the cutoff value of risk score and patients in different groups displayed different OS, which implicated that the patients in the low-risk group had a longer survival time. According to the univariate and multivariate cox regression analysis, the risk signature was proved to be an independent prognostic factor. A nomogram was established ultimately for predicting 1-, 3-, and 5-year overall survival probabilities in GC patients with good accuracy. The roles of immune cells infiltrating the tumor microenvironment and immune checkpoint genes in GC patients were also investigated. The results highlighted potential therapeutic targets in GC patients.
As to the 10 ARlncs which constructed the prognosis signature, four of them have been proved to play vital roles in multiple cancers. Xu et al found that the expression of LINC01094 was elevated in ovarian cancer (OC) tissues and cell lines and high LINC01094 expression was associated with higher FIGO stage, lymph node metastasis and the shorter overall survival rate in patients with OC.27 In addition, in other cancers, such as glioblastoma, glioma, clear cell renal cell carcinoma, LINC01094 also exhibited the effect of accelerating the cancer development.18,28,29 In our study, the HR of LINC01094 was 1.640 refer to the univariate cox regression analysis, which meant LINC01094 was an effector enhancing the risk of GC. LINC00106 is lowly expressed in Thyroid cancer (TC) specimens, which attenuates migratory and invasive abilities in TC by inhibiting EMT as a tumor suppressor.30 In GC, it also proved to be highly expressed in low-risk group compared to the high-risk group and acted as a negative regulator. PVT1 has been discovered processing oncogenic properties and regulating proliferation and growth of many cancers31 and the upregulation was involved poor prognosis in esophageal adenocarcinoma.32 But in our study, the PVT1 was found to be a low risk factor. Hence it needs further research in the future study. The lncRNA UICLM was significantly up-regulated in cases of colorectal cancer (CRC) with liver metastasis and UICLM expression was associated with poor patient survival.33 But contrary to what was found in CRC, UICLM was discovered to be a negative regulator with higher expression in the low-risk group in GC. At present, there is no relevant study about AC005165.1, AC068790.7, AC090772.1, AC026368.1, AC090912.3, AC013652.1and more in-depth study will be carried out in the future.
Equally important, our research adopted the TIMER database to reveal connections between the risk signature and immune infiltration levels in gastric cancer. The results showed the associations of the risk signature and numerous immune cells. With respect to check point, most related genes were highly expressed in the high-risk group such as PD-L1, PD-1 and PD-L2, which implied that immune therapy seemed to be a good choice for these patients.
Conclusions
In conclusion, our study constructed an ARlncs-based prognostic signature. And immune checkpoints such as PD-L1, PD-1 and PD-L2 tended to be highly expressed in the high-risk group, which suggested that immunotherapy may be a promising therapy for these patients. A nomogram was constructed based on risk signature and clinical characteristics and displayed good accuracy to predict the prognosis of GC patients.
Funding
The study was funded by the Natural Science Foundation of Shandong Province (ZR2020QH035).
Disclosure
The authors report no conflicts of interest in this work.
References
1. Sung H, Ferlay J, Siegel RL, et al. Global cancer statistics 2020: GLOBOCAN estimates of incidence and mortality worldwide for 36 cancers in 185 countries. CA Cancer J Clin. 2021;71(3):209–249. doi:10.3322/caac.21660
2. Kruglyak KM, Lin E, Ong FS. Next-generation sequencing and applications to the diagnosis and treatment of lung cancer. Adv Exp Med Biol. 2016;890:123–136.
3. Mao R, Wang Z, Zhang Y, et al. Development and validation of a novel prognostic signature in gastric adenocarcinoma. Aging. 2020;12(21):22233–22252. doi:10.18632/aging.104161
4. Nie K, Deng Z, Zheng Z, et al. Identification of a 14-lncRNA signature and construction of a prognostic nomogram predicting overall survival of gastric cancer. DNA Cell Biol. 2020;39(9):1532–1544. doi:10.1089/dna.2020.5565
5. Nie K, Zheng Z, Wen Y, et al. Construction and validation of a TP53-associated immune prognostic model for gastric cancer. Genomics. 2020;112(6):4788–4795. doi:10.1016/j.ygeno.2020.08.026
6. Dikic I, Elazar Z. Mechanism and Medical implications of mammalian autophagy. Nat Rev Mol Cell Biol. 2018;19(6):349–364. doi:10.1038/s41580-018-0003-4
7. Huang T, Song X, Yang Y, et al. Autophagy and Hallmarks of cancer. Crit Rev Oncog. 2018;23(5–6):247–267. doi:10.1615/CritRevOncog.2018027913
8. Cao Y, Luo Y, Zou J, et al. Autophagy and its role in gastric cancer. Clin Chim Acta. 2019;489:10–20. doi:10.1016/j.cca.2018.11.028
9. Russi S, Verma HK, Laurino S, et al. Adapting and surviving: intra and extra-cellular remodeling in drug-resistant gastric cancer cells. Int J Mol Sci. 2019;20(15):3736. doi:10.3390/ijms20153736
10. Nie Y, Liang X, Liu S, Guo F, Fang N, Zhou F. WASF3 knockdown sensitizes gastric cancer cells to oxaliplatin by inhibiting ATG12-mediated autophagy. Am J Med Sci. 2020;359(5):287–295. doi:10.1016/j.amjms.2020.02.007
11. Antunes F, Erustes AG, Costa AJ, et al. Autophagy and intermittent fasting: the connection for cancer therapy? Clinics. 2018;73(suppl 1):e814s. doi:10.6061/clinics/2018/e814s
12. Levy JMM, Towers CG, Thorburn A. Targeting autophagy in cancer. Nat Rev Cancer. 2017;17(9):528–542. doi:10.1038/nrc.2017.53
13. Tsagakis I, Douka K, Birds I, Aspden JL. Long non-coding RNAs in development and disease: conservation to mechanisms. J Pathol. 2020;250(5):480–495. doi:10.1002/path.5405
14. Peng WX, Koirala P, Mo YY. LncRNA-mediated regulation of cell signaling in cancer. Oncogene. 2017;36(41):5661–5667. doi:10.1038/onc.2017.184
15. Deng K, Wang H, Guo X, Xia J. The cross talk between long, non-coding RNAs and microRNAs in gastric cancer. Acta Biochim Biophys Sin. 2016;48(2):111–116. doi:10.1093/abbs/gmv120
16. Shi J, Guo C, Ma J. CCAT2 enhances autophagy-related invasion and metastasis via regulating miR-4496 and ELAVL1 in hepatocellular carcinoma. J Cell Mol Med. 2021;25:8985–8996. doi:10.1111/jcmm.16859
17. Zhou J, Wang M, Mao A, et al. Long noncoding RNA MALAT1 sponging miR-26a-5p to modulate Smad1 contributes to colorectal cancer progression by regulating autophagy. Carcinogenesis. 2021;42(11):1370–1379. doi:10.1093/carcin/bgab069
18. Zhu B, Liu W, Liu H, Xu Q, Xu W. LINC01094 down-regulates miR-330-3p and enhances the expression of MSI1 to promote the progression of glioma. Cancer Manag Res. 2020;12:6511–6521. doi:10.2147/CMAR.S254630
19. Bermudez M, Aguilar-Medina M, Lizarraga-Verdugo E, et al. LncRNAs as regulators of autophagy and drug resistance in colorectal cancer. Front Oncol. 2019;9:1008. doi:10.3389/fonc.2019.01008
20. Cai Q, Wang S, Jin L, et al. Long non-coding RNA GBCDRlnc1 induces chemoresistance of gallbladder cancer cells by activating autophagy. Mol Cancer. 2019;18(1):82. doi:10.1186/s12943-019-1016-0
21. Bhan A, Soleimani M, Mandal SS. Long noncoding RNA and cancer: a new paradigm. Cancer Res. 2017;77(15):3965–3981. doi:10.1158/0008-5472.CAN-16-2634
22. Wang J, Sun J, Wang J, et al. Long noncoding RNAs in gastric cancer: functions and clinical applications. Onco Targets Ther. 2016;9:681–697. doi:10.2147/OTT.S95412
23. Xu TP, Huang MD, Xia R, et al. Decreased expression of the long non-coding RNA FENDRR is associated with poor prognosis in gastric cancer and FENDRR regulates gastric cancer cell metastasis by affecting fibronectin1 expression. J Hematol Oncol. 2014;7:63. doi:10.1186/s13045-014-0063-7
24. Li X, He S, Ma B. Autophagy and autophagy-related proteins in cancer. Mol Cancer. 2020;19(1):12. doi:10.1186/s12943-020-1138-4
25. Xu JL, Yuan L, Tang YC, et al. The role of autophagy in gastric cancer chemoresistance: friend or foe? Front Cell Dev Biol. 2020;8:621428. doi:10.3389/fcell.2020.621428
26. Wu Q, Ma J, Wei J, Meng W, Wang Y, Shi M. lncRNA SNHG11 promotes gastric cancer progression by activating the wnt/beta-catenin pathway and oncogenic autophagy. Mol Ther. 2021;29(3):1258–1278. doi:10.1016/j.ymthe.2020.10.011
27. Xu J, Zhang P, Sun H, Liu Y. LINC01094/miR-577 axis regulates the progression of ovarian cancer. J Ovarian Res. 2020;13(1):122. doi:10.1186/s13048-020-00721-9
28. Li XX, Yu Q. Linc01094 accelerates the growth and metastatic-related traits of glioblastoma by sponging miR-126-5p. Onco Targets Ther. 2020;13:9917–9928. doi:10.2147/OTT.S263091
29. Jiang Y, Li W, Yan Y, Yao X, Gu W, Zhang H. LINC01094 triggers radio-resistance in clear cell renal cell carcinoma via miR-577/CHEK2/FOXM1 axis. Cancer Cell Int. 2020;20:274. doi:10.1186/s12935-020-01306-8
30. Wang XJ, Zheng HT, Xu J, et al. LINC00106 prevents against metastasis of thyroid cancer by inhibiting epithelial-mesenchymal transition. Eur Rev Med Pharmacol Sci. 2020;24(19):10015–10021. doi:10.26355/eurrev_202010_23215
31. Derderian C, Orunmuyi AT, Olapade-Olaopa EO, Ogunwobi OO. PVT1 signaling is a mediator of cancer progression. Front Oncol. 2019;9:502. doi:10.3389/fonc.2019.00502
32. Xu Y, Li Y, Jin J, et al. LncRNA PVT1 up-regulation is a poor prognosticator and serves as a therapeutic target in esophageal adenocarcinoma. Mol Cancer. 2019;18(1):141. doi:10.1186/s12943-019-1064-5
33. Chen DL, Lu YX, Zhang JX, et al. Long non-coding RNA UICLM promotes colorectal cancer liver metastasis by acting as a ceRNA for microRNA-215 to regulate ZEB2 expression. Theranostics. 2017;7(19):4836–4849. doi:10.7150/thno.20942
 © 2022 The Author(s). This work is published and licensed by Dove Medical Press Limited. The full terms of this license are available at https://www.dovepress.com/terms.php and incorporate the Creative Commons Attribution - Non Commercial (unported, v3.0) License.
By accessing the work you hereby accept the Terms. Non-commercial uses of the work are permitted without any further permission from Dove Medical Press Limited, provided the work is properly attributed. For permission for commercial use of this work, please see paragraphs 4.2 and 5 of our Terms.
© 2022 The Author(s). This work is published and licensed by Dove Medical Press Limited. The full terms of this license are available at https://www.dovepress.com/terms.php and incorporate the Creative Commons Attribution - Non Commercial (unported, v3.0) License.
By accessing the work you hereby accept the Terms. Non-commercial uses of the work are permitted without any further permission from Dove Medical Press Limited, provided the work is properly attributed. For permission for commercial use of this work, please see paragraphs 4.2 and 5 of our Terms.