")
Back to Journals » International Journal of General Medicine » Volume 14
Construction of a New Tumor Immunity-Related Signature to Assess and Classify the Prognostic Risk of Colorectal Cancer
Authors Wu X , Yang T, Qian L, Zhang D, Yang H
Received 29 June 2021
Accepted for publication 28 September 2021
Published 12 October 2021 Volume 2021:14 Pages 6661—6676
DOI https://doi.org/10.2147/IJGM.S325511
Checked for plagiarism Yes
Review by Single anonymous peer review
Peer reviewer comments 3
Editor who approved publication: Dr Scott Fraser
Xiaocheng Wu,1,2 Tianxing Yang,3 Liping Qian,4 Desheng Zhang,5 Hui Yang6
1Zhejiang Chinese Medical University, Hangzhou City, People’s Republic of China; 2Pathology Laboratory, Hangzhou Dian Medical Laboratories, Hangzhou City, People’s Republic of China; 3Department of Medical Oncology, Sanmen People’s Hospital, Taizhou City, People’s Republic of China; 4Hang Zhou Cancer Hospital, Hangzhou City, People’s Republic of China; 5Department of Radiology, Huzhou Central Hospital, Affiliated Central Hospital Huzhou University, Huzhou, People’s Republic of China; 6Department of Gastroenterology, Changxing People’s Hospital, Huzhou City, People’s Republic of China
Correspondence: Hui Yang
Department of Gastroenterology, Changxing People’s Hospital, Changxing County, Huzhou City, Zhejiang Province, 313100, People’s Republic of China
Tel +86-15157208400
Email [email protected]
Purpose: Although immunotherapy and checkpoint inhibitors contribute to the treatment of colorectal cancer (CRC), few patients can benefit from these treatments. Therefore, our goal was to develop a marker based on immune-related genes to predict the prognosis of patients with CRC to guide treatment strategies.
Methods: Gene expression data from colorectal cancer patients in the Gene Expression Omnibus (GEO) and The Cancer Genome Atlas were analyzed systematically. We used Cox regression to identify immune-related genes with potential prognostic value. The expression of immune genes, infiltration level of immune cells, and several immune-related molecules were further compared between the high-risk and low-risk groups. Gene Ontology analysis and Kyoto Encyclopedia of Genes and Genomes pathway analyses were used for functional analysis.
Results: Five GEO datasets were integrated into a merged GEO dataset, which showed obvious survival in StromalScore and ESTIMATEScore. WGCNA showed that 749 genes of the pink module are related to immunity, 95 of which are related to prognosis, correlating with cytokine–cytokine receptor interaction and natural killer cell-mediated cytotoxicity. Among these genes, an 11-gene signature was developed through stability selection and LASSO Cox regression. Univariate and multifactorial Cox regression analyses demonstrated that gene signature was an independent prognostic factor for predicting survival in patients with colorectal cancer. Samples from the low-risk group may be more sensitive to immunotherapy. In addition, the nomogram risk prediction model effectively predicted the prognosis of CRC patients by appropriately stratifying the risk scores.
Conclusion: In conclusion, we developed a novel immune-related gene signature that may be useful in predicting cancer progression and prognosis, thus contributing to the individualized management of colorectal cancer patients.
Keywords: colorectal cancer, immune, The Cancer Genome Atlas, prognosis, bioinformatics
Introduction
Colorectal cancer (CRC) is the third most prevalent cancer and the second most deadly cancer worldwide, accounting for approximately 10% of all cancers and 9% of all cancer-related deaths.1 Many factors may be associated with the development of CRC, including genetic, lifestyle, and environmental factors.2 In addition, there is evidence that the development of CRC is a multi-gene and multi-pathway-driven process.3–5 To date, the underlying pathophysiology of the disease has not been fully elucidated, which remains a major obstacle in clinical diagnosis and treatment. The current treatment strategy for locally advanced or metastatic CRC is preoperative neoadjuvant radiotherapy and postoperative adjuvant chemotherapy. In addition, molecularly targeted drugs such as anti-EGFR and anti-VEGFR drugs, as well as various immunotherapies, are emerging as promising therapeutic approaches.6,7 However, most patients eventually develop resistance to therapy, which explains the poor prognosis of patients with advanced local or metastatic CRC. Therefore, identifying patients who will respond to therapy and exploring potential molecular therapeutic targets may shed new light on the treatment of CRC.
The immune system is critical in the development of tumors, and evading destruction by the immune system is a characteristic of tumors. The immune system can kill cells undergoing out-of-control division, thus stopping tumor growth. However, tumors may have specific mutations to help them evade this immune destruction, which is one of the hallmarks of tumor development.8 Therefore, understanding the mechanism by which they respond to immune cells is crucial for impeding tumor development and killing cancer cells. In addition, tumor-associated immunity is present at all stages of tumorigenesis.9 Its effects include destabilization of the genome, apparent genetic modifications, promotion of tumor cell proliferation, anti-apoptosis, stimulation of angiogenesis, and shaping of the tumor microenvironment.10 In fact, tumor-infiltrating CD8+ T cells have been detected in various subpopulations of cancer patients, such as in patients with melanoma, head and neck, breast, lung, prostate, bladder, kidney, colon, ovarian, and esophageal cancers.11 Importantly, this T-cell inflammatory phenotype correlates with positive treatment outcomes in these cancers; thus, it has been proposed as a prognostic biomarker.11–14 Genomic studies on the immune mechanisms of colon cancer have led to the identification of molecular markers that predict response to immune checkpoint blockade. Further studies of these biomarkers are underway, which may improve the accuracy of immunotherapy.
In this study, transcriptomic data and corresponding clinical follow-up information were used to identify key immune-related genes with significant prognostic value. Subsequently, we used these key immune-related genes to construct survival models to predict the prognosis of patients with CRC.
Materials and Methods
Data Acquisition and Pre-Processing
Raw data were downloaded from the GEO database (https://www.ncbi.nlm.nih.gov/geo/) for five datasets, GSE14333,15 GSE17538,16 GSE33113,17 GSE38832,18 and GSE39582,19 which retained sequencing data from the GPL570 platform ([HG-U133_Plus_2] Affymetrix Human Genome U133 Plus 2.0 Array). The expression spectrum data were processed using the robust multi-array average expression measure (RMA) function of the R package affy (V1.66.0)20 and normalized (normalize function) to obtain the expression spectrum of the dataset. The RemoveBatchEffect function of the Limma package21 was used to eliminate the batch effect between the five datasets and merge them into one dataset, named the merged GEO dataset. We converted the probes into gene symbols according to the GPL570 annotation file after merging the data set. When multiple probes corresponded to the same gene symbol, the median value was taken as the expression profile of the gene symbol; when one probe corresponded to multiple gene symbols, the probe expression was removed. Subsequently, the chip dataset retained only colon cancer tumor samples with survival time and survival status. At the same time, the TCGA-COAD dataset was downloaded from the The Cancer Genome Atlas (TCGA) website, which includes clinical information, expression profile information, and mutation information. Clinical information after data pretreatment is presented in Table 1. The working flow chart is shown in Figure 1.
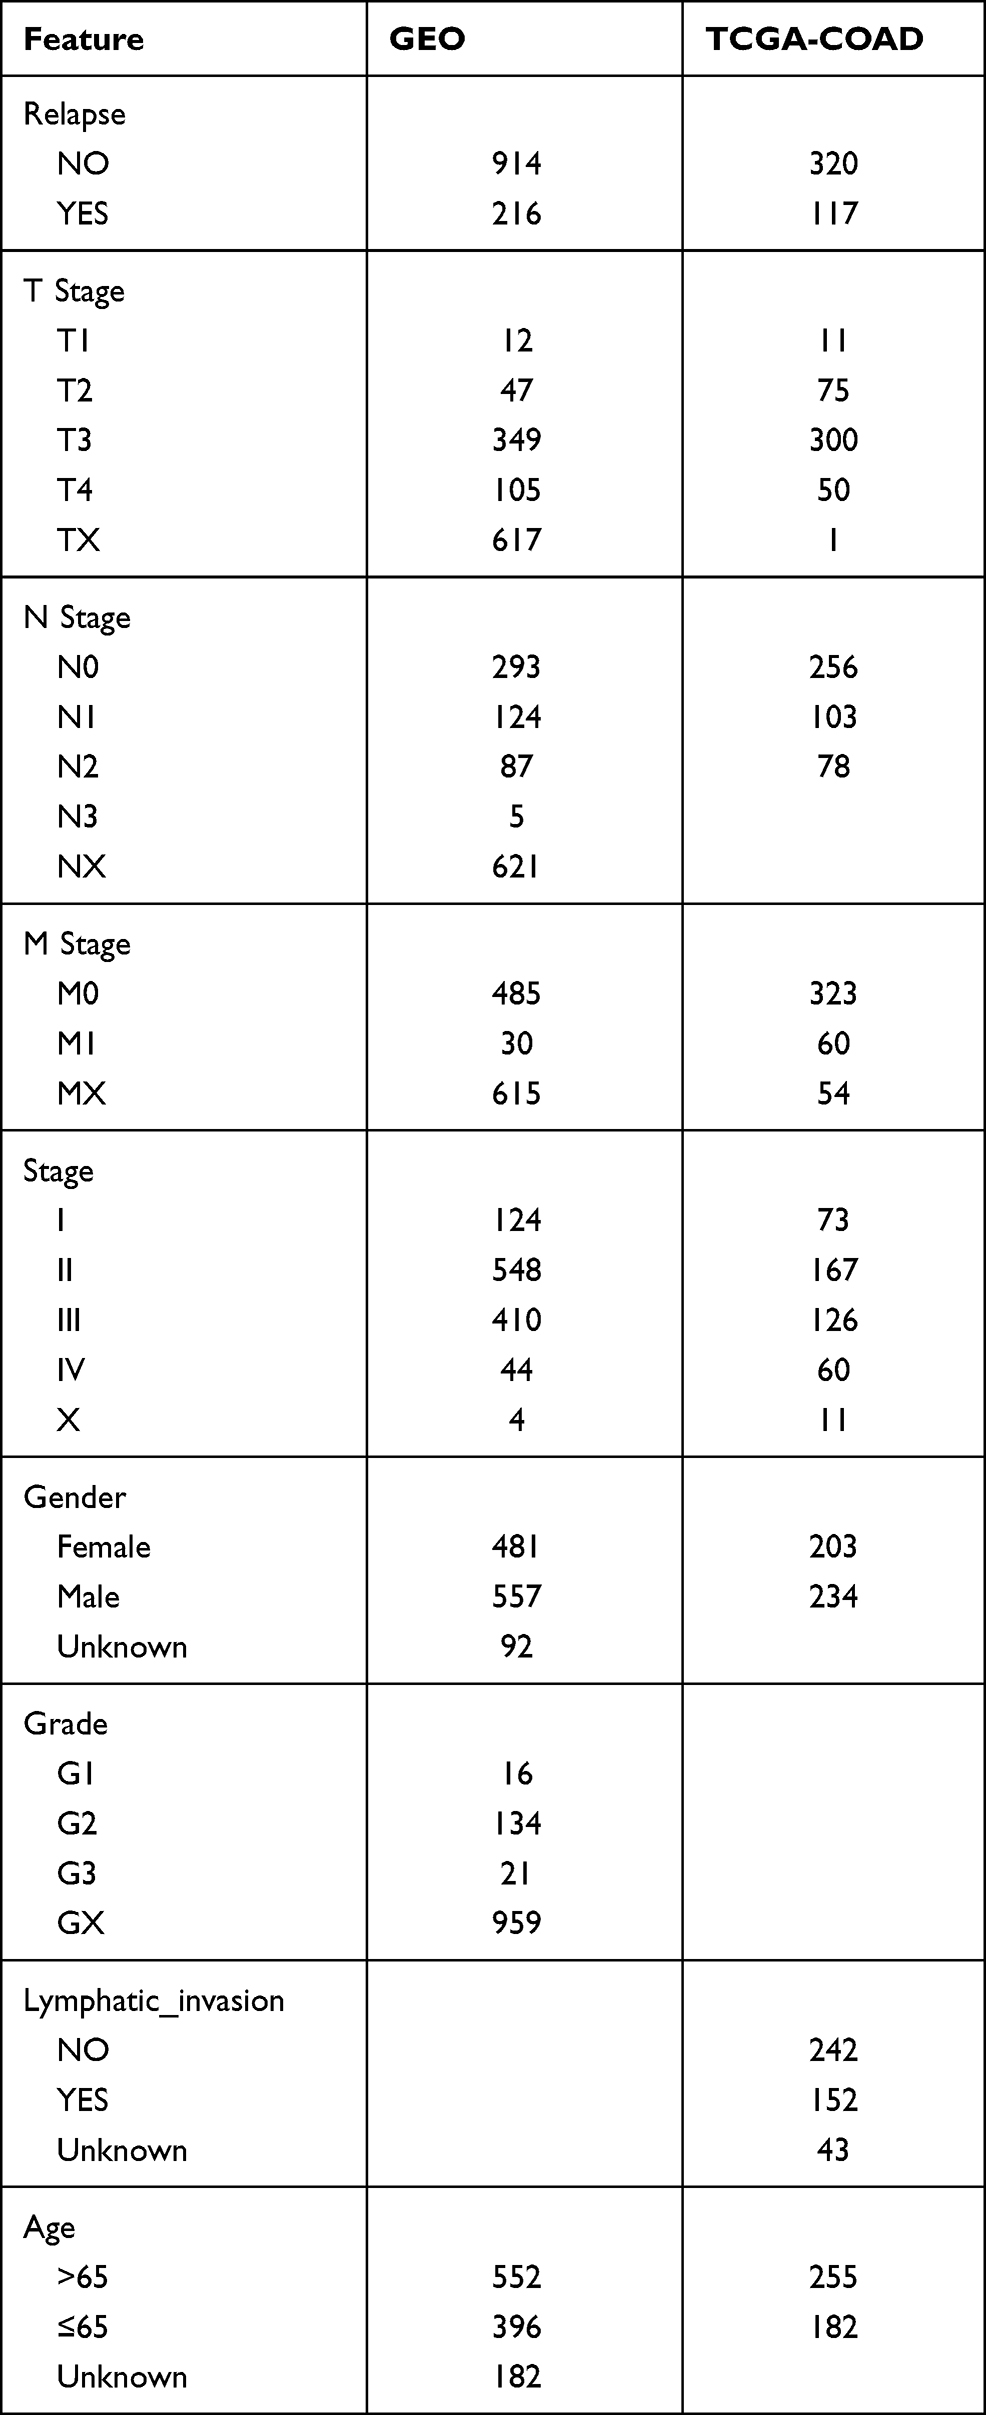 |
Table 1 Clinical Information of Samples |
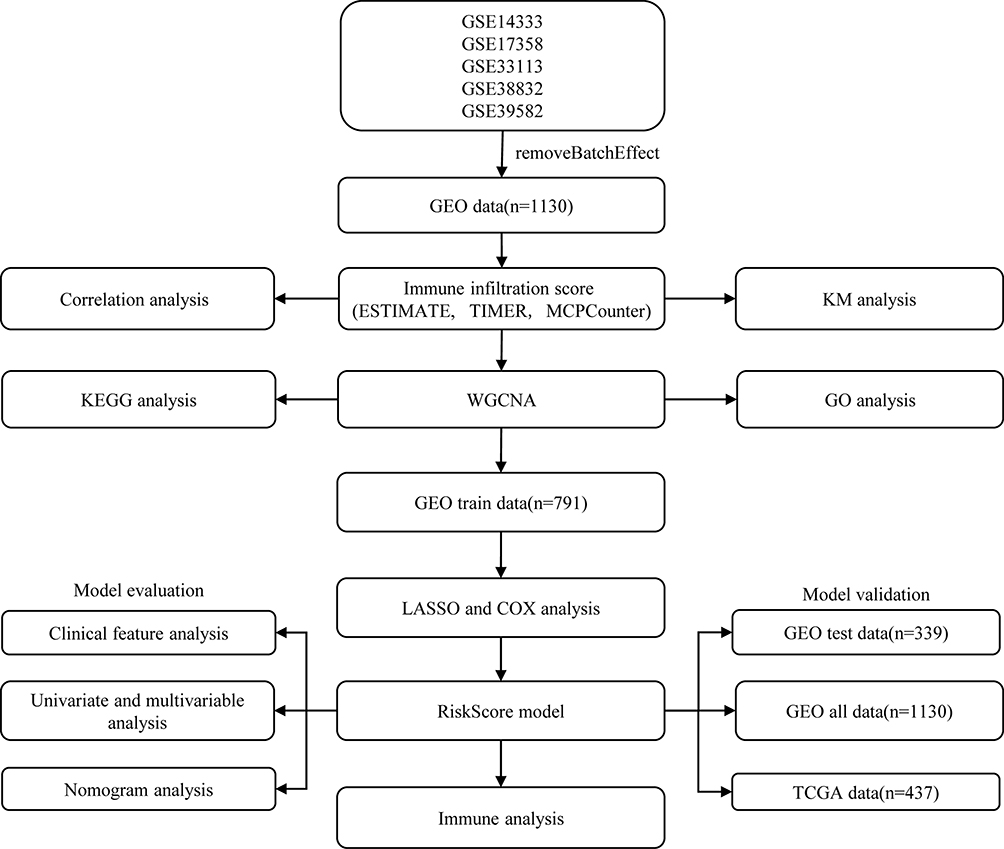 |
Figure 1 Work flow chart. |
Immune Infiltration Score and Survival Analysis
Immune infiltration (ImmuneScore, StromalScore, ESTIMATEScore) was assessed using ESTIMATE22 on the merged GEO dataset, and then samples were divided into high- and low-scoring groups using the median cutoff, and KM survival curves were plotted. Meanwhile, we used both TIMER23 and MCPCounter24 software for the immune scoring of the merged GEO dataset and calculated the Spearman correlation coefficient between these immune infiltration scores.
WGCNA
Co-expression analysis was performed on the merged GEO dataset using the R package WGCNA,25 and modules significantly associated with ImmuneScore, StromalScore, and ESTIMATEScore, were identified. Functional enrichment analysis of genes from modules significantly associated with immune infiltration score was performed using clusterProfiler26 to identify genes associated with immune infiltration.
Construction and Validation of Prognostic Models
The 1130 samples in the merged GEO dataset were first divided into training and validation sets, and to avoid random assignment bias affecting the stability of the subsequent modeling, all samples were randomly grouped 100 times with put-back in advance, where the group sampling was performed with a training:validation ratio of 7:3. The expression profiles of the genes in the immune-related modules were extracted from the GEO training set data, and univariate Cox analysis was performed for each immune-related gene, as well as survival data using the coxph function of the R package survival (V3.1–12), with p < 0.01 selected as the threshold for filtering. Next, we used LASSO regression, multivariate Cox analysis, and STEPAIC methods to further compress the filtered genes to reduce the number of genes in the risk model. The final screened genes were used for the prognostic model, and the calculation formula is as follows:
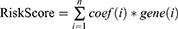
Among them, coef(i) refers to the coefficient of the ith gene, and gene(i) refers to the expression amount of the ith gene. A RiskScore value was calculated for each sample, and the cutoff of the RiskScore was set at the median value. Samples with a RiskScore greater than the median value were considered high-risk samples, and those less than or equal to the median value were low-risk samples.
The same risk calculation method was performed on the GEO validation dataset, the entire merged GEO dataset, and the independent TCGA dataset.
Prognostic Index Evaluation of RiskScore
The Kaplan-Meier (KM) method was used to plot a survival curve, and a Log rank test was performed to assess the difference in survival between the high-risk and low-risk groups. The receiver operating characteristic (ROC) curve was plotted using the KM survi-valROC software package, and the area under the curve (AUC) was calculated to evaluate the specificity and sensitivity of the model. Based on the RMS package for R and the Cox proportional risk regression model, a nomogram of prognosis was drawn to visually show the relationship between individual predictors and the survival rates of patients with CRC. Calibration curves were used to evaluate the performance of the nomogram.
To further evaluate whether our model could be used as an independent prognostic factor, age, gender, Tumor, Node, and Metastasis (TNM) stage, stage, lymphatic, and invasion were considered as independent variables. Subsequently, univariate Cox regression analysis and multivariate Cox regression analysis were performed to determine the change in survival time and survival outcome. Finally, we combined the clinical variables with the riskScore to create a new nomogram to predict survival outcomes for different cohorts of patients.
Statistical Analysis
Statistical analyses of all data utilized in this study were completed using the R software (version 3.4.1, https://www.r-project.org/). Student’s t-test and two-sided tests were used for statistical tests. Pearson correlation coefficient was used for correlation analysis. Moreover, we used the Benjamini-Hochberg method to convert the P-value to FDR. The Kaplan-Meier method was used to generate survival curves for each subgroup in the data set. Additionally, the Log rank test was used to determine the statistically significant differences, with p <0.05.
Results
Immunoinfiltration Analysis
To allow the merged GEO dataset to be used independently, the removeBatchEffect function of the limma package was used to eliminate the batch effect between the five datasets. The results of the PCA analysis showed a clear distinction between the five datasets before the batch effect was eliminated (Figure 2A). While the batch effect was present, the data of the five datasets were no longer distinguishable (Figure 2B), which indicated that there were no differences between the datasets. Next, the merged GEO dataset was evaluated for immune infiltration (ImmuneScore, StromalScore, ESTIMATEScore) using ESTIMATE. KM survival curves showed a significant difference in prognosis between samples with high and low subgroups divided by StromalScore or ESTIMATEScore (Figure 2C and D); however, there was no significant difference in KM survival curves between the high and low ImmuneScore subgroups (Figure 2E). Meanwhile, two software packages, namely TIMER and MCPCounter, were used to assess the immune score from the GEO data, and the Spearman correlation coefficient among these immune infiltration scores was calculated. Results showed that Immunescore, Stromalscore, EstimateScore were all positively correlated with immune cell scores by TIMER and MCPCounter, with the exception of those for B cells and CD8+ T cells (Figure 2F).
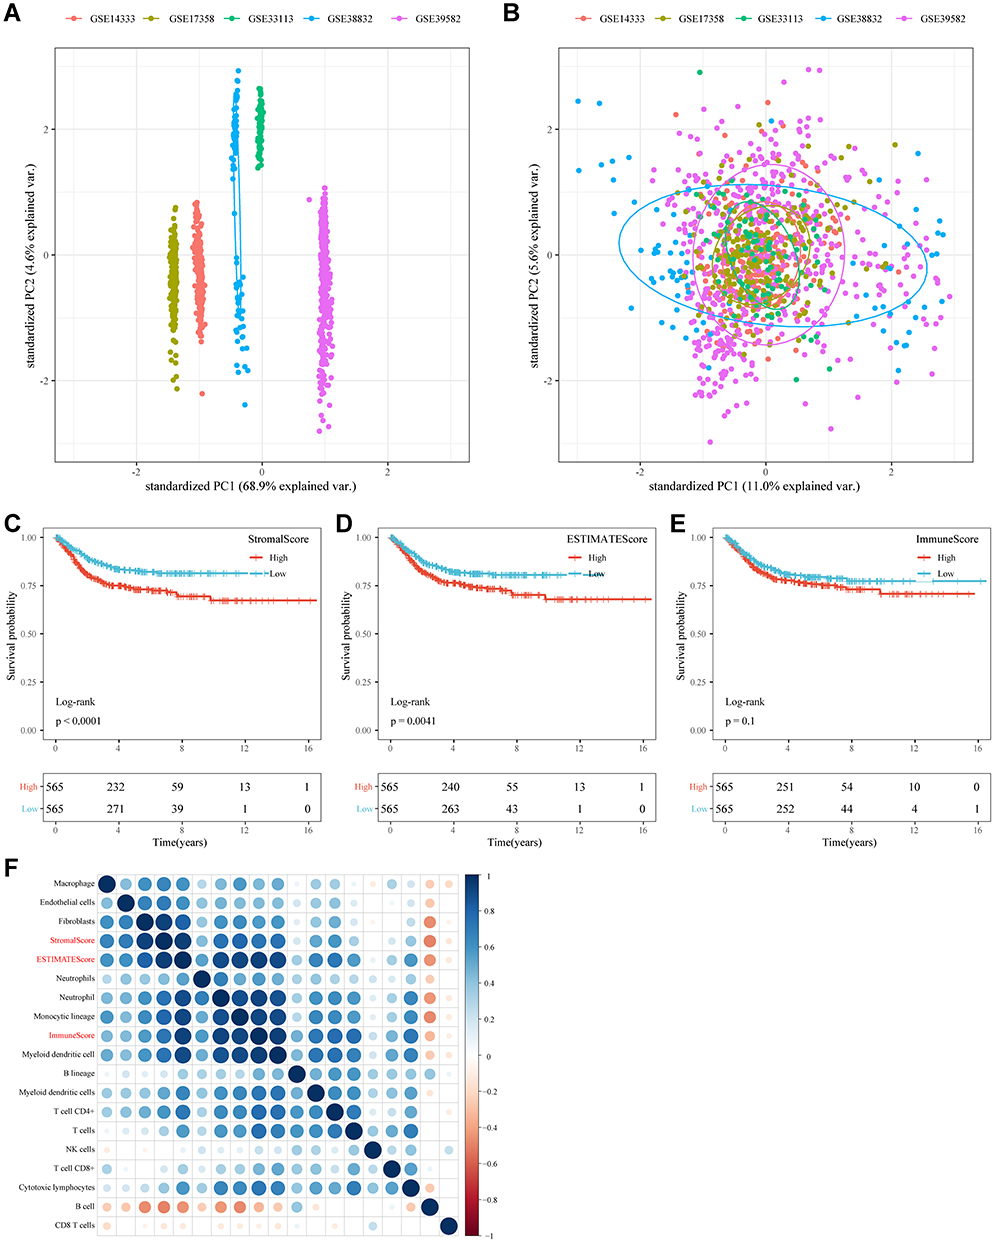 |
Figure 2 Immunoinfiltration analysis. (A) PCA analysis of five datasets prior to elimination of batch effect. (B) PCA analysis of five datasets after elimination of batch effect. (C) KM curves of StromalScorehigh group and StromalScorelow groups in the merged GEO dataset. (D) KM curves of ESTIMATEScorehigh group and ESTIMATEScorelow groups in the merged GEO dataset. (E) KM curves of ImmuneScorehigh group and ImmuneScorelow groups in the merged GEO dataset. (F) Correlation analysis of immune scores. |
Weighted Gene Co-Expression Network Analysis
To identify OS-immune associated modules and genes, the merged GEO dataset was clustered using hierarchical clustering; the results showed that there were two outliers, and the remaining 1128 samples were retained (Figure 3A). The X-axis represents the matrix weighting power, while the Y-axis represents the quadratic correlation index derived from the log (k) and log (P(k)) of the corresponding network. We took the power as 4 when the correlation index reached 0.9 for the first time (Figure 3B). A total of 18 modules were obtained (Figure 3C). The correlations of each module with the StromalScore, ImmuneScore, and ESTIMATEScore values were further analyzed. The pink module (749 genes) had a significant positive correlation with ImmuneScore and ESTIMATEScore (cor > 0.9, p < 1e-5); the yellow module (1511 genes) had a significantly positive correlation with StromalScore, ESTIMATEScore (cor > 0.8, p < 1e-5). The midnight blue module (316 genes) had a significant positive correlation with StromalScore, ImmuneScore, and ESTIMATEScore (cor > 0.35, p < 1) (Figure 3D).
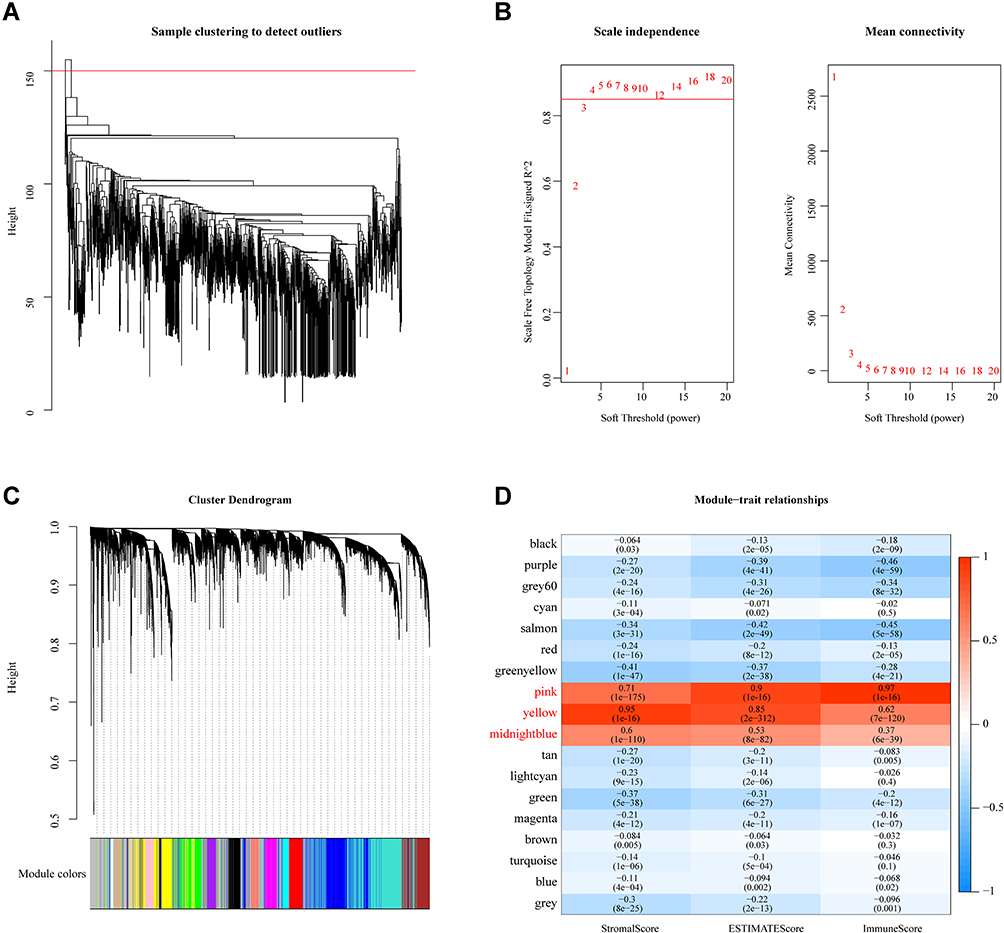 |
Figure 3 WGCNA. (A) Cluster analysis of merged GEO dataset samples. (B) Analysis of network topology for various soft-thresholding powers. (C) Gene dendrogram and module color. (D) Correlations between the 18 modules and immune scores. |
Enrichment Analysis
To identify the function of the immune infiltration scoring module gene, we used the R software package ClusterProfiler (v3.16.0) to perform KEGG pathway analysis and GO function enrichment analysis of the immune-related gene modules (pink, yellow, and midnight blue). The GO analysis of the pink module revealed that the significantly enriched GO terms were T cell activation, immune response-activating signal transduction, regulation of immune effector process, and regulation of innate immune response (Figure 4A). Furthermore, the KEGG pathway analysis in pink modules showed that the most significantly enriched pathways were cytokine–cytokine receptor interaction, natural killer cell-mediated cytotoxicity, Th1 and Th2 cell differentiation, intestinal immune network for IgA production, and autoimmune thyroid disease (Figure 4B). In the yellow modules, genes were correlated with the PI3K-Akt signaling pathway, MAPK signaling pathway, Rap1 signaling pathway, and GF-beta signaling pathway (Figure 4C and D). In the midnight blue modules, genes were correlated with the cGMP-PKG signaling pathway, cAMP signaling pathway, and other related pathways (Figure 4E and F).
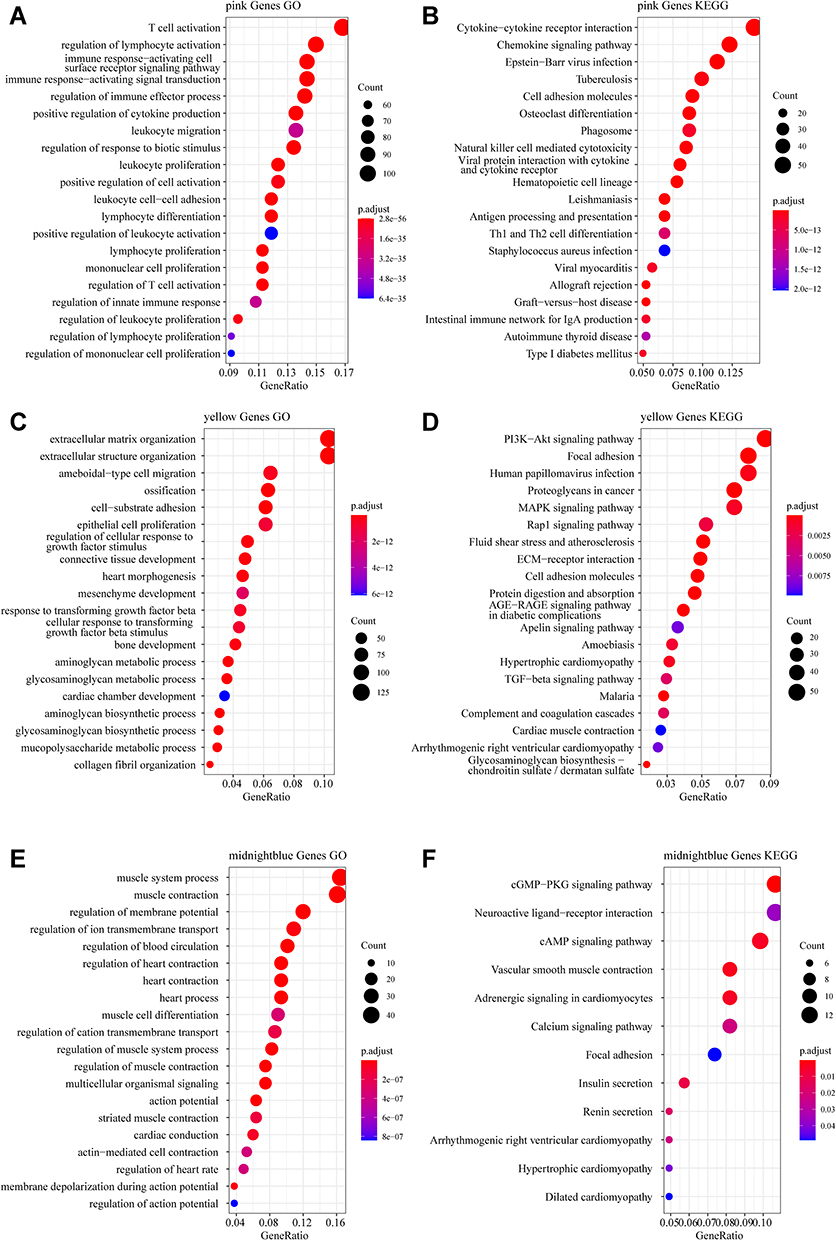 |
Figure 4 Functional enrichment analysis. (A) Gene Ontology (GO) functional annotation of pink module genes. (B) Kyoto Encyclopedia of Genes and Genomes (KEGG) pathway annotation of pink module genes. (C) GO functional annotation of yellow module genes. (D) KEGG pathway annotation of yellow module genes. (E) GO functional annotation of the midnight blue module genes. (F) KEGG pathway annotation of the midnight blue module gene. |
Construction and Validation of a Prognostic Model Based on Immune-Related Genes
Through functional annotation analysis of module genes, we found that the pink module genes are related to immunity. Univariate analysis was performed on 749 immune-related genes from the pink module on the training dataset, and 95 prognosis-related genes were obtained (p < 0.01). LASSO Cox regression analysis of 95 genes was performed using the R software package glmnet. The change of the independent variable shows that with the gradual increase in lambda, the number of independent variable coefficients approaching 0 also gradually increases (Figure S1A). The fivefold cross-validation was used to construct the model, and the confidence interval for each lambda was analyzed. When lambda = 0.01817286, the model reached the optimum value, and 21 genes were identified (Figure S1B). Next, multivariate Cox analysis was carried out on these 21 genes, and the STEPAIC method was used to further reduce the number of genes. Finally, 11 genes were used in our model (Table 2).
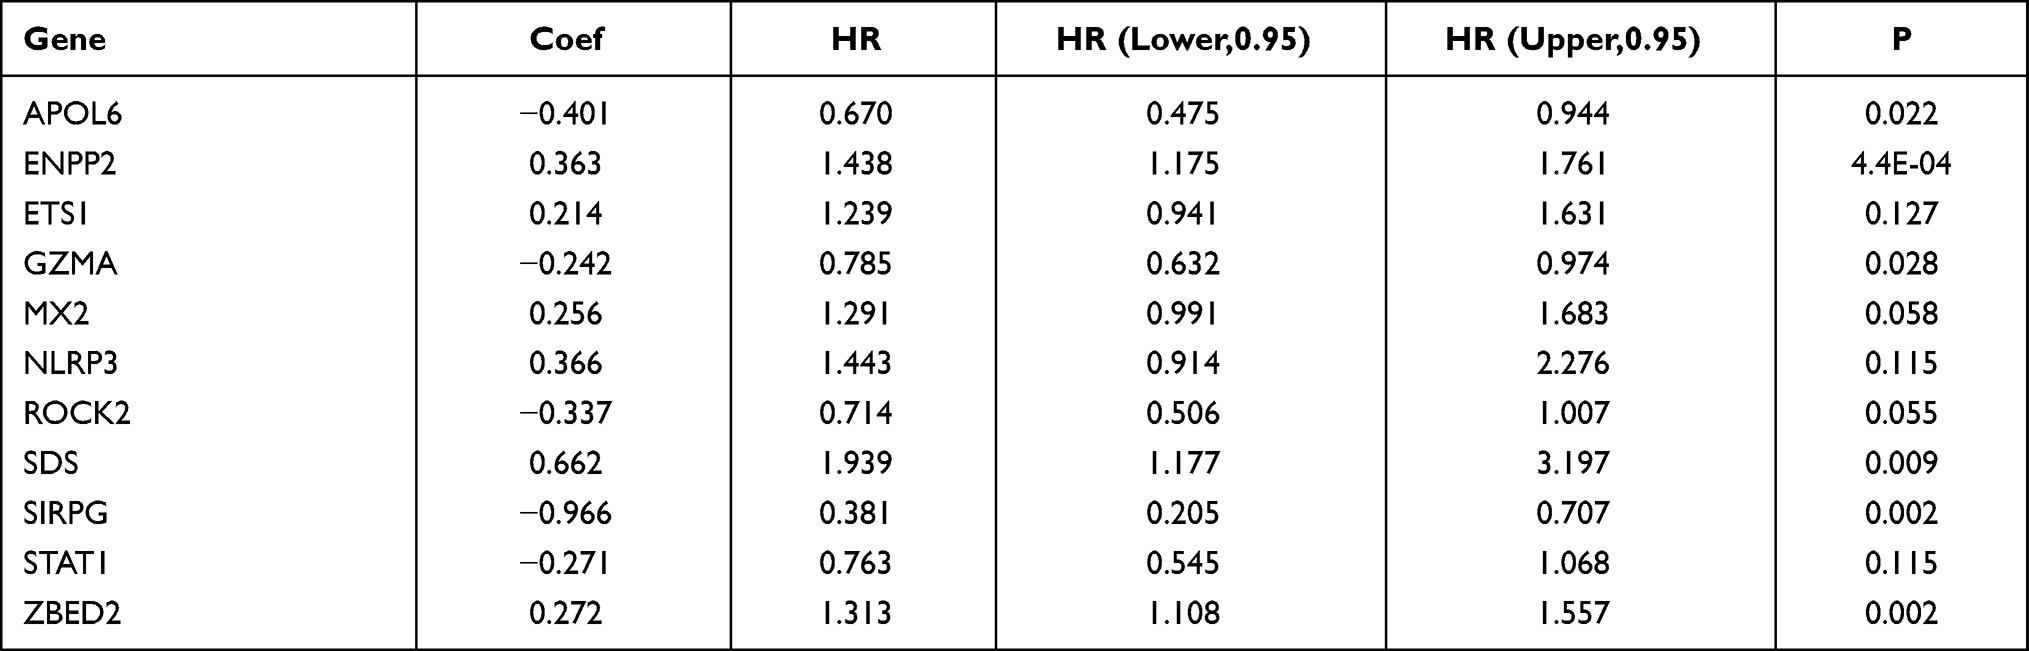 |
Table 2 Multivariate Cox Analysis of Risk Models |
A prognostic model was constructed based on the weight of the OS of each gene in the multivariate Cox regression analysis. The risk score = (−0.401 × RPKM value of APOL6) + (0.363 × RPKM value of ENPP2) + (0.214 × RPKM value of ETS1) + (−0.242 × RPKM value of GZMA) + (0.256 × RPKM value of MX2) + (0.366 × RPKM value of NLRP3) + (−0.337 x RPKM value of ROCK2) + (0.662 × RPKM value of SDS) + (−0.966 × RPKM value of SIRPG) + (−0.271 × RPKM value of STAT1) + (0.272 × RPKM value of ZBED2). Subsequently, the patients were divided into two groups (low-risk and high-risk) using the median value as cutoff points of the risk scores. In low-risk areas, the percentage of survivors was higher (Figure 5A and B). The heatmap plot indicated that the expression of the 11 genes was significantly different between the low-risk and high-risk groups, and the patients associated with an adverse prognosis were mainly classified into the high-risk groups (Figure 5C). The KMcurve for OS between the low-risk and high-risk groups demonstrated a significant difference (p < 0.0001) (Figure 5D). At the same time, the 1-year, 2-year, 3-year and 5-year AUC values were 0.747, 0.763, 0.778, and 0.800, respectively (Figure 5E).
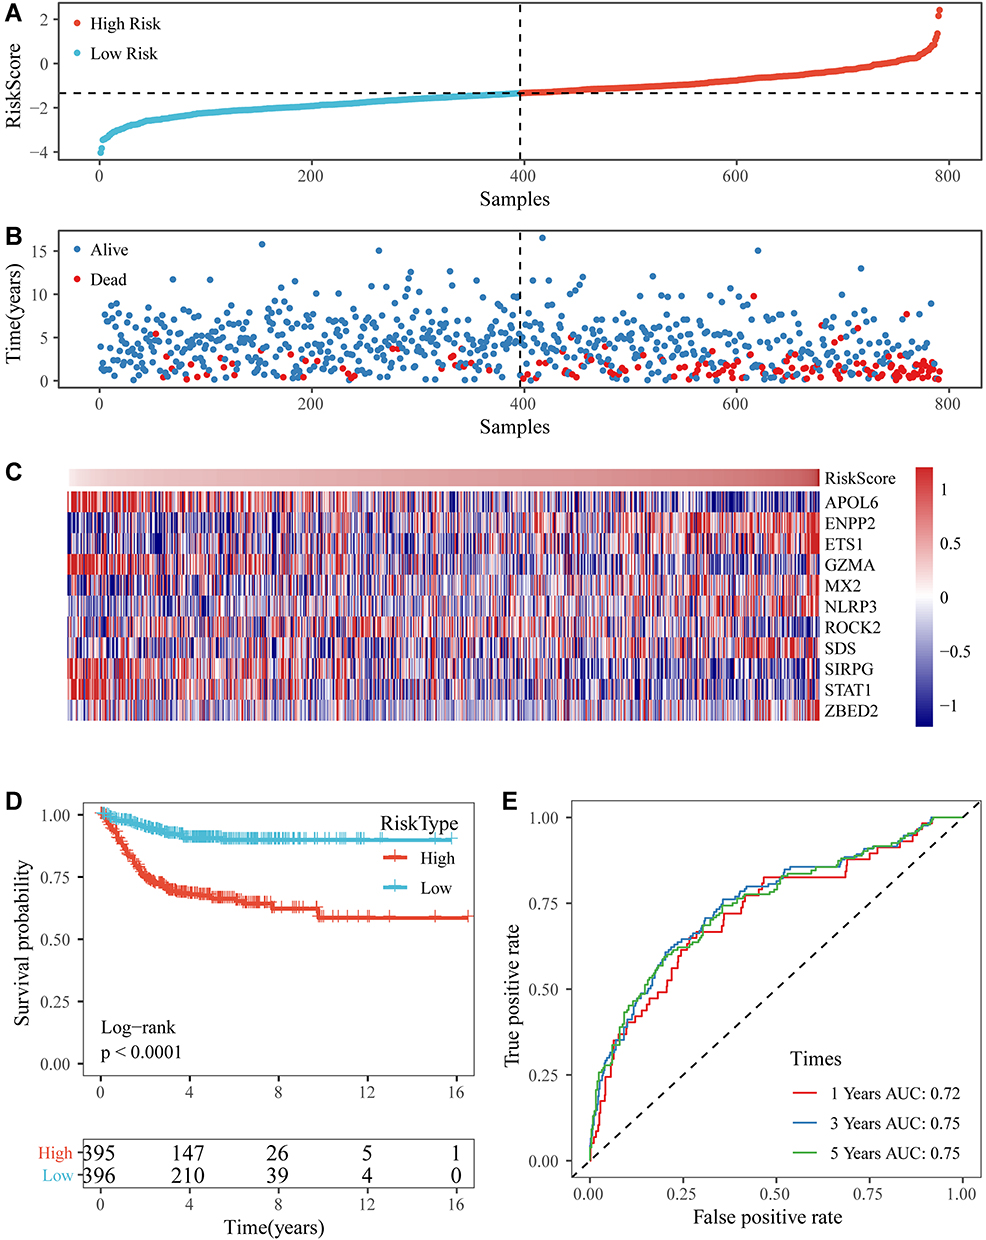 |
Figure 5 (A and B) The distribution of RiskScore and corresponding survival states in the Gene Expression Omnibus (GEO) training dataset. (C) Heatmap of gene expression in the RiskScore model. (D and E) Kaplan-Meier curve and receiver operating characteristic curve of RiskScore in the GEO training dataset. |
Robustness of the Prognostic Model
The prognostic model was verified using a validation prognostic model based on the GEO validation data set and the merged GEO dataset. The results show that our risk model performs well with the GEO validation dataset (Figure 6A–C) as well as the merged dataset (Figure 6D–F). Meanwhile, at different time points (1, 3, and 5 years), the ROC curves of our RiskScore had high AUC values.
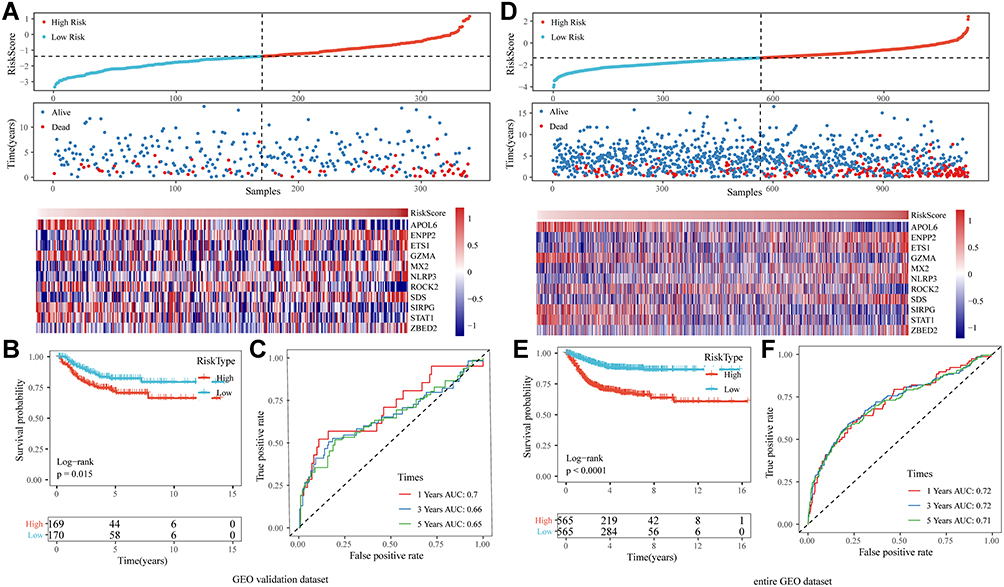 |
Figure 6 (A) The distribution of RiskScore and corresponding survival states in the Gene Expression Omnibus (GEO) validation dataset, and heatmap of gene expression in RiskScore model. (B and C) Kaplan-Meier (KM) curve and receiver operating characteristic (ROC) curve of RiskScore in GEO validation dataset. (D) The distribution of RiskScore and corresponding survival states in the entire merged GEO dataset, and heatmap of gene expression in RiskScore model. (E and F) KM curve and ROC curve of RiskScore in the entire merged GEO dataset. |
At the same time, to further verify that our risk model performs well with different platforms and datasets, we verified our risk model using an independent dataset from TCGA. The same risk coefficient was used to calculate the RiskScore of each sample in the dataset (Figure S2A–C). The samples were divided into two groups, and the KM curve of the high-and low-risk groups in the TCGA dataset was significantly different (Figure S2D). At different time points (1, 3, and 5 years), the AUC value of RiskScore was greater than 0.6 (Figure S2E). These results demonstrate that our model exhibits good performance and universality.
Correlation Between Classifiers and Clinicopathologic Characteristics
In the merged GEO dataset, for RiskScore, the clinical characteristics (T stage, N stage, and cancer stage) showed significant differences between the two groups across the whole cohort (Figure 7). Meanwhile, the TNM stage, cancer stage, and lymph node invasion, but not sex and age, varied significantly between the two groups in the TCGA dataset (Figure S3). Patients with high TNM stage, or grade tended to have high-risk scores.
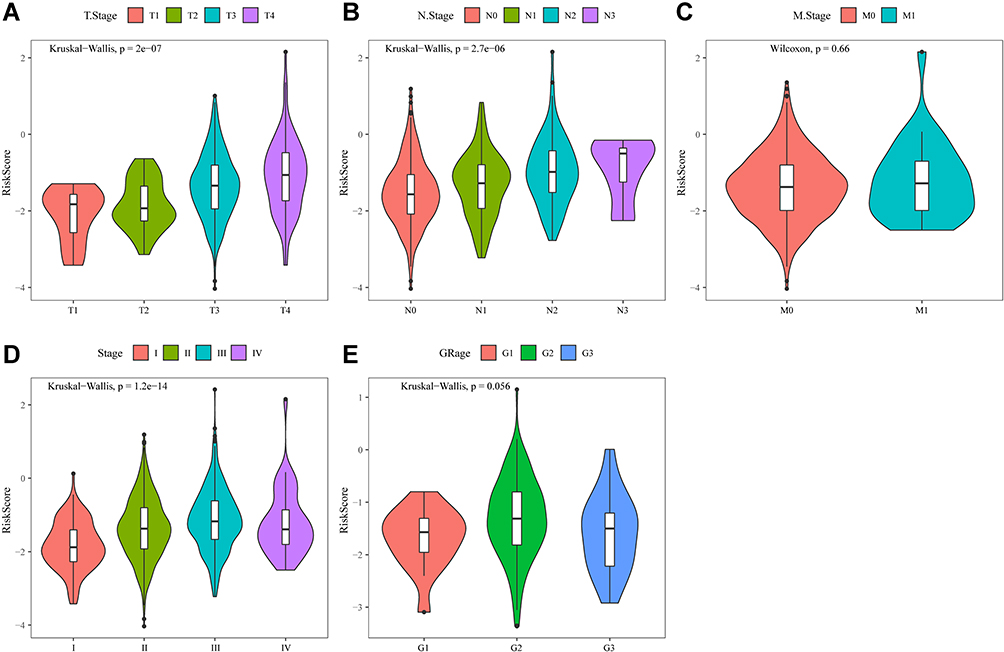 |
Figure 7 (A) Comparison of RiskScore among T1-4 Stage groups in the merged Gene Expression Omnibus (GEO) dataset. (B) Comparison of RiskScore among N1-4 stage groups in the merged GEO dataset. (C) Comparison of RiskScore between M0 and M1 stage groups in the merged GEO dataset. (D) Comparison of RiskScore among stage I-IV groups in the merged GEO dataset. (E) Comparison of RiskScore among grade 1–3 groups in the merged GEO dataset. |
Furthermore, the distribution of clinical characteristics in the GEO dataset between the high- and low-risk subgroups was compared. High-risk clinical features tended to be distributed among high-risk subgroups (Figure 8). A similar distribution was observed in the TCGA dataset (Figure S4).
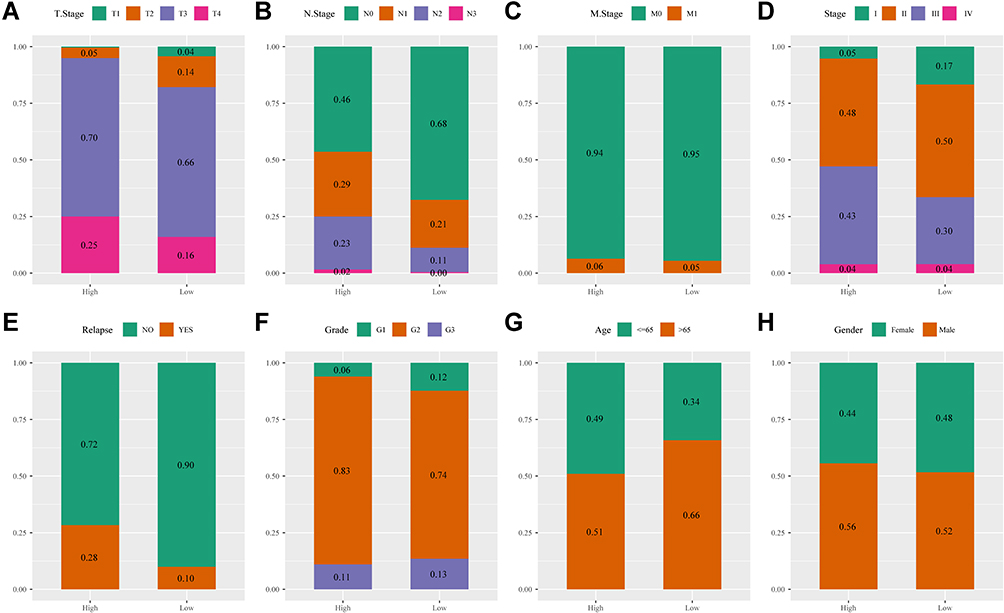 |
Figure 8 (A) T stage distribution between high- and low-risk groups in the merged Gene Expression Omnibus (GEO) dataset. (B) N stage distribution between high- and low-risk groups in the merged GEO dataset. (C) M stage distribution between high- and low-risk groups in the merged GEO dataset. (D) Stage distribution between high- and low-risk groups in the merged GEO dataset. (E) Relapse status distribution between high- and low-risk groups in the merged GEO dataset. (F) Grade stage distribution between high- and low-risk groups in the merged GEO dataset. (G) Age distribution between high- and low-risk groups in the merged GEO dataset. (H) Gender distribution between high- and low-risk groups in the merged GEO dataset. |
Correlation Between Classifiers and ImmuneScore Analysis
In the merged GEO and TCGA datasets, to identify the relationship between the immune infiltration scores with high- and low-risk subgroups, three scores, ESTIMATEScore, ImmuneScore, and StromalScore, were calculated separately for each sample using the R software package ESTIMATE. The results showed that the ESTIMATEScore, ImmuneScore, and StromalScore scores were significantly higher in the low-risk group than in the high-risk group in the merged GEO and TCGA datasets (Figure 9A and D). In addition, we compared the expression of immunotherapy-related genes PDCD1, CTLA4, and IFNG in the high- and low-risk subgroups, and the expression of these three genes was higher in the low-risk group than in the high-risk group from the merged GEO and TCGA datasets (Figure 9B and E). The Spearman correlation coefficient between immune scores and immunotherapy genes indicated a positive correlation between immunotherapy genes and immune scores in the merged GEO and TCGA datasets (Figure 9C and F).
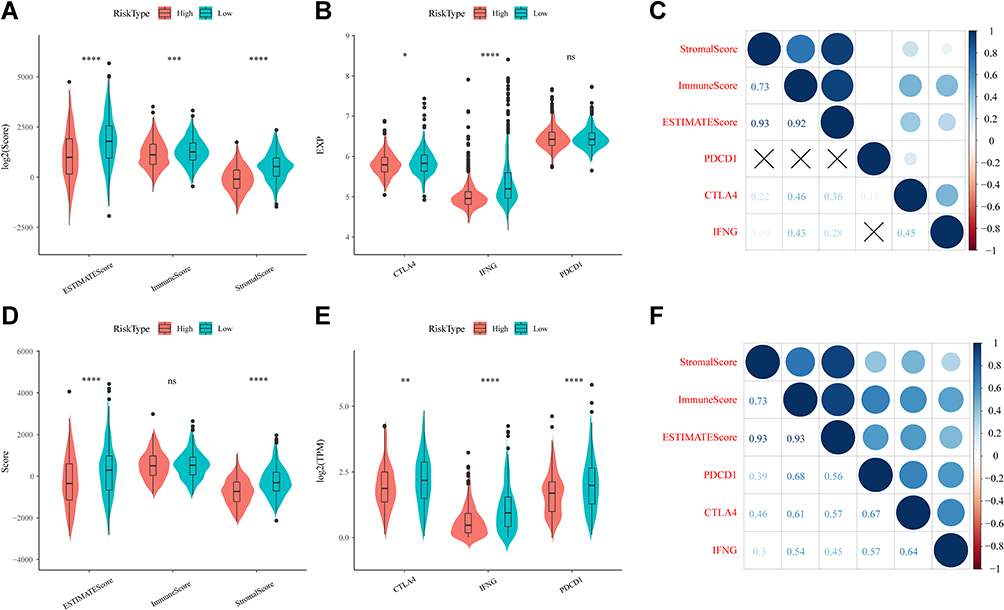 |
Figure 9 (A) Comparison of differences in ESTIMATE immunization scores in high- and low-risk groups in the merged Gene Expression Omnibus (GEO) dataset. (B) Differential expression of immunotherapeutic genes in high- and low-risk subgroups in the merged GEO dataset. (C) Analysis of the correlation between immune scores and immunotherapeutic genes in the merged GEO dataset. (D) Comparison of differences in ESTIMATE immunization scores in high- and low-risk groups in The Cancer Genome Atlas (TCGA) dataset. (E) Differential expression of immunotherapeutic genes in high- and low-risk subgroups in the TCGA dataset. (F) Analysis of the correlation between immune scores and immunotherapeutic genes in the TCGA dataset. *P<0.05, **P<0.01, ***P<0.001, ****P<0.0001, ns, not significant. |
Prognostic Value of RiskScore for Assessing Clinical Outcome
We performed multivariable Cox regression analysis to evaluate whether the 11-gene signature was an independent predictor of the survival of patient with CRC. Clinical features including age, sex, TNM stage, stage, lymphatic, and invasion were defined as covariates. The 11-gene signature, TNM stage, stage, lymphatic, and invasion were significantly associated with OS in the univariate Cox regression analyses. After the multivariate Cox regression analyses of the above-mentioned factors, only the 11-gene signature model and M stage were retained as dependable and independent prognostic factors for OS (p < 0.001) in the entire GEO dataset (Table 3).
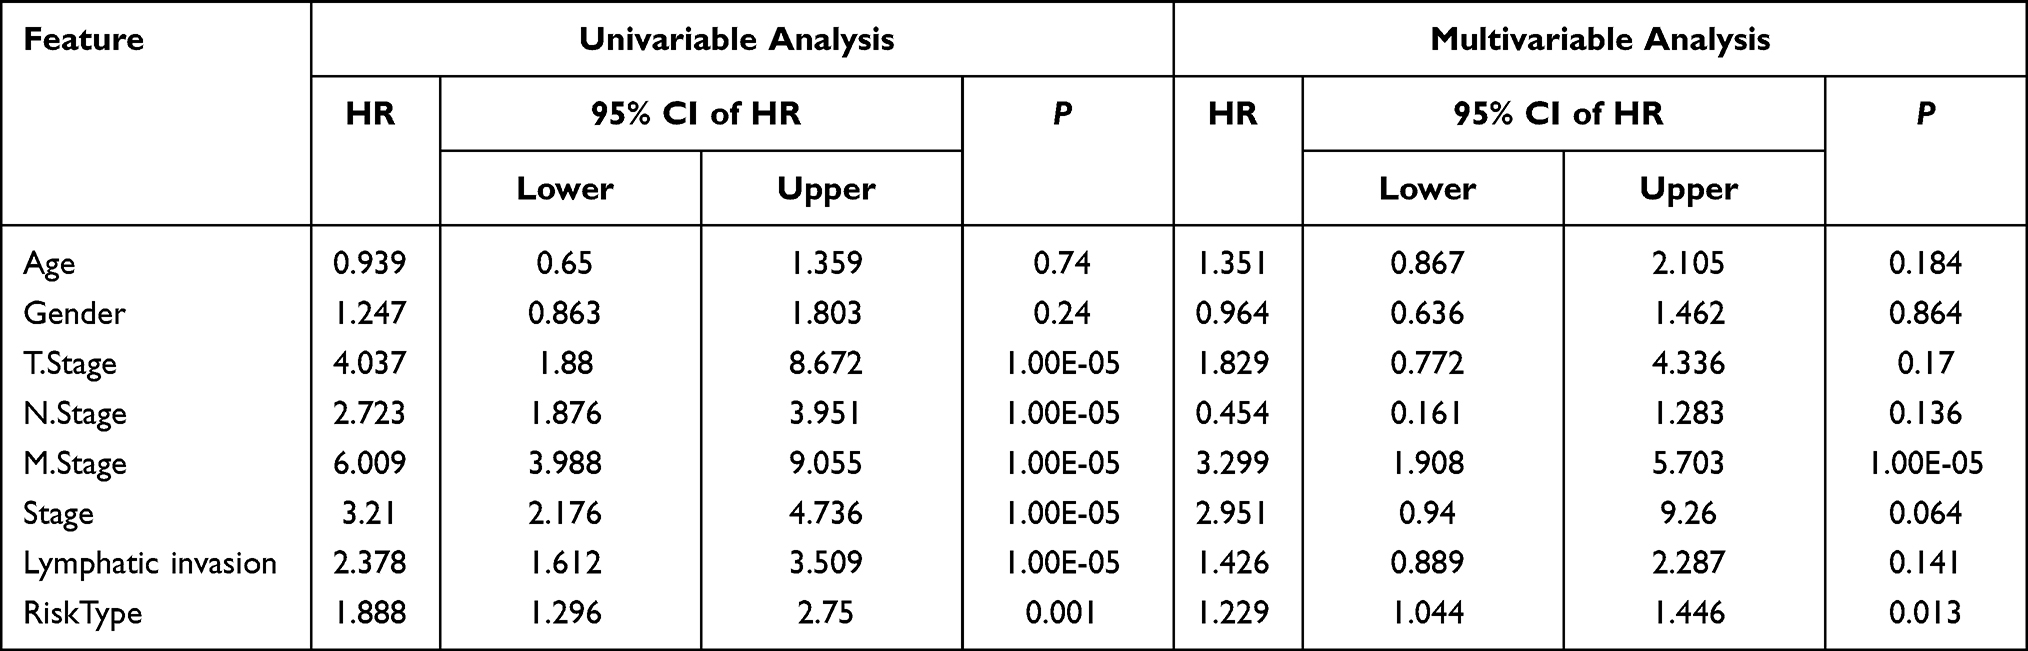 |
Table 3 Univariate and Multivariate Survival Cox Analysis of RiskScore in Merged GEO Datasets |
Verifying the Accuracy of the Prognostic Model
To further verify the accuracy of the prognostic model, we constructed a diagram and ROC curve. Based on the multivariate Cox regression analysis, a nomogram, a quantitative method to predict the individual probability of overall survival (OS), was established to estimate OS. The RiskScore feature had the greatest impact on the survival prediction (Figure 10A). The prediction values of the nomogram in the calibration plot were very close to the 45° line in the TCGA dataset (Figure 10B).
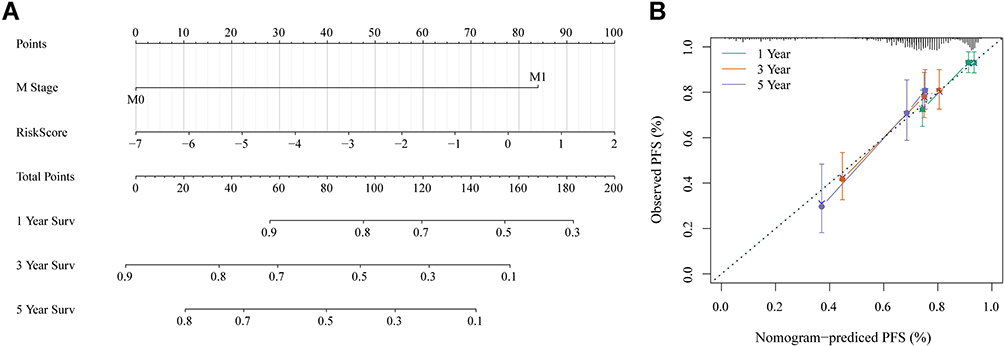 |
Figure 10 (A) Nomogram of RiskScore and M stage. (B) Calibration diagram of the nomogram. |
Discussion
In addition to malignant tumor cells, cancer tissue includes immune cells, endothelial cells, fibroblasts, and a rich collection of cytokines, chemokines, and growth factors,27 and these components and their complex interactions form the tumor microenvironment. Even when the malignant cells are aggressive, the immune microenvironment can play a suppressive role, but during their development, tumor cells may bypass these suppressive signals and instead use immune cells and other cells for their own benefit, leading to growth, invasion and metastasis.28–30 The most prominent biological processes in the tumor microenvironment are the recruitment and activation of various immune cells.27 It has been recognized that there is a complex interplay of biological processes between immune and malignant cells in the tumor stroma, which is of prognostic importance, because the simultaneous tumor-promoting and -suppressing role of the immune system.31–33 In CRC, there is significant infiltration by various immune cells, and their distribution, tissue localization, and cell type are significantly associated with progression and survival. For example, high infiltration of tumor-infiltrating immune cells (TIICs) in rectal cancer biopsies was significantly associated with improved tumor response to preoperative radiotherapy, prolonged disease-free survival, and overall survival.34 In addition, the prognostic value of Immunoscore on patient outcomes has been demonstrated in patients with advanced CRC.10 Among the different immunotherapeutic approaches that have been developed, the use of immunomodulatory monoclonal antibodies against immune checkpoints has shown promising and durable clinical responses in a variety of cancers, including some CRCs.35 Encouraged by the latest successes of immune checkpoint inhibitors, other immunotherapies and prognostic factors for CRC patients are still in development.
High-throughput molecular analyses, gene expression databases, and bioinformatic tools have enabled the systematic characterization of cancer immune profiles. For example, Yang et al established a prognostic model for gastric cancer, which consists of immune-related genes TNFRSF18, PBK, MICB, ITGA6, TLR5, PNMA1, LBP, CXCR4, C6, and NRP1, and it is able to accurately distinguish between patients with poor and satisfactory OS.36 Similarly, Bao et al identified independent prognostic features of invasive ductal carcinoma, including FLT3LG, SPIB, KLRB1, BATF, IGHA1, TIMM8A, and QRSL1.37 In this study, based on gene expression profiles from the TCGA database, we systematically evaluated the immunogenomic signature of CRC tumors and constructed an immune-related prognostic signature including APOL6, ENPP2, ETS1, GZMA, MX2, NLRP3, ROCK2, SDS, SIRPG, STAT1, and ZBED2. The AUC values of the 3-year and 5-year OS for this prognostic feature were 0.75, indicating moderate predictive accuracy. In addition, this feature was associated with tumor stage, infiltration, lymph node metastasis, and distant metastasis, and was an independent predictor of OS in patients with CRC. Moreover, RT-qPCR was used to validated the expressions of 11 genes in two colorectal cancer cell lines. The results indicated that ENPP2, ETS1, MX2, NLRP3, SDS and ZBED2 expression levels were up-regulated, while APOL6, MA, ROCK2, SIRPG and STAT1 expression levels were down-regulated in two cell lines (Figure S5). This data are similar to those of our bioinformatics analysis. This IRG signature may reflect immune dysregulation in the tumor microenvironment and may be a novel prognostic biomarker for CRC.
In human cancer research, there is no single biomarker that can be used to detect cancer with the required specificity and sensitivity.38 When one or two typical biomarkers are analyzed, conflicting results are often obtained, leading to incorrect cancer diagnosis and unsuccessful treatment. Because we already know that several pathways and biological processes have changed in tumor cells, the concept of a “single marker” of cancer is incorrect.39 Several studies have reported a broad portfolio of serum biomarkers for multiple cancers. The combination of serum biomarkers with nucleic acids, including mRNA, microRNA, and circulating tumor DNA (ctDNA), is becoming a diagnostic tool for malignancies.40 Therefore, the above results may provide a hint: combining several biomarkers from different biological pathways may lead to a better understanding of cancer progression and prognostic significance.
Our study has certain limitations that need to be addressed in future studies. First, the clinical information of the sample was not sufficient to exclude other factors. Second, the prognostic risk signature should be validated in our’ own data through replication in an independent sample set. Finally, our findings must be validated by functional tests in vitro and in vivo to further understand the biological role of this IRG signature in CRC.
Conclusion
In summary, we identified and validated a novel immune-related prognostic profile for patients with CRC, which may reflect immune dysregulation in the tumor microenvironment, acting as a potential prognostic biomarker and therapeutic target. The proposed immune-related gene signature is a promising prognostic biomarker for CRC, which could be used to differentiate and predict patient survival outcomes. Prospective studies are needed to further verify the accuracy of its prognostic analysis and to test its clinical application value in the individualized treatment of CRC.
Funding
There is no funding to report.
Disclosure
The authors report no conflicts of interest in this work.
References
1. Bray F, Ferlay J, Soerjomataram I, Siegel RL, Torre LA, Jemal A. Global cancer statistics 2018: GLOBOCAN estimates of incidence and mortality worldwide for 36 cancers in 185 countries. CA Cancer J Clin. 2018;68(6):394–424.
2. Aran V, Victorino AP, Thuler LC, Ferreira CG. Colorectal cancer: epidemiology, disease mechanisms and interventions to reduce onset and mortality. Clin Colorectal Cancer. 2016;15(3):195–203. doi:10.1016/j.clcc.2016.02.008
3. Herman JG, Umar A, Polyak K, et al. Incidence and functional consequences of hMLH1 promoter hypermethylation in colorectal carcinoma. Proc Natl Acad Sci USA. 1998;95(12):6870–6875. doi:10.1073/pnas.95.12.6870
4. Hollstein M, Sidransky D, Vogelstein B, Harris CC. p53 mutations in human cancers. Science (New York, NY). 1991;253(5015):49–53. doi:10.1126/science.1905840
5. Reya T, Clevers H. Wnt signalling in stem cells and cancer. Nature. 2005;434(7035):843–850. doi:10.1038/nature03319
6. Hashiguchi Y, Muro K, Saito Y, et al. Japanese Society for Cancer of the Colon and Rectum (JSCCR) guidelines 2019 for the treatment of colorectal cancer. Int J Clin Oncol. 2020;25(1):1–42.
7. Yoshino T, Arnold D, Taniguchi H, et al. Pan-Asian adapted ESMO consensus guidelines for the management of patients with metastatic colorectal cancer: a JSMO-ESMO initiative endorsed by CSCO, KACO, MOS, SSO and TOS. Ann Oncol. 2018;29(1):44–70. doi:10.1093/annonc/mdx738
8. Kawakami Y, Ohta S, Sayem MA, Tsukamoto N, Yaguchi T. Immune-resistant mechanisms in cancer immunotherapy. Int J Clin Oncol. 2020;25(5):810–817. doi:10.1007/s10147-019-01611-x
9. Lei X, Lei Y, Li JK, et al. Immune cells within the tumor microenvironment: biological functions and roles in cancer immunotherapy. Cancer Lett. 2020;470:126–133. doi:10.1016/j.canlet.2019.11.009
10. Anastas JN, Moon RT. WNT signalling pathways as therapeutic targets in cancer. Nat Rev Cancer. 2013;13(1):11–26. doi:10.1038/nrc3419
11. Pagès F, Galon J, Dieu-Nosjean MC, Tartour E, Sautès-Fridman C, Fridman WH. Immune infiltration in human tumors: a prognostic factor that should not be ignored. Oncogene. 2010;29(8):1093–1102. doi:10.1038/onc.2009.416
12. Mlecnik B, Tosolini M, Kirilovsky A, et al. Histopathologic-based prognostic factors of colorectal cancers are associated with the state of the local immune reaction. J Clin Oncol. 2011;29(6):610–618. doi:10.1200/JCO.2010.30.5425
13. Azimi F, Scolyer RA, Rumcheva P, et al. Tumor-infiltrating lymphocyte grade is an independent predictor of sentinel lymph node status and survival in patients with cutaneous melanoma. J Clin Oncol. 2012;30(21):2678–2683. doi:10.1200/JCO.2011.37.8539
14. Mahmoud SM, Paish EC, Powe DG, et al. Tumor-infiltrating CD8+ lymphocytes predict clinical outcome in breast cancer. J Clin Oncol. 2011;29(15):1949–1955. doi:10.1200/JCO.2010.30.5037
15. Jorissen RN, Gibbs P, Christie M, et al. Metastasis-associated gene expression changes predict poor outcomes in patients with Dukes Stage B and C colorectal cancer. Clin Cancer Res. 2009;15(24):7642–7651. doi:10.1158/1078-0432.CCR-09-1431
16. Smith JJ, Deane NG, Wu F, et al. Experimentally derived metastasis gene expression profile predicts recurrence and death in patients with colon cancer. Gastroenterology. 2010;138(3):958–968. doi:10.1053/j.gastro.2009.11.005
17. de Sousa EMF, Colak S, Buikhuisen J, et al. Methylation of cancer-stem-cell-associated Wnt target genes predicts poor prognosis in colorectal cancer patients. Cell Stem Cell. 2011;9(5):476–485. doi:10.1016/j.stem.2011.10.008
18. Tripathi MK, Deane NG, Zhu J, et al. Nuclear factor of activated T-cell activity is associated with metastatic capacity in colon cancer. Cancer Res. 2014;74(23):6947–6957. doi:10.1158/0008-5472.CAN-14-1592
19. Marisa L, de Reyniès A, Duval A, et al. Gene expression classification of colon cancer into molecular subtypes: characterization, validation, and prognostic value. PLoS Med. 2013;10(5):e1001453. doi:10.1371/journal.pmed.1001453
20. Gautier L, Cope L, Bolstad BM, Irizarry RA. affy–analysis of Affymetrix GeneChip data at the probe level. Bioinformatics. 2004;20(3):307–315. doi:10.1093/bioinformatics/btg405
21. Ritchie ME, Phipson B, Wu D, et al. limma powers differential expression analyses for RNA-sequencing and microarray studies. Nucleic Acids Res. 2015;43(7):e47. doi:10.1093/nar/gkv007
22. Yoshihara K, Shahmoradgoli M, Martínez E, et al. Inferring tumour purity and stromal and immune cell admixture from expression data. Nat Commun. 2013;4:2612. doi:10.1038/ncomms3612
23. Li T, Fan J, Wang B, et al. TIMER: a web server for comprehensive analysis of tumor-infiltrating immune cells. Cancer Res. 2017;77(21):e108–e110. doi:10.1158/0008-5472.CAN-17-0307
24. Becht E, Giraldo NA, Lacroix L, et al. Estimating the population abundance of tissue-infiltrating immune and stromal cell populations using gene expression. Genome Biol. 2016;17(1):218. doi:10.1186/s13059-016-1070-5
25. Langfelder P, Horvath S. WGCNA: an R package for weighted correlation network analysis. BMC Bioinform. 2008;9:559. doi:10.1186/1471-2105-9-559
26. Yu G, Wang LG, Han Y, He QY. clusterProfiler: an R package for comparing biological themes among gene clusters. Omics. 2012;16(5):284–287. doi:10.1089/omi.2011.0118
27. Bremnes RM, Al-Shibli K, Donnem T, et al. The role of tumor-infiltrating immune cells and chronic inflammation at the tumor site on cancer development, progression, and prognosis: emphasis on non-small cell lung cancer. J Thor Oncol. 2011;6(4):824–833. doi:10.1097/JTO.0b013e3182037b76
28. Quail DF, Joyce JA. Microenvironmental regulation of tumor progression and metastasis. Nat Med. 2013;19(11):1423–1437. doi:10.1038/nm.3394
29. Klemm F, Joyce JA. Microenvironmental regulation of therapeutic response in cancer. Trends Cell Biol. 2015;25(4):198–213. doi:10.1016/j.tcb.2014.11.006
30. Joyce JA, Pollard JW. Microenvironmental regulation of metastasis. Nat Rev Cancer. 2009;9(4):239–252. doi:10.1038/nrc2618
31. Nagalla S, Chou JW, Willingham MC, et al. Interactions between immunity, proliferation and molecular subtype in breast cancer prognosis. Genome Biol. 2013;14(4):R34. doi:10.1186/gb-2013-14-4-r34
32. Ding J, Zhang Q, Chen S, Huang H, He L. Construction of a new tumor immunity-related signature to assess and classify the prognostic risk of ovarian cancer. Aging. 2020;12(21):21316–21328. doi:10.18632/aging.103868
33. Shen R, Liu B, Li X, Yu T, Xu K, Ma J. Development and validation of an immune gene-set based prognostic signature for soft tissue sarcoma. BMC Cancer. 2021;21(1):144. doi:10.1186/s12885-021-07852-2
34. Anitei MG, Zeitoun G, Mlecnik B, et al. Prognostic and predictive values of the immunoscore in patients with rectal cancer. Clin Cancer Res. 2014;20(7):1891–1899. doi:10.1158/1078-0432.CCR-13-2830
35. Ciardiello D, Vitiello PP, Cardone C, et al. Immunotherapy of colorectal cancer: challenges for therapeutic efficacy. Cancer Treat Rev. 2019;76:22–32. doi:10.1016/j.ctrv.2019.04.003
36. Yang W, Lai Z, Li Y, et al. Immune signature profiling identified prognostic factors for gastric cancer. Chin J Cancer Res. 2019;31(3):463–470. doi:10.21147/j.issn.1000-9604.2019.03.08
37. Bao X, Shi R, Zhang K, et al. Immune landscape of invasive ductal carcinoma tumor microenvironment identifies a prognostic and immunotherapeutically relevant gene signature. Front Oncol. 2019;9:903. doi:10.3389/fonc.2019.00903
38. Muinao T, Deka Boruah HP, Pal M. Multi-biomarker panel signature as the key to diagnosis of ovarian cancer. Heliyon. 2019;5(12):e02826. doi:10.1016/j.heliyon.2019.e02826
39. Rodríguez-Enríquez S, Pacheco-Velázquez SC, Gallardo-Pérez JC, et al. Multi-biomarker pattern for tumor identification and prognosis. J Cell Biochem. 2011;112(10):2703–2715. doi:10.1002/jcb.23224
40. Bettegowda C, Sausen M, Leary RJ, et al. Detection of circulating tumor DNA in early- and late-stage human malignancies. Sci Transl Med. 2014;6(224):224ra224. doi:10.1126/scitranslmed.3007094
 © 2021 The Author(s). This work is published and licensed by Dove Medical Press Limited. The full terms of this license are available at https://www.dovepress.com/terms.php and incorporate the Creative Commons Attribution - Non Commercial (unported, v3.0) License.
By accessing the work you hereby accept the Terms. Non-commercial uses of the work are permitted without any further permission from Dove Medical Press Limited, provided the work is properly attributed. For permission for commercial use of this work, please see paragraphs 4.2 and 5 of our Terms.
© 2021 The Author(s). This work is published and licensed by Dove Medical Press Limited. The full terms of this license are available at https://www.dovepress.com/terms.php and incorporate the Creative Commons Attribution - Non Commercial (unported, v3.0) License.
By accessing the work you hereby accept the Terms. Non-commercial uses of the work are permitted without any further permission from Dove Medical Press Limited, provided the work is properly attributed. For permission for commercial use of this work, please see paragraphs 4.2 and 5 of our Terms.