")
Back to Journals » Cancer Management and Research » Volume 12
Construction of a 13-Gene Signature as a Novel Prognostic Marker for Patients with Clear Cell Renal Cell Carcinoma and the Role of XCR1 in Cell Proliferation
Authors Yuan B, Li F, Li Y, Chen Y
Received 17 February 2020
Accepted for publication 9 May 2020
Published 27 May 2020 Volume 2020:12 Pages 4017—4027
DOI https://doi.org/10.2147/CMAR.S250126
Checked for plagiarism Yes
Review by Single anonymous peer review
Peer reviewer comments 2
Editor who approved publication: Dr Antonella D'Anneo
Baoying Yuan,1,* Feifei Li,2,* Youbao Li,3 Yuhan Chen4
1Department of Radiation Oncology, Zhongshan Hospital, Fudan University, Shanghai, People’s Republic of China; 2The First Class Ward 2, The First Affiliated Hospital of Jinan University, Guangzhou, People’s Republic of China; 3Division of Nephrology, Nanfang Hospital, Southern Medical University, Guangzhou, People’s Republic of China; 4Department of Radiation Oncology, Nanfang Hospital, Southern Medical University, Guangzhou, People’s Republic of China
*These authors contributed equally to this work
Correspondence: Yuhan Chen Email [email protected]
Objective: The tumor microenvironment plays a key role in regulating tumor progression. This research aimed to develop the biomarker related to tumor microenvironment in clear cell renal cell carcinoma (ccRCC).
Methods: The ESTIMATE algorithm was used to evaluate the immune score of ccRCC cases from The Cancer Genome Atlas (TCGA). Differentially expressed genes between high and low immune scores were identified and a 13-gene signature was constructed by the LASSO Cox regression model to predict overall survival (OS) for ccRCC cases in TCGA or International Cancer Genome Consortium (ICGC) project. The immune cell fractions were calculated by the TIMER algorithm. Cell viability and gene expression were determined by CCK-8 and qRT-PCR, respectively.
Results: The OS of patients with high immune scores was worse than that of patients with low immune scores. The OS between ccRCC patients from TCGA or ICGC cohort in high- and low-risk groups stratified by the gene signature was significantly different. Subgroup analysis also showed a robust prognostic ability of the gene signature. Multivariate Cox regression analysis demonstrated that this gene signature was an independent prognostic factor. The nomogram that integrated the gene signature and three clinicopathological risk factors had a favorably predictive ability in predicting 3, 5 and 10 year survival. Moreover, the high-risk group had a significantly higher abundance of B cell, T cell, CD4, neutrophil and DC infiltration. Among 13 genes, X-C motif chemokine receptor1 (XCR1) was upregulated in ccRCC cells and exerted an inhibitory effect on cell proliferation.
Conclusion: This study constructs a 13-gene signature as a novel prognostic marker to predict the survival of ccRCC patients and XCR1 may serve as a therapeutic target.
Keywords: clear cell renal cell carcinoma, tumor microenvironment, immune, gene signature, XCR1
Introduction
Renal cell carcinoma (RCC) is one of the 10 most common cancers worldwide.1 Histologically, RCC comprises different subtypes, and of which the vast majority is clear cell RCC (ccRCC).2 Recent cancer genomic analysis has demonstrated that high molecular heterogeneity in ccRCC may be a potential explanation for the variable clinical outcomes.3,4 Although significant progresses have made in the genetics and pathologies of ccRCC, the prognosis for individual patient still remains challenging.
Clinical evidences have supported the notion that ccRCC belongs to an immune-sensitive tumor because some cases regressed spontaneously.5,6 The response of ccRCC to immune checkpoint inhibitors also highlights the potential role of the immune response in ccRCC.7–9 The microenvironment of ccRCC remains elusive. Additionally, reliable biomarkers for ccRCC patients’ survival and possible novel targets for management strategies are lacking.
The Cancer Genome Atlas (TCGA) has been generating comprehensive genomic profiles for tumor samples including over 30 types of cancer. ccRCC is one of the tumor types investigated by the TCGA database and characterization of key novel biomarkers with clinical value still needs to be tailored. The “Estimation of STromal and Immune cells in MAlignant Tumor tissues using Expression data (ESTIMATE)” algorithm is developed by Yoshihara et al to infer the level of infiltrating stromal and immune cells in tumor samples by using gene expression data.10 The application of ESTIMATE to TCGA-based expression profiles may aid in exploring the accessory roles of the microenvironment to cancer.11
Unlike those gene signatures generated from differentially expressed genes between ccRCC and normal tissues in most studies,12,13 we used ESTIMATE algorithm-derived immune scores to screen out the most relevant prognostic genes for ccRCC in TCGA datasets. We then constructed a 13-gene signature and established a prognostic nomogram based on clinical factors and gene signature to predict the overall survival (OS) for patients with ccRCC. The prognostic value of the 13-gene signature was also validated by another independent cohort from the International Cancer Genome Consortium (ICGC). Additionally, the immune cell infiltration levels were significantly different in gene signature stratified risk groups, which may help clinicians in the decision-making process of immune therapy for patients with ccRCC. Moreover, we further validated the gene function of 13-gene signature. Among 13 genes, X-C motif chemokine receptor1 (XCR1) was demonstrated to own the effect on inhibiting the proliferation of ccRCC cells.
Materials and Methods
Patient Datasets Collection
Immune scores of ccRCC patients were analyzed by using the ESTIMATE algorithm downloaded from the website of MD Anderson Cancer Center.10 The RNA-seq and corresponding clinical information of ccRCC cases with OS time more than 30 days of TCGA and ICGC were downloaded from the University of California Santa Cruz (UCSC) Genome Browser (https://xena.ucsc.edu/public-hubs/) and ICGC data portal (https://dcc.icgc.org/), respectively.
Screening Out Differentially Expressed Genes
By using the median score, the TCGA cases were divided into two immune scores status groups with high or low immune scores. And the association between immune scores status and survival was also assessed by Kaplan–Meier survival analysis and Log-rank test. The differentially expressed genes (DEGs) between two immune scores status groups were identified by R package “Bioconductor Limma”. The adjusted P value (false discovery rate, FDR) of each gene was calculated by Benjamini Hochberg method. FDR <0.05 and |log2FC| >1 were used as the threshold for DEGs selection. Finally, the DEGs screened out from TCGA ccRCC patients with different immune scores status were visualized by Volcano Plot and Fold Change filtering.
Construction of the Gene Signature for ccRCC
According to the results of the differential expression analysis for the TCGA ccRCC patients with different immune scores status, we used LASSO Cox regression analysis to select a panel of genes, and then constructed a multi-gene signature for predicting the prognosis of ccRCC patients. LASSO Cox regression analysis was performed by using the R package “glmnet”. The simplest (smallest parameter) model of gene signature was constructed after 10-times cross-validations and utilizing the one standard error of the best penalty parameter λ value. The risk score of each patient was calculated by the sum of the products of each gene expression level and its corresponding coefficient according to the risk score formula.
Analysis of Immune Cell Infiltration Level
The infiltration level of 6 immune cell types in ccRCC was calculated by tumor immune estimation resource (TIMER), a public resource at https://cistrome.shinyapps.io/timer. The correlations between 13 genes expression and the abundances of immune infiltrates were obtained from TIMER.14
Cell Culture and siRNA Transfection
Human renal cancer cell lines (786-O and Caki-1) and normal HK2 cells were gained from the Shanghai Advanced Research Institute, Chinese Academy of Sciences. Dulbecco’s Modified Eagle’s Medium (DMEM) (pH 7.4) supplemented with 10% (v/v) fetal bovine serum (Gibco) was used for cell culture, under the condition of 37°C in a 5% CO2 humidified atmosphere. XCR1 siRNA or the corresponding negative control (GenePharma, Shanghai, China) was transfected into cells by using Lipofectamine 3000 reagent (Invitrogen) according to the manufacturer’s recommendation. The final siRNA transfection concentration for cells in 24-well plates was 50 nM. The specific siRNA sequences for XCR1 were provided in the Supplementary Table 1.
Quantitative Reverse Transcription Polymerase Reaction (qRT-PCR) and Analysis
After isolating the total RNA from cells using TRIzol reagent (Invitrogen), the Prime Script RT reagent kit (Takara Bio, Shiga, Japan) was used for cDNA synthesis and the SYBR® Premix Ex Taq™ (Takara) was used for qRT-PCR detection utilizing real-time detection system (ABI7500, USA). The primer sequences are provided in Supplementary Table 2. GAPDH served as an internal standard control. Gene expression level was quantified using 2−ΔΔCt method.
Western Blot
Protein was extracted by radioimmunoprecipitation assay buffer (RIPA) containing phenylmethylsulfonyl fluoride (PMSF, Beyotime, China) for 30 min at 4°C and harvested to separate on 10% sodium dodecyl sulfate-polyacrylamide gels. After transferring onto polyvinylidene fluoride (PVDF) membranes (Sigma-Aldrich, USA), the membranes were incubated with the anti-XCR1 (#44,665, Cell Signaling Technology, Danvers, MA, USA) and anti-GAPDH (#2118, Cell Signaling Technology) antibodies overnight at 4°C. Then, the membranes were washed in PBS and further incubated with HRP-conjugated secondary antibody (Cell Signaling Technology, USA) for 1 h at room temperature. A chemiluminescence system (Bio-Rad, USA) was used for visualizing the blots.
Cell Proliferation Assay
The transfected cells were seeded in 96-well plates at a density of 2000 cells per well. Cell viability was determined from 12 to 120 h by using the Cell Counting Kit-8 (CCK-8) according to the manufacturer’s protocol (Dojindo, Kumamoto, Japan). The optical density (OD) was recorded at 450 nm by an automatic microplate reader (Synergy4; BioTek, Winooski, VT, USA).
Statistical Analysis
Patients of the TCGA dataset were divided into high risk and low-risk groups by utilizing the median risk score as the cut-off value according to the risk score formula. OS differences between high risk and low-risk groups were evaluated by Kaplan-Meier survival analysis and Log-rank test. In addition, univariate and multivariate survival analyses were performed to determine prognostic factors in ccRCC patients. By using the R packages “rms” and “da”, a nomogram was generated to assess individual OS by integrating multiple prognostic factors. Calibration plots and Harrell’s concordance index (C-index) were established to assess the performance of the nomogram. All tests were analyzed using R software version 3.4.2 and P < 0.05 was considered statistically significant.
Results
Immune Scores are Significantly Associated with OS in ccRCC
In total, 516 ccRCC samples with mRNA expression profiles and clinical information from the TCGA database were downloaded for analysis. Based on the ESTIMATE algorithm, immune scores were distributed between −1158.9 and 3076.4. The patient cohort was stratified into low and high immune score groups based on the median score. The Kaplan–Meier survival analysis revealed that patients in the high immune scores group had a significantly shorter OS than those in the low immune scores group (P = 0.0259, Figure 1A). In addition, there was no significant difference in OS between the high and low ESTIMATE score (−2716.84 to 4773.7) or stromal scores (−1557.91 to 2030.4) group stratified by the median score (P = 0.1811, P = 0.1869, respectively). Thus, in the following study, we focused on the DEGs between the high and low immune score groups.
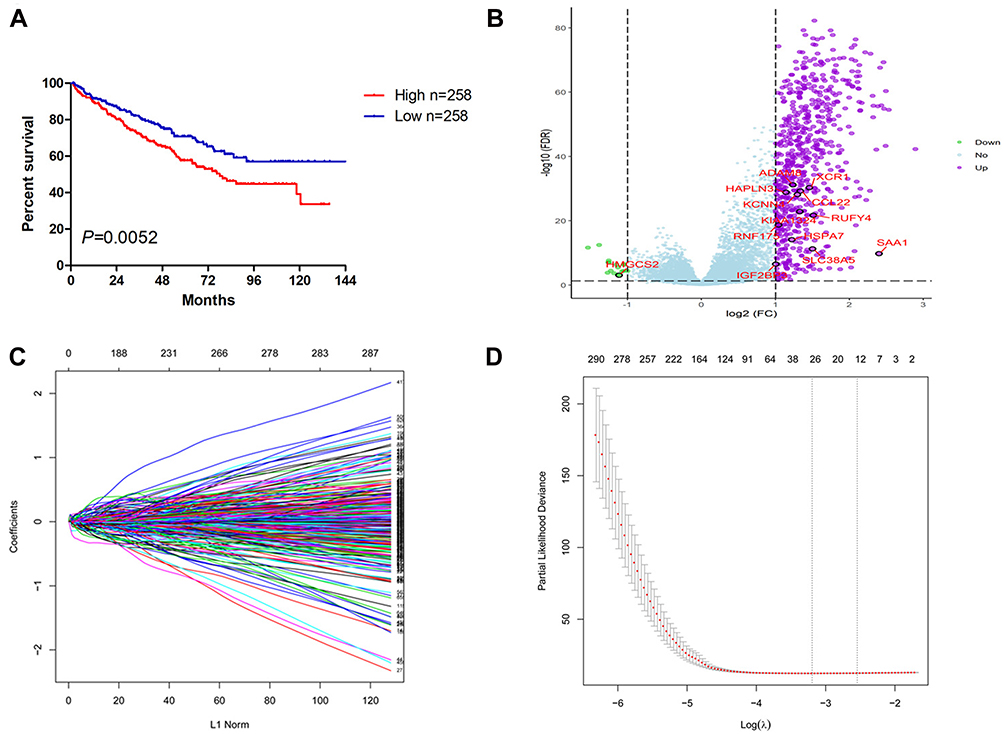 |
Figure 1 Establishment of 13-gene signature for predicting OS of ccRCC by LASSO Cox regression. (A) The OS of the ccRCC cases with high or low immune scores. (B) Volcano plot of the differentially expressed genes between high and low immune scores group. (C) Plot of LASSO coefficient profiles. (D) Tuning parameter (λ) selection by LASSO COX regression. The right line indicated the optimal values by 1-SE criteria (λ = 0.08462639). Abbreviations: OS, overall survival; ccRCC, clear cell renal cell carcinoma; LASSO, least absolute shrinkage and selection operator. |
Construction of the 13-Gene Signature
The different survival outcome between two immune score groups is likely due to specific genes that are individually prognostic. We next interrogated the DEGs and found that 646 genes were upregulated and 17 genes were downregulated in the high score group (Figure 1B). Based on the LASSO coefficient profiles (Figure 1C) and the optimal tuning parameter (λ) selection (Figure 1D), 13 proper prognostic genes were identified. We also calculated a risk score for each patient based on expression levels of the 13 genes: risk score= (0.00584982 * SAA1) + (0.007608843* RNF175) + (0.013763207* HAPLN3) + (0.003946609 * HSPA7) + (0.104656674* KCNN4) + (0.082898449 * IGF2BP3) + (0.041015488 * KIAA1324) + (0.088260753 * ADAM8) + (0.022832287 * RUFY4) + (0.013285373 * SLC38A5) - (0.071383608 * CCL22) - (0.072341601 * XCR1) - (0.003586804 * HMGCS2). All of the individual gene of the signature were significantly associated with ccRCC patients’ OS (Supplemental Figure 1).
Prognostic Value of the 13-Gene Signature
The distribution of risk score and survival status of each patient is shown in Figure 2A and B. Patients were divided into the high-risk and low-risk groups by using the median risk score as the cutoff value. Compared with patients in the low-risk group, patients in the high-risk group had a significantly shorter OS (Figure 2C). For validation, 90 ccRCC cases were downloaded from the ICGC RECA-EU project. Similarly, the OS of patients in the high-risk group was worse than that in the low-risk group (Figure 2D). ROC curves were generated to evaluate the prognostic accuracy of the risk score. The area under curves (AUC) were 0.772 and 0.616 at 5 years for TCGA (Figure 2E) and ICGC project (Figure 2F), respectively.
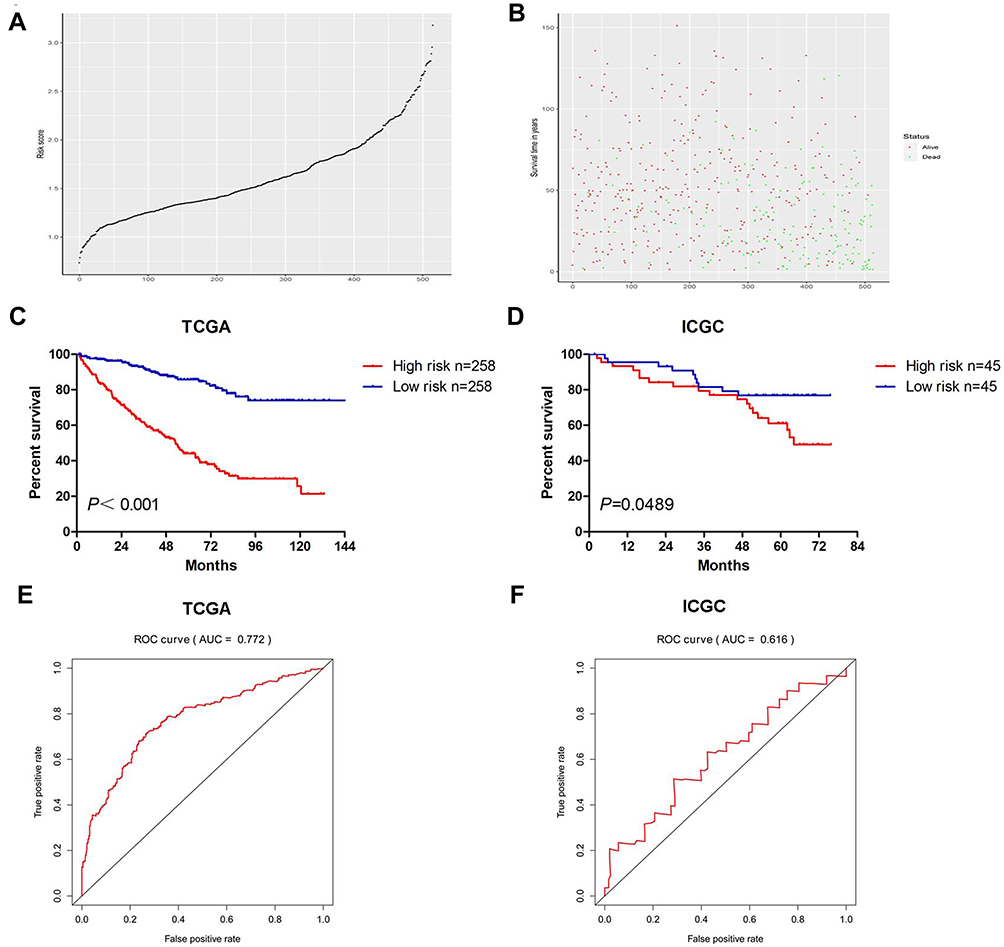 |
Figure 2 The risk scores distribution (A), survival status (B), Kaplan–Meier plot of OS (C) and ROC curve (E) of the signature for ccRCC cases in TCGA. The Kaplan–Meier plot of OS (D) and ROC curve (F) of the signature for ccRCC cases in ICGC. |
Subgroup Analysis
Then, we stratified patients of different TNM stages and grades into different risk subgroups by using the corresponding median risk score as the cutoff value. Presented in Figure 3 are the results of analyses to evaluate whether the 13-gene signature had prognostic value in different subgroups. As shown, the high-risk patients at age higher or lower than 60 (Figure 3A and B), male or female (Figure 3C and D), with low or high grade (Figure 3E and F), with early or advanced TNM stage (Figure 3G and H), had shorter survival compared with low-risk patients.
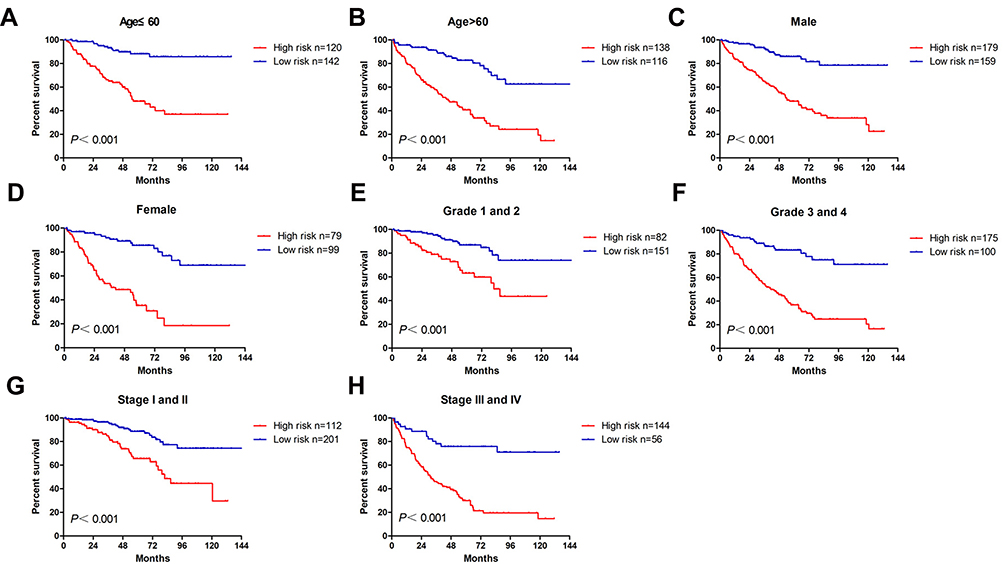 |
Figure 3 The OS analysis of the signature for ccRCC cases in subgroups with different clinicopathological characters. The cases were stratified into the subgroups including age ≤60 (A), age >60 (B), male (C), female (D), T1-T2 stage (E), T3-T4 stage (F), stages I–II (G), stages III–IV (H). |
Independence Analysis and Survival Prediction of 13-Gene Signature
To examine whether the 13-gene signature was an independent prognostic factor for ccRCC patients, we conducted a multivariate Cox regression analysis by adjusting other clinicopathological parameters. We found that the risk group was an independent prognostic factor for OS, with the HR being 3.37 (P < 0.001). Additionally, age, stage and grade remained independent prognostic factors (Table 1). A nomogram that incorporated 13-gene signature with age, stage and grade was developed for the prediction of 3-year, 5-year and 10-year OS (Figure 4). The concordance index (C-index) for the model was 0.77.
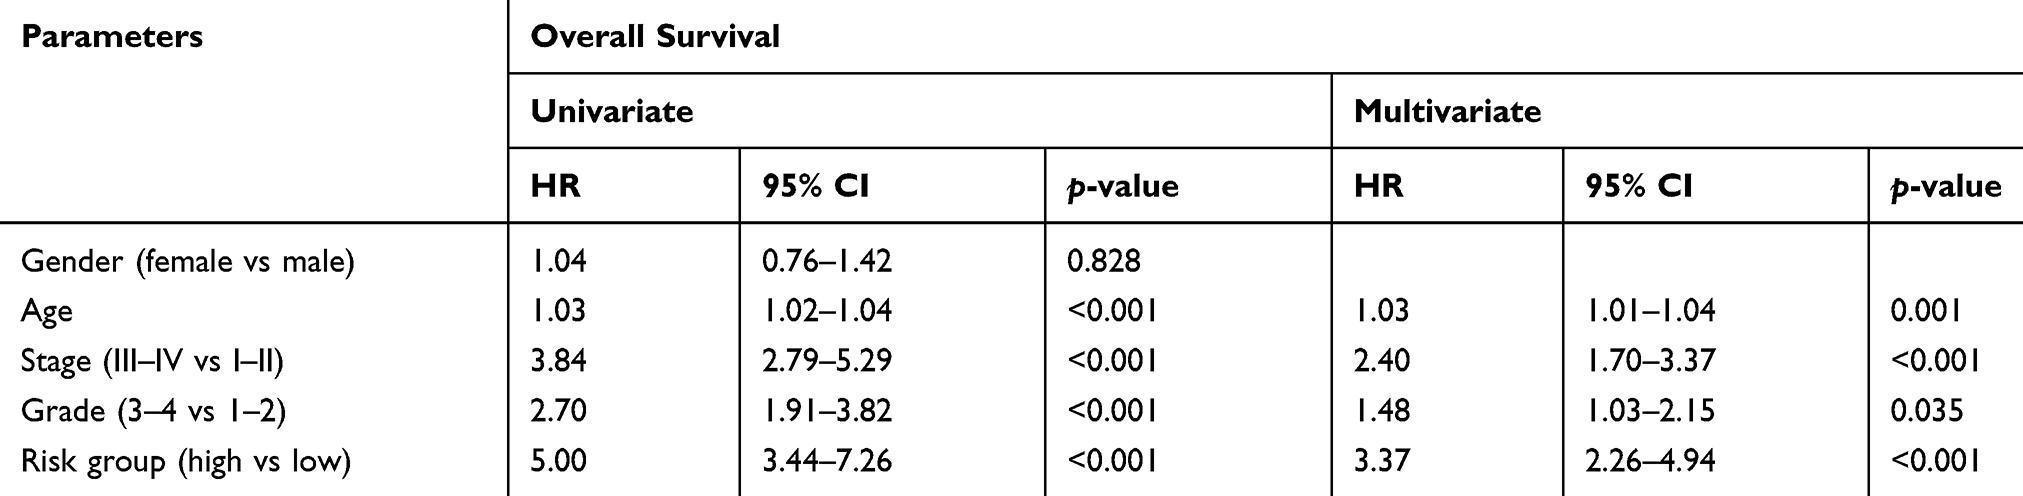 |
Table 1 The Univariate and Multivariate Cox Regression Analyses of ccRCC Patients |
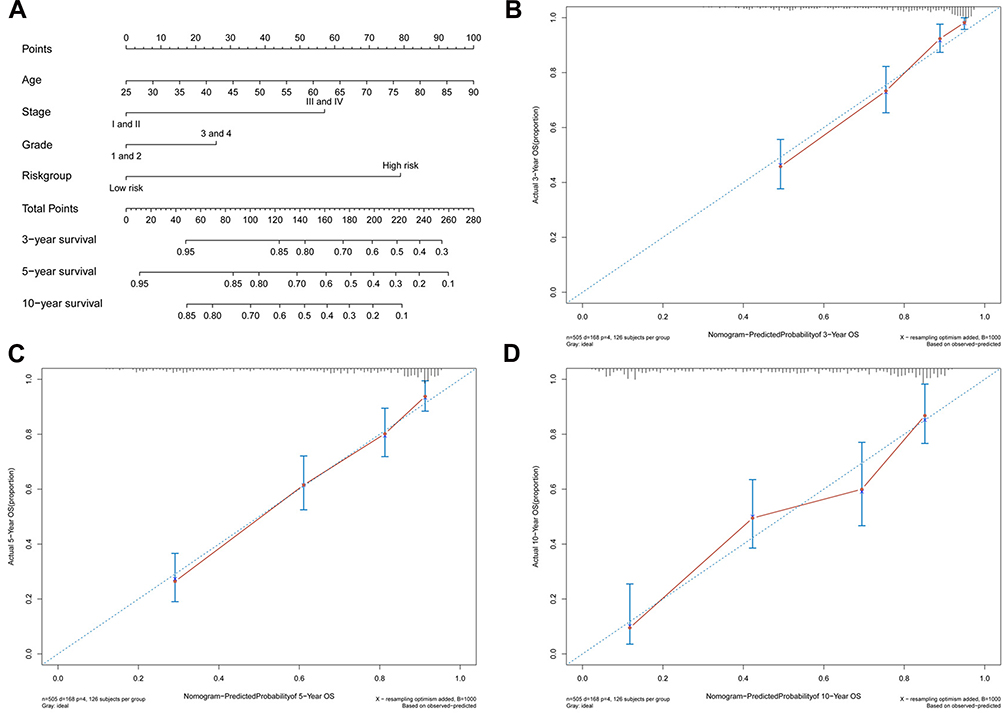 |
Figure 4 Generation of a nomogram for predicting survival probability of ccRCC cases at 3, 5 and 10 year (A). Calibration curve for the nomogram when predicting 3 (B), 5 (C) and 10 (D) year OS. |
The Correlation of 13-Gene Signature and the Abundance of Immune Infiltrates
To assess whether the 13-gene signature has the potentiality to reflect the status of the tumor immune microenvironment, we estimated the abundance of immune infiltrates for six immune cell types (B cell, T cell.CD4, T cell.CD8, neutrophil, macrophage and dendritic cell) in ccRCC patients through TIMER algorithm. Figure 5A shows the distribution of six immune cell types in ccRCC patients. The abundance of most immune cell fractions varied less between different samples. Based on the TIMER algorithm, the abundance of B cell, T cell.CD4, T cell.CD8, Macrophage and DC fractions were distributed between 0.079–0.143, 0.080–0.159, 0.137–0.242, 0.088–0.149, 0.027–0.076 and 0.444–0.520, respectively. Among 13 genes, most of the genes were positively correlated with the abundance of immune infiltrates evaluated by TIMER (Supplemental Figure 2). By pearson correlation analysis, the risk score generated by the 13-gene signature was positively correlated with the infiltration level of B cell (r=0.29, P<0.001), T cell.CD4 (r=0.24, P<0.001), neutrophil (r=0.32, P<0.001) and dendritic cell (DC, r=0.29, P<0.001), but negatively correlated with macrophage (r=−0.13, P=0.004) and not correlated with T cell. CD8 (r=0.05, P=0.221) (Figure 5B). Similar to the correlation analysis results, patients in the high-risk group had significantly higher infiltration levels of B cell, T cell.CD4, neutrophil and DC, and significantly lower abundance of macrophage but no difference in T cell.CD8 (Figure 5C). Next, we explored the prognosis value of 6 immune cell types. In order to better clarify the impacts of the immune cell fractions differences on the survival of ccRCC patients, we selected the top 25% and bottom 25% of each cell fractions for prognostic analysis. In accordance with the positive correlation of risk score and neutrophil infiltration level, patients with a high abundance of neutrophil infiltration have shorter OS than those with low abundance (Figure 5D). Additionally, patients with high infiltration level of B cell or low infiltration level of macrophage tended to have worsened survival than those with contrary infiltration level although there was no statistical significance (Figure 5D). These results indicated the different status of tumor immune microenvironment between the gene signature stratified risk groups, which might help explain their different prognoses.
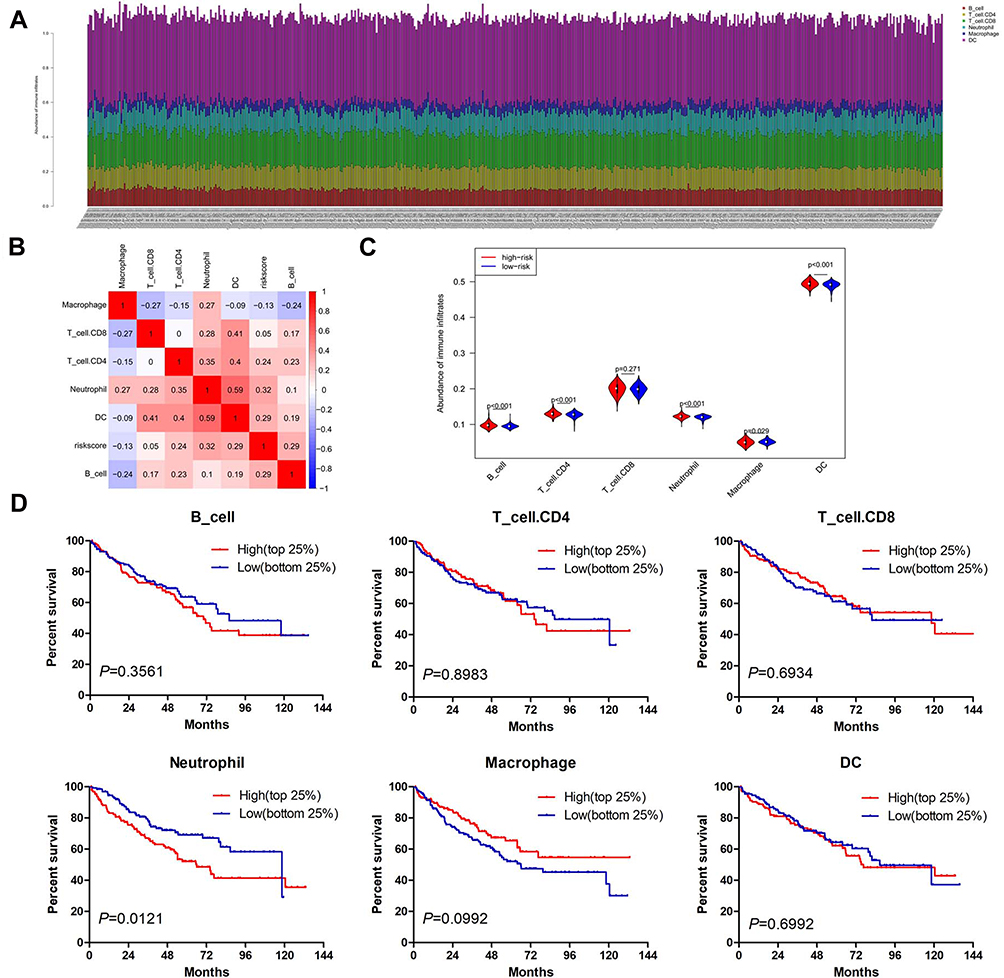 |
Figure 5 The infiltration abundance of six immune cell types in ccRCC cases. (A) The infiltration abundance of six immune cell types in high- and low-risk patients. (B) Correlation matrix of risk score and six immune cell types. (C) Vioplot showing the immune cell infiltration status between high- and low-risk groups. The red and blue color represents the high- and low-risk group, respectively. (D) The OS analysis of ccRCC cases with top 25% (n=129) and bottom 25% (n=129) infiltration level of 6 immune cell types. Abbreviation: DC, dendritic cell. |
Silencing XCR1 Promotes ccRCC Cell Proliferation
Among 13 genes, XCR1 had the highest correlation with the abundance of Dendritic Cell, Neutrophil, B Cell and Macrophage infiltration (see Supplemental Figure 2M). Additionally, XCR1 was screened out as a hub gene by protein–protein interaction (PPI) network analysis of DEGs related to the ccRCC microenvironment,15 which aroused our interest to explore the potential function of XCR1 on ccRCC. By using the starBase database (http://starbase.sysu.edu.cn), the expression of XCR1 was found to be significantly up-regulated in ccRCC compared with the normal samples based on TCGA project (Figure 6A). As shown in Figure 6B, in vitro experiments also indicated that compared with the normal HK2 cell, XCR1 expression was significantly increased in human renal cancer cell lines (786-O and Caki-1). In order to explore the function of XCR1, we designed three siRNAs to knockdown the expression of XCR1 in 786-O and Caki-1 cells. The results showed that all of the siRNAs could significantly decrease the mRNA and protein levels of XCR1 in 786-O and Caki-1 cells and the second siRNA (siXCR1-2) obtained the best effects (Figure 6C and D). Thus, we used the siXCR1-2 for the following experiments. CCK-8 assays demonstrated that knockdown of XCR1 could enhance the proliferation of 786-O and Caki-1 cells, indicating the inhibitory role of XCR1 on ccRCC cell viability (Figure 6E).
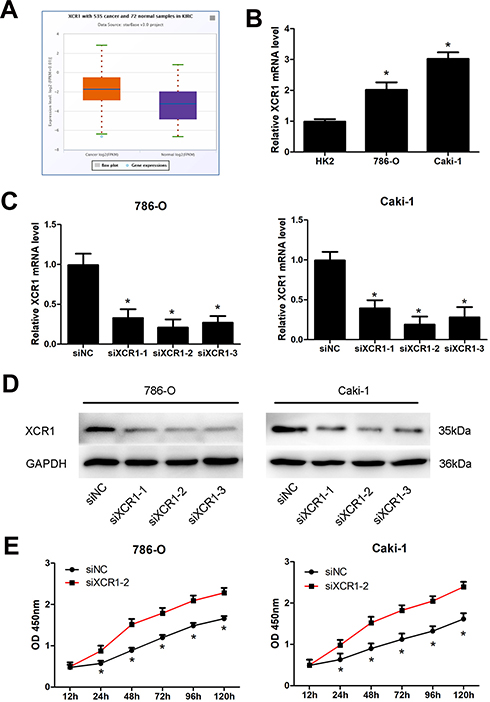 |
Figure 6 Knockdown of XCR1 promotes ccRCC cell proliferation. (A) Expression of XCR1 in TCGA ccRCC and normal samples by using the starBase database. (B) Expression of XCR1 in normal HK2 cell and ccRCC cells. (C) XCR1 mRNA level in ccRCC cells after transfection with three different siRNAs. (D) XCR1 protein level in ccRCC cells after transfection with three different siRNAs. (E) Proliferation of ccRCC cells with XCR1 siRNA transfection at the indicated time. Note: *Represents comparing with the control group, p value<0.05. Abbreviations: siNC, siRNA negative control; siXCR1, XCR1 siRNA. |
Discussion
ccRCC is a heterogeneous kidney malignancy caused by various kinds of factors.16–19 Accumulating evidence has demonstrated that the tumor microenvironment plays a vital role in the development and progression of ccRCC.20 In this study, we utilized the ESTIMATE algorithm-derived immune scores to screen out the most relevant prognostic microenvironment-related genes for ccRCC in TCGA datasets. The signature consisting of 13 genes would be of great value in predicting the ccRCC patients’ OS and may advance our understanding of the tumor microenvironment during the pathogenesis of ccRCC.
The present study showed a prognostic gene signature established by the LASSO Cox regression model. Based on the gene signature, the ccRCC patients could be divided into high- and low-risk groups according to the expression status of 13 genes. The high-risk group had poorer survival outcomes in both TCGA and ICGC cohorts, indicating that this 13-gene signature is able to provide a valuable prognostic tool for ccRCC patients. Due to the limited sample size (90 cases), the difference between the high and low-risk group in the ICGC cohort was not as significant as the TCGA cohort (516 cases). Moreover, multivariate Cox regression analyses showed this gene signature could serve as an independent prognostic factor for the prediction of ccRCC patients’ survival. A nomogram was also constructed by integrating the gene signature with age, grade and stage and the C-index indicated that the nomogram has a favorable prognostic power. Thus, this gene signature incorporated nomogram would facilitate the individualized and accurate prediction for the prognosis of ccRCC patients.
Each individual gene of the signature was significantly associated with ccRCC patients’ OS. Among these genes, most of whose high expression were correlated with the poor survival of ccRCC, suggesting that most of these genes may play oncogenic roles. For example, serum amyloid A 1 (SAA1) was found to be upregulated in conventional RCCs and correlated with the poor clinical outcome of the disease.21 Although the function of some genes have not been depicted in ccRCC, several genes have been demonstrated to be involved in the progress of other types of cancer. For instance, dendritic cells expressing the XCR1 chemokine receptor, excel in the presentation of extracellular antigen to CD8(+) T cells, and thus enhance cytotoxic T-cell activity to induce potent anti-melanoma tumor responses.22 It was reported that compared to non-tumor samples, insulin-like growth factor 2 mRNA binding protein 3 (IGF2BP3) is significantly upregulated in gastric cancer tissues and IGF2BP3 knockdown significantly inhibits cell proliferation and invasion.23 Moreover, overexpression of 3-Hydroxymethylglutaryl-CoA synthase 2 (HMGCS2) increases the intracellular ketone level and inhibits hepatocellular carcinoma (HCC) cell proliferation and migration.24
In this study, the infiltration levels of most immune cell types were significantly different between high- and low-risk groups. We found that the risk score has the highest correlation with the abundance of neutrophil infiltration. Especially, in the prognosis evaluation of six immune cell types, only the patients with a high abundance of neutrophil infiltration had shorter OS than those with low abundance. There exits chronic inflammation in tumors with a large number of neutrophil infiltrations. In the tumor microenvironment, neutrophils are classified into N1/N2 neutrophils.25 In the early stage of tumorigenesis, the neutrophil type is mainly N1 type. N1 type neutrophils have the antitumor function by secreting type I interferon and IL18 for NK cell activation. In the process of tumor development, N2 neutrophils are constantly increasing. N2 neutrophils secrete molecules such as reactive oxygen species, arginase and peroxidase, inhibit the function of T cells and NK cells, and promote tumor progression.26 These findings might help explain the poor prognosis of high-risk patients in this study. A recent study also demonstrated that the recurrence of ccRCC following surgery was associated with higher neutrophil gene expression.27 The different abundance of some immune cell fractions, such as T_cell.CD4 and T_cell.CD8, were not found to be associated with the prognosis of ccRCC patients, which has also been confirmed in a previous study.28 Correlation analysis showed that there is a positive or negative correlation between some immune cell fractions, suggesting that there may exist interactions between immune cells. These immune cells may potentially form an integrated regulatory network rather than a single cell fraction that acts on the tumor microenvironment to regulate the development of ccRCC and finally affects the patients’ prognosis.
A bioinformatic analysis study predicted XCR1 is a hub gene by PPI network analysis of DEGs associated with the ccRCC microenvironment,15 which prompted us to explore the potential role of XCR1 in ccRCC. As one of the members of the chemokine receptor family, lymphotactin receptor XCR1 has been demonstrated to participate in regulating the tumor microenvironment and tumor progression.29 In the present study, we found that the expression of XCR1 is significantly upregulated in TCGA ccRCC samples, and low XCR1 expression is associated with poor prognosis of ccRCC patients. We also observed that XCR1 is increased in the ccRCC cells and silencing XCR1 promotes cell proliferation, which is the first report about the function of XCR1 on ccRCC. A previous study also demonstrated that XCR1 inhibits HCC cell proliferation and tumor growth.30 These findings indicate that modulating the XCR1 expression and utilizing the gene target therapy to combat ccRCC would be considered as an attractive therapeutic strategy.
Conclusion
This study constructs a 13-gene signature based on immune scores for the prognosis prediction of ccRCC patients. It could serve as an independent prognostic factor and immune status indicator for ccRCC. Among 13 genes, XCR1 exerts an inhibitory effect on ccRCC cell proliferation. These results provide us with a clue for better understanding the tumor microenvironment and developing the therapeutic option. Further detailed molecular mechanisms of XCR1 involved in the ccRCC progression are required to be elucidated in future study.
Acknowledgment
This study was supported by the Outstanding Youths Development Scheme of Nanfang Hospital, Southern Medical University (grant no. 2019J006 and 2019J004), President Foundation of Nanfang Hospital, Southern Medical University (grant no. 2018C001), Natural Science Foundation of Guangdong Province of China (grant no. 2019A1515011652) and National Natural Science Foundation of China (grant No. 81903132).
Disclosure
The authors declare that they have no conflicts of interest in this work.
References
1. Jin Z, Xu N, Guo K, et al. Increased expression of metastasis-associated in colon cancer-1 in renal cell carcinoma is associated with poor prognosis. Int J Clin Exp Pathol. 2015;8(4):3857–3863.
2. Li C, Cen D, Liu Z, Liang C. Presence of intratumoral calcifications and vasculature is associated with poor overall survival in clear cell renal cell carcinoma. J Comput Assist Tomogr. 2018;42(3):418–422. doi:10.1097/RCT.0000000000000704
3. Ricketts CJ, De Cubas AA, Fan H, et al. The cancer genome atlas comprehensive molecular characterization of renal cell carcinoma. Cell Rep. 2018;23(12):3698. doi:10.1016/j.celrep.2018.06.032
4. Cheng J, Zhang J, Han Y, et al. Integrative analysis of histopathological images and genomic data predicts clear cell renal cell carcinoma prognosis. Cancer Res. 2017;77(21):e91–e100. doi:10.1158/0008-5472.CAN-17-0313
5. Linehan WM, Ricketts CJ. The cancer genome atlas of renal cell carcinoma: findings and clinical implications. Nat Rev Urol. 2019;16(9):539–552. doi:10.1038/s41585-019-0211-5
6. Zhao L, Liu Y, Sun X, He M, Ding Y. Overexpression of T lymphoma invasion and metastasis 1 predict renal cell carcinoma metastasis and overall patient survival. J Cancer Res Clin Oncol. 2011;137(3):393–398. doi:10.1007/s00432-010-0895-7
7. Miao D, Margolis CA, Gao W, et al. Genomic correlates of response to immune checkpoint therapies in clear cell renal cell carcinoma. Science. 2018;359(6377):801–806. doi:10.1126/science.aan5951
8. Xie G, Gu D, Zhang L, Chen S, Wu D. A rapid and systemic complete response to stereotactic body radiation therapy and pembrolizumab in a patient with metastatic renal cell carcinoma. Cancer Biol Ther. 2017;18(8):547–551. doi:10.1080/15384047.2017.1345389
9. Zhang X, Shi X, Li J, et al. Combination immunotherapy with interleukin-2 surface-modified tumor cell vaccine and programmed death receptor-1 blockade against renal cell carcinoma. Cancer Sci. 2019;110(1):31–39. doi:10.1111/cas.13842
10. Yoshihara K, Shahmoradgoli M, Martinez E, et al. Inferring tumour purity and stromal and immune cell admixture from expression data. Nat Commun. 2013;4(1):2612. doi:10.1038/ncomms3612
11. Chen G, Dong Z, Wu D, Chen Y. Profiles of immune infiltration in lung adenocarcinoma and their clinical significant: a gene-expression-based retrospective study. J Cell Biochem. 2020. doi:10.1002/jcb.29667
12. Zhang Z, Lin E, Zhuang H, et al. Construction of a novel gene-based model for prognosis prediction of clear cell renal cell carcinoma. Cancer Cell Int. 2020;20(1):27. doi:10.1186/s12935-020-1113-6
13. Pan Q, Wang L, Zhang H, Liang C, Li B. Identification of a 5-gene signature predicting progression and prognosis of clear cell renal cell carcinoma. Med Sci Monit. 2019;25:4401–4413. doi:10.12659/MSM.917399
14. Li B, Severson E, Pignon JC, et al. Comprehensive analyses of tumor immunity: implications for cancer immunotherapy. Genome Biol. 2016;17(1):174. doi:10.1186/s13059-016-1028-7
15. Chen B, Chen W, Jin J, Wang X, Cao Y, He Y. Data mining of prognostic microenvironment-related genes in clear cell renal cell carcinoma: a study with TCGA database. Dis Markers. 2019;2019:8901649. doi:10.1155/2019/8901649
16. Li C, Shu F, Lei B, Lv D, Zhang S, Mao X. Expression of PGAM1 in renal clear cell carcinoma and its clinical significance. Int J Clin Exp Pathol. 2015;8(8):9410–9415.
17. Ge Y, Xu A, Zhang M, et al. FK506 binding protein 10 is overexpressed and promotes renal cell carcinoma. Urol Int. 2017;98(2):169–176. doi:10.1159/000448338
18. Zhang X, Li P, Ding Z, et al. The putative tumor suppressor, miR-199a, regulated by snail, modulates clear cell renal cell carcinoma aggressiveness by repressing ROCK1. Onco Targets Ther. 2018;11:103–112. doi:10.2147/OTT.S147184
19. Cai Y, Zhang M, Qiu X, et al. Upregulation of FBXW7 suppresses renal cancer metastasis and epithelial mesenchymal transition. Dis Markers. 2017;2017:8276939. doi:10.1155/2017/8276939
20. Senbabaoglu Y, Gejman RS, Winer AG, et al. Tumor immune microenvironment characterization in clear cell renal cell carcinoma identifies prognostic and immunotherapeutically relevant messenger RNA signatures. Genome Biol. 2016;17(1):231. doi:10.1186/s13059-016-1092-z
21. Paret C, Schon Z, Szponar A, Kovacs G. Inflammatory protein serum amyloid A1 marks a subset of conventional renal cell carcinomas with fatal outcome. Eur Urol. 2010;57(5):859–866. doi:10.1016/j.eururo.2009.08.014
22. Terhorst D, Fossum E, Baranska A, et al. Laser-assisted intradermal delivery of adjuvant-free vaccines targeting XCR1+dendritic cells induces potent antitumoral responses. J Immunol. 2015;194(12):5895–5902. doi:10.4049/jimmunol.1500564
23. Zhou Y, Huang T, Siu HL, et al. IGF2BP3 functions as a potential oncogene and is a crucial target of miR-34a in gastric carcinogenesis. Mol Cancer. 2017;16(1):77. doi:10.1186/s12943-017-0647-2
24. Wang YH, Liu CL, Chiu WC, Twu YC, Liao YJ. HMGCS2 mediates ketone production and regulates the proliferation and metastasis of hepatocellular carcinoma. Cancers. 2019;11(12):1876. doi:10.3390/cancers11121876
25. Giese MA, Hind LE, Huttenlocher A. Neutrophil plasticity in the tumor microenvironment. Blood. 2019;133(20):2159–2167. doi:10.1182/blood-2018-11-844548
26. Zhou J, Nefedova Y, Lei A, Gabrilovich D. Neutrophils and PMN-MDSC: their biological role and interaction with stromal cells. Semin Immunol. 2018;35:19–28. doi:10.1016/j.smim.2017.12.004
27. Ghatalia P, Gordetsky J, Kuo F, et al. Prognostic impact of immune gene expression signature and tumor infiltrating immune cells in localized clear cell renal cell carcinoma. J Immunother Cancer. 2019;7(1):139. doi:10.1186/s40425-019-0621-1
28. Pan Q, Wang L, Chai S, Zhang H, Li B. The immune infiltration in clear cell renal cell carcinoma and their clinical implications: a study based on TCGA and GEO databases. J Cancer. 2020;11(11):3207–3215. doi:10.7150/jca.37285
29. Kim M, Rooper L, Xie J, et al. The lymphotactin receptor is expressed in epithelial ovarian carcinoma and contributes to cell migration and proliferation. Mol Cancer Res. 2012;10(11):1419–1429. doi:10.1158/1541-7786.MCR-12-0361
30. Yanru W, Zhenyu B, Zhengchuan N, Qi Q, Chunmin L, Weiqiang Y. Transcriptomic analyses of chemokines reveal that down-regulation of XCR1 is associated with advanced hepatocellular carcinoma. Biochem Biophys Res Commun. 2018;496(4):1314–1321. doi:10.1016/j.bbrc.2018.02.008
 © 2020 The Author(s). This work is published and licensed by Dove Medical Press Limited. The full terms of this license are available at https://www.dovepress.com/terms.php and incorporate the Creative Commons Attribution - Non Commercial (unported, v3.0) License.
By accessing the work you hereby accept the Terms. Non-commercial uses of the work are permitted without any further permission from Dove Medical Press Limited, provided the work is properly attributed. For permission for commercial use of this work, please see paragraphs 4.2 and 5 of our Terms.
© 2020 The Author(s). This work is published and licensed by Dove Medical Press Limited. The full terms of this license are available at https://www.dovepress.com/terms.php and incorporate the Creative Commons Attribution - Non Commercial (unported, v3.0) License.
By accessing the work you hereby accept the Terms. Non-commercial uses of the work are permitted without any further permission from Dove Medical Press Limited, provided the work is properly attributed. For permission for commercial use of this work, please see paragraphs 4.2 and 5 of our Terms.