")
Back to Journals » Neuropsychiatric Disease and Treatment » Volume 11
Connectomics in psychiatric research: advances and applications
Received 23 April 2015
Accepted for publication 20 August 2015
Published 29 October 2015 Volume 2015:11 Pages 2801—2810
DOI https://doi.org/10.2147/NDT.S63470
Checked for plagiarism Yes
Review by Single anonymous peer review
Peer reviewer comments 2
Editor who approved publication: Professor Wai Kwong Tang
Miao Cao,* Zhijiang Wang,* Yong He
State Key Laboratory of Cognitive Neuroscience and Learning and IDG/McGovern Institute for Brain Research, Beijing Normal University, Beijing, People’s Republic of China
*These authors contributed equally to this work
Abstract: Psychiatric disorders disturb higher cognitive functions and severely compromise human health. However, the pathophysiological mechanisms underlying psychiatric disorders are very complex, and understanding these mechanisms remains a great challenge. Currently, many psychiatric disorders are hypothesized to reflect “faulty wiring” or aberrant connectivity in the brains. Imaging connectomics is arising as a promising methodological framework for describing the structural and functional connectivity patterns of the human brain. Recently, alterations of brain networks in the connectome have been reported in various psychiatric disorders, and these alterations may provide biomarkers for disease diagnosis and prognosis for the evaluation of treatment efficacy. Here, we summarize the current achievements in both the structural and functional connectomes in several major psychiatric disorders (eg, schizophrenia, attention-deficit/hyperactivity disorder, and autism) based on multi-modal neuroimaging data. We highlight the current progress in the identification of these alterations and the hypotheses concerning the aberrant brain networks in individuals with psychiatric disorders and discuss the research questions that might contribute to a further mechanistic understanding of these disorders from a connectomic perspective.
Keywords: psychiatric disorders, connectome, graph theory, functional connectivity, structural connectivity
Introduction
Connectomics, which is conceptualized as the mapping of the organization and the complete interactions of all neural elements in the brain, is currently a popular framework for studying brain structure and function.1–3 Based on advances in in vivo neuroimaging techniques (eg, functional magnetic resonance imaging [fMRI], structural magnetic resonance imaging [sMRI], and diffusion magnetic resonance imaging [dMRI]), the network of the brain, or the connectome, has been widely mapped as a collection of nodes (neurons or brain regions) and edges (neural connections or pathways). Modern graph theory and complex network can be applied to detect and quantify the topological features of large-scale connectomes.4–7 A number of nontrivial features of brain connectomes have been revealed, such as its efficient small-world architecture, the presence of densely connected communities or modules of brain regions, and the existence of highly connected and highly central network hubs.8 A wealth of evidence indicates that these organizational principles are not only correlated with behavioral function and cognitive ability8–12 but are also disturbed in brain disorders.13–15
Impairment of higher cognitive function is a key feature of psychiatric disorders, which severely compromise the well-being of affected individuals in modern society and which negatively impacts general health. Psychiatric disorders can have an early onset (eg, autism in childhood and schizophrenia in young adulthood) or a relapsing–remitting course (as in depression and anxiety disorders and obsessive–compulsive disorder), and these disorders often involve disabling symptoms.16 According to statistics from the World Health Organization (www.who.int), these disorders have a relatively high prevalence and exert a heavy burden on both individuals and society. Although the psychological mechanisms of psychiatric diseases have attracted significant attention, the objective delineation of the pathophysiological mechanisms underlying these diseases remains a great and perennial challenge. Moreover, identifying biomarkers that would be valuable for informing clinical diagnosis, monitoring disease progression, and evaluating treatment effects is especially difficult. Recently, a new concept termed pathoconnectomics, reflecting an extension of connectomics to the psychiatric field, has been proposed as a framework for the study of brain dysfunction in psychiatric disorders in which the corresponding abnormal brain networks are mapped.17 Pathoconnectomics assumes that major psychiatric disorders involve abnormalities of brain networks and that understanding the aberrant organization of brain networks is critical for understanding these brain disorders. In this sense, pathoconnectomics requires evidence concerning the disruption of brain networks to serve as a validated scientific and clinical framework that reveals the phenotypes characterizing psychiatric disorders.
In this review, we summarize recent progress in the connectomic analysis of psychiatric disorders using both structural and functional neuroimaging data. First, we introduce several basic concepts of brain connectomics and the relevant graph theory approaches. Then, we summarize the recent findings of large-scale brain connectome studies in three major disorders, ie, schizophrenia, attention deficit/hyperactivity disorder (ADHD), and autism spectrum disorder (ASD). Finally, we briefly discuss the limitations and future considerations of pathoconnectomic analysis in psychiatric populations.
Human connectomics and graph theory
An important goal of human connectomics is to characterize the structural and functional brain connections using advanced neuroimaging technologies, referred to as the concept of “connectome”.2,3,18 Over the last decade, advances in in vivo neuroimaging techniques and computational tools have offered great opportunities to map the structural and functional connections in the human brain at the macro scale for humans. In the present article, we constricted our review to studies using resting-state fMRI, dMRI, or sMRI.
A large-scale brain network, or connectome, is represented by a graph model consisting of nodes, which usually represent imaging voxels or regions of interest, and edges, which represent the functional connectivity or structural connectivity linking nodes, based on different strategies (ie, a broad range of strategies for brain parcellations and interregional connectivity measurements).1,4,19 Briefly, functional connectivity is defined as statistical temporal dependences as demonstrated by synchronous blood oxygen-level dependent neural activity over the distributed brain areas.2 Structural connectivity is defined as dMRI-traced white matter fiber tracts between the regions of interest or covariance in morphologic measures (eg, cortical thickness or gray matter volume) scaled by sMRI across individuals.20,21
Modern graph theory and complex network are then applied to detect and quantify the features of the resultant networks that are relevant to the topological organization of the brain. To date, many important topological properties of complex networks have been characterized, such as small-worldness (ie, the optimal balance of both high local clustering and high global integrity), modular structure (ie, sets of nodes that are highly interconnected but have relatively fewer connections to the others in different modules), and the presence of hubs (ie, topologically centralized nodes) and rich-club structures (ie, a set of densely interconnected hubs).5,7,19,20
Next, we briefly introduce these crucial network measurements from the perspectives of information segregation and integration in the brain networks. Specifically, topological segregation of the brain refers to the information processing among local communities or clusters of nodes that are highly interconnected.19,22 The clustering coefficient and modularity are two frequently used metrics that quantify the localization/specialized processing of brain networks. The clustering coefficient of a node is defined as the number of existing connections among the node’s immediate neighbors divided by all of their possible connections;21 this parameter reflects the extent of cliquishness and is related to local efficiency and fault-tolerance of the network. The modularity is determined by a single statistic of reflecting the ratio of intramodular to intermodular edges; the mathematically optimal modular decomposition of a network is obtained by maximizing this ratio.19 In contrast, integration refers to the efficiency of global information communication or the ability of integrating distributed information in the network.19 The efficiency of global information transfer is usually measured by the characteristic path length of a network, which is the averaged shortest path length of all nodes. The characteristic path length of a network is inversely proportional to the efficiency of parallel information transfer. Alternatively, the ability to integrate distributed information can be scaled based on the existence of network hubs which exhibit high centralities (eg, degree/the number of connections for a node). Importantly, these high-degree or high-central hubs have a strong tendency to be densely interconnected and to form a rich-club structure in the brain organization (Figure 1A), generating a central backbone for global brain communication.22,23 Finally, the attractive architecture of small-world organization, which represents the combination of high clustering and short characteristic path length, could support both high segregated/specialized and highly distributed/integrated information processing.7,24
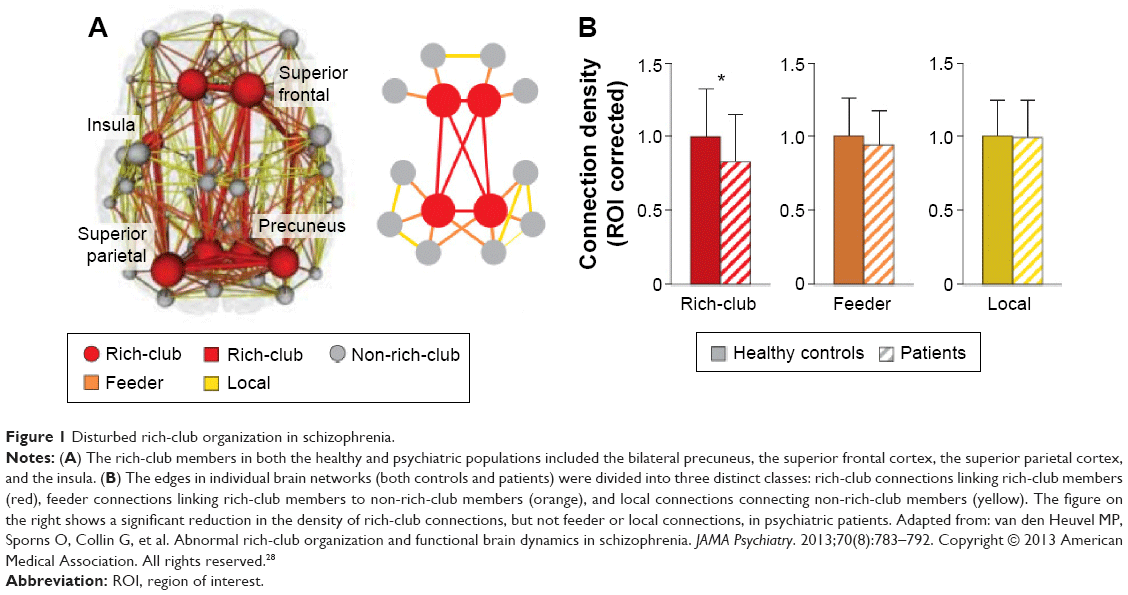 | Figure 1 Disturbed rich-club organization in schizophrenia. |
Connectomics in psychiatric disorders
In this section, we summarize the recently reported abnormalities of both the structural and functional whole-brain connectomes in schizophrenia, ADHD, and ASD. These three disorders constitute a large proportion of the current connectomics literature and are all hypothesized to be developmental disorders.1,14 In addition to the specific alterations in the connectomes of each disorder, the shared and distinct disturbances between these disorders are discussed. Studies focused on the connectome of other psychiatric disorders, such as major depression, can be found in other reviews.13,25
Abnormalities of the connectomes in schizophrenia
Historical hypotheses that schizophrenia is a dysconnectivity disorder have recently been validated by abundant connectomic studies.26 First, reduced whole-brain structural and functional connectivity has been broadly reported.27–29 Regarding the topological abnormalities observed in schizophrenia, as summarized in recent reviews,30–32 the structural connectome in patients tends to follow an overall pattern of network organization that is more segregated, characterized by increased clustering coefficient and modularity, and less integrated, characterized by reduced global efficiency. Additionally, a recent study using diffusion spectral imaging identified a distributed set of brain nodes associated with the disease processes as the affected core of schizophrenia, and the altered function of these nodes may drive the global efficiency loss observed in patients.33 In contrast, the functional topological organization of the brain in schizophrenia showed a randomized tendency, ie, increased global integration but decreased local segregation. Network analysis revealed that the functional networks in schizophrenia patients exhibited less clustered and equally or more distributed communication organization, as demonstrated by reduced clustering and modularity and increased global efficiency compared with healthy controls.27,34,35 Moreover, it has been reported that the changes in the topological properties of the functional networks in schizophrenia patients were associated with a proportional increase in anatomical length (Euclidean distance).36,37 Notably, inconsistent results were reported concerning functional analysis in schizophrenia,38,39 and these discrepancies might be influenced by many factors, such as the use of different analysis methods or heterogeneous patient cohorts; thus, this issue must be clarified further. Analysis of drug effects40 revealed that sulpiride, a drug commonly used for schizophrenia, reduced both global and local efficiency of the functional brain networks of healthy volunteers. This finding might provide insight into pharmacological treatment from the connectomics perspective. Recently, an fMRI study explored the dynamic topological properties of time-varying functional connectivity in schizophrenia and found decreased variance in the dynamic topological parameters, including the strength, clustering coefficient, and global efficiency, indicating that the temporal connectivity patterns could also be altered in schizophrenia.41 In addition to these inconsistent findings in separate studies of structural and functional networks, both increased28 and decreased42 functional–structural coupling have been reported in schizophrenia patients. These results indicate the urgent need for further investigation to explain these observed divergences in structure and function.43
The dysconnectivity observed in schizophrenia also appears to manifest from an abnormal hub organization. A less hub-dominated configuration has been observed in functional and structural schizophrenia connectomes.27,43,44 Specifically, reports have demonstrated that schizophrenia patients exhibit reduced regional centrality in hubs including the frontal association, parietal, limbic, and paralimbic brain areas based on structural studies, and including the frontal, temporal, parietal, limbic, and occipital areas based on functional studies. Recently, van den Heuvel et al found that the structural rich-club organization, a highly interconnected backbone comprising the hub regions, was also disturbed in schizophrenia patients (Figure 1B).28 Their findings indicate that a selective disruption of brain connectivity among central hub regions of the schizophrenic brain may lead to reduced communication capacity and altered functional brain dynamics. Notably, a recent study indicated that the global signal in fMRI data contains critical information relevant to schizophrenia, emphasizing that preprocessing steps should be more carefully performed in further analysis.45
Abnormalities of the connectomes in ADHD
Both structural and functional connectomics studies of ADHD have reported altered connectivity mainly located in the dorsal attention, sensorimotor, default mode network (DMN), and subcortical regions (Figure 2A and B).46–51 Specifically, different changes in connectivity pattern accounted for the two primary symptoms of ADHD: decreased connectivity in prefrontal-dominant circuitry and increased connectivity in orbitofrontal-striatal circuitry were significantly correlated with behavioral scores of inattention and hyperactivity/impulsivity symptoms, respectively, in ADHD patients (Figure 2A and B).48,52 After stratifying the patients into two subgroups (inattentive or combined AHDH) according to their behavioral symptoms, the analysis results provide compelling evidence for the involvement of distinct mechanisms in different behavioral abnormalities.47 The regional degree patterns of the inattentive and combined subgroups displayed similar abnormalities in the sensorimotor regions compared with normal controls. However, the inattention ADHD subgroup exhibited unique atypical patterns in the dorsal lateral prefrontal cortex and the cerebellum, whereas the combined ADHD group exhibited unique patterns in the midline components of the DMN. Moreover, Sripada et al53 found that methylphenidate, a drug commonly used for ADHD, reduced the functional coupling within the visual and somatomotor networks and enhanced the decoupling between the DMN and several task positive networks in healthy human volunteers; these results indicate that methylphenidate may modulate brain connectivity to enhance human attentional function.
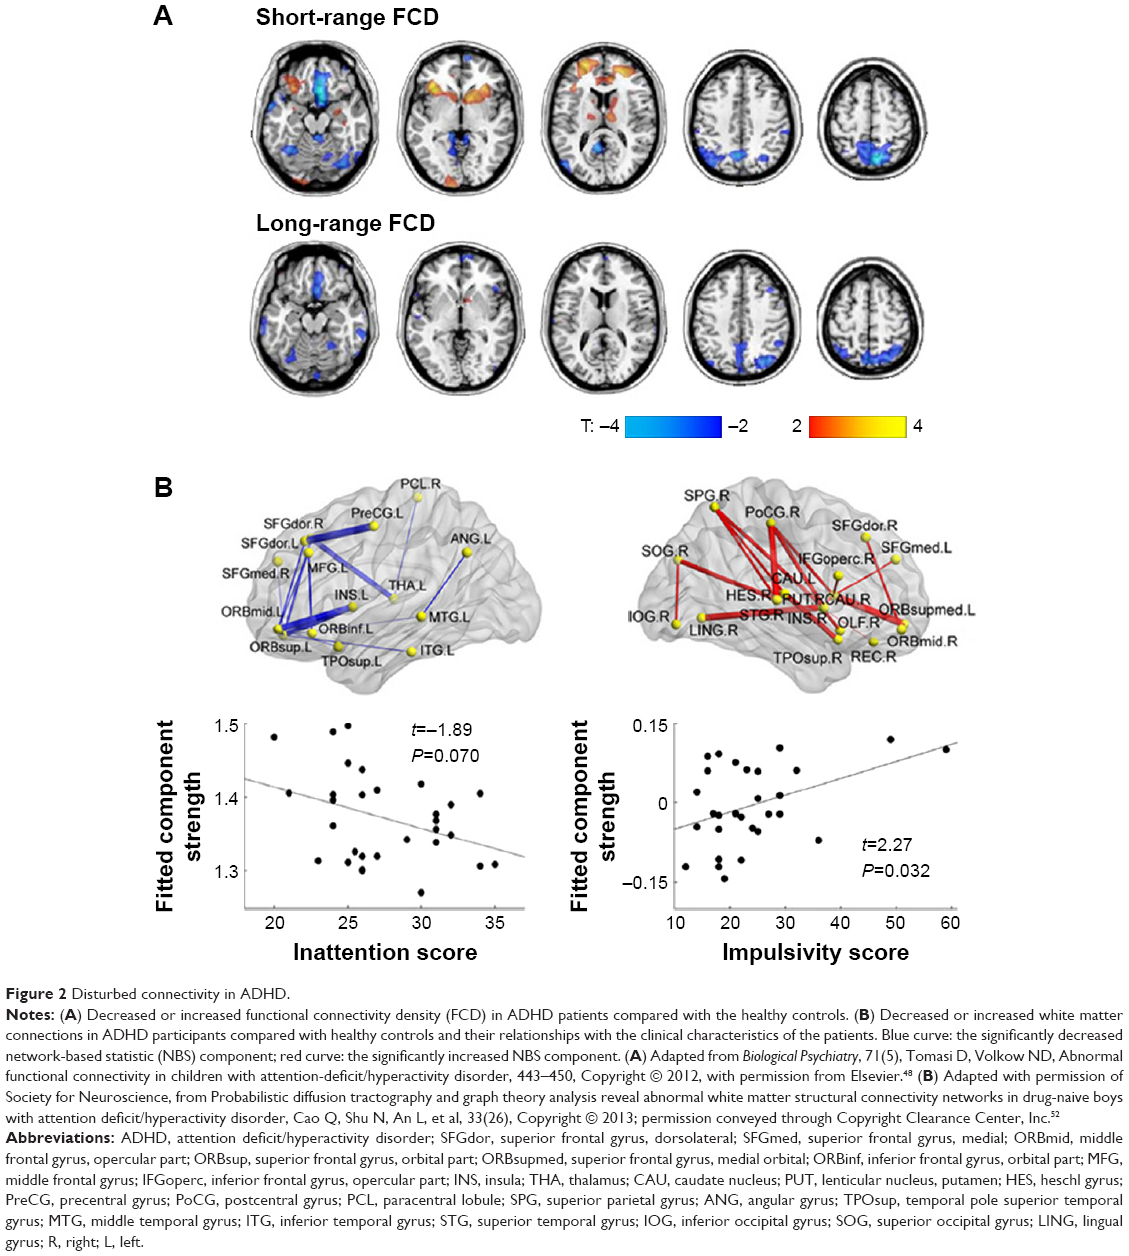 | Figure 2 Disturbed connectivity in ADHD. |
Global topological analyses have revealed reductions in both global integration and local clustering in both structural and functional connectomes, and these findings indicate a regular shift in organizational properties in ADHD patients.52,54–56 Furthermore, an electroencephalogram study reported that compared with controls, ADHD patients exhibited lower global brain network, which was improved (increased global network efficiency) after effective neurofeedback therapies.55 Notably, no functional global topological alterations were observed in ADHD adults, although regional disturbances remained.57 Disrupted hubs have also been found in both functional and structural networks,44,48,49 supporting the conclusion that global integration is disturbed in ADHD.
One popular hypothesis is that wiring abnormalities in the brains of patients with developmental disorders may arise from a dysplastic developmental lesion.14,58 The significantly decreased functional connectivity pattern in the DMN of ADHD patients was found to greatly overlap with the patterns observed developmental dynamics in healthy populations; this result indicates that ADHD is associated with developmental delay.46 Recently, a study tested the hypothesis with subjects aged from 7 to 21 years old to compare the development curves of ADHD and healthy controls.59 The authors found that ADHD children exhibited a lag in the maturation of functional connections both within and between subnetworks. Nevertheless, further studies are needed to obtain structural evidence and to perform comprehensive connectome organization analysis to corroborate this maturation lag theory.
Abnormalities of the connectomes in ASD
The whole-brain network functional analysis findings in ASD relatively consistently show hypoconnectivity in the so-called “social network” encompassing the default mode, attention and executive networks (Figure 3A) and hyperconnectivity in limbic regions (Figure 3B).60–65 Interestingly, altered contributions of nonspecific skin conductance responses, an objective index of sympathetic neural activity, to functional connectivity have been reported in these disturbed regions in ASD patients.64 These findings indicate that abnormal socioemotional behavior in ASD individuals may be correlated with autonomic processing alterations.64 Some models describe the ASD brain connectome as dominated by reduced long-range connections and excessive short-range fibers. In support of these theoretical models, network analysis based on electroencephalogram and magnetoencephalography has revealed a lack of long-range connections and an increase in short-range connections in ADHD patients compared with healthy controls.66,67 Structural analysis also showed disrupted long-range “socioemotional” circuits.68,69 The prefrontal cortex, the key region of the social network, is a commonly targeted region for transcranial magnetic stimulation as a treatment for ASD,70,71 indicating the instructional potential of connectomic analysis.
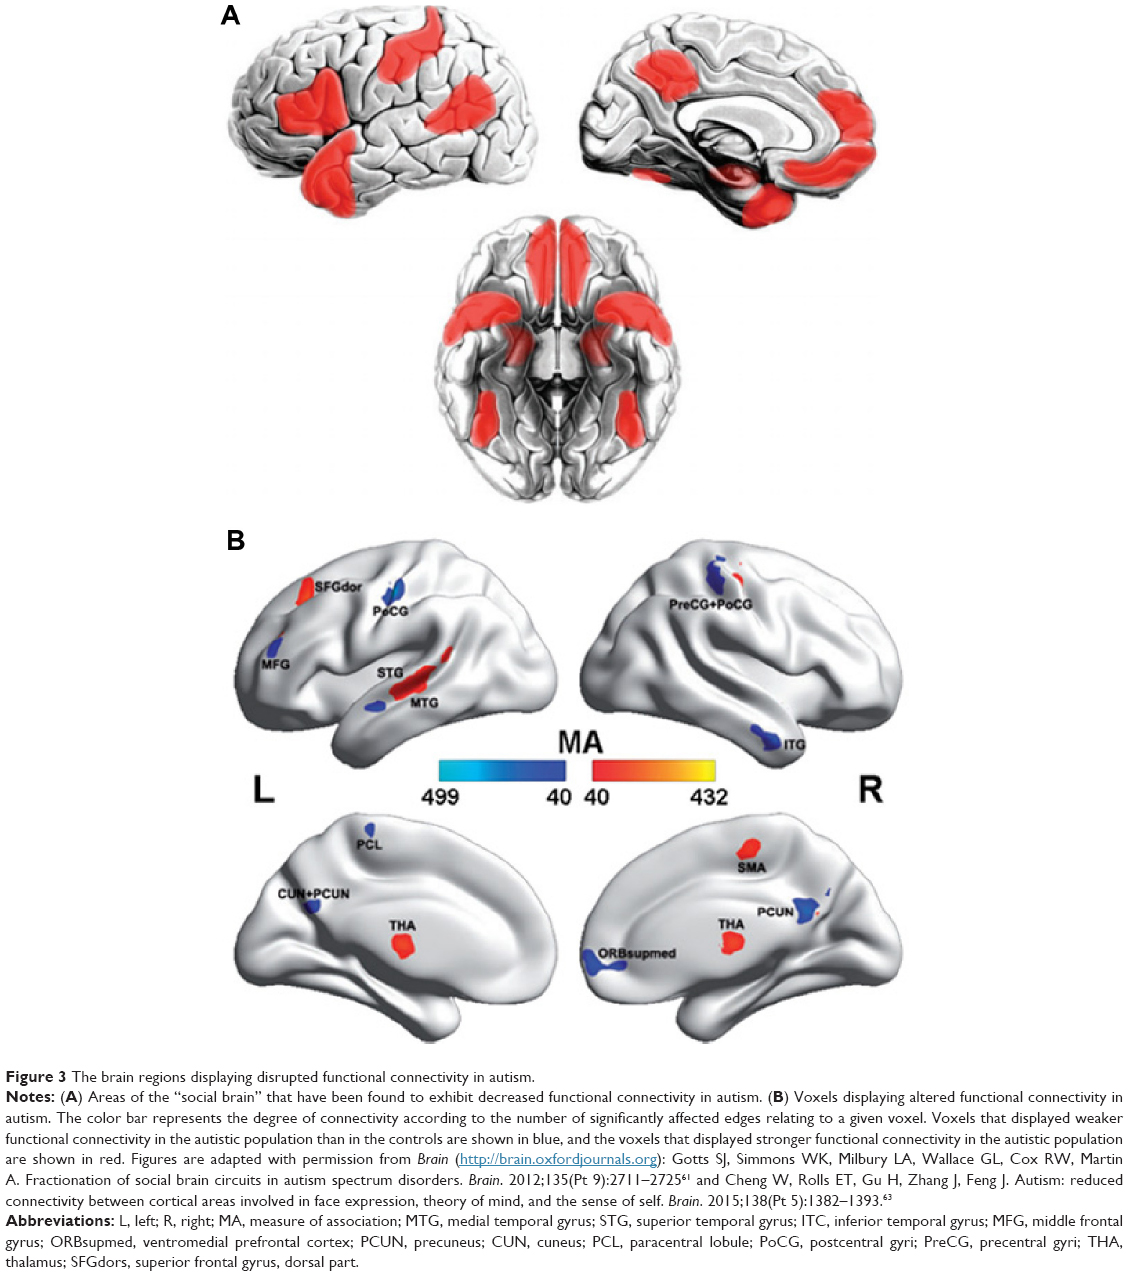 | Figure 3 The brain regions displaying disrupted functional connectivity in autism. |
The topological properties of functional networks were found to exhibit a randomized tendency of decreased segregation, as reflected by decreased modularity and local clustering in ASD patients,62,72 nonclinical populations with autistic traits,73 and carriers of the autism risk gene.74 However, both decreased and increased62 local clustering coefficients were found in structural studies of ASD patients, which were relatively inconsistent. A recent diffusion tensor imaging study conducted on 24-month-old babies showed a significantly decreased local and global efficiency among the temporal, parietal, and occipital lobes in high-risk infants diagnosed with ASD, compared to both low- and high-risk infants not diagnosed with ASD.75 Reduced global efficiency was found only in Broca’s area in these ASD infants.75 In addition, these alterations significantly correlated with symptom severity among the high-risk infants (including ASD and non-ASD infants).75 These findings suggest that infants with ASD exhibit disturbances in the organization of both the local and global aspects of the network structure in the brain regions that are primarily involved in the processing of auditory, visual, language, and nonlinguistic social stimuli. Additionally, both functional and structural hubs are disturbed in ASD, indicating dysfunction in global integration,44,49 and suggesting a disruption in global integration capacity. Taken together, these findings in ASD are fairly inconsistent, and further analyses are urgently needed to reveal the mechanism underlying this dysfunction.
Shared and distinct alterations between different disorders
As summarized earlier, specific connectomic disturbances in each disorder have been reported: schizophrenia patients show abnormalities primarily in the frontal-temporal regions and a randomized organization; ADHD patients show significant alterations in the prefrontal and orbitofrontal-striatal circuitries with an ordered tendency; and ASD patients exhibited alterations located in the social network and subcortical regions.
Although significant and specific alterations in the connectomes of individuals with psychiatric disorders have been detected, similar clinical symptoms are shared between psychiatric disorders. Thus, the characterization of shared and unique abnormalities in psychiatric connectomes is important for understanding the neural mechanisms underlying comorbidities. For example, individuals with ASD often exhibit symptoms of ADHD, ie, inattention and hyperactivity/impulsivity, and the Diagnostic and Statistical Manual of Mental Disorders, 5th Edition, diagnostic criteria permit the coincident diagnosis of ADHD and ASD. Connectomic analysis49 revealed that both ADHD and ASD subjects exhibit nodal centrality abnormalities in the precuneus but that other disturbances were disorder-specific: ADHD was associated with increased degree in the right striatum/pallidum, and ASD was associated with increased degree in the bilateral temporo-limbic areas. Disorder-specific alterations in rich-club organization were also reported; specifically, ASD patients exhibited hyperconnectivity within the rich-club structure and comparable connectivity outside the rich-club structure, whereas ADHD patients showed hypoconnectivity within the rich-club structure and hyperconnectivity outside the rich-club structure.76 Additionally, schizophrenia shares some similar symptoms with bipolar disorder. Comparisons of whole-brain functional connectivity between schizophrenia, bipolar disorder, and healthy control subjects revealed both common and distinct disruptions between these two disorders, particularly a lowest-to-highest schizophrenia/bipolar disorder/healthy subject spectrum of total connectivity.77,78 Interestingly, recent studies that integrated the data obtained for various neuropsychiatric disorders found that most of these disorders primarily attack brain hubs in both the structural and functional connectomes, although distinct subsets of cortical hubs were lesioned in each disorder.44,79 Moreover, schizophrenia, bipolar disorder, depression, addiction, obsessive-compulsive disorder, and anxiety were commonly associated with gray matter loss in three regions: the dorsal anterior cingulate cortex and the bilateral insula, suggesting that a common neurobiological substrate may exist across these mental illnesses.79
Recently, a developmental perspective has been increasingly accepted in the field of psychiatric disorders.14 Models of developmental miswiring have been proposed, such as delayed wiring for ADHD,46,80 and immature or ectopic wiring for ASD.81 Compared with the two disorders, schizophrenia has been examined in relatively few age-related studies.58 However, there is also a hypothesis that aberrant maturation of late developing systems, which primarily include connectivity hubs in the association cortex that integrate information from diverse network elements, causes dysfunction of critical circuits in schizophrenia, thereby eliciting clinical symptoms in late adolescence and early adulthood.32 Further studies are needed to test these hypotheses.
Conclusion and future perspectives
This review summarizes the recent connectomics studies related to psychiatric disorders. The discussed findings imply that characteristic abnormalities in the connectomes of psychiatric patients may provide novel insight into the pathophysiological mechanisms underlying psychiatric disorders, reveal the mechanisms underlying various treatments,40,55 and identify potential therapeutic targets for these disorders25,82 from a connectomics perspective. However, several important challenges for future research remain.
First, the present results across modalities were discrepant in many aspects, and it is difficult to determine whether these discrepancies reflect additional biological information or limitations of the analysis or imaging methods. Moreover, it is believed that the complex structural–functional relationship is disturbed in psychiatric disorders, although this hypothesis requires further assessment.83 Future studies should include measurements and integration of the structural and functional connectomes based on multiple MRI modalities in the same participants; larger sample sizes and repeated measurements on each subject; and correlation analyses between the observed changes and specific, refined cognitive measurements or disorder symptoms. Second, the disturbed regions revealed by connectomic analysis of these disorders (such as the striatum for ADHD and the fronto-temporal cortex for schizophrenia) are also detected via several other analysis methods (such as functional activation and structural geography studies). The mechanisms underlying the manifestations of a shared aberration, such as an identical cause or causal relationship, are very interesting. Some physiological parameters that are closely associated with psychiatric disorders have been correlated with both connectomic properties and the structural index in both healthy controls and psychiatric patients;7,84–86 this finding suggests a physiological and neurochemical basis underlying the dysfunctions observed in these patients. Future studies are necessary to clarify these issues. Third, different psychiatric disorders often share aberrant behavioral symptoms, and the exploration of the mechanisms underlying these symptoms has attracted more and more attention. However, accumulated evidence has indicated that different data acquisition sequences, preprocessing steps, and analysis methods, such as parcellation and correlation calculations, produce discrepant results,87–89 which renders the integration of results across different studies difficult. Further research across different comorbid disorders should be conducted on data for different disorders obtained using identical data processing sequences and analysis methods. Moreover, studies exploring the effects of many influences, such as environmental or genetic factors, age, disease progression, and clinical treatment, on pathoconnectomics are urgently needed. We hope that the accumulation of validated evidence from connectomics will reveal biological markers that indicate the specific phenotypes of psychiatric disorders.
Acknowledgments
This work was supported by the National Key Basic Research Program of China (973 Project, No 2014CB846102), a National Science Fund for Distinguished Young Scholars Grant (No 81225012), the Natural Science Foundation of China (No 31221003), and the Beijing Natural Science Foundation (No Z151100003915082, No 2012D009012000003).
Disclosure
The authors have no conflicts of interest to disclose.
References
Craddock RC, Jbabdi S, Yan CG, et al. Imaging human connectomes at the macroscale. Nat Methods. 2013;10(6):524–539. | ||
Biswal BB, Mennes M, Zuo XN, et al. Toward discovery science of human brain function. Proc Natl Acad Sci U S A. 2010;107(10):4734–4739. | ||
Sporns O, Tononi G, Kotter R. The human connectome: a structural description of the human brain. PLoS Comput Biol. 2005;1(4):e42. | ||
Bullmore ET, Bassett DS. Brain graphs: graphical models of the human brain connectome. Annu Rev Clin Psychol. 2011;7:113–140. | ||
He Y, Evans A. Graph theoretical modeling of brain connectivity. Curr Opin Neurol. 2010;23(4):341–350. | ||
Stam CJ. Characterization of anatomical and functional connectivity in the brain: a complex networks perspective. Int J Psychophysiol. 2010;77(3):186–194. | ||
Bullmore E, Sporns O. The economy of brain network organization. Nat Rev Neurosci. 2012;13(5):336–349. | ||
Sporns O. Contributions and challenges for network models in cognitive neuroscience. Nat Neurosci. 2014;17(5):652–660. | ||
Fornito A, Zalesky A, Bassett DS, et al. Genetic influences on cost-efficient organization of human cortical functional networks. J Neurosci. 2011;31(9):3261–3270. | ||
van den Heuvel MP, van Soelen IL, Stam CJ, Kahn RS, Boomsma DI, Hulshoff Pol HE. Genetic control of functional brain network efficiency in children. Eur Neuropsychopharmacol. 2013;23(1):19–23. | ||
Park HJ, Friston K. Structural and functional brain networks: from connections to cognition. Science. 2013;342(6158):1238411. | ||
Takeuchi H, Taki Y, Hashizume H, et al. The association between resting functional connectivity and creativity. Cereb Cortex. 2012;22(12):2921–2929. | ||
Xia M, He Y. Magnetic resonance imaging and graph theoretical analysis of complex brain networks in neuropsychiatric disorders. Brain Connect. 2011;1(5):349–365. | ||
Di Martino A, Fair DA, Kelly C, et al. Unraveling the miswired connectome: a developmental perspective. Neuron. 2014;83(6):1335–1353. | ||
Bassett DS, Bullmore ET. Human brain networks in health and disease. Curr Opin Neurol. 2009;22(4):340–347. | ||
American Psychiatric Association. American Psychiatric Association. DSM-5 Task Force. Diagnostic and statistical manual of mental disorders DSM-5. 2013; 5th: 1 online resource (xliv, 947). Available from: http://proxy.med.sc.edu/login?url=http://psychiatryonline.org/book.aspx?bookid=556. Accessed August 24, 2015. | ||
Rubinov M, Bullmore E. Fledgling pathoconnectomics of psychiatric disorders. Trends Cogn Sci. 2013;17(12):641–647. | ||
Kelly C, Biswal BB, Craddock RC, Castellanos FX, Milham MP. Characterizing variation in the functional connectome: promise and pitfalls. Trends Cogn Sci. 2012;16(3):181–188. | ||
Rubinov M, Sporns O. Complex network measures of brain connectivity: uses and interpretations. Neuroimage. 2010;52(3):1059–1069. | ||
Filippi M, van den Heuvel MP, Fornito A, et al. Assessment of system dysfunction in the brain through MRI-based connectomics. Lancet Neurol. 2013;12(12):1189–1199. | ||
Watts DJ, Strogatz SH. Collective dynamics of ‘small-world’ networks. Nature. 1998;393(6684):440–442. | ||
van den Heuvel MP, Sporns O. Rich-club organization of the human connectome. J Neurosci. 2011;31(44):15775–15786. | ||
van den Heuvel MP, Kahn RS, Goni J, Sporns O. High-cost, high-capacity backbone for global brain communication. Proc Natl Acad Sci U S A. 2012;109(28):11372–11377. | ||
Sporns O. Network attributes for segregation and integration in the human brain. Curr Opin Neurobiol. 2013;23(2):162–171. | ||
Gong Q, He Y. Depression, neuroimaging and connectomics: a selective overview. Biol Psychiatry. 2015;77(3):223–235. | ||
Bullmore E, Vertes P. From Lichtheim to rich club: brain networks and psychiatry. JAMA Psychiatry. 2013;70(8):780–782. | ||
Lynall ME, Bassett DS, Kerwin R, et al. Functional connectivity and brain networks in schizophrenia. J Neurosci. 2010;30(28):9477–9487. | ||
van den Heuvel MP, Sporns O, Collin G, et al. Abnormal rich club organization and functional brain dynamics in schizophrenia. JAMA Psychiatry. 2013;70(8):783–792. | ||
Bassett DS, Nelson BG, Mueller BA, Camchong J, Lim KO. Altered resting state complexity in schizophrenia. Neuroimage. 2012;59(3):2196–2207. | ||
van den Heuvel MP, Fornito A. Brain networks in schizophrenia. Neuropsychol Rev. 2014;24(1):32–48. | ||
Narr KL, Leaver AM. Connectome and schizophrenia. Curr Opin Psychiatry. 2015;28(3):229–235. | ||
Fornito A, Bullmore ET. Reconciling abnormalities of brain network structure and function in schizophrenia. Curr Opin Neurobiol. 2015;30:44–50. | ||
Griffa A, Baumann PS, Ferrari C, et al. Characterizing the connectome in schizophrenia with diffusion spectrum imaging. Hum Brain Mapp. 2015;36(1):354–366. | ||
Alexander-Bloch AF, Gogtay N, Meunier D, et al. Disrupted modularity and local connectivity of brain functional networks in childhood-onset schizophrenia. Front Syst Neurosci. 2010;4:147. | ||
Lo CZ, Su TW, Huang CC, et al. Randomization and resilience of brain functional networks as systems-level endophenotypes of schizophrenia. Proc Natl Acad Sci U S A. 2015;112(29):9123–9128. | ||
Alexander-Bloch AF, Vertes PE, Stidd R, et al. The anatomical distance of functional connections predicts brain network topology in health and schizophrenia. Cereb Cortex. 2013;23(1):127–138. | ||
Wang X, Xia M, Lai Y, et al. Disrupted resting-state functional connectivity in minimally treated chronic schizophrenia. Schizophr Res. 2014;156(2–3):150–156. | ||
Micheloyannis S, Pachou E, Stam CJ, et al. Small-world networks and disturbed functional connectivity in schizophrenia. Schizophr Res. 2006;87(1–3):60–66. | ||
Yu Q, Sui J, Liu J, et al. Disrupted correlation between low frequency power and connectivity strength of resting state brain networks in schizophrenia. Schizophr Res. 2013;143(1):165–171. | ||
Achard S, Bullmore E. Efficiency and Cost of Economical Brain Functional Networks. PLoS Comput Biol. 2007;3(2):e17. | ||
Yu Q, Erhardt EB, Sui J, et al. Assessing dynamic brain graphs of time-varying connectivity in fMRI data: application to healthy controls and patients with schizophrenia. Neuroimage. 2015;107:345–355. | ||
Skudlarski P, Jagannathan K, Anderson K, et al. Brain connectivity is not only lower but different in schizophrenia: a combined anatomical and functional approach. Biol Psychiatry. 2010;68(1):61–69. | ||
Rubinov M, Bullmore E. Schizophrenia and abnormal brain network hubs. Dialogues Clin Neurosci. 2013;15(3):339–349. | ||
Crossley NA, Mechelli A, Scott J, et al. The hubs of the human connectome are generally implicated in the anatomy of brain disorders. Brain. 2014;137(Pt 8):2382–2395. | ||
Yang GJ, Murray JD, Repovs G, et al. Altered global brain signal in schizophrenia. Proc Natl Acad Sci U S A. 2014;111(20):7438–7443. | ||
Fair DA, Posner J, Nagel BJ, et al. Atypical default network connectivity in youth with attention-deficit/hyperactivity disorder. Biol Psychiatry. 2010;68(12):1084–1091. | ||
Fair DA, Nigg JT, Iyer S, et al. Distinct neural signatures detected for ADHD subtypes after controlling for micro-movements in resting state functional connectivity MRI data. Front Syst Neurosci. 2012;6:80. | ||
Tomasi D, Volkow ND. Abnormal functional connectivity in children with attention-deficit/hyperactivity disorder. Biol Psychiatry. 2012;71(5):443–450. | ||
Di Martino A, Zuo XN, Kelly C, et al. Shared and distinct intrinsic functional network centrality in autism and attention-deficit/hyperactivity disorder. Biol Psychiatry. 2013;74(8):623–632. | ||
Colby JB, Rudie JD, Brown JA, Douglas PK, Cohen MS, Shehzad Z. Insights into multimodal imaging classification of ADHD. Front Syst Neurosci. 2012;6:59. | ||
Sripada C, Kessler D, Fang Y, et al. Disrupted network architecture of the resting brain in attention-deficit/hyperactivity disorder. Hum Brain Mapp. 2014;35(9):4693–4705. | ||
Cao Q, Shu N, An L, et al. Probabilistic diffusion tractography and graph theory analysis reveal abnormal white matter structural connectivity networks in drug-naive boys with attention deficit/hyperactivity disorder. J Neurosci. 2013;33(26):10676–10687. | ||
Sripada CS, Kessler D, Welsh R, et al. Distributed effects of methylphenidate on the network structure of the resting brain: a connectomic pattern classification analysis. Neuroimage. 2013;81:213–221. | ||
Wang L, Zhu C, He Y, et al. Altered small-world brain functional networks in children with attention-deficit/hyperactivity disorder. Hum Brain Mapp. 2009;30(2):638–649. | ||
Ahmadlou M, Rostami R, Sadeghi V. Which attention-deficit/hyperactivity disorder children will be improved through neurofeedback therapy? A graph theoretical approach to neocortex neuronal network of ADHD. Neuroscience letters. 2012;516(1):156–160. | ||
Ahmadlou M, Adeli H, Adeli A. Graph Theoretical Analysis of Organization of Functional Brain Networks in ADHD. Clin EEG Neurosci. 2012;43(1):5–13. | ||
Cocchi L, Bramati IE, Zalesky A, et al. Altered functional brain connectivity in a non-clinical sample of young adults with attention-deficit/hyperactivity disorder. J Neurosci. 2012;32(49):17753–17761. | ||
Bullmore ET, Frangou S, Murray RM. The dysplastic net hypothesis: an integration of developmental and dysconnectivity theories of schizophrenia. Schizophr Res. 1997;28(2–3):143–156. | ||
Sripada CS, Kessler D, Angstadt M. Lag in maturation of the brain’s intrinsic functional architecture in attention-deficit/hyperactivity disorder. Proc Natl Acad Sci U S A. 2014;111(39):14259–14264. | ||
Anderson JS, Nielsen JA, Froehlich AL, et al. Functional connectivity magnetic resonance imaging classification of autism. Brain. 2011;134(Pt 12):3742–3754. | ||
Gotts SJ, Simmons WK, Milbury LA, Wallace GL, Cox RW, Martin A. Fractionation of social brain circuits in autism spectrum disorders. Brain. 2012;135(Pt 9):2711–2725. | ||
Rudie JD, Brown JA, Beck-Pancer D, et al. Altered functional and structural brain network organization in autism. Neuroimage Clin. 2012;2:79–94. | ||
Cheng W, Rolls ET, Gu H, Zhang J, Feng J. Autism: reduced connectivity between cortical areas involved in face expression, theory of mind, and the sense of self. Brain. 2015;138(Pt 5):1382–1393. | ||
Eilam-Stock T, Xu P, Cao M, et al. Abnormal autonomic and associated brain activities during rest in autism spectrum disorder. Brain. 2014;137(Pt 1):153–171. | ||
Tyszka JM, Kennedy DP, Paul LK, Adolphs R. Largely typical patterns of resting-state functional connectivity in high-functioning adults with autism. Cereb Cortex. 2014;24(7):1894–1905. | ||
Kitzbichler MG, Khan S, Ganesan S, et al. Altered Development and Multifaceted Band-Specific Abnormalities of Resting State Networks in Autism. Biol Psychiatry. 2015;77(9):794–804. | ||
Khan S, Gramfort A, Shetty NR, et al. Local and long-range functional connectivity is reduced in concert in autism spectrum disorders. Proc Natl Acad Sci U S A. 2013;110(8):3107–3112. | ||
Ameis SH, Catani M. Altered white matter connectivity as a neural substrate for social impairment in Autism Spectrum Disorder. Cortex. 2015;62:158–181. | ||
Bernhardt BC, Valk SL, Silani G, Bird G, Frith U, Singer T. Selective disruption of sociocognitive structural brain networks in autism and alexithymia. Cereb Cortex. 2014;24(12):3258–3267. | ||
Casanova MF, Hensley MK, Sokhadze EM, et al. Effects of weekly low-frequency rTMS on autonomic measures in children with autism spectrum disorder. Front Hum Neurosci. 2014;8:851. | ||
Oberman LM, Rotenberg A, Pascual-Leone A. Use of transcranial magnetic stimulation in autism spectrum disorders. J Autism Dev Disord. 2015;45(2):524–536. | ||
Valk SL, Di Martino A, Milham MP, Bernhardt BC. Multicenter mapping of structural network alterations in autism. Hum Brain Mapp. 2015;36(6):2364–2373. | ||
Jakab A, Emri M, Spisak T, et al. Autistic traits in neurotypical adults: correlates of graph theoretical functional network topology and white matter anisotropy patterns. PloS One. 2013;8(4):e60982. | ||
Dennis EL, Jahanshad N, Rudie JD, et al. Altered structural brain connectivity in healthy carriers of the autism risk gene, CNTNAP2. Brain Connect. 2011;1(6):447–459. | ||
Lewis JD, Evans AC, Pruett JR, et al. Network inefficiencies in autism spectrum disorder at 24 months. Transl Psychiatry. 2014;4:e388. | ||
Ray S, Miller M, Karalunas S, et al. Structural and functional connectivity of the human brain in autism spectrum disorders and attention-deficit/hyperactivity disorder: A rich club-organization study. Hum Brain Mapp. 2014;35(12):6032–6048. | ||
Rashid B, Damaraju E, Pearlson GD, Calhoun VD. Dynamic connectivity states estimated from resting fMRI Identify differences among Schizophrenia, bipolar disorder, and healthy control subjects. Front Hum Neurosci. 2014;8:897. | ||
Mamah D, Barch DM, Repovs G. Resting state functional connectivity of five neural networks in bipolar disorder and schizophrenia. J Affect Disord. 2013;150(2):601–609. | ||
Goodkind M, Eickhoff SB, Oathes DJ, et al. Identification of a common neurobiological substrate for mental illness. JAMA Psychiatry. 2015;72(4):305–315. | ||
Cao M, Shu N, Cao Q, Wang Y, He Y. Imaging functional and structural brain connectomics in attention-deficit/hyperactivity disorder. Mol Neurobiol. 2014;50(3):1111–1123. | ||
Uddin LQ, Supekar K, Menon V. Reconceptualizing functional brain connectivity in autism from a developmental perspective. Front Hum Neurosci. 2013;7:458. | ||
Fox MD, Buckner RL, Liu H, Chakravarty MM, Lozano AM, Pascual-Leone A. Resting-state networks link invasive and noninvasive brain stimulation across diverse psychiatric and neurological diseases. Proc Natl Acad Sci U S A. 2014;111(41):E4367–4375. | ||
Wang Z, Dai Z, Gong G, Zhou C, He Y. Understanding structural-functional relationships in the human brain: a large-scale network perspective. Neuroscientist. 2015;21(3):290–305. | ||
Liang X, Zou Q, He Y, Yang Y. Coupling of functional connectivity and regional cerebral blood flow reveals a physiological basis for network hubs of the human brain. Proc Natl Acad Sci U S A. 2013;110(5):1929–1934. | ||
Tomasi D, Wang GJ, Volkow ND. Energetic cost of brain functional connectivity. Proc Natl Acad Sci U S A. 2013;110(33):13642–13647. | ||
Musazzi L, Treccani G, Mallei A, Popoli M. The action of antidepressants on the glutamate system: regulation of glutamate release and glutamate receptors. Biol Psychiatry. 2013;73(12):1180–1188. | ||
Wang J, Wang L, Zang Y, et al. Parcellation-dependent small-world brain functional networks: a resting-state fMRI study. Hum Brain Mapp. 2009;30(5):1511–1523. | ||
Liang X, Wang J, Yan C, et al. Effects of different correlation metrics and preprocessing factors on small-world brain functional networks: a resting-state functional MRI study. PloS One. 2012;7(3):e32766. | ||
Liao XH, Xia MR, Xu T, et al. Functional brain hubs and their test-retest reliability: a multiband resting-state functional MRI study. Neuroimage. 2013;83:969–982. |
 © 2015 The Author(s). This work is published and licensed by Dove Medical Press Limited. The full terms of this license are available at https://www.dovepress.com/terms.php and incorporate the Creative Commons Attribution - Non Commercial (unported, v3.0) License.
By accessing the work you hereby accept the Terms. Non-commercial uses of the work are permitted without any further permission from Dove Medical Press Limited, provided the work is properly attributed. For permission for commercial use of this work, please see paragraphs 4.2 and 5 of our Terms.
© 2015 The Author(s). This work is published and licensed by Dove Medical Press Limited. The full terms of this license are available at https://www.dovepress.com/terms.php and incorporate the Creative Commons Attribution - Non Commercial (unported, v3.0) License.
By accessing the work you hereby accept the Terms. Non-commercial uses of the work are permitted without any further permission from Dove Medical Press Limited, provided the work is properly attributed. For permission for commercial use of this work, please see paragraphs 4.2 and 5 of our Terms.