")
Back to Journals » Clinical Ophthalmology » Volume 12
Cone photoreceptor macular function and recovery after photostress in early non-exudative age-related macular degeneration
Authors Rodriguez JD , Lane K, Hollander DA, Shapiro A, Saigal S, Hertsenberg AJ, Wallstrom G, Narayanan D, Angjeli E, Abelson MB
Received 15 February 2018
Accepted for publication 5 April 2018
Published 27 July 2018 Volume 2018:12 Pages 1325—1335
DOI https://doi.org/10.2147/OPTH.S165658
Checked for plagiarism Yes
Review by Single anonymous peer review
Peer reviewer comments 2
Editor who approved publication: Dr Scott Fraser
John D Rodriguez,1 Keith Lane,1 David A Hollander,1,2 Aron Shapiro,1 Sunita Saigal,1 Andrew J Hertsenberg,1 Garrick Wallstrom,3 Divya Narayanan,1 Endri Angjeli,1 Mark B Abelson1,4
1Ora, Inc., Andover, MA, USA; 2Jules Stein Eye Institute, University of California, Los Angeles, CA, USA; 3Statistics and Data Corporation, Tempe, AZ, USA; 4Department of Ophthalmology, Harvard Medical School, Boston, MA, USA
Purpose: To identify parameters from cone function and recovery after photostress that detect functional deficits in early non-exudative age-related macular degeneration (AMD) and to determine the repeatability of these parameters.
Methods: Cone-mediated visual function recovery after photostress was examined in three groups of subjects: young normal subjects (ages 20–29; N=8), older normal subjects (ages 50–90; N=9), and early non-exudative AMD subjects (ages 50–90; N=12). Eight AMD and four normal subjects were retested 1 year after the initial evaluation. Early Treatment Diabetic Retinopathy Study (ETDRS) visual acuity (VA) and parameters of cone function (baseline cone sensitivity and cone recovery half-life following photobleach) were measured and compared between AMD and normal subjects. Short-term repeatability was assessed for each subject’s initial evaluation. Long-term repeatability was assessed by comparing outcomes from the initial evaluation and 1-year follow-up.
Results: The mean baseline cone threshold was significantly worse in subjects with early AMD compared to older normal subjects (-1.80±0.04 vs -1.57±0.06 log cd/m2 p=0.0027). Moreover, the baseline cone threshold parameter exhibited good short-term (intraclass correlation coefficient [ICC]=0.88) and long-term (ICC=0.85) repeatability in all subjects. The cone intercept parameter and ETDRS VA were not significantly different between AMD and older normal subject groups. Cone recovery half-life was significantly different between older normal and AMD subject groups (p=0.041). Neither ETDRS VA nor cone function parameters were significantly different for any group at the 1-year follow-up.
Conclusion: The baseline cone threshold shows potential as a novel parameter to assess visual dysfunction in early AMD. This outcome consistently detected deficits in AMD subjects, and differentiated them from age-matched controls with high test–retest repeatability.
Keywords: AMD, photobleach, photoreceptor, cone recovery, Ora LUX
Introduction
In the developed world, age-related macular degeneration (AMD) is the leading cause of blindness in individuals 50 years and older.1 As the life-expectancy increases, the prevalence of AMD is expected to dramatically increase over the next 25 years, levying enormous health care and social burdens on developed countries.2 The most severe form of AMD, known as exudative (“wet”) AMD, accounts for 10%–15% of cases and is characterized by choroidal neovascularization (CNV) under or within the macula, thereby causing profound visual impairment. The approval of anti-vascular endothelial growth factors (anti-VEGF) as a treatment for wet AMD has made a significant impact on preventing vision loss and managing this form of AMD. However, the majority of AMD patients (85%–90%) suffer from the non-exudative (dry) form of AMD, which is characterized by drusen and changes in the retinal pigment epithelium (RPE).3–5 In most patients with dry AMD, central vision – as assessed by visual acuity (VA) – remains minimally affected during the early stages of the disease despite pathological fundus changes as well as functional limitations experienced by patients such as difficulty in reading and dark adaptation.6,7 These visual deficits have important quality-of-life implications such as restrictions in night driving and anxiety associated with performing tasks at night.8–10 Currently, there are no approved treatments for dry AMD, although the Age-Related Eye Disease Study (AREDS) studies have shown that daily intake of a combination of antioxidants and zinc appeared to reduce the risk of developing advanced AMD.11
In AMD, the primary site of damage within the retina remains unclear, although several retinal structures including Bruch’s membrane, choroid, RPE, and the photoreceptors are affected in the disease process. The retina is one of the most metabolically active tissues due to the high energy demands of the RPE, which carries out many crucial functions including light absorption and visual pigment regeneration, phagocytosis of shed photoreceptor outer segments, control of ion and fluid transport, and maintenance of retinal adhesion. With age, the retina’s high metabolic rate combined with inherent photo-oxidative stress lead to the buildup of toxic by-products that accumulate over time. Key among these are lipofuscin (lipoproteins, N-retinylidene-N-retinylethanolamine, and heavy metals) and local inflammatory mediators of complement activation, which are thought to lead to drusen accumulation, RPE dysfunction/cell death, and photoreceptor degeneration, especially in individuals with genetic and environmental risk factors for AMD.12–16 Clinically, the severity of dry AMD is determined by assessing the size and extent of drusen and pigment abnormalities in the retina. Relatively few small drusen are seen during earlier disease stages, which progressively worsen overtime to complete loss of RPE – visualized as geographic atrophy – in advanced dry AMD.17
Major challenges in developing novel therapeutics for dry AMD are the slow progressing nature of the disease as well as the lack of sensitive endpoints to evaluate therapeutic efficacy. Recent clinical trials in dry AMD have enrolled subjects with geographic atrophy and have utilized change in the growth rate of atrophic lesions as the primary endpoint (NCT01802866). Yet, therapeutic intervention at this advanced stage of disease may have minimal impact on vision and prevention of disease progression, as tissue atrophy indicates permanent loss of retinal cells needed to maintain vision. Compared to structural outcomes, tests of visual function have the potential to detect retinal dysfunction that could precede cellular atrophy and, therefore, can serve as a better sensitive outcome. The commonly accepted visual function endpoint is the Early Treatment Diabetic Retinopathy Study (ETDRS) VA. Although ETDRS VA provides an excellent measure of the subject’s global visual function, it has limitations. Preventing a three-line change in ETDRS VA can be challenging in subjects with end-stage disease. Furthermore, VA remains near-normal in the early stages of dry AMD, making it an ineffective outcome to track disease changes during the early stages of progression. New clinical trial endpoints that reflect early pathophysiological changes may better allow therapeutic interventions to demonstrate an impact on the preservation of vision in subjects with dry AMD. Although structural changes such as drusens and pigment abnormalities are more visibly apparent during retinal exam, it is the underlying dysfunction and eventual loss of photoreceptors that causes vision loss in dry AMD.18,19 One of the initial problems encountered with age as well as patients with early AMD is difficulty in dark adaptation (ie, adjusting to dim light levels after being exposed to bright light).7,20 Abnormal dark adaptation recovery function is a result of the decreased sensitivity of photoreceptors, as well as decreased photoreceptor recovery time.20–22 In real-life situations, patients might not experience these symptoms until significant photoreceptor damage has occurred. However in a clinical setting, transiently stressing photoreceptors and tracking their recovery might help in identifying patients with subclinically compromised photoreceptor function.
Cone-mediated visual function is essential for patient quality of life and, thus, is clinically relevant as an endpoint. Although rod photoreceptor loss has been shown to precede cone loss, foveal cones are also affected in the early stages of AMD. Johnson et al demonstrated that cone photoreceptor cells overlying either hard or soft drusen were found to have morphological and molecular abnormalities indicative of photoreceptor degeneration and Muller glial cell activation.23 In addition, it has been shown that loss of integrity of rod photoreceptors may lead to a corresponding vulnerability of cones.24,25 Fundus reflectometry studies have shown disruption of the cone matrix in early AMD,26,27 and additional disease pathways involving cone photoreceptors have been suggested due to changes in the cone cytoskeleton, redistribution of opsin photopigment, and anomalies in the distal cone axon.28,29 Finally, results have shown that there is a loss of cone-mediated psychophysical visual function and electrophysiological function in early AMD. Contrast and color sensitivity,30–33 texture discrimination,34 flicker sensitivity,35,36 retinal sensitivity,6,37–39 and electroretinogram response40,41 have been shown to be affected prior to changes in VA. The relevance of cone-mediated visual function recovery following photostress in early AMD has been shown in numerous studies.42–47
In this pilot study, we assessed baseline cone photoreceptor function and recovery following photostress in patients with dry AMD. A specialized device – Ora LUX – was developed to effectively photostress photoreceptors by optimal bleaching. Our goals for this project were twofold: 1) to identify the most sensitive parameters of cone recovery function that can detect functional deficits in early dry AMD and 2) to assess the short-term and long-term repeatability of our test paradigm to gauge the feasibility of using these tests as potential clinical endpoints in dry AMD. The follow-up study was carried out to determine if the outcomes were reproducible in these groups after 1 year, as AMD clinical trials typically require long follow-up periods. Due to the qualitative similarity between early AMD and the aging retina, we included both a younger and an older control group.
Patients and methods
Study design
Three groups of subjects – young normal, older normal, and early non-exudative AMD subjects – were tested over a 2-year period. A subgroup consisting of four normal (two young and two old) and eight AMD subjects was retested 1 year after their initial evaluation to assess both the long-term repeatability of these tests and disease progression. All subjects provided written informed consent, and study protocols were approved by a properly constituted Institutional Review Board (Alpha IRB, San Clemente, CA, USA). The study was conducted in accordance with the ethical principles of the Declaration of Helsinki. At both initial evaluation and follow-up, subjects were seen in a four-visit schedule. During Visit 1, the subjects provided informed consent and medical histories and then underwent ETDRS VA, slit-lamp examination, fundus exam, and fundus photography. During visits 2–4, baseline cone photoreceptor function as well as recovery following photo bleach was recorded. The mean interval between visits for all subjects was approximately 5 days.
Subjects
Subjects were enrolled into three cohorts: young, normal control subjects (ages 20–29; N=8), older, normal control subjects (ages 50–90; N=9), and early non-exudative AMD subjects (ages 50–90; N=12). All subjects were recruited from a single general ophthalmology practice. Age-matched older subjects were recruited from the same site. Fourteen AMD subjects were screened together with nine young and nine older control subjects.
All subjects underwent detailed eye examination, including dilated fundus examination, to confirm their disease/normal status. All control subjects, young and old, were required to have no evidence or history of ocular disease and a best-corrected visual acuity (BCVA) of ≥0 LogMAR (young) and ≥0.30 LogMAR (old) in the study eye. Inclusion criteria for the study eye of AMD subjects were evidence of AMD graded at 1 or 2 on the AREDS Simplified Severity Scale48 and BCVA of ≥0.30 LogMAR at initial evaluation. The study eye was chosen at random if both eyes qualified. Subjects were excluded if they had a history or evidence of choroidal neovascularization, glaucoma, chronic retinopathy or other retinal degenerative disease, macular edema, clinically significant ocular trauma; any signs of uncontrolled systemic or autoimmune disease; or any medical condition that the investigator felt put the subject at significant risk, confounded the study results, or interfered significantly with study participation. None of the enrolled subjects were diabetic, had ocular or systemic surgery, or were pregnant or nursing during the study period. Lens changes of both control and AMD subjects were graded on a qualitative clinical scale based on clinical guidelines from American Optometric Association.49 None of the subjects in either the AMD or control group had lens changes that were worse than mild/trace cataract.
No pigment abnormalities were present in any eyes in the control group. Drusen were present neither in any of the eyes of the young group nor in eight of the nine eyes of the older control group; one eye of one of the subjects in the older normal group was found to have two small drusen. The severity of disease state in the AMD group was graded at AREDS 1 or 2 in both eyes for all, with the exception of one subject. This subject had early dry AMD (AREDS 2) in the study eye, but presented with geographic atrophy in the fellow eye.
Baseline cone function and recovery
Baseline retinal cone photoreceptor sensitivity was measured using the threshold program of the Roland Consult dark adaptometer.50,51 To avoid exciting rod photoreceptors, a red (625 nm) stimulus was used. Stimuli were presented at central fixation with a 2° visual angle. The test required approximately 10 min to complete. After assessing the baseline cone threshold, photostress using photobleach was applied as described later. A stopwatch was used to record delay time between the bleach and the start of the dark adaptation program. The mean delay time for all subjects was 13.1±6.6 s. Following photobleach, cone sensitivity was measured using the cone recovery program of the Roland Consult dark adaptometer. Red stimuli (625 nm) of 150 ms duration were presented at approximately 1-s intervals. The subject was required to respond during a time window of 850 ms after each flash. Stimulus intensity was varied in a 6 dB-down and 2 dB-up stepped fashion. The test was conducted until the tested subject’s sensitivity returned to the baseline threshold value.
Photobleach procedure
Photostress was applied by photobleach using Ora LUX – a custom-designed device for effectively bleaching the photoreceptors. The light source is a diffused full-spectrum fluorescent of approximately 40,000 d/m2, with a dominant peak at 545 nm, viewed for 90 s from a distance of 12 inches. The luminance of the light source was confirmed using a light meter before each test.
The safety levels of the light exposure elicited by the Ora LUX were estimated and compared with the accepted industrial standards.52 The level of retinal irradiance of the Ora LUX source yields at least 84% cone photoreceptor bleach after 90 s.53,54 The maximum exposure level of the Ora LUX light source is over 200 times less than the maximum permissible exposure based on the accepted safety standards for industrial and ophthalmic light sources for thermal and photochemical mechanisms.55 The actual damage threshold is approximately 2,000 times greater than the exposure provided by the Ora LUX light source.51,52,55–57
Fundoscopy
Fundus photos of subjects returning after 1 year were graded by a retinal specialist and compared to determine possible structural changes, and their relationship to changes in model outcomes that occurred from the base year to the 1-year follow-up.
Statistical methods
For each eye and visit, a three-parameter exponential model (Figure 1) was fit to the cone data, yielding an estimate for the post-bleaching cone threshold (a) (intercept), cone threshold recovery half-life (h), and baseline cone threshold (c).
|
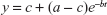
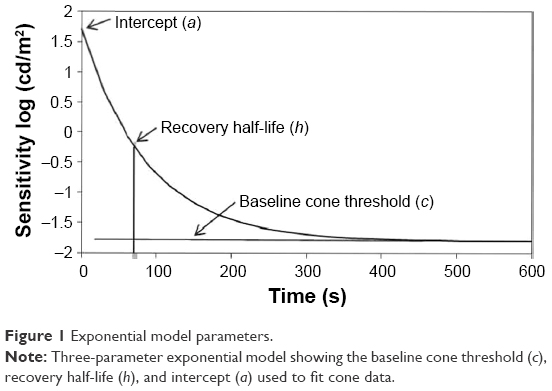 | Figure 1 Exponential model parameters. |
where b = ln(2)/h. Models were fit using the nlmixed procedure of SAS 9.4.
The reliability of each model outcome parameter (a, c, and h) was analyzed – both for each study population and for repeatability between years for subjects tested at the 1-year follow-up. The intraclass correlation coefficient (ICC) was calculated for this purpose as obtained from the components of variance model.
Mean scores were calculated by averaging parameters for each eye over all three visits. Mean comparisons were made between young and old normal groups and between older normal and AMD groups using analysis of variance (ANOVA) with the Satterthwaite approximation and Tukey–Kramer p-value adjustment. Furthermore, as a sensitivity analysis, an age-adjusted Satterthwaite ANOVA was used to compare the older normal and AMD groups. For subjects tested at the 1-year follow-up, mean changes in scores from the base year were analyzed and compared between AMD and normal groups using Satterthwaite ANOVA. The good fit of these ANOVA models was ensured using the mixed procedure of SAS 9.4. The cone threshold recovery half-life was log-transformed prior to analysis to remove positive skew. For all statistical comparisons, a two-sided p-value less than 0.05 was considered statistically significant.
To assess the ability of cone parameters to discriminate an AMD subject from a normal subject, a receiver operator characteristic (ROC) curve analysis was undertaken using the pROC package for R.58 Sensitivity values at fixed levels of specificity were compared using the bootstrap method of Pepe et al.59
Results
Demographics and ETDRS BCVA
The basic demographic details and ETDRS BCVA for the three groups of subjects are summarized in Table 1 for all subjects. The mean age was not significantly different between the older normal and AMD subject groups (p=0.125); however, an age-adjusted analysis is presented for confirmation. The mean BCVA of this small sample of older normal was not significantly different than the AMD group (p=0.0706).
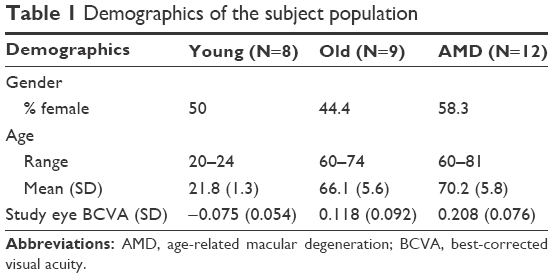 | Table 1 Demographics of the subject population |
Calculation of cone function parameters
The cone function parameters were calculated by fitting a three-parameter exponential model to the raw data generated by the dark adaptometer. For each recording, approximately 140 test points were collected. Calculations showed that the exponential model provided a good fit to the raw data, with a median R2 of 0.911 as well as R2≥0.85 for 84.7% of all curves. Figure 2 presents examples from a normal eye (Figure 2A) and an AMD eye (Figure 2B).
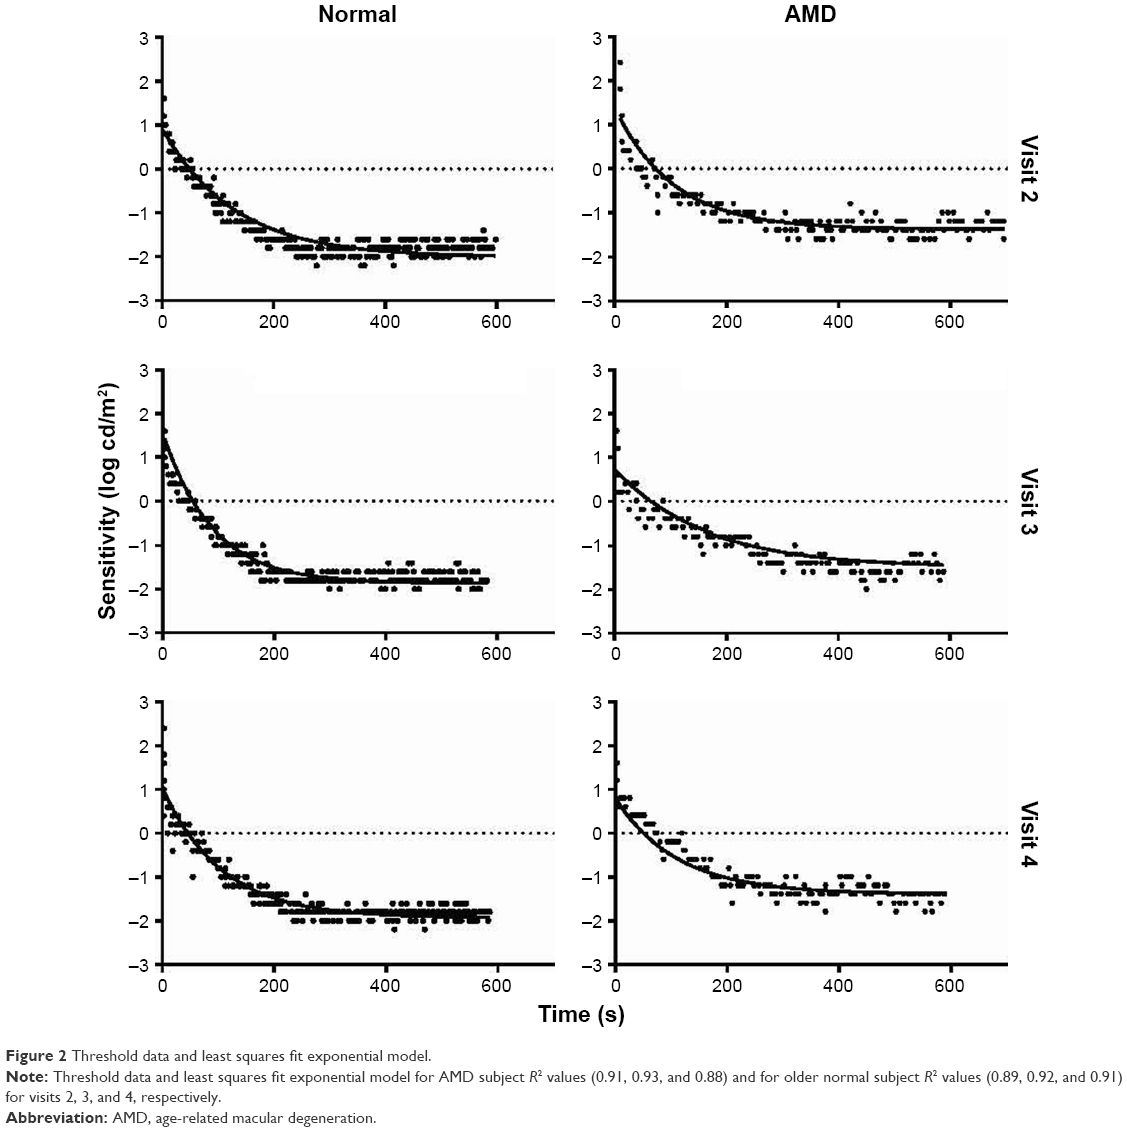 | Figure 2 Threshold data and least squares fit exponential model. |
Analysis of cone function parameters
Baseline cone threshold (c): As shown in Figure 3, the mean baseline cone threshold was significantly higher (worse) for the AMD group compared to the older normal group (−1.56±0.20 in AMD vs −1.82±0.09 in older normal; p=0.0027). This difference remained significant in the age-adjusted sensitivity analysis (p=0.0026). Moreover, the mean baseline cone threshold was higher for the older normal subgroup compared to the younger normal subgroup (−1.82±0.09 in older normal vs −1.97±0.09 in younger normal; p=0.0180).
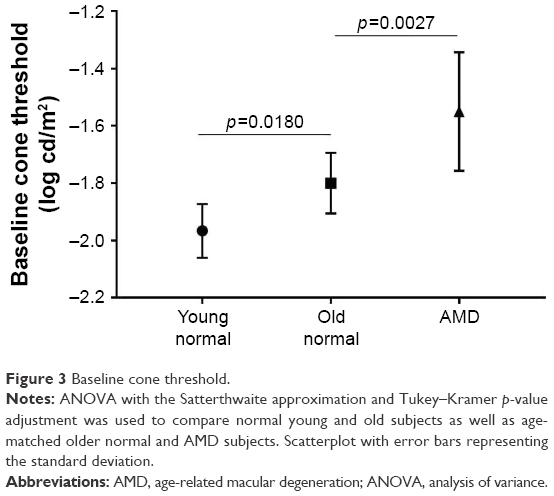 | Figure 3 Baseline cone threshold. |
Cone recovery half-life (h): The mean cone recovery half-life parameter (Figure 4) was 45% longer for the older group compared to the younger group in the analysis of the log-transformed data (97.6±24.5 in the older vs 66.3±11.9 in the younger, in the original scale; p=0.0071). The half-life was 129% longer for AMD subjects compared to the younger group (170.8±99.0 vs 66.3±11.9; p=0.0004). Further, the half-life was 58% longer in the AMD group compared to the older normal group (170.8±99.0 vs 97.6±24.5; p=0.0409). It was 46% longer in age-adjusted analysis (p=0.0437).
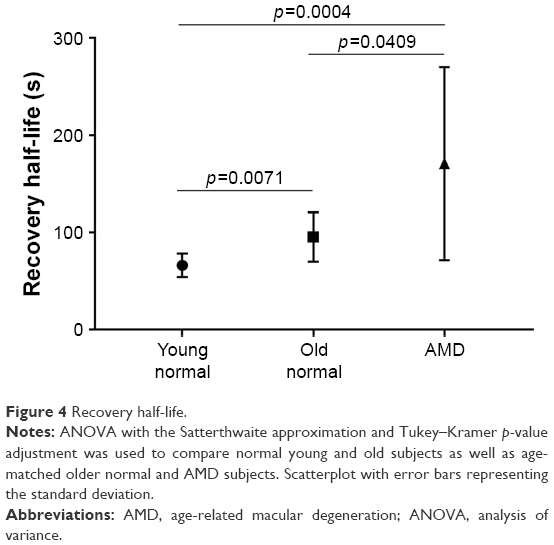 | Figure 4 Recovery half-life. |
Cone intercept (a): The intercept was significantly different only for the young group when compared to the AMD group (1.58±0.37 in AMD vs 1.10±0.30 in younger normal subjects; p=0.0147).
Change in outcomes over 1 year
As shown in Figures 5 and 6, there was no change in the baseline cone threshold and the recovery half-life measures between the base year and the follow-up year for this small sample size (eight AMD and four normal subjects).
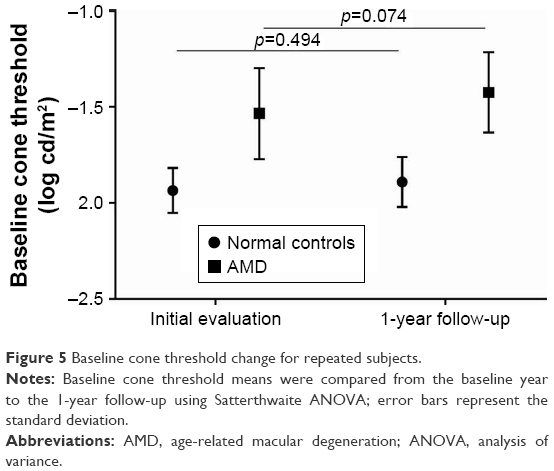 | Figure 5 Baseline cone threshold change for repeated subjects. |
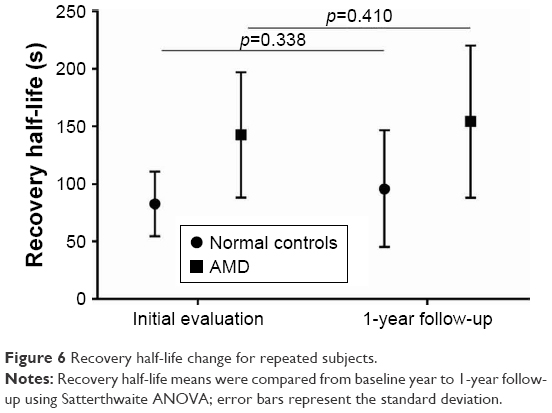 | Figure 6 Recovery half-life change for repeated subjects. |
ROC curve analysis
An ROC curve was generated to assess the diagnostic ability of baseline cone threshold parameter (c) and half-life recovery time (h) in differentiating AMD subjects from age-matched normal subjects. The baseline cone threshold showed sensitivity of 91.7% with specificity of 88.9% and an area under the curve (AUC) of 0.898. For the same subjects, the ETDRS VA showed a sensitivity of 50% and a specificity of 88.9% with an AUC of 0.782.
Repeatability of model outcomes
The test–retest repeatability of cone function outcomes were analyzed using the ICC – a measure of agreement between measurements which is considered good with ICC≥0.75.60 Among all visits at the initial evaluation, both the baseline cone threshold (c) and the recovery half-life (h) were found to have a high degree of repeatability (ICC=0.88; 95% CI 0.8096, 0.9544) and (ICC=0.93; 95% CI 0.8893, 0.9751), respectively. The intercept (a) was determined to have relatively poor repeatability (ICC=0.40; 95% CI 0.1560, 0.6397).
Fundoscopy
All subjects were graded using the AREDS simplified grading at study entry as per the inclusion/exclusion criteria.48 Fundus photographs of subjects who returned for the 1-year follow-up (eight AMD, two young, and two old subjects) were examined by an experienced retinal specialist to determine disease progression. All photographs of returning control group members were graded as normal for both the base year and the 1-year follow-up. None of the AMD subjects had measurable progression based on the AREDS simplified grading scale or the AREDS 9-point scale. Of note, seven of eight of the images from returning AMD subjects showed no visible change in fundus structures from year to year. In the eighth subject, slightly greater depigmentation was noted in the inferior parafoveal macular region in the follow-up year; all parameters for this subject from base year to follow-up were in the range of the scores of the AMD group. The change in the BCVA for this subject was 0.16, which was not clinically significant (group range was −0.24 to 0.26). Changes in the recovery half-life recovery and baseline cone threshold were 23.05 and 0.05, respectively (group range was −46.45 to 66.77 and −0.11 to 0.31, respectively).
Long-term repeatability of model outcomes at 1-year follow-up
Given that none of the eight AMD subjects retested after 1 year showed clear evidence of disease progression based on either BCVA, fundus exam, or cone function parameters we assessed the long-term repeatability of our model outcomes. The baseline cone threshold and recovery half-life measured during the initial evaluation and at the 1-year follow-up were compared. The baseline cone threshold (c, ICC=0.84) and the recovery half-life (h, ICC=0.84) were both found to have a high degree of reproducibility.
Discussion
Baseline cone function and recovery following photostress were evaluated as potential outcome measures to detect functional deficits in early non-exudative AMD. Our results show that, among the three parameters derived from the cone function curve (Figure 1), the baseline cone threshold (c) showed greatest potential as a good outcome measure in early AMD. Whereas the ETDRS VA did not detect a significant difference between AMD and age-matched controls, the baseline cone function was significantly worse in the early AMD group. In addition, it showed good short-term and long-term repeatability based on high ICC values, although these results are within the context of a small pilot study. Our finding that the baseline cone threshold is compromised in early AMD is consistent with results from studies based on mesopic microperimetry,38,39 which have also shown good test–retest repeatability.61
Furthermore, the recovery half-life parameter showed good short-term and long-term repeatability. We note that the recovery half-life data are heavily skewed to the right. This suggests that this parameter may not be well-modeled by the assumption of normality and a log transformation of the data was appropriate. In fact, a log transformation of the data results in a significant p-value comparing older normal and AMD subject groups (p=0.0409). Similar statistical properties have been found for rod-mediated recovery time parameters.62,63 Future studies with a larger sample size are needed to further assess this parameter’s potential as an endpoint. The intercept parameter was not repeatable and showed no difference in either old/young or old/AMD group comparisons.
Recent studies have shown that rod-mediated dark adaptation is altered in early AMD.64–66 However, the conceptually similar endpoint of cone recovery to photostress has also shown promise in reflecting disease state in both AMD and diabetic retinopathy.42,44,67–72 Dimitrov et al tested both rod- and cone-mediated recovery parameters and found that both showed similar diagnostic power based on ROC curve analysis.69 Despite the similarity, rod and cone recovery endpoints were not found to be well correlated, leading them to suggest that these tests measure different physiological pathways.68,69 Additional innate complexities include the inter-dynamics of three cone photoreceptors – L-, S-, and M-cones – and the high inter-subject variability of L-cone and M-cone sub-mosaic geometry. The rapidity of cone recovery relative to rods has prompted investigators to propose the existence of an additional cone-specific visual cycle in the recycling of retinal pigment.73 Nevertheless, cone-mediated recovery has the advantage of shorter test times (10 min vs ≥20 min for rod-mediated recovery) which holds promise for use as a clinical trial endpoint. In addition, central foveal cones are well preserved in older normal subjects whereas the number of rods declines significantly with age even in normal subjects without AMD, confounding intergroup comparisons.
Prior studies involving dynamic recovery of cone photoreceptors have used a variety of bleaching methods.74 In studies involving rod-mediated endpoints, photo bleaching is performed using a flash bleach of fractional millisecond duration.75,76 However, this method is less suited to assess cone photostress recovery. The results of Hollins and Alpern and Rushton and Henry77,78 showed that the duration of bleach is an important factor in addition to the percentage of the cone photoreceptors bleached.
In clinical studies, Wood et al demonstrated that longer bleach duration (120 s) – in which bleaching and regeneration reach an equilibrium state – improved repeatability of the cone photoreceptor recovery time constant in the electroretinogram photostress test in normal subjects.79 Loughman et al found that photoflash-based devices (200 μs flash duration) were unable to detect diabetes or nonproliferative diabetic retinopathy, although this had previously been demonstrated using 3 min exposure to a 2,200 cd/m2 light source.80 In addition, the majority of AMD studies reporting positive findings with photostress recovery endpoints have employed the use of sustained multi-second bleaching (≥10 s).42–44,47,66,68,69,76,80,81 Recent AMD studies such as those of Dimitrov et al have examined both rod and cone photopigment regeneration and used separate bleaching methods for each (11 ms photoflash for rods, 45 s continuous light for cones).68,69
For the present study, a specialized device, Ora LUX, was constructed to ensure a sustained, repeatable, and stable photobleach that effectively bleaches up to 84% of cone photoreceptors. In addition, we conducted a detailed analysis to ensure that the bleaching paradigm was well within the safety limits of exposure established by industrial standards. With the ideal endpoint, a bleach of 90 s (as used here) may have superior diagnostic capabilities relative to brief flash-beaching devices used in other cone-mediated studies of maculopathy.76,81–83
Major impediments to clinical development of therapeutics for dry AMD are the large populations needed for clinical trials as well as the long study duration based on the slow-progressing nature of the disease. When the retina is transiently stressed, such as photostress using photobleach, normal eyes can recover rather quickly. However, this is delayed in AMD eyes even with minimal fundus abnormalities,84 reflecting subclinical deficits (ie, impending functional deficits but below the threshold of clinical manifestation). Identifying these subclinical (at risk) eyes for clinical trials can significantly improve trial outcomes. Adoption of an effective photostress method presented in this study may allow smaller numbers of subjects in clinical trials due to less variability in measurements, although this needs to be confirmed in subsequent large-scale studies with a long follow-up. Additionally, studies investigating differences in cone photoreceptor biochemistry in these groups may provide both a rationale for the functional differences presented herein as well as potential therapeutic targets.
Neither parameter showed significant progression at the 1-year follow-up. This may be attributed to the small sample size or the specific subject group. Owsley et al have suggested that rod-mediated dark adaptation is not an effective endpoint for studies of 1-year or lesser duration based on failure to detect change after 1 year despite a more advanced subject population.85 This conclusion may apply to other endpoints based on dynamic recovery of the visual cycle. Nevertheless, we note that Wu et al showed that longitudinal structural changes over a 12-month period in an early/intermediate AMD population were correlated with changes in mesopic visual function as measured using microperimetry.39 Larger studies are necessary to determine whether rod or cone recovery endpoints can identify a high-risk subgroup for which short-term changes can be observed.
A major limitation of our study was its small sample size. Despite this, both the baseline cone threshold parameter and recovery half-life detected significant differences between AMD subjects and age-matched controls and demonstrated very good repeatability, showing promise as a robust clinical outcome. Future studies with larger sample sizes will focus on tracking cone threshold functions longitudinally as well as identifying optimal cone function endpoints post photostress.
Conclusion
Visual cycle dysfunction in early dry AMD suggests that photoreceptor recovery testing after photobleaching could serve as a relevant clinical trial endpoint. Foveal cone function and recovery after photostress allows such testing to be performed quickly to facilitate high throughput models. Our results show that the use of a sustained bleaching procedure using a specialized device, Ora LUX, differentiates normal and AMD subjects under cone-mediated dark adaptation. Importantly, the bleaching paradigm was well within the safety limits of exposure established by industrial standards. This novel parameter shows promise as a potential endpoint to evaluate therapeutics in patients with early dry AMD. Additional trials with larger study populations are required to further substantiate these findings.
Acknowledgment
This study was funded by Ora, Inc., Andover, MA, USA.
Disclosure
John D Rodriguez, Keith Lane, David A Hollander, Aron Shapiro, Sunita Saigal, Andrew J Hertsenberg, Divya Narayanan, and Endri Angjeli are employees of Ora, Inc. Mark B Abelson, MD is the founder of Ora, Inc. and at the time this study was completed, was the Chief Scientific Officer at Ora, Inc. Garrick Wallstrom, is an employee of Statistics & Data Corporation. The authors report no other conflicts of interest in this work.
References
Congdon N, O’Colmain B, Klaver CC, et al; Eye Diseases Prevalence Research Group. Causes and prevalence of visual impairment among adults in the United States. Arch Ophthalmol. 2004;122(4):477–485. | ||
Wong WL, Su X, Li X, et al. Global prevalence of age-related macular degeneration and disease burden projection for 2020 and 2040: a systematic review and meta-analysis. Lancet Glob Health. 2014;2(2):e106–e116. | ||
Kumar S, Fu Y. Age related macular degeneration: a complex pathology. Austin J Genet Genomic Res. 2014;1(1):5. | ||
Naghza D, Karam N, Amin F, et al. Epidemiology of age related macular degeneration (AMD) and its associated ocular conditions and concomitant systemic diseases. Pak J Ophthalmol. 2013;29(4):221–224. | ||
National Eye Institute NIoH. Age-Related Macular Degeneration: What You Should Know. 2009 (NIH Publication No: 09-2294). Available from: https://nei.nih.gov/catalog/age-related-macular-degeneration-what-you-should-know. Accessed April 1, 2017. | ||
Sunness JS, Rubin GS, Broman A, Applegate CA, Bressler NM, Hawkins BS. Low luminance visual dysfunction as a predictor of subsequent visual acuity loss from geographic atrophy in age-related macular degeneration. Ophthalmology. 2008;115(9):1480–1488, 1488.e1–e2. | ||
Jackson GR, Owsley C, McGwin G Jr. Aging and dark adaptation. Vision Res. 1999;39(23):3975–3982. | ||
Kline DW, Kline TJ, Fozard JL, Kosnik W, Schieber F, Sekuler R. Vision, aging, and driving: the problems of older drivers. J Gerontol. 1992;47(1):P27–P34. | ||
Mangione CM, Berry S, Spritzer K, et al. Identifying the content area for the 51-item National Eye Institute Visual Function Questionnaire: results from focus groups with visually impaired persons. Arch Ophthalmol. 1998;116(2):227–233. | ||
Mortimer RG, Fell JC. Older drivers: their night fatal crash involvement and risk. Accid Anal Prev. 1989;21(3):273–282. | ||
Age-Related Eye Disease Study Research Group. A randomized, placebo-controlled, clinical trial of high-dose supplementation with vitamins C and E, beta carotene, and zinc for age-related macular degeneration and vision loss: AREDS report no. 8. Arch Ophthalmol. 2001;119(10):1417–1436. | ||
Chiras D, Kitsos G, Petersen MB, Skalidakis I, Kroupis C. Oxidative stress in dry age-related macular degeneration and exfoliation syndrome. Crit Rev Clin Lab Sci. 2015;52(1):12–27. | ||
Anderson DH, Mullins RF, Hageman GS, Johnson LV. A role for local inflammation in the formation of drusen in the aging eye. Am J Ophthalmol. 2002;134(3):411–431. | ||
Hageman GS, Luthert PJ, Victor Chong NH, Johnson LV, Anderson DH, Mullins RF. An integrated hypothesis that considers drusen as biomarkers of immune-mediated processes at the RPE-Bruch’s membrane interface in aging and age-related macular degeneration. Prog Retin Eye Res. 2001;20(6):705–732. | ||
Terman A, Brunk UT. Lipofuscin: mechanisms of formation and increase with age. APMIS. 1998;106(2):265–276. | ||
Rabin DM, Rabin RL, Blenkinsop TA, Temple S, Stern JH. Chronic oxidative stress upregulates Drusen-related protein expression in adult human RPE stem cell-derived RPE cells: a novel culture model for dry AMD. Aging (Albany NY). 2013;5(1):51–66. | ||
de Jong PT. Age-related macular degeneration. N Engl J Med. 2006;355(14):1474–1485. | ||
Curcio CA, Medeiros NE, Millican CL. Photoreceptor loss in age-related macular degeneration. Invest Ophthalmol Vis Sci. 1996;37(7):1236–1249. | ||
Jackson GR, Owsley C, Curcio CA. Photoreceptor degeneration and dysfunction in aging and age-related maculopathy. Ageing Res Rev. 2002;1(3):381–396. | ||
Owsley C, Jackson GR, White M, Feist R, Edwards D. Delays in rod-mediated dark adaptation in early age-related maculopathy. Ophthalmology. 2001;108(7):1196–1202. | ||
Brown B, Adams AJ, Coletta NJ, Haegerstrom-Portnoy G. Dark adaptation in age-related maculopathy. Ophthalmic Physiol Opt. 1986;6(1):81–84. | ||
Brown B, Tobin C, Roche N, Wolanowski A. Cone adaptation in age-related maculopathy. Am J Optom Physiol Opt. 1986;63(6):450–454. | ||
Johnson PT, Lewis GP, Talaga KC, et al. Drusen-associated degeneration in the retina. Invest Ophthalmol Vis Sci. 2003;44(10):4481–4488. | ||
Chrysostomou V, Valter K, Stone J. Cone-rod dependence in the rat retina: variation with the rate of rod damage. Invest Ophthalmol Vis Sci. 2009;50(6):3017–3023. | ||
Léveillard T, Sahel JA. Rod-derived cone viability factor for treating blinding diseases: from clinic to redox signaling. Sci Transl Med. 2010;2(26):26ps16. | ||
Kanis MJ, Wisse RP, Berendschot TT, van de Kraats J, van Norren D. Foveal cone-photoreceptor integrity in aging macula disorder. Invest Ophthalmol Vis Sci. 2008;49(5):2077–2081. | ||
Smith VC, Pokorny J, Diddie KR. Color matching and the Stiles-Crawford effect in observers with early age-related macular changes. J Opt Soc Am A. 1988;5(12):2113–2121. | ||
Eckmiller MS. Defective cone photoreceptor cytoskeleton, alignment, feedback, and energetics can lead to energy depletion in macular degeneration. Prog Retin Eye Res. 2004;23(5):495–522. | ||
Shelley EJ, Madigan MC, Natoli R, Penfold PL, Provis JM. Cone degeneration in aging and age-related macular degeneration. Arch Ophthalmol. 2009;127(4):483–492. | ||
Stangos N, Voutas S, Topouzis F, Karampatakis V. Contrast sensitivity evaluation in eyes predisposed to age-related macular degeneration and presenting normal visual acuity. Ophthalmologica. 1995;209(4):194–198. | ||
Arden GB, Wolf JE. Colour vision testing as an aid to diagnosis and management of age related maculopathy. Br J Ophthalmol. 2004;88(9):1180–1185. | ||
Collins M. The onset of prolonged glare recovery with age. Ophthalmic Physiol Opt. 1989;9(4):368–371. | ||
Frennesson C, Nilsson UL, Nilsson SE. Colour contrast sensitivity in patients with soft drusen, an early stage of ARM. Doc Ophthalmol. 1995;90(4):377–386. | ||
Liu L, White J. Early age-related macular degeneration impairs tolerance to stimulus degradation. Optom Vis Sci. 2010;87(8):532–542. | ||
Mayer MJ, Spiegler SJ, Ward B, Glucs A, Kim CB. Mid-frequency loss of foveal flicker sensitivity in early stages of age-related maculopathy. Invest Ophthalmol Vis Sci. 1992;33(11):3136–3142. | ||
Phipps JA, Dang TM, Vingrys AJ, Guymer RH. Flicker perimetry losses in age-related macular degeneration. Invest Ophthalmol Vis Sci. 2004;45(9):3355–3360. | ||
Sunness JS, Massof RW, Johnson MA, Bressler NM, Bressler SB, Fine SL. Diminished foveal sensitivity may predict the development of advanced age-related macular degeneration. Ophthalmology. 1989;96(3):375–381. | ||
Vujosevic S, Pucci P, Casciano M, et al. Long-term longitudinal modifications in mesopic microperimetry in early and intermediate age-related macular degeneration. Graefes Arch Clin Exp Ophthalmol. 2017;255(2):301–309. | ||
Wu Z, Cunefare D, Chiu E, et al. Longitudinal associations between microstructural changes and microperimetry in the early stages of age-related macular degeneration. Invest Ophthalmol Vis Sci. 2016;57(8):3714–3722. | ||
Falsini B, Fadda A, Iarossi G, et al. Retinal sensitivity to flicker modulation: reduced by early age-related maculopathy. Invest Ophthalmol Vis Sci. 2000;41(6):1498–1506. | ||
Gerth C, Delahunt PB, Alam S, Morse LS, Werner JS. Cone-mediated multifocal electroretinogram in age-related macular degeneration: progression over a long-term follow-up. Arch Ophthalmol. 2006;124(3):345–352. | ||
Wu G, Weiter JJ, Santos S, Ginsburg L, Villalobos R. The macular photostress test in diabetic retinopathy and age-related macular degeneration. Arch Ophthalmol. 1990;108(11):1556–1558. | ||
Midena E, Degli Angeli C, Blarzino MC, Valenti M, Segato T. Macular function impairment in eyes with early age-related macular degeneration. Invest Ophthalmol Vis Sci. 1997;38(2):469–477. | ||
Binns AM, Margrain TH. Evaluating retinal function in age-related maculopathy with the ERG photostress test. Invest Ophthalmol Vis Sci. 2007;48(6):2806–2813. | ||
Gaffney AJ, Binns AM, Margrain TH. The effect of pre-adapting light intensity on dark adaptation in early age-related macular degeneration. Doc Ophthalmol. 2013;127(3):191–199. | ||
Wood A, Margrain T, Binns AM. Detection of early age-related macular degeneration using novel functional parameters of the focal cone electroretinogram. PLoS One. 2014;9(5):e96742. | ||
Collins MJ, Brown B. Glare recovery and age-related maculopathy. Clin Vis Sci. 1989;4(2):145–153. | ||
Ferris FL, Davis MD, Clemons TE, et al; Age-Related Eye Disease Study (AREDS) Research Group. A simplified severity scale for age-related macular degeneration: AREDS Report No. 18. Arch Ophthalmol. 2005;123(11):1570–1574. | ||
American Optometric Association. Care of the adult patient with cataract. Optometric Clinical Practice Guideline. 2004;CPG8. Available from: https://www.aoa.org/documents/optometrists/CPG-8.pdf. Accessed April 1, 2017. | ||
Zobor D, Kohl S, Wissinger B, Zrenner E, Jägle H. Rod and cone function in patients with KCNV2 retinopathy. PLoS One. 2012;7(10):e46762. | ||
Zeitz C, Gross AK, Leifert D, et al. Identification and functional characterization of a novel rhodopsin mutation associated with autosomal dominant CSNB. Invest Ophthalmol Vis Sci. 2008;49(9):4105–4114. | ||
Guidelines on limits of exposure to broad-band incoherent optical radiation (0.38 to 3 microM). International Commission on Non-Ionizing Radiation Protection. Health Phys. 1997;73(3):539–554. | ||
A calculator to assess safety of light exposures in ophthalmic instruments and for computing optical properties of ocular pigments [computer program]. 2008. | ||
Liem AT, Keunen JE, van Norren D, van de Kraats J. Rod densitometry in the aging human eye. Invest Ophthalmol Vis Sci. 1991;32(10):2676–2682. | ||
Delori FC, Webb RH, Sliney DH; American National Standards Institute. Maximum permissible exposures for ocular safety (ANSI 2000), with emphasis on ophthalmic devices. J Opt Soc Am A Opt Image Sci Vis. 2007;24(5):1250–1265. | ||
Sliney D, Aron-Rosa D, DeLori F, et al; International Commission on Non-Ionizing Radiation Protection. Adjustment of guidelines for exposure of the eye to optical radiation from ocular instruments: statement from a task group of the International Commission on Non-Ionizing Radiation Protection (ICNIRP). Appl Opt. 2005;44(11):2162–2176. | ||
American National Standard for safe use of lasers. Orlando, FL: Laser Institute of America; 2007. | ||
Robin X, Turck N, Hainard A, et al. pROC: an open-source package for R and S+ to analyze and compare ROC curves. BMC Bioinformatics. 2011;12:77. | ||
Pepe M, Longton G, Janes H. Estimation and comparison of receiver operating characteristic curves. Stata J. 2009;9(1):1. | ||
Lee J, Koh D, Ong CN. Statistical evaluation of agreement between two methods for measuring a quantitative variable. Comput Biol Med. 1989;19(1):61–70. | ||
Pfau M, Lindner M, Fleckenstein M, et al. Test-retest reliability of scotopic and mesopic fundus-controlled perimetry using a modified MAIA (Macular Integrity Assessment) in normal eyes. Ophthalmologica. 2017;237(1):42–54. | ||
Flamendorf J, Agrón E, Wong WT, et al. Impairments in dark adaptation are associated with age-related macular degeneration severity and reticular pseudodrusen. Ophthalmology. 2015;122(10):2053–2062. | ||
Owsley C, Huisingh C, Clark ME, Jackson GR, McGwin G Jr. Comparison of visual function in older eyes in the earliest stages of age-related macular degeneration to those in normal macular health. Curr Eye Res. 2016;41(2):266–272. | ||
Brown B, Kitchin JL. Dark adaptation and the acuity/luminance response in senile macular degeneration (SMD). Am J Optom Physiol Opt. 1983;60(8):645–650. | ||
Campbell CJ, Rittler MC. Clinical adaptation studies of the human retina. UCLA Forum Med Sci. 1969;8:513–544. | ||
Owsley C, McGwin G Jr, Jackson GR, Kallies K, Clark M. Cone- and rod-mediated dark adaptation impairment in age-related maculopathy. Ophthalmology. 2007;114(9):1728–1735. | ||
Dimitrov PN, Guymer RH, Zele AJ, Anderson AJ, Vingrys AJ. Measuring rod and cone dynamics in age-related maculopathy. Invest Ophthalmol Vis Sci. 2008;49(1):55–65. | ||
Dimitrov PN, Robman LD, Varsamidis M, et al. Relationship between clinical macular changes and retinal function in age-related macular degeneration. Invest Ophthalmol Vis Sci. 2012;53(9):5213–5220. | ||
Dimitrov PN, Robman LD, Varsamidis M, et al. Visual function tests as potential biomarkers in age-related macular degeneration. Invest Ophthalmol Vis Sci. 2011;52(13):9457–9469. | ||
Frost-Larsen K, Larsen HW. Macular recovery time recorded by nyctometry – a screening method for selection of patients who are at risk of developing proliferative diabetic retinopathy. Results of a 5-year follow-up. Acta Ophthalmol Suppl. 1985;173:39–47. | ||
Loughman J, Ratzlaff M, Foerg B, Connell P. Suitability and repeatability of a photostress recovery test device, the macular degeneration detector (MDD-2), for diabetes and diabetic retinopathy assessment. Retina. 2014;34(5):1006–1013. | ||
Midena E, Segato T, Giuliano M, Zucchetto M. Macular recovery function (nyctometry) in diabetics without and with early retinopathy. Br J Ophthalmol. 1990;74(2):106–108. | ||
Wang JS, Kefalov VJ. The cone-specific visual cycle. Prog Retin Eye Res. 2011;30(2):115–128. | ||
Margrain TH, Thomson D. Sources of variability in the clinical photostress test. Ophthalmic Physiol Opt. 2002;22(1):61–67. | ||
Jackson GR, Edwards JG. A short-duration dark adaptation protocol for assessment of age-related maculopathy. J Ocul Biol Dis Infor. 2008;1(1):7–11. | ||
Schmitt NJ, Grover DA, Feldon SE. The Eger Macular Stressometer: pilot study. Am J Ophthalmol. 2003;136(2):314–317. | ||
Hollins M, Alpern M. Dark adaptation and visual pigment regeneration in human cones. J Gen Physiol. 1973;62(4):430–447. | ||
Rushton WA, Henry GH. Bleaching and regeneration of cone pigments in man. Vision Res. 1968;8(6):617–631. | ||
Wood A, Margrain T, Binns A. The effect of bleach duration and age on the ERG photostress test. Graefes Arch Clin Exp Ophthalmol. 2011;249(9):1359–1365. | ||
Loughman J, Hewitt C, Judge C, Martin L, Moulds C, Davison PA. Clinical applicability of the Macular Degeneration Detection Device (MDD-2): a novel photostress recovery measurement device. Clin Exp Optom. 2013;96(3):272–277. | ||
Wolffsohn JS, Anderson SJ, Mitchell J, et al. Effect of age related macular degeneration on the Eger macular stressometer photostress recovery time. Br J Ophthalmol. 2006;90(4):432–434. | ||
Bartlett H, Davies LN, Eperjesi F. Reliability, normative data, and the effect of age-related macular disease on the Eger Macular Stressometer photostress recovery time. Ophthalmic Physiol Opt. 2004;24(6):594–599. | ||
Newsome DA, Negreiro M. Reproducible measurement of macular light flash recovery time using a novel device can indicate the presence and worsening of macular diseases. Curr Eye Res. 2009;34(2):162–170. | ||
Sandberg MA, Weiner A, Miller S, Gaudio AR. High-risk characteristics of fellow eyes of patients with unilateral neovascular age-related macular degeneration. Ophthalmology. 1998;105(3):441–447. | ||
Owsley C, Clark ME, McGwin G Jr. Natural history of rod-mediated dark adaptation over 2 years in intermediate age-related macular degeneration. Transl Vis Sci Technol. 2017;6(3):15. |
 © 2018 The Author(s). This work is published and licensed by Dove Medical Press Limited. The full terms of this license are available at https://www.dovepress.com/terms.php and incorporate the Creative Commons Attribution - Non Commercial (unported, v3.0) License.
By accessing the work you hereby accept the Terms. Non-commercial uses of the work are permitted without any further permission from Dove Medical Press Limited, provided the work is properly attributed. For permission for commercial use of this work, please see paragraphs 4.2 and 5 of our Terms.
© 2018 The Author(s). This work is published and licensed by Dove Medical Press Limited. The full terms of this license are available at https://www.dovepress.com/terms.php and incorporate the Creative Commons Attribution - Non Commercial (unported, v3.0) License.
By accessing the work you hereby accept the Terms. Non-commercial uses of the work are permitted without any further permission from Dove Medical Press Limited, provided the work is properly attributed. For permission for commercial use of this work, please see paragraphs 4.2 and 5 of our Terms.