")
Back to Journals » Clinical Epidemiology » Volume 9
Conditioning on future exposure to define study cohorts can induce bias: the case of low-dose acetylsalicylic acid and risk of major bleeding
Authors Lund JL, Horváth-Puhó E , Komjáthiné Szépligeti S, Sørensen HT , Pedersen L, Ehrenstein V, Stürmer T
Received 24 July 2017
Accepted for publication 6 October 2017
Published 23 November 2017 Volume 2017:9 Pages 611—626
DOI https://doi.org/10.2147/CLEP.S147175
Checked for plagiarism Yes
Review by Single anonymous peer review
Peer reviewer comments 2
Editor who approved publication: Professor Irene Petersen
Jennifer L Lund,1,2 Erzsébet Horváth-Puhó,2 Szimonetta Komjáthiné Szépligeti,2 Henrik Toft Sørensen,2 Lars Pedersen,2 Vera Ehrenstein,2 Til Stürmer1,2
1Department of Epidemiology, University of North Carolina, Chapel Hill, NC, USA; 2Department of Clinical Epidemiology, Aarhus University, Aarhus, Denmark
Background: A principle of cohort studies is that cohort membership is defined by current rather than future exposure information. Pharmacoepidemiologic studies using existing databases are vulnerable to violation of this principle. We evaluated the impact of using data on future redemption of prescriptions to determine cohort membership, motivated by a published example seeking to emulate a “per-protocol” association between continuous versus never use of low-dose acetylsalicylic acid (ASA) and major bleeding (e.g., cerebral hemorrhage or gastrointestinal bleeding).
Materials and methods: Danish medical registry data from 2004 to 2011 were used to construct two analytic cohorts. In Cohort 1, we used information about future redemption of low-dose ASA prescriptions to identify cohorts of continuous and never-ASA users. In Cohort 2, we identified ASA initiators and non-initiators using only contemporaneous data and censored follow-up for changes in use over time. We implemented propensity score-matched Poisson regression to evaluate associations between ASA use and major bleeding and estimated adjusted incidence rate differences (IRDs) per 1,000 person-years and ratios (IRRs) overall and stratified by time since initiation.
Results: Among >6 million eligible Danish adults, we identified 403,693 low-dose ASA initiators (Cohort 2), of whom 189,150 were defined as continuous users (Cohort 1). Overall, IRDs and IRRs were similar across cohorts. However, the IRD for major bleeding in the first 90 days was substantially larger in Cohort 1 (IRD=25 per 1,000 person-years) compared with Cohort 2 (IRD=10 per 1,000 person-years).
Conclusion: Using future medication redemption data to define baseline cohorts violates basic epidemiologic principles. Compared with an approach using only contemporaneous data to define cohorts, the approach based on future redemption data generated a substantially higher short-term association between low-dose ASA use and major bleeding on the absolute, but not the relative, scale possibly due to selection and immortal time biases.
Keywords: pharmacoepidemiology, cohort studies, immortal time bias, selection bias
Introduction
Given the limitations of randomized controlled trials for evaluating the safety of medical interventions, researchers are increasingly using routinely collected data from large health care databases (eg, Medicare claims, Clinical Practice Research Datalink, Scandinavian medical registries, and PHARMO) to conduct such studies, as they contain large, diverse, and more generalizable populations.1–4 However, the valid estimation of the safety of medical interventions is not straightforward. The observational corollary of the standard intention-to-treat approach may be inappropriate when evaluating safety because of treatment changes that occur over time (ie, non-adherence). The resulting conservative estimate, closer to the null value, could attenuate or entirely mask a serious safety issue.5,6 An alternative analytic approach, the observational corollary of the per-protocol analysis, can address these concerns by explicitly evaluating the effects of drugs while accounting for treatment changes that occur during study follow-up (eg, appropriately censoring individuals when they stop or switch their assigned or initial treatment).
Researchers seeking to implement per-protocol analyses must carefully design studies to reflect the time-varying nature of medication use, that is, as a daily concept (adherent versus non-adherent status at a contemporaneous point in time) as opposed to a time-fixed concept (adherent versus non-adherent during the entire study period). Failure to appropriately characterize medication use as a daily construct can induce both immortal time7,8 and selection bias9,10 and invalidate estimated treatment effects on safety outcomes. While these biases and design approaches to mitigate their effects have been well documented in the field of epidemiology, the increasing use of routinely collected data by researchers with diverse training outside of epidemiology warrants communication to a wider audience.
The primary objective of this study was to examine how the characterization of medication use as a time-fixed versus daily concept in a per-protocol analysis influences estimates of medical intervention effects on safety outcomes in pharmacoepidemiologic studies using health care databases. To motivate our investigation, we drew upon a published observational study11 evaluating the association between low-dose acetylsalicylic acid (ASA) and the risk of major bleeding by restricting analysis to individuals who were adherent to ASA therapy (or never used ASA) during the follow-up period of entire study. Low-dose ASA is widely used and evaluation of its safety is critical, given current recommendations for use of ASA for primary prevention of cardiovascular disease and colorectal cancer.12 These recommendations are based on balancing the potential benefits of protection against cardiovascular disease and colorectal cancer against the adverse risk of major bleeding. Thus, robust and valid evaluation of ASA safety particularly on the absolute (risk difference) scale is needed to inform health care policy and practice. We used linked Danish nationwide data to compare two alternative approaches to evaluating the association between ASA and major bleeding risk based on characterization of ASA use as a 1) time-fixed (person-level) construct and 2) a daily (contemporaneously updated) construct.
Materials and methods
Identification and illustration of “continuous” and “never”-ASA users
This motivating study compared the incidence of major gastrointestinal and intracranial bleeding episodes (collectively, major bleeding) among adults aged 30–95 years old who initiated and continuously took ASA with those who never took ASA in the Puglia region of Italy from 2003 to 2008.11 To identify the treatment comparison groups, the authors identified new low-dose ASA users (≤300 mg) from January 1, 2003, to December 31, 2008. Among this group, they then identified current low-dose ASA users as “those who had the last prescription of ASA at least 75 days before hospitalization for major bleeding events or the end of follow-up.” New users who did not meet the above criteria (i.e., “former” users) were excluded from all analyses. Individuals who did not receive any low-dose ASAs during the follow-up of entire study were considered “controls” (or never-users).
To more clearly illustrate this study design approach, we generated five hypothetical individuals (A–E) eligible for study inclusion (Figure 1). The solid lines represent time when an individual had an ASA prescription (accounting for the time between the first and last prescription, denoted by circles) and the dashed lines represent unexposed time (not covered by an ASA prescription) from the start of a hypothetical database (January 1, 2004, to December 31, 2011). The “X” denotes a major bleeding event. If the exposure definitions described earlier are implemented in this hypothetical cohort, individuals A and E (“continuous” ASA user) and individual B (“never”-ASA user) will be included in the analysis, but individuals C and D (“former” users) will be excluded.
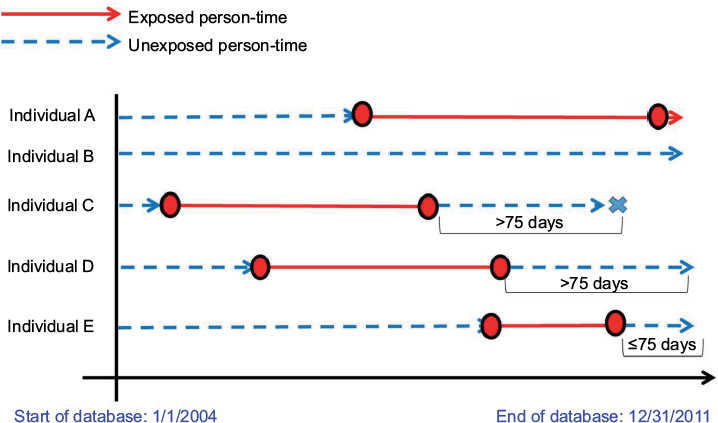 | Figure 1 Acetylsalicylic acid (ASA) exposure and major bleeding outcome information for five hypothetical individuals eligible for Cohorts 1 and 2. The circles denote the first and last prescriptions and the “X”s denote the outcome events, used to define Cohort 1. The dashed lines represent unexposed person-time and the solid lines represent exposed person-time. |
Potential problems with this study design approach
The study design described can lead to a mischaracterization of low-dose ASA use. In general, medical interventions can be categorized as time-fixed or time-varying. For example, a surgical procedure can be considered a time-fixed intervention, as the procedure is either performed or not performed (ie, a one-time operation). However, medications are often taken daily over an extended period and are, therefore, considered time-varying, as each day an individual (or his/her caregiver) decides to take/give the medication or not. In this setting, individuals may have periods of time when they take medicine (ie, exposed person-time) and periods when they do not take medicine (ie, non-exposed person-time).
In the motivating example, low-dose ASA use is a time-varying exposure, but it is characterized as a time-fixed (person-level) exposure. In reality, “current ASA use” is a daily measurement that can be accurately assessed using contemporaneous prescription data. In an approach that defines “current ASA use” as a time-fixed exposure and excludes all individuals who do not continuously use ASA for the entire study period, they underestimate the potential person-time at risk in the ASA group (ie, by excluding “current ASA use” among “former users”). A similar problem arises in the “never-user” comparison group. For example, an individual who starts low-dose ASA therapy later in the study (eg, year 2) should be able to contribute person-time to the non-ASA use group before beginning therapy (eg, in year 1). This time is truly “at risk”. Thus, a design approach that considers medication used as a time-fixed construct does not account for the true complexity and dynamic nature of medication use.
Another concern is the healthy adherer/sick non-adherer bias, a form of selection bias, which has been well described in the pharmacoepidemiologic literature and can lead to invalid study findings.13–15 On one hand, this bias can result from conditioning on continued medication use, restricting analysis to individuals who tolerate therapy over extended periods of time and who may be more adherent to other healthy behaviors (eg, healthy diet) that are associated with the outcome of interest. On the other hand, conditioning on continued non-use of medications (ie, “never-users”) restricts comparisons to individuals who either 1) never have the indication for treatment or 2) have a contraindication for treatment. In principle, neither group is likely to represent a comparator population of interest and may have a very different baseline risk for bleeding events.
Some biases cannot be avoided completely without access to additional information (eg, time-varying predictors of medication discontinuation).6 Still, use of information on medication use later in the study period to exclude people from baseline cohorts and, in turn, excluding person-time at risk, clearly creates the potential for bias. Together, these features can lead to bias in potentially opposite directions, making it impossible to determine the direction and magnitude of their combined effects.
Replication and reanalysis of the motivating study using Danish nationwide medical registries
We conducted a Danish nationwide population-based cohort study from January 1, 2004, to December 31, 2011, to replicate the motivating study. Health care in Denmark is provided through a national tax-funded system. Our study relied upon linkage between two nationwide medical registries. The first was the National Health Service Prescription Database (NHSPD),16 which includes data on all reimbursable prescriptions redeemed at community pharmacies and hospital-based outpatient pharmacies in Denmark since 2004. This database contains dispensing information including the Anatomical Therapeutic Chemical (ATC) Classification code, date of dispensing, number of prescription refills, and pack size. The second was the Danish National Patient Registry (DNPR)17 that captures information from all inpatient stays and outpatient visits at Danish hospitals. Data recorded in the DNPR include the date of hospital admission and discharge, outpatient clinic visit date, surgical procedures, and up to 20 discharge diagnoses. We linked NHSPD and DNPR using a unique 10-digit central personal registry (CPR) number assigned to each Danish citizen at birth and to residents upon immigration.
ASA use
All ASA preparations are available over the counter in Denmark. However, low-dose ASA is generally prescribed by physicians, as prescriptions are 50% reimbursable via the national health insurance program. Low-dose ASA is prescribed almost exclusively for secondary prevention of cardiovascular disease. We used ATC code B01AC06 to identify this medication.
Major bleeding
Consistent with the motivating example, we identified hospitalizations for major bleeding, including both gastrointestinal bleeding and cerebral hemorrhage, based on International Classification of Diseases, Tenth Revision (ICD-10) codes (Supplementary material).
Cohort 1
To create Cohort 1, we replicated the cohort selection process described in the motivating study using nationwide Danish data for the 2004–2011 period. First, we identified all Danish citizens who were alive and aged 30–95 years at some point between 2004 and 2011. To construct continuous ASA user sub-cohort, we identified the date that individuals redeemed their first prescription for low-dose ASA (ie, the index date). We used a 12-month washout period, indicating no use of low-dose ASA. Continuous ASA users were persons whose last ASA prescription was ≤75 days before 1) a bleeding event, 2) the end of the study period (December 31, 2011), (3) death, or (4) emigration, whichever occurred first. This approach does not consider tablets dispensed or days’ supply, but instead assumes continuous use between the first and last prescription redemption.
We then constructed the ASA never-user sub-cohort by assigning a random index date to all individuals during the study period. Among this group, we identified all individuals who were alive and aged 30–95 years on their assigned index date. Those who had filled a prescription for low-dose ASA at any point (before or after the index date) during the study period were excluded from the never-user sub-cohort. All individuals (continuous users and never-users of ASA) with a recorded diagnosis code for major bleeding in the 5 years prior to their index date were excluded from the analysis to ensure that bleeding events were incident.
Cohort 2
We next reconstructed a cohort of low-dose ASA initiators and non-initiators without conditioning on use later in the study period. To construct ASA initiator cohort, we identified the date of the first ASA prescription (ie, the index date) for individuals aged 30–95 years. We constructed non-initiator cohort by first identifying a random index date for all eligible individuals during the study period. Among this group, we identified all individuals who were alive and aged 30–95 years at their assigned index date. However, instead of excluding individuals who initiated ASA later in the study period, we excluded only individuals from this cohort who filled a low-dose ASA prescription in the 12 months prior to their randomly assigned index date. All individuals (both ASA initiators and non-initiators) with a recorded diagnosis of major bleeding in the five years prior to the index date were excluded from the analysis.
This study design allows individuals potentially to contribute twice, once as a non-initiator and once as a low-dose ASA initiator. Figure 1 illustrates this point. Individual A could be selected as a non-initiator before starting low-dose ASA in the middle of the study period. This individual would stop contributing person-time on the date of low-dose ASA initiation. At that point, individual A would enter the study as a low-dose ASA initiator.
Potential confounders
We considered the following potential baseline confounders measured during the five years prior to the index date: age, sex, previous hospitalization for alcoholism, non-bleeding ulcer disease, other non-bleeding conditions, and the individual conditions included in the Charlson Comorbidity Index18 (using ICD-10 codes). Other potential confounders were measured in the year prior to the index date and included the use of oral anticoagulants, high-dose ASA, non-selective NSAIDs, glucocorticoids, selective serotonin reuptake inhibitors, proton-pump inhibitors, nitrates, calcium antagonists, statins, and histamine-2 antagonists. All codes used to define these variables are listed in Supplementary material.
Treatment changes over time
Cohort 1 explicitly conditioned on continuous ASA use and no use, and as such, there were no treatment changes to consider in the analysis. All individuals in Cohort 1 were followed from their index date until 1) major bleeding event, 2) death, 3) emigration, or 4) end of study period (December 31, 2011), as implemented in the original study.11 In Cohort 2, we considered low-dose ASA use as a daily construct, censoring individuals when they changed their initial ASA use status. Continuous use was determined by chaining together ASA prescription redemption data using the redemption date and the defined daily dose. Days with overlapping prescriptions were not carried forward. Discontinuation of ASAs was defined as having a gap in continuous use of ASA greater than 90 days (ie, a grace period to allow for some delay in refills). We followed ASA initiators until the earliest occurrence of 1) discontinuation of ASA, 2) major bleeding event, 3) death, 4) emigration, or 5) end of study period (December 31, 2011). Similarly, we followed non-initiators from their index date until the earliest occurrence of 1) initiation of low-dose ASA, 2) major bleeding event, 3) death, 4) emigration, or 5) end of study period (December 31, 2011).
Statistical analysis
Characteristics of members of Cohorts 1 and 2 were reported using descriptive statistics. In both cohorts, we implemented a propensity-score matching approach to control for measured confounders (defined earlier) using a 8:1 greedy matching algorithm.19 We also included age and sex interactions with a history of myocardial infarction, cerebrovascular disease, diabetes, and concomitant use of statins, high-dose ASA, calcium antagonists, and nitrates. We reported matching rates (proportion of ASA initiators matched) for both cohorts. We used Poisson regression models to estimate crude and adjusted incidence rate differences (IRDs) per 1,000 person-years and incidence rate ratios (IRRs) for gastrointestinal bleeding, cerebral hemorrhage, and composite outcome of major bleeding, comparing ASA users to non-users with 95% confidence intervals (CIs). We also reported results stratified by time since ASA initiation (<90 days, 90 to <180 days, 180 days to <1 year, 1 to <2 years, and 2+ years). In Cohort 2, we substituted a 60- and 120-day grace period for a 90-day grace period to assess the robustness of our results against the assumption of medication continuity.
Comparison of study results
Due to underlying differences in the source populations of the motivating study example and the Danish study, we could not directly compare findings between the two countries. Instead, we qualitatively compared the results from analyses of Cohorts 1 and 2 based on the Danish population to isolate the impact of different study design decisions on estimates of the effect of low-dose ASA use on major bleeding risk.
All statistical analyses were performed using SAS version 9.4 (SAS Institute, Cary, NC, USA). The study was approved by the Danish Data Protection Agency (record number 2012-41-0793). No approval from an ethics committee or informed consent from patients is required for registry studies in Denmark.
Results
We identified 6,360,320 Danish citizens who were alive for at least 1 day during 2004–2011 and eligible for inclusion in this study. Figure 2A illustrates the construction of Cohort 1. After relevant exclusions, there were 189,150 new continuous users of low-dose ASA who were aged 30–95 years at the time they redeemed their first prescription and were free of major bleeding events in the previous 5 years. In total, 2,938,044 never-users of low-dose ASA were identified after relevant exclusions. Figure 2B illustrates the construction of Cohort 2. To identify new low-dose ASA users, we used similar criteria as in Cohort 1 but did not require continuous use. This yielded 403,693 new ASA users. Non-users were identified using a 12-month look-back to ensure no evidence of low-dose ASA use; however, use of ASA later in the study period was not considered, resulting in a total of 3,195,091 potential non-users.
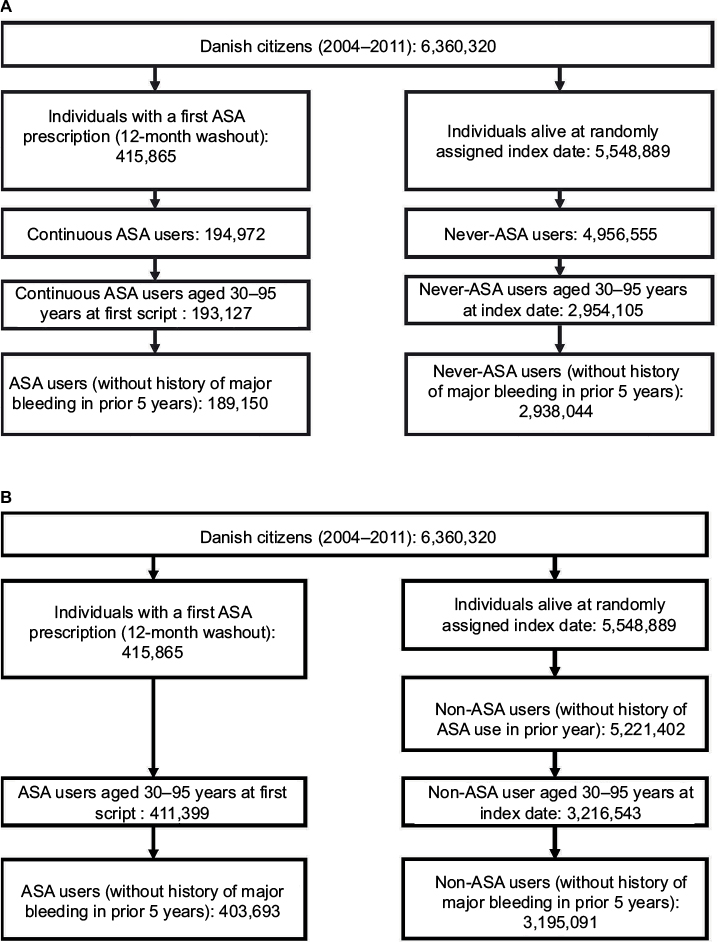 | Figure 2 Cohort construction for Cohort 1 (A) using future acetylsalicylic acid (ASA) information and Cohort 2 (B) using contemporary ASA information only. Abbreviation: ASA, acetylsalicylic acid. |
In both cohorts (prior to propensity-score matching), low-dose ASA use increased with age. In general, ASA use was more common among individuals with a variety of comorbidities and among those using concomitant medications (Tables 1 and 2). In Cohort 1, 166,983 of the 189,150 continuous ASA users were propensity-score matched to never-users (match rate=88%). After matching, the distribution of covariates was similar between the two groups. In Cohort 2, 367,326 of the 403,693 ASA users were propensity-score matched to non-users (match rate=91%), and the distribution of covariates again was similar between the two groups after matching.
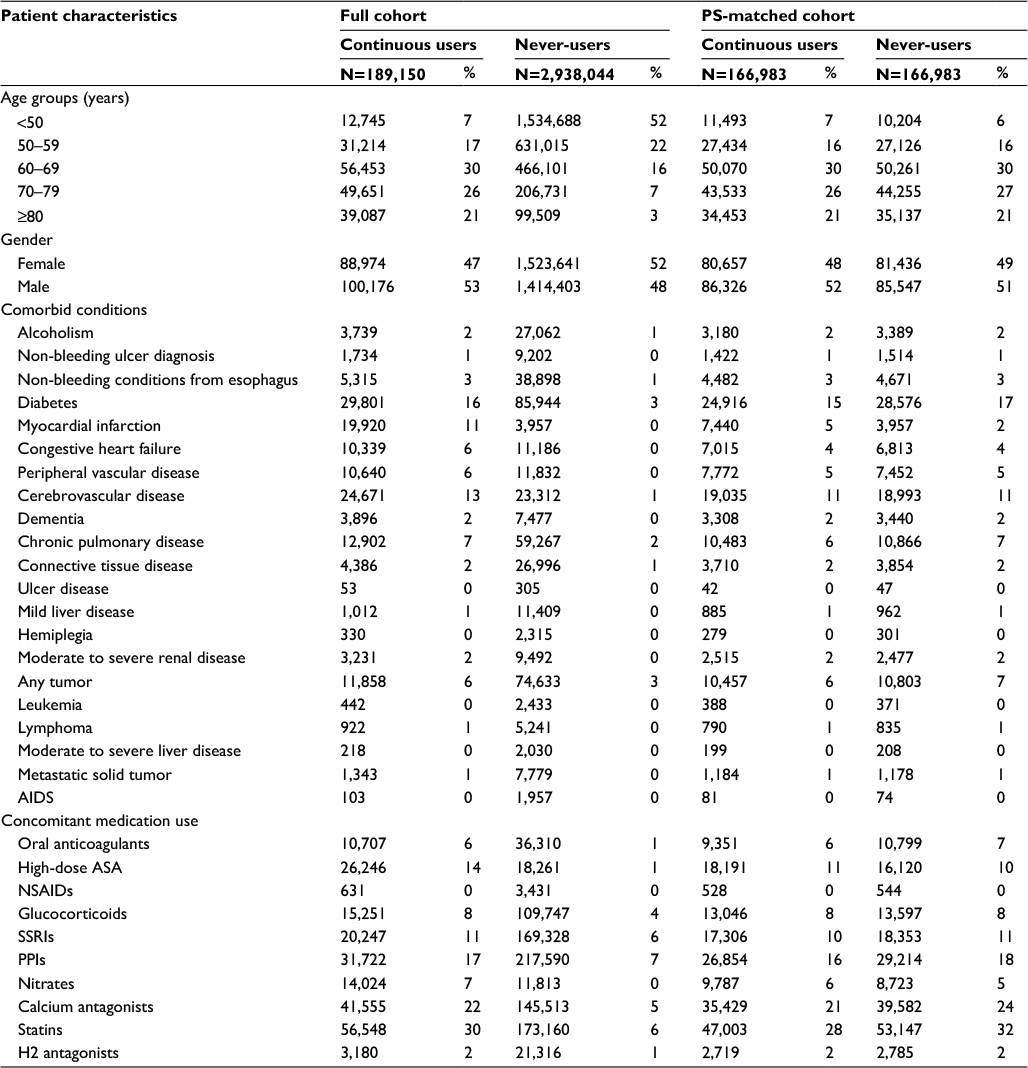 | Table 1 Patient characteristics of Cohort 1 (replication cohort) Abbreviations: PS, propensity score; ASA, acetylsalicylic acid; SSRIs, selective serotonin reuptake inhibitors; PPIs, proton-pump inhibitors; NSAIDs, nonsteroidal anti-inflammatory drugs. |
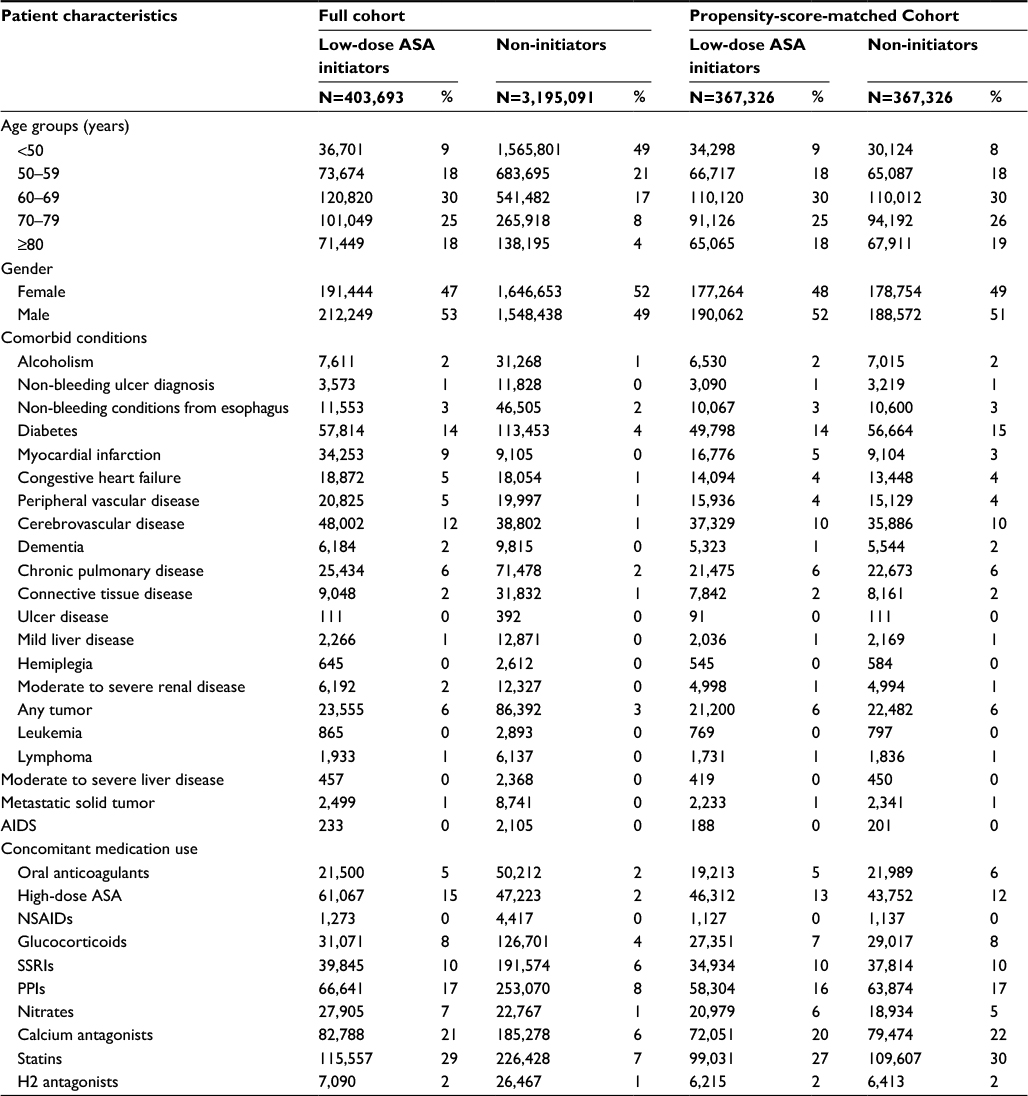 | Table 2 Patient characteristics of Cohort 2 (reconstructed cohort) Abbreviations: ASA, acetylsalicylic acid; SSRIs, selective serotonin reuptake inhibitors; PPIs, proton-pump inhibitors; NSAIDs, nonsteroidal anti-inflammatory drugs. |
Cohort 1 results
Among the 189,000 continuous users and 2.9 million never-users of low-dose ASA in Cohort 1, the median duration of follow-up (prior to propensity-score matching) was 3.25 and 3.85 years, respectively. During follow-up, 6,758 major bleeding events (5,193 gastrointestinal bleeds and 1,565 cerebral hemorrhages) occurred in continuous users and 16,032 events (10,605 gastrointestinal bleeds and 5,427 cerebral hemorrhages) occurred in never-users. The unadjusted IRD, comparing continuous versus never-users of low-dose ASA, was 9.54 (95% confidence interval [CI]: 9.28, 9.81] per 1,000 person-years and the unadjusted IRR was 7.40 (95% CI: 7.19, 7.62; Table 3).
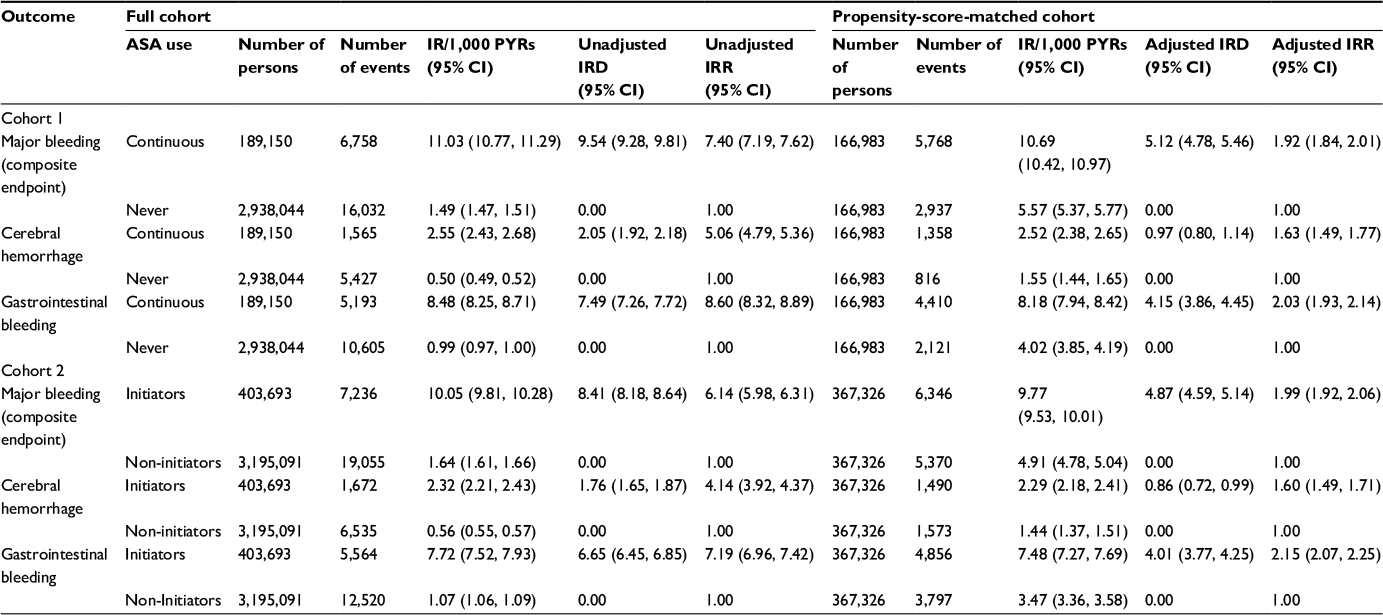 | Table 3 Association between low-dose ASA use and major bleeding (composite endpoint), cerebral hemorrhage, and gastrointestinal bleeding by cohort before and after propensity-score matching Abbreviations: ASA, acetylsalicylic acid; IR, incidence rate; PYRs, person-years; IRD, incidence rate difference; IRR, incidence rate ratio; 95% CI, 95% confidence interval. |
After propensity-score matching, the median duration of follow-up was similar, at 3.24 years among the 166,983 continuous users and 3.08 years among the 166,983 never-users of low-dose ASA. There were 5,768 major bleeding events (4,410 gastrointestinal bleeds and 1,358 cerebral hemorrhages) among continuous low-dose ASA users and 2,937 events (2,121 gastrointestinal bleeds and 816 cerebral hemorrhages) among the never-users. The adjusted IRD comparing continuous versus never-users of low-dose ASA was 5.12 (95% CI: 4.78, 5.46) per 1,000 person-years and the IRR was 1.92 (95% CI: 1.84, 2.01; Table 3).
Cohort 2 results
Among the 403,693 ASA initiators and almost 3.2 million non-initiators in Cohort 2, the median duration of follow-up was 1.02 and 3.82 years, respectively. During follow-up, a total of 7,236 major bleeding events (5,564 gastrointestinal bleeds and 1,672 cerebral hemorrhages) occurred in ASA initiators and 19,055 events (12,520 gastrointestinal bleeds and 6,535 cerebral hemorrhages) occurred in non-initiators. The unadjusted IRD comparing new low-dose ASA users versus non-users was 8.41 (95% CI: 8.18, 8.64) per 1,000 person-years and the unadjusted IRR was 6.14 (95% CI: 5.98, 6.31; Table 3).
After propensity-score matching, the median duration of follow-up was 1.01 years among the 367,326 new low-dose ASA initiators and 2.80 years among the 367,326 non-initiators, more than double compared with the propensity-score-matched Cohort 1. There were a total of 6,346 major bleeding events (4,856 gastrointestinal bleeds and 1,490 cerebral hemorrhages) in ASA initiators and 5,370 events (3,797 gastrointestinal bleeds and 1,573 cerebral hemorrhages) in non-initiators. The adjusted IRD comparing new users versus non-users of low-dose ASA was 4.87 (95% CI: 4.59, 5.14) per 1,000 person-years and the IRR was 1.99 (95% CI: 1.92, 2.06; Table 3). Results of sensitivity analyses using a 60-day and 120-day grace period in the Cohort 2 analyses were similar (Table S1).
Stratification by time
Figure 3A–D illustrates the IRDs per 1,000 person-years (A and C) and IRRs (B and D) for each outcome stratified by time from start of follow-up, comparing continuous users and never-users in Cohort 1 and new users and non-users in Cohort 2. As shown in the figures, the difference in IRDs in the first 90 days of follow-up in Cohort 1 compared with Cohort 2 was more than twice as high as the IRD in Cohort 2 for both the composite and individual outcomes. This was likely influenced by underestimation of the time-at-risk in Cohort 1. However, during follow-up, the differences in IRDs between the two cohorts diminished. The stratified IRRs were more consistent in Cohorts 1 and 2 over the follow-up period.
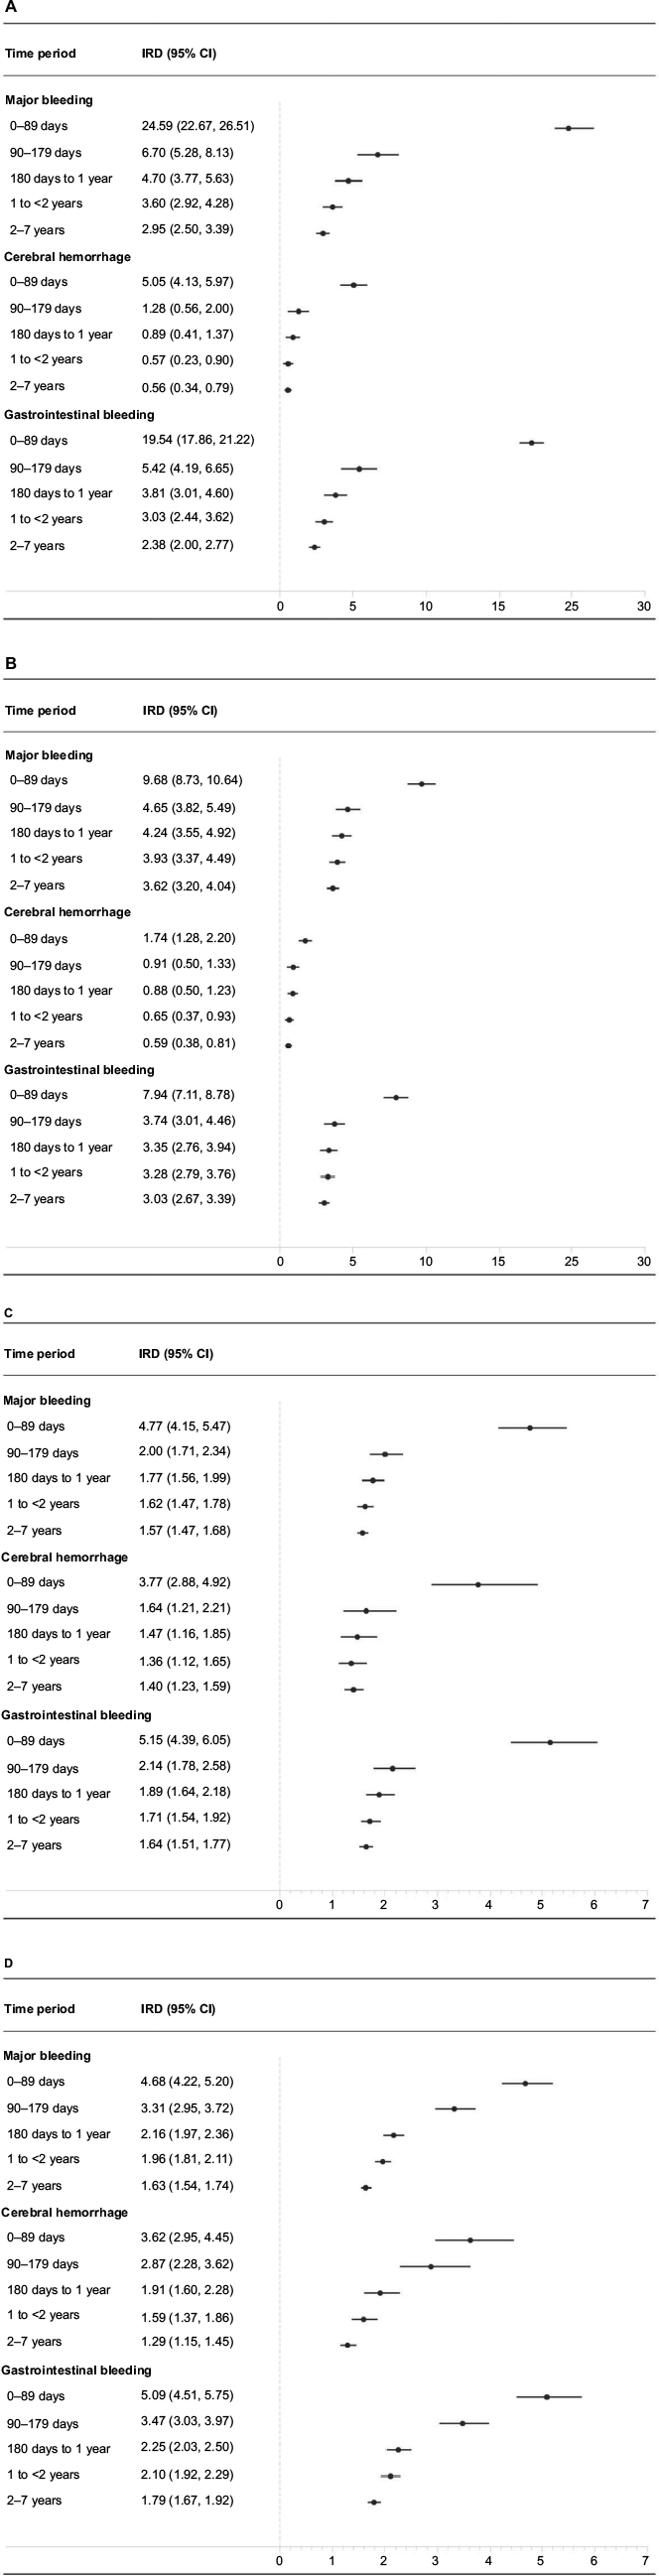 | Figure 3 (A–D) Time-stratified measures of association between low-dose acetylsalicylic acid (ASA) use and major bleeding in Cohorts 1 and 2. Cohort 1 incidence rate differences (IRDs per 1,000 person-years) and incidence rate ratios at 0–89 days, 90–179 days, 180 days to <1 year, 1 to <2 years, and 2–7 years are presented in (A) and (C), respectively. Cohort 2 IRDs and IRRs for the same time periods are presented in (B) and (D), respectively. |
Discussion
This Danish population-based study provides empirical evidence of the impact of characterizing low-dose ASA use as a time-fixed rather than daily exposure when evaluating the association between low-dose ASA and major bleeding risk. The cohorts that relied upon information recorded later in the study period to define baseline study cohorts were less than half the size of the study cohorts that did not consider this information. In the overall analysis, differences between the IRDs per 1,000 person-years and IRRs for major bleeding comparing continuous versus never-users (Cohort 1) and new users and non-users (Cohort 2) were relatively similar. Only when results were stratified by follow-up time was the bias more apparent, particularly on the absolute scale. Both IRDs and IRRs varied over follow-up time, with the most elevated risks apparent in the early period of follow-up. However, the 90-day IRDs in Cohort 1 were more than double the 90-day IRDs in Cohort 2, likely due to the underestimation of person-time at risk in Cohort 1.
The potential for time-related bias to impact pharmacoepidemiologic study results and study design approaches that avoid these biases have been well documented in the literature.20–25 A recent paper by Hernan et al26 provides an overarching framework and general argument for how study design and implementation decisions can induce bias by misaligning 1) timing of cohort eligibility, 2) treatment assignment (exposure cohort), and 3) time zero (the start of follow-up) on a conceptual level. The authors explain that misalignment can induce biases relevant to our empirical investigation, namely 1) immortal person-time bias and 2) selection bias.
Our study represents an empirical investigation of the impact of one specific scenario described by Hernan et al, driven by interest in studying the effects of sustained interventions on the risk of adverse outcomes. While the desire to create “clean” comparison groups is understandable and often appealing, using information on exposures later in the study period to assign cohort membership violates basic epidemiologic principles. Such an approach also is not compatible with emulating a hypothetical intervention, which is a prerequisite for causal inference (ie, individuals cannot be randomized to be adherent over a period of time).27–29 In our investigation, misalignment of study time points was introduced by using information about patients’ assumed adherence to low-dose ASA throughout the study period to assign baseline treatment strategies (exposure cohorts) and further to exclude individuals who were non-adherent to their assigned treatment strategy during follow-up. Such a study design approach produces immortal time bias by underestimating the time-at-risk among “continuous” ASA users and selection bias by restricting the analysis only to persons who adhere to their assigned treatment strategy throughout follow-up. The net effect of these two biases is not readily predictable and thus makes it difficult to interpret study findings.
To examine the impact of this study design, we reanalyzed data to consider low-dose ASA use as a daily exposure and constructed cohorts that aligned three requisite time points: 1) cohort eligibility, 2) treatment assignment (exposure cohort assignment), and 3) the start of follow-up. This eliminated the potential for immortal person-time bias and reduced the potential for selection bias. Our empirical investigation highlights a critically important feature of many drug-safety studies – namely that the risk of an adverse outcome can vary over time and may often peak in the early period following drug initiation (eg, depletion of susceptibles).21,23 Any misattribution of time-at-risk, particularly in these early periods, may have a dramatic impact on drug-outcome associations. Thus, studies evaluating short-term outcomes or stratifying analyses by time since the start of follow-up should be aware of this potential concern. We also observed that the magnitude of the potential biases may be scale-dependent, as the IRDs per 1,000 person-years differed substantially in Cohorts 1 and 2 for the early time periods following drug initiation. In contrast, the IRRs (on a relative scale) were relatively similar across cohorts.
A number of guidance documents provide recommendations to promote high-quality database research. Particularly relevant for the field of pharmacoepidemiology and comparative effectiveness research are three documents endorsed by the International Society for Pharmacoepidemiology: 1) Guidelines for Good Database Selection and Use in Pharmacoepidemiology Research,30 2) the Good ReseArch for Comparative Effectiveness (GRACE) principles,31 and 3) the recent REporting of studies Conducted using Observational Routinely-collected health Data (RECORD) statement (an addition to the STROBE guidelines).32 Yet only the GRACE principles include specific consideration of the potential for immortal time bias and none of the guidelines explicitly addresses concerns about alignment of the start of follow-up with treatment assignment and cohort eligibility. As shown by Suissa et al,25 Hernan et al,26 and our current investigation, the visualization of these points on a study timeline can be illuminating. Future revisions of these guidelines should consider incorporating such information.
Strengths and Limitations
The primary strengths of this study include use of a large nationwide population-based cohort of Danish adults, allowing for identification of a relatively rare outcome with sufficient precision. In addition, the database setting provided an opportunity to empirically investigate the impact of alternative study design approaches in a specific drug-outcome setting, instead of simply describing the potential for bias at a conceptual level.33 The generation of study findings on both absolute and relative scales provides additional information on how the bias related to study design decisions might be dependent on scale.
However, our results must also be interpreted considering some limitations. First, our investigation was motivated by a study performed using an Italian database, but we did not have access to that data. We thus opted to reconstruct the original study design (to the best of our ability) and then compare this with a daily (contemporaneous) exposure design using an alternative data set from a similar time period. As a result, we cannot make any direct comparisons with the motivating study. Second, while the analysis that we performed characterized low-dose ASA use as a daily exposure construct, our results remain subject to selection bias. We did not adjust for factors associated with censoring (eg, via inverse probability weighting), given the general lack of detailed information about time-varying predictors of low-dose ASA adherence. Future work tailoring these methods for use with routinely collected data (eg, claims data or medical registry data) and their impact on bias reduction is warranted.
Conclusion
The use of future exposure information to define baseline cohort membership, including drug user (and non-user) cohorts, can lead to bias with a generally unpredictable direction and magnitude. Depending on the specific setting, the impact of these design decisions on the potential for bias may be scale-dependent. Study design features that synchronize and align the start of follow-up with cohort eligibility and treatment assignment are required to avoid immortal time bias and certain forms of selection bias.
Acknowledgments
We would like to thank Dr Mark Weaver for his thoughtful comments on an earlier version of the manuscript. This study was funded by the Program for Clinical Research Infrastructure (PROCRIN) established by the Lundbeck Foundation and the Novo Nordisk Foundation and administered by the Danish Regions.
Disclosure
Dr Lund received research funding from the National Cancer Institute K12CA120780 and her spouse is a full-time paid employee of GlaxoSmithKline. Dr Stürmer has research funding (R01/56 AG023178, R01 CA174453, R01 HL118255, R21-HD080214) from the National Institutes of Health. He receives salary support as Director of the Comparative Effectiveness Research Strategic Initiative, Translational Science Award (UL1TR001111), and as Director of the Center for Pharmacoepidemiology and research support from pharmaceutical companies (Amgen, AstraZeneca) to the Department of Epidemiology at UNC. He owns stock in Novartis, Roche, BASF, AstraZeneca, and Novo Nordisk. Dr Sørensen did not report receiving fees, honoraria, grants, or consultancies. Department of Clinical Epidemiology is, however, involved in studies with funding from various companies as research grants to (and administered by) Aarhus University. None of these studies have relation to the present study. All other authors report no conflicts of interest in this work.
References
Oyinlola JO, Campbell J, Kousoulis AA. Is real world evidence influencing practice? A systematic review of CPRD research in NICE guidances. BMC Health Serv Res. 2016;16:299. | ||
Schmidt M, Pedersen L, Sorensen HT. The Danish Civil Registration System as a tool in epidemiology. Eur J Epidemiol. 2014;29(8):541–549. | ||
Sturmer T, Jonsson Funk M, Poole C, Brookhart MA. Nonexperimental comparative effectiveness research using linked healthcare databases. Epidemiology. 2011;22(3):298–301. | ||
Wettermark B, Zoega H, Furu K, et al. The Nordic prescription databases as a resource for pharmacoepidemiological research – a literature review. Pharmacoepidemiol Drug Saf. 2013;22(7):691–699. | ||
International conference on harmonisation; guidance on statistical principles for clinical trials; availability – FDA. Notice. Fed Regist. 1998;63(179):49583–49598. | ||
Hernan MA, Hernandez-Diaz S. Beyond the intention-to-treat in comparative effectiveness research. Clin Trials. 2012;9(1):48–55. | ||
Suissa S. Inhaled steroids and mortality in COPD: bias from unaccounted immortal time. Eur Resp J. 2004;23(3):391–395. | ||
Suissa S. Immortal time bias in observational studies of drug effects. Pharmacoepidemiol Drug Saf. 2007;16(3):241–249. | ||
Rothman KJ, Greenland S, Lash TL. Validity in epidemiologic studies. In: Rothman KJ, Greenland S, Lash TL, editors. Modern Epidemiology. 3rd ed. Philadelphia, PA: Lippincott Williams &Wilkins; 2008. | ||
Hernan MA, Hernandez-Diaz S, Robins JM. A structural approach to selection bias. Epidemiology. 2004;15(5):615–625. | ||
De Berardis G, Lucisano G, D’Ettorre A, et al. Association of aspirin use with major bleeding in patients with and without diabetes. JAMA. 2012;307(21):2286–2294. | ||
Bibbins-Domingo K. Aspirin use for the primary prevention of cardiovascular disease and colorectal cancer: U.S. Preventive Services Task Force recommendation statement. Ann Intern Med. 2016;164(12):836–845. | ||
Brookhart MA, Patrick AR, Dormuth C, et al. Adherence to lipid-lowering therapy and the use of preventive health services: an investigation of the healthy user effect. Am J Epidemiol. 2007;166(3):348–354. | ||
Humphrey LL, Chan BK, Sox HC. Postmenopausal hormone replacement therapy and the primary prevention of cardiovascular disease. Ann Intern Med. 2002;137(4):273–284. | ||
Ray WA, Daugherty JR, Griffin MR. Lipid-lowering agents and the risk of hip fracture in a Medicaid population. Inj Prev. 2002;8(4):276–279. | ||
Johannesdottir SA, Horvath-Puho E, Ehrenstein V, Schmidt M, Pedersen L, Sorensen HT. Existing data sources for clinical epidemiology: The Danish National Database of Reimbursed Prescriptions. Clin Epidemiol. 2012;4:303–313. | ||
Schmidt M, Schmidt SA, Sandegaard JL, Ehrenstein V, Pedersen L, Sorensen HT. The Danish National Patient Registry: a review of content, data quality, and research potential. Clin Epidemiol. 2015;7:449–490. | ||
Charlson ME, Pompei P, Ales KL, MacKenzie CR. A new method of classifying prognostic comorbidity in longitudinal studies: development and validation. J Chronic Dis. 1987;40(5):373–383. | ||
Parsons LS. Reducing bias in a propensity score matched-pair sample using greedy matching techniques. SAS SUGI 26, Paper 214-26. | ||
20.Feinstein AR. Clinical biostatistics. XI. Sources of ‘chronology bias’ in cohort statistics. Clin Pharmacol Ther. 1971;12(5):864–879. | ||
Guess HA. Behavior of the exposure odds ratio in a case-control study when the hazard function is not constant over time. J Clin Epidemiol. 1989;42(12):1179–1184. | ||
Lund JL, Richardson DB, Sturmer T. The active comparator, new user study design in pharmacoepidemiology: historical foundations and contemporary application. Curr Epidemiol Rep. 2015;2(4):221–228. | ||
Moride Y, Abenhaim L. Evidence of the depletion of susceptibles effect in non-experimental pharmacoepidemiologic research. J Clin Epidemiol. 1994;47(7):731–737. | ||
Ray WA. Evaluating medication effects outside of clinical trials: new-user designs. Am J Epidemiol. 2003;158(9):915–920. | ||
Suissa S, Azoulay L. Metformin and the risk of cancer: time-related biases in observational studies. Diabetes Care. 2012;35(12):2665–2673. | ||
Hernan MA, Sauer BC, Hernandez-Diaz S, Platt R, Shrier I. Specifying a target trial prevents immortal time bias and other self-inflicted injuries in observational analyses. J Clin Epidemiol. 2016;79:70–75. | ||
Hernan MA. Counterpoint: epidemiology to guide decision-making: moving away from practice-free research. Am J Epidemiol. 2015;182(10):834–839. | ||
Hernan MA, Robins JM. Using big data to emulate a target trial when a randomized trial is not available. Am J Epidemiol. 2016;183(8):758–764. | ||
Vandenbroucke J, Pearce N. Point: incident exposures, prevalent exposures, and causal inference: does limiting studies to persons who are followed from first exposure onward damage epidemiology? Am J Epidemiol. 2015;182(10):826–833. | ||
Hall GC, Sauer B, Bourke A, Brown JS, Reynolds MW, LoCasale R. Guidelines for good database selection and use in pharmacoepidemiology research. Pharmacoepidemiol Drug Saf. 2012;21(1):1–10. | ||
Dreyer NA, Schneeweiss S, McNeil BJ, et al. GRACE principles: recognizing high-quality observational studies of comparative effectiveness. Am J Manag Care. 2010;16(6):467–471. | ||
Benchimol EI, Smeeth L, Guttmann A, et al. The REporting of studies Conducted using Observational Routinely-collected health Data (RECORD) statement. PLoS Med. 2015;12(10):e1001885. | ||
Lund JL, Sturmer T, Toft-Sorensen H. Benefits and risks of aspirin use. JAMA. 2012;308(11):1089–1090; author reply 1090. |
Supplementary materials
International Classification of Diseases, Tenth Revision (ICD-10) and Anatomical Therapeutic Chemical (ATC) codes used in analysis
Exposure
Low-dose acetylsalicylic acid (ASA) ≤300 mg (ATC code): B01AC06
Outcome
Hospitalization for upper gastrointestinal bleeding
Bleeding from gastritis (K29.0)
Bleeding from ulcers in the stomach (K25.0, K25.2, K25.4, K25.6)
Bleeding from ulcers in the duodenum (K26.0, K26.2, K26.4, K26.6)
Bleeding from gastro-duodenal ulcers (K27.0, K27.2, K27.4, K27.6)
Bleeding from anastomotic ulcers, i.e. gastrojejunal ulcers (K28.0, K28.2, K28.4, K28.6)
Haematemesis (K92.0)
Melaena (K92.1)
Gastrointestinal hemorrhage without specification (K92.2)
Cerebral hemorrhage
ICD-10 codes I60-I62
Covariates
Previous inpatient and outpatient diagnoses for:
Alcoholism (not included in Charlson) (F10, G312, G621, G721, I426, R780, T51, Z714, Z721)
Non-bleeding ulcer diagnosis (K25.1, K25.3, K25.5, K25.7, K25.9, K26.1, K26.3, K26.5, K26.7, K26.9, K27.1, K27.3, K27.5, K27.7, K27.9, K28.1, K28.3, K28.5, K28.7, K28.9)
Non-bleeding conditions from esophagitis, gastritis, duodenitis or Mallory–Weiss lesions (K20.9, K21, K22, K23, K29.1–K29.9)
Diabetes (E10-E14, O24, H360)
Modified Charlson Comorbidity Index (Hospitalization or outpatient hospital visit):
- Myocardial infarction, I21–I23
- Congestive heart failure, I50, I11.0, I13.0, I13.2
- Peripheral vascular disease, I70–I74, I77
- Dementia, F00-F03, F05.1, G30
- Chronic pulmonary disease, J40-J47, J60-J67, J68.4, J70.1, J70.3, J84.1, J92.0, J96.1, J98.2, J98.3
- Connective tissue disease, M05, M06, M08, M09, M30-M36, D86
- Ulcer disease, K22.1, K25-K28
- Mild liver disease, B18, K70.0-K70.3, K70.9, K71, K73, K74, K76.0
- Moderate to severe renal disease, I12, I13, N00-N05, N07, N11, N14, N17-N19, Q61
- Non-metastatic solid tumor, C00-C75
- Leukemia, C91-C95
- Lymphoma, C81-C85, C88, C90, C96
- Moderate to severe liver disease, B15.0, B16.0, B16.2, B19.0, K70.4, K72, K76.6, I85;
- Metastatic solid tumor, C76-C80
- AIDS, B21-B24
Co-medications (defined during the 1 year prior to the index date)
- Oral anticoagulants (B01AA03, B01AA04)
- High dose ASA (N02BA01, N02BA51)
- Nonselective non-steroidal anti-inflammatory drugs (NSAIDs) (M01AH02, M01AH01)
- Glucocorticoids (H02AB)
- Selective serotonin reuptake inhibitors (SSRIs) (N06AB)
- Proton pump inhibitors (PPIs) (A02BC05, A02BC03, A02BC01, A02BC02, A02BC04)
- Nitrates (C01D)
- Calcium antagonists (C08)
- Statins (C10AA0, B04AB0)
- H2 antagonists (A02BA01, A02BA03, A02BA04, A02BA02, A02BA07)
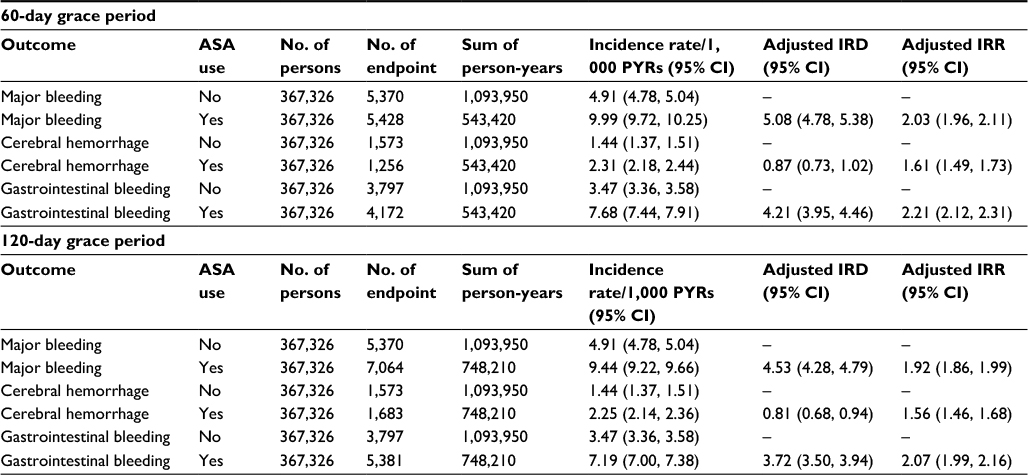 | Table S1 Results of sensitivity analyses using a 60-day and 120-day grace period in the Cohort 2 Abbreviations: ASA, acetylsalicylic acid; PYRs, person-years; IRD, incidence rate difference; IRR, incidence rate ratio; 95% CI, 95% confidence interval. |
 © 2017 The Author(s). This work is published and licensed by Dove Medical Press Limited. The full terms of this license are available at https://www.dovepress.com/terms.php and incorporate the Creative Commons Attribution - Non Commercial (unported, v3.0) License.
By accessing the work you hereby accept the Terms. Non-commercial uses of the work are permitted without any further permission from Dove Medical Press Limited, provided the work is properly attributed. For permission for commercial use of this work, please see paragraphs 4.2 and 5 of our Terms.
© 2017 The Author(s). This work is published and licensed by Dove Medical Press Limited. The full terms of this license are available at https://www.dovepress.com/terms.php and incorporate the Creative Commons Attribution - Non Commercial (unported, v3.0) License.
By accessing the work you hereby accept the Terms. Non-commercial uses of the work are permitted without any further permission from Dove Medical Press Limited, provided the work is properly attributed. For permission for commercial use of this work, please see paragraphs 4.2 and 5 of our Terms.