")
Back to Journals » Patient Preference and Adherence » Volume 10
Concordance between two methods in measuring treatment adherence in patients with type 2 diabetes
Authors Lopez-Simarro F, Brotons C, Moral I, Aguado-Jodar A, Cols-Sagarra C, Miravet-Jiménez S
Received 26 January 2016
Accepted for publication 23 February 2016
Published 4 May 2016 Volume 2016:10 Pages 743—750
DOI https://doi.org/10.2147/PPA.S105073
Checked for plagiarism Yes
Review by Single anonymous peer review
Peer reviewer comments 2
Editor who approved publication: Dr Johnny Chen
Flora López-Simarro,1 Carlos Brotons,2 Irene Moral,2 Alba Aguado-Jodar,3 Cèlia Cols-Sagarra,1 Sònia Miravet-Jiménez1
1Primary Health Care Center Martorell, Institut Català de la Salut, Barcelona, Spain; 2Research Unit, Sardenya Primary Health Care Center, Biomedical Research Institute Sant Pau (IIB Sant Pau), Teaching Unit of Family Medicine ACEBA, Barcelona, Spain; 3CAP Sagrada Família, Consorci Sanitari Integral, Barcelona, Spain
Objective: We analyzed the concordance between two methods for measuring treatment adherence (TA) and studied the determinants of TA in patients with type 2 diabetes mellitus.
Methods: We conducted a cross-sectional descriptive study in a primary care center, involving 320 diabetic patients. TA was measured using the Haynes–Sackett (H–S) adherence test during the patient interview and based on pharmacy refill data. TA was calculated globally and by drug groups (antihypertensive, lipid-lowering, and antidiabetic drugs).
Results: Poor TA as measured by the H–S test was observed in 11.2% of the patients. Based on pharmacy refill data, there was a poor global TA rate of 30.3%, which was 33.3%, 26.6%, and 34.2% for oral antidiabetic, antihypertensive, and lipid-lowering drugs, respectively. Concordance between the two methods was poor. There was no relationship between the degree of disease control and TA as measured by the H–S test. Good TA measured based on pharmacy refill data for antidiabetic and antihypertensive drugs was associated with lower glycosylated hemoglobin and diastolic blood pressure values, respectively. Patients with good global TA showed lower glycosylated hemoglobin, diastolic blood pressure, and low-density lipoprotein cholesterol values. The multivariate analysis found good oral antidiabetic adherence to be associated to free pharmacy service; good antihypertensive drug adherence to the existence of comorbidities; and good lipid-lowering drug adherence to a history of ischemic heart disease, and a more experienced physician and/or female physician.
Conclusion: Concordance between the two methods in assessing TA was low. Approximately one-third of the patients with type 2 diabetes mellitus presented poor TA in relation to antihypertensive, lipid-lowering, and antidiabetic medication. An improved TA was associated with a better control of the studied parameters. Comorbidities, such as ischemic heart disease and access to free pharmacy service, were identified as determinants of good TA.
Keywords: medication adherence, determinants of adherence, diabetes mellitus, hypertension, hyperlipidemia, validation study
Introduction
The estimated prevalence of type 2 diabetes mellitus (DM2) in Spain is 13.8%, with a prevalence of confirmed diabetes of 7.8%.1 These figures are expected to grow in future as a result of population aging and changes in lifestyle.2 People with DM2 require drug treatments for the control of their blood glucose levels, cardiovascular risk factors (CVRFs), and different comorbidities. As a result, diabetics are polymedicated patients, with complex treatment regimens, in whom treatment adherence (TA) may be clearly suboptimal.
Correct TA is crucial for the success of treatment. Good TA is known to exert a positive effect upon blood glucose control and show clinical benefits,3–5 while a lack of TA is an important cause of increased morbidity and mortality3,5,6 and increased global health care costs secondary to a greater need for emergency care and hospital admission.7,8
Many factors can influence adherence to drug therapy; as a result, TA is a complex phenomenon and is difficult to evaluate.9 Different methods have been developed for detecting deficient TA.10 The direct methods are objective but costly and difficult to apply in the clinical setting. Indirect methods are, therefore, the most widely used option, including clinical interviews and the medication refilled from the pharmacy office. The clinical interview has the advantage of reflecting patient behavior and of allowing us to determine predictors of poor TA. The inconveniences of the clinical interview are the subjectiveness of the method and the overestimation of good TA. At present, the electronic case history management program used in our center, through the pharmacotherapeutic history of the patient, allows us to determine the number of drug prescriptions refilled from the pharmacy office over the last year, corresponding to each of the prescribed medication. This system allows us to identify those patients who do not correctly refill the prescribed medication from the pharmacy, though we do not know whether the patients who refill the medication also use it correctly.
Until recently, it was only possible to determine TA in our setting by interviewing the patient in the consulting room. The present study was, therefore, designed to 1) analyze the concordance between two methods for measuring TA (self-reported adherence and prescribed medication refilled from the pharmacy office) and 2) assess the determinants of TA among diabetic patients.
Patients and methods
This is a substudy of another protocol designed to evaluate clinical inertia. The study methodology has been described elsewhere.11 In brief, a cross-sectional study was carried out involving retrospective data collection corresponding to the period between October 2008 and February 2010 in an urban primary care center serving a total of 26,446 inhabitants during that period. The University Institute for Primary Care Research Jordi Gol (IDIAP Jordi Gol) assessed the study protocol, including ethical issues and because of the type of the study the Institute did not require to obtain an ethics committee approval.
The total number of patients diagnosed with DM2 in the primary care center was 1,657, with a 6.2% prevalence for this population. We included 320 patients of either sex diagnosed with DM2 and who met the established inclusion criteria and gave verbal informed consent to participate in the study. Patients who could not be located and who failed to visit the center during the previous year and refill the prescribed chronic medication were excluded.
Stratified sampling by medical quota was made proportionally with respect to the number of diabetic patients assigned to each physician.
An ad hoc form was developed to collect the patient information from the electronic case history, recording the data corresponding to the visits that took place during the period of 1 year prior to the data entry date. Any missing information was subsequently obtained by interviewing the patient.
Study variables
Variables of the patient
Sociodemographic data, information referred to the last physical examination recorded in the case history, including the most recent laboratory test parameters, the presence of CVRFs (arterial hypertension, dyslipidemia, and smoking), and number of visits to the general practitioner and/or nurse during the previous year were collected. A patient was considered to suffer from hypertension and/or dyslipidemia if the corresponding diagnosis was recorded in the case history, or if the patient was receiving antihypertensive or lipid-lowering therapy. We also documented associated cardiovascular diseases (CVDs), the existence of retinopathy and nephropathy (the latter being defined as any degree of proteinuria and/or a glomerular filtration rate of <60 mL/min/1.73 m2 calculated using the Modification of Diet in Renal Disease Study formula) and the presence of psychiatric disease.
Variables of the professional
The following variables were collected: age, sex, specialization in family and community care medicine, years of professional practice, and years with the same patient quota.
Study end points
The study end point was the control of each of the CVRFs according to the criteria of the ADA 2010:12 glycosylated hemoglobin (HbA1c) ≤7%, blood pressure (BP) ≤130/80 mmHg, and low-density lipoprotein cholesterol (LDLc) ≤100 mg/dL.
Drug parameters
Prescription of antidiabetic, antihypertensive, and lipid-lowering treatments at their respective doses.
Treatment adherence
Two methods were used to assess TA:
- Self-reported adherence using the Haynes–Sackett (H–S) test on occasion of the patient interview. The H–S adherence test is a patient interview.13 First, the physician states that in general, patients have difficulty in taking their drugs. Next, the patient is asked about his own difficulties. If the patient replies saying that they have difficulties, then they are asked about the number of pills they have forgotten to intake during the previous 7 days. Adherence is then measured by computing the number of pills that they have taken during the previous 7 days divided by the total number of pills they were expected to take. In our case, since we were measuring adherence with regard to drug families, we regarded patients stating they had difficulties taking their medication directly as nonadherent.
- The counts of medication refilled from the pharmacy office in the previous year through the electronic prescription system. The percentage adherence corresponding to each drug was determined from the ratio between the total doses refilled from the pharmacy office in the previous year and the total doses prescribed according to the case history multiplied by 100. Poor TA was defined as a percentage adherence of <80%. TA was calculated both globally and according to drug groups (antihypertensive, lipid-lowering, and antidiabetic drugs).
Statistical analysis
An analysis was made of the sociodemographic and clinical variables stratified according to TA. Categorical variables were summarized as absolute values and percentages associated to each response category, while continuous variables were reported as the mean, standard deviation (SD), and count of valid values. A bivariate analysis was performed, contrasting TA and the use of drugs, and according to the degree of control of the CVRFs (HbA1c, BP, and LDLc). The chi-squared test was used to compare categorical variables, while the Student’s t-test for independent samples was used to compare quantitative variables. The concordance between the two TA measurement methods was established using the κ index. In turn, the determinants of TA were assessed using a logistic regression model with the inclusion of those variables found to be statistically significant in the bivariate analysis, together with variables considered to be clinically relevant. We initially used a saturated model (ie, including all the main variables), followed by elimination of the nonsignificant variables, with evaluation of the different parameters of the model and controlling for possible confounding factors. Statistical significance was considered for P<0.05. The SPSS version 18.0 statistical package (SPSS Inc., Chicago, IL, USA) was used throughout.
Results
The study comprised 320 patients with DM2, of whom 53.4% were males. The mean age was 67.5 years (SD, 10.7; range: 37–92). The mean years of evolution of diabetes were 10.4 years (SD, 6.8). The baseline characteristics of the sample have been described elsewhere.11
The most common CVRFs were hypertension (81.6%), dyslipidemia (77.5%), obesity (49.6%), and active smoking (14.7%). A personal history of CVD was present in 31.9% of the patients (ischemic heart disease in 15.9%, stroke in 11.3%, and peripheral arterial disease in 12.8%). Nephropathy was documented in 47.6% of the patients and diabetic retinopathy in 19.1% (22.8% of the patients subjected to retinographic or funduscopic evaluation). Associated psychiatric disorders were present in 36.6% of the cases.
A total of 78.4% of the patients had access to free pharmacy service, and the mean number of prescribed drugs was 7.1 (SD, 3.5).
Figure 1 shows the degree of TA globally and according to each drug group. Poor TA was recorded in 33.3% (95% confidence interval [CI]: 27.9–39.1), 26.6% (95% CI: 21.2–32.5), and 34.2% (95% CI: 27.6–41.3) of the cases referred to oral antidiabetic, antihypertensive, and lipid-lowering drugs, respectively. On assessing global TA for all the drugs, 30.3% of the patients (95% CI: 21.2–32.5) showed poor TA. The mean percentage of refilled prescriptions corresponding to all the analyzed drugs was 85.6%, while 88.8% of the patients claimed to have no problems in taking their tablets (Table 1).
 | Figure 1 Treatment adherence according to prescription refill. |
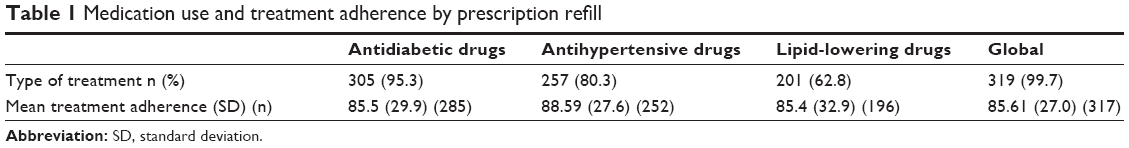 | Table 1 Medication use and treatment adherence by prescription refill |
The general profile of the patient with poor TA corresponded to a young male without access to free pharmacy service, who was an active smoker, had hypertension, had DM2 for a few years, consumed a smaller number of prescribed drugs, and made fewer visits to the nursing service (Table 2).
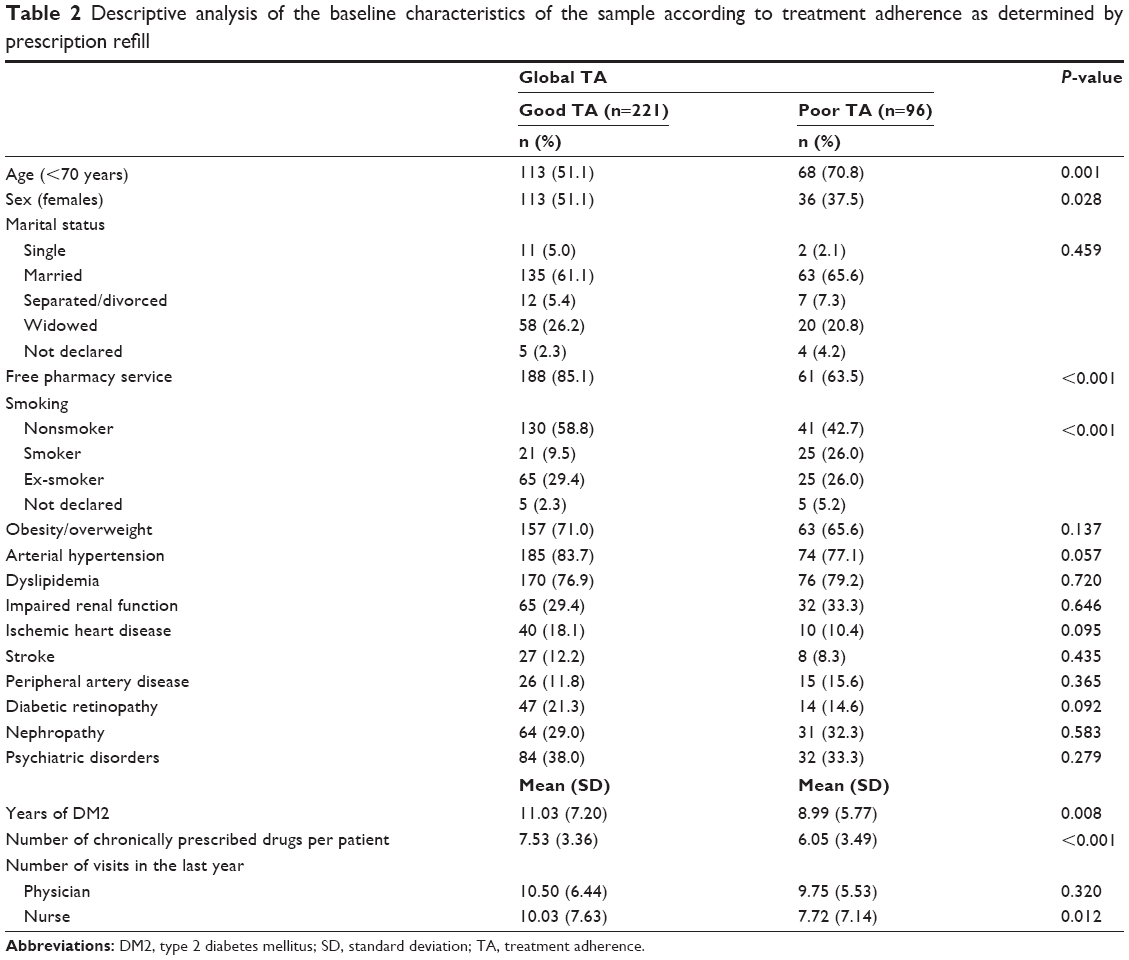 | Table 2 Descriptive analysis of the baseline characteristics of the sample according to treatment adherence as determined by prescription refill |
The concordance between the self-reported method based on the H–S test and the percentage of prescribed medication refilled from the pharmacy office was very low in all cases (Table 3).
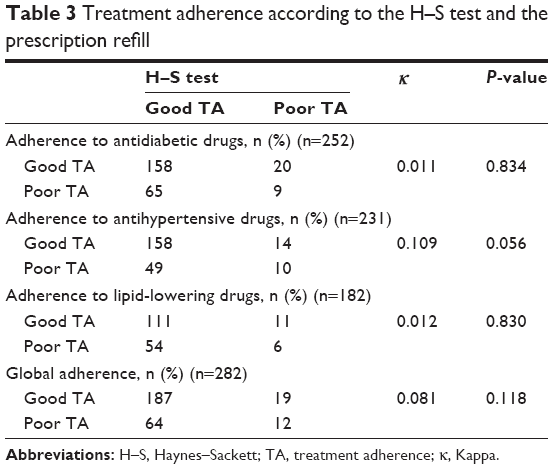 | Table 3 Treatment adherence according to the H–S test and the prescription refill |
Table 4 presents the mean values corresponding to HbA1c, systolic blood pressure (SBP), diastolic blood pressure (DBP), and LDLc according to the different TA measures used in the study. The mean values of these parameters showed no statistically significant differences between the patients who claimed to have problems in taking their medication and those who reported no such problems (H–S test). Based on the prescribed medication refill method, we found that the patients with good TA to oral antidiabetics showed lower HbA1c values; those with good TA to antihypertensive medication showed lower DBP values; and those with good TA to the total drugs studied presented significantly lower values of HbA1c, DBP, and LDLc.
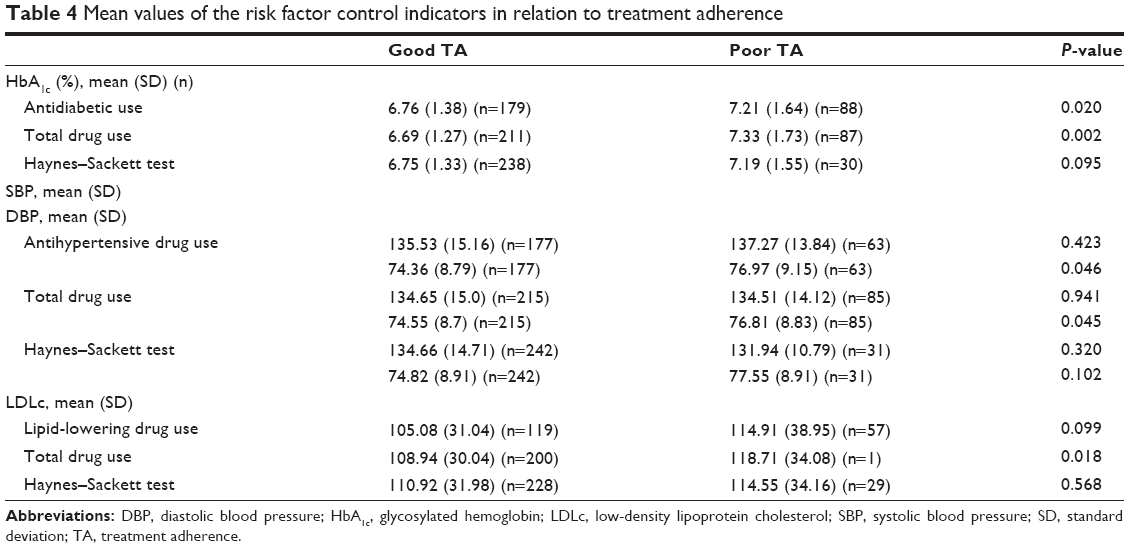 | Table 4 Mean values of the risk factor control indicators in relation to treatment adherence |
The multivariate logistic regression analysis for identifying determinants of good TA (Table 5) found good oral antidiabetic adherence to be associated to free pharmacy service; good antihypertensive drug adherence to the existence of comorbidities; and good lipid-lowering drug adherence to a history of ischemic heart disease, and a more experienced physician and/or female physician. Having assisted the same patients for more years in turn had a negative impact upon TA.
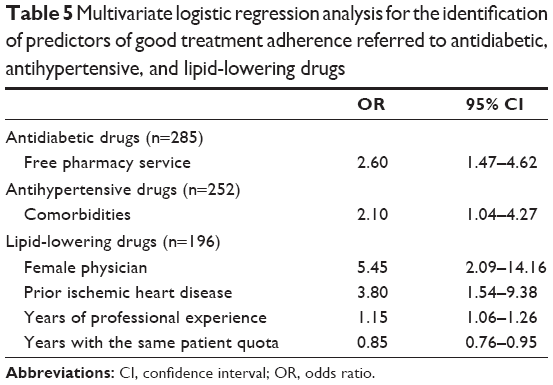 | Table 5 Multivariate logistic regression analysis for the identification of predictors of good treatment adherence referred to antidiabetic, antihypertensive, and lipid-lowering drugs |
Discussion
In the present study, the poor TA rate for the global drugs studied was 30.3%. The percentage was higher in reference to oral antidiabetics and lipid-lowering drugs (33.3% and 34.2%, respectively) and was lower in the case of antihypertensive medication (26.6%). A review analyzing TA in seven chronic diseases found that <80% of the prescribed doses were taken by 27.7%, 45.4%, and 34.6% of the patients referred to antihypertensive drugs, lipid-lowering medications, and oral antidiabetics, respectively.14 Studies that have evaluated TA to oral antidiabetics, antihypertensive drugs, and lipid-lowering medication in diabetic patients found poor TA in 20%–42% of the cases for oral antidiabetics, 19%–23% for antihypertensive drugs, and 24%–36% for lipid-lowering medication.3,15 Recently, Kirkman et al16 reported a poor TA rate for antidiabetic drugs of 31%.
Measuring adherence to therapy is difficult, since there is no ideal assessment method that can be generalized in clinical practice. In our study, TA was measured using two indirect methods: the H–S self-reported adherence test and pharmacy refill data for antidiabetic, antihypertensive, and lipid-lowering drugs. In relation to tablet counting, direct questioning about TA has low sensitivity (55%) and high specificity (87%).17 The counting of prescriptions refilled from the pharmacy office would be similar to the medication possession ratio (MPR) – a validated method18 used in many studies. An advantage of this method is the fact that the patients are unaware that they are being evaluated. The MPR has been considered to be more valid than the self-reported adherence test and is a reliable and inexpensive way to assess TA.4,19 The two methods for assessing TA probably afford complementary and different information on medication use and patient behavior. In response to questioning, 11% of the patients claimed to have difficulties taking the tablets – this figure being far lower than poor TA as assessed by the prescriptions refilled from the pharmacy office (30.3% for the total drugs). Concordance between the methods for measuring TA was low. These observations have also been found in other studies. Thus, the studies comparing methods based on self-reported adherence versus medication possession have found scant concordance between the two methods, since the patients clearly exaggerated adherence in response to questioning.20–22 In our setting, a study assessing adherence to hormone therapy in patients with breast cancer, based on self-reported TA and the prescriptions refilled from the pharmacy office during a period of 5 years, recorded low correlation between the two methods.23
In our study, the patients with good TA for the total drugs showed lower HbA1c, DBP, and LDLc values. Good TA to oral antidiabetic and antihypertensive medication was correlated to lower HbA1c and DBP values, respectively. Good TA to antihypertensive or lipid-lowering drugs was not correlated to improved control of SBP or lower LDLc values, and no association was found between the degree of control of the different parameters and TA assessment based on the H–S test. In general, most published studies report a good correlation of TA to improved glycemia, BP, and lipid control,3–5,15 since the drugs involved are used to improve the control of these parameters. This association has been found in studies in which objective methods (MPR) were used to assess TA, but not in studies in which patient self-reported adherence methods were used.5,21,22 The control of SBP in diabetic patients does not appear to be related to TA to the antihypertensive medication used.3,15 In contrast, a relationship has been described between good control and treatment intensification on the part of the treating physician.24
The sociodemographic characteristics of the patients are not a clear determinant of poor TA. The review carried out by Kardas et al9 on the factors determining adherence found old age and the female sex to exert small positive effects upon TA. In general, diabetic patients of older age and with good cognitive function show better global TA rates than young individuals.3,14,25–27 In the present study, patients <70 years of age showed poorer TA. With regard to sex, females showed better global TA rates. The data from other studies are heterogeneous in this respect, with women exhibiting better adherence in some studies26,28 and males in others.16,27
Regarding the impact of comorbidities and pharmacological burden upon TA, patients with poor TA tend to have fewer comorbidities and with fewer and less severe symptoms,3,8,9 while patients with CVDs are more likely to be adherent to therapy – particularly with statins.28,29 According to our multivariate analysis, the diabetic patients with arterial hypertension and ischemic heart disease showed better TA to antihypertensive and lipid-lowering drugs, respectively. Diabetes in the presence of major depression or depressive symptoms has been associated to poor adherence to diet, exercise, and drug treatment.30 In our study, the presence of psychiatric disorders was not correlated to poorer TA. Regarding the impact of the number of drugs used, patients with an increased pharmacological burden are known to show better TA,16,25–27 in concordance with our own findings.
The years of evolution of DM2 appear to have a positive impact on TA.22 The patients with good global TA in our series showed a longer duration of diabetes. Improved TA in patients with ischemic heart disease, a greater number of drugs, and longer evolving illness is probably related to enhanced disease awareness among these patients.
The diabetic patients with access to free pharmacy service presented better global TA rates – with statistical significance for oral antidiabetics in the multivariate analysis. It is known that increasing patient contribution to payment of the cost of treatment results in decreased TA.6,19,27,30,31
Regarding the influence of the characteristics of the general practitioner upon TA, we only found an effect related to lipid-lowering drugs. A good TA was associated with female physicians with more years of professional experience. In contrast, having assisted the same patients for more years had a negative impact upon TA. The impact of the characteristics of the physician in relation to lipid-lowering treatment was probably related to the therapeutic inertia induced in the patients referred to both the start and the intensification of therapy.11 Kirkman et al16 recorded no differences in patient adherence according to the sex of the prescribing physician, although improved TA was significantly associated to older physician age. Few data are available in published studies regarding the impact of the characteristics of the health professional upon TA, although the care provider involved and physician–patient communication are probably important contributing factors. Further research on the great variability in the care provided by the different professionals would be advisable.
One of the limitations of our study is that it was conducted in a single primary care center. No analysis of TA pertaining to insulin was made due to the difficulties in assessing such adherence, and no study pertaining to lifestyle (ie, diet and exercise) was carried out, and these factors are crucial for the control of type 2 diabetes. Another limitation is the method used to assess TA because although we can count the medication refilled from the pharmacy office, we do not know whether the treatment is correctly used by the patient. On the other hand, by excluding patients who failed to visit during the previous year, we excluded some individuals with nonadherence to the health care system, and these patients probably also show poor TA. Nevertheless, there were few of these patients, and some individuals may have purchased the medications directly from the pharmacy office.
Conclusion
The concordance between the two methods used to evaluate TA was poor. Counting the prescriptions refilled from the pharmacy office is a good method for assessing TA and is a better choice than the self-reported adherence test.
Approximately one-third of the patients with DM2 presented poor TA to the different drug groups analyzed. Good TA was associated to improved control of the study parameters.
Determinants of good TA were found to be associated with free pharmacy service; good antihypertensive drug adherence to the existence of comorbidities; and good lipid-lowering drug adherence to a history of ischemic heart disease, and a more experienced physician and/or female physician. Having assisted the same patients for more years in turn had a negative impact upon TA.
Acknowledgments
Thanks are due to Drs José Mancera Romero and Margarita Alonso Fernández for their critical reading of and suggestions made to the initial manuscript. The study was funded partially by a doctoral grant awarded to Dr Flora López-Simarro by IDIAP Jordi Gol and Institut Català de la Salut.
Disclosure
The authors report no conflicts of interest in this work.
References
Soriguer F, Goday A, Bosch-Comas A, et al. Prevalence of diabetes mellitus and impaired glucose regulation in Spain: the [email protected] Study. Diabetologia. 2012;55(1):88–93. | ||
International Diabetes Federation. IDF Diabetes Atlas. 7th edition. Available from: http://www.diabetesatlas.org. Accessed December 6, 2015. | ||
Ho PM, Rumsfeld JS, Masoudi FA, et al. Effect of medication nonadherence on hospitalization and mortality among patients with diabetes mellitus. Arch Intern Med. 2006;166(17):1836–1841. | ||
Cramer JA, Benedict A, Muszbek N, Keskinaslan A, Khan ZM. The significance of compliance and persistence in the treatment of diabetes, hypertension and dyslipidaemia: a review. Int J Clin Pract. 2008;62(1):76–87. | ||
Asche C, LaFleur J, Conner C. A review of diabetes treatment adherence and the association with clinical and economic outcomes. Clin Ther. 2011;33(1):74–109. | ||
Gibson TB, Song X, Alemayehu B, et al. Cost sharing, adherence, and health outcomes in patients with diabetes. Am J Manag Care. 2010;16(8):589–600. | ||
Sokol MC, McGuigan KA, Verbrugge RR, Epstein RS. Impact of medication adherence on hospitalization risk and healthcare cost. Med Care. 2005;43(6):521–530. | ||
Egede LE, Gebregziabher M, Dismuke CE, et al. Medication nonadherence in diabetes: longitudinal effects on costs and potential cost savings from improvement. Diabetes Care. 2012;35(12):2533–2539. | ||
Kardas P, Lewek P, Matyjaszczyk M. Determinants of patient adherence: a review of systematic reviews. Front Pharmacol. 2013;4:91. | ||
Sabate E. Adherence to Long-term Therapies: Evidence for Action. Geneva, Switzerland: World Health Organization; 2003. Available from: http://www.who.int/chp/knowledge/publications/adherence_introduction.pdf?ua=1. Accessed March 10, 2016. | ||
López-Simarro F, Brotons C, Moral I, et al. Inercia y cumplimiento terapéutico en pacientes con diabetes mellitus tipo 2 en atención primaria [Inertia and treatment compliance in patients with type 2 diabetes mellitus in primary care]. Med Clin. 2012;138(9):377–384. Spanish. | ||
American Diabetes Association. Clinical Practice Recommendations 2010. Executive summary: standards of medical care in diabetes-2010. Diabetes Care. 2010;33(Suppl 1):S4–S10. | ||
Haynes RB, Taylor DW, Sackett DL, Gibson ES, Bernholz CD, Mukherjee J. Can simple clinical measurements detect patient noncompliance? Hypertension. 1980;2(6):757–764. | ||
Briesacher BA, Andrade SE, Fouayzi H, Chan KA. Comparison of drug adherence rates among patients with seven different medical conditions. Pharmacotherapy. 2008;28(4):437–443. | ||
Pladevall M, Williams LK, Potts LA, Divine G, Xi H, Lafata JE. Clinical outcomes and adherence to medications measured by claims data in patients with diabetes. Diabetes Care. 2004;27(12):2800–2805. | ||
Kirkman MS, Rowan-Martin MT, Levin R, et al. Determinants of adherence to diabetes medications: findings from a large pharmacy claims database. Diabetes Care. 2015;38(4):604–609. | ||
Stephenson BJ, Rowe BH, Haynes RB, Macharia WM, Leon G. The rational clinical examination. Is this patient taking the treatment as prescribed? JAMA. 1993;269(21):2779–2781. | ||
Hess LM, Raebel MA, Conner DA, Malone DC. Measurement of adherence in pharmacy administrative databases: a proposal for standard definitions and preferred measures. Ann Pharmacother. 2006;40(7–8):1280–1288. | ||
Clifford S, Perez-Nieves M, Skalicky AM, Reaney M, Coyne KS. A systematic literature review of methodologies used to assess medication adherence in patients with diabetes. Curr Med Res Opin. 2014;30(6):1071–1085. | ||
Garber MC, Nau DP, Erickson SR, Aikens JE, Lawrence JB. The concordance of self-report with other measures of medication adherence: a summary of the literature. Med Care. 2004;42(7):649–652. | ||
Cook CL, Wade WE, Martin BC, Perri M 3rd. Concordance among three self-reported measures of medication adherence and pharmacy refill records. J Am Pharm Assoc (2003). 2005;45(2):151–159. | ||
Cohen HW, Shmukler C, Ullman R, Rivera CM, Walker EA. Measurements of medication adherence in diabetic patients with poorly controlled HbA(1c). Diabet Med. 2010;27(2):210–216. | ||
Font R, Espinas JA, Gil-Gil M, et al. Prescription refill, patient self-report and physician report in assessing adherence to oral endocrine therapy in early breast cancer patients: a retrospective cohort study in Catalonia, Spain. Br J Cancer. 2012;107(8):1249–1256. | ||
Vigen R, Shetterly S, Magid DJ, et al. A comparison between antihypertensive medication adherence and treatment intensification as potential clinical performance measures. Circ Cardiovasc Qual Outcomes. 2012;5(3):276–282. | ||
An J, Nichol MB. Multiple medication adherence and its effect on clinical outcomes among patients with comorbid type 2 diabetes and hypertension. Med Care. 2013;51(10):879–887. | ||
Guénette L, Moisan J, Breton MC, Sirois C, Grégoire JP. Difficulty adhering to antidiabetic treatment: factors associated with persistence and compliance. Diabetes Metab. 2013;39(3):250–257. | ||
Tunceli K, Zhao C, Davies MJ, et al. Factors associated with adherence to oral antihyperglycemic monotherapy in patients with type 2 diabetes. Patient Prefer Adherence. 2015;9:191–197. | ||
Mann DM, Woodward M, Muntner P, Falzon L, Kronish I. Predictors of nonadherence to statins: a systematic review and meta-analysis. Ann Pharmacother. 2010;44(9):1410–1421. | ||
Malik S, Billimek J, Greenfield S, Sorkin DH, Ngo-Metzger Q, Kaplan SH. Patient complexity and risk factor control among multimorbid patients with type 2 diabetes: results from the R2D2C2 study. Med Care. 2013;51(2):180–185. | ||
Krass I, Schieback P, Dhippayom T. Adherence to diabetes medication: a systematic review. Diabet Med. 2015;32(6):725–737. | ||
Eaddy MT, Cook CL, O’Day K, Burch SP, Cantrell CR. How patient cost-sharing trends affect adherence and outcomes: a literature review. P T. 2012;37(1):45–55. |
 © 2016 The Author(s). This work is published and licensed by Dove Medical Press Limited. The full terms of this license are available at https://www.dovepress.com/terms.php and incorporate the Creative Commons Attribution - Non Commercial (unported, v3.0) License.
By accessing the work you hereby accept the Terms. Non-commercial uses of the work are permitted without any further permission from Dove Medical Press Limited, provided the work is properly attributed. For permission for commercial use of this work, please see paragraphs 4.2 and 5 of our Terms.
© 2016 The Author(s). This work is published and licensed by Dove Medical Press Limited. The full terms of this license are available at https://www.dovepress.com/terms.php and incorporate the Creative Commons Attribution - Non Commercial (unported, v3.0) License.
By accessing the work you hereby accept the Terms. Non-commercial uses of the work are permitted without any further permission from Dove Medical Press Limited, provided the work is properly attributed. For permission for commercial use of this work, please see paragraphs 4.2 and 5 of our Terms.