")
Back to Journals » Diabetes, Metabolic Syndrome and Obesity » Volume 14
Computed Tomography-Estimated Pancreatic Steatosis is Associated with Carotid Plaque in Type 2 Diabetes Mellitus Patients: A Cross-Sectional Study from China
Authors Sun P, Fan C, Wang R, Chu T, Sun X, Zhang D, Du X
Received 24 December 2020
Accepted for publication 10 February 2021
Published 22 March 2021 Volume 2021:14 Pages 1329—1337
DOI https://doi.org/10.2147/DMSO.S299060
Checked for plagiarism Yes
Review by Single anonymous peer review
Peer reviewer comments 3
Editor who approved publication: Prof. Dr. Juei-Tang Cheng
Pengtao Sun,1,* Chunzhi Fan,2,* Rengui Wang,1 Tongwei Chu,3 Xiaoli Sun,1 Dongxue Zhang,4 Xuechao Du5
1Department of Radiology, Beijing Shijitan Hospital, Capital Medical University, Beijing, 100038, People’s Republic of China; 2Department of Ultrasound Medicine, Beijing Chaoyang Hospital, Capital Medical University, Beijing, 100020, People’s Republic of China; 3Department of Ultrasound, Beijing Shijitan Hospital, Capital Medical University, Beijing, 100038, People’s Republic of China; 4Department of Endocrinology, Beijing Shijitan Hospital, Capital Medical University, Beijing, 100038, People’s Republic of China; 5Department of Radiology, Beijing Chaoyang Hospital, Capital Medical University, Beijing, 100043, People’s Republic of China
*These authors contributed equally to this work
Correspondence: Xuechao Du
Department of Radiology, Beijing Chaoyang Hospital, Capital Medical University, 5 Jingyuan Road, Shijingshan District, Beijing, 100043, People’s Republic of China
Tel +86 13552588221
Email [email protected]
Objective: To explore potential effects of pancreatic fat content measured by computed tomography (CT) on carotid plaque in patients with type 2 diabetes mellitus (T2DM).
Methods: T2DM patients who underwent an un-enhanced CT scan of the upper abdomen and ultrasound of the carotid artery were enrolled. The patients were divided into a non-plaque group and a plaque group (including hypoechoic plaque subgroup and non-hypoechoic plaque subgroup). The CT attenuation of pancreas and spleen were measured. Pancreas-to-spleen attenuation ratio (P/S) and the difference between pancreatic and splenic attenuation (P-S) were calculated. The cutoff values of P/S and P-S were obtained using receiver operating characteristic curves. Logistic regression models were used to evaluate association of P/S or P-S with carotid plaque or hypoechoic plaque.
Results: 337 patients were enrolled, including 101 cases in the non-plaque group, 146 cases in the hypoechoic plaque subgroup, and 90 cases in the non-hypoechoic plaque subgroup. P/S and P-S in hypoechoic plaque group were lower than those in non-plaque group, with a cutoff value of P/S and P-S as 0.72 and − 13.33, respectively. After adjusting for risk factors, P/S and P-S correlated with carotid plaque [for low P/S: OR (95% CI): 3.15 (1.47– 6.73), P = 0.0031; for low P-S: OR (95% CI): 2.84 (1.42– 5.66), P = 0.0031] as well as carotid hypoechoic plaque [for low P/S: OR (95% CI): 1.82 (1.07– 3.08), P = 0.0259; for low P-S: OR (95% CI): 1.82 (1.09– 3.02), P = 0.021].
Conclusion: T2DM patients with hypoechoic carotid plaque have higher pancreatic fat content than those without. Pancreatic steatosis correlates with carotid plaque and hypoechoic plaque in T2DM patients.
Keywords: atherosclerosis, computed tomography, diabetes mellitus, pancreatic steatosis
Introduction
Carotid plaque is the main pathological feature of carotid atherosclerosis, which is closely related to the development of cerebral infarctions.1 Furthermore, hypoechoic carotid plaque is associated with an adverse cerebrovascular outcome independent of stenosis severity.2 Evaluating the risk factors of carotid plaque for cerebral infarctions will facilitate its prevention and treatment. Ectopic fat deposition, characterized by accumulation of fat tissue in the liver, pancreas, and skeletal muscle,3 may release various bioactive factors to promote the development of cardiovascular diseases.4 Ectopic fat deposition in the pancreas is defined as pancreatic steatosis.5 Histology is the gold standard for diagnosis of pancreatic steatosis. However, it is an invasive examination, which limits its wide application. Computed tomography (CT) quantitative measurement of pancreatic fat content has a high accuracy, proven to be a reliable non-invasive method.6 In recent years, pancreatic steatosis was diagnosed by CT in burgeoning literatures.7,8
Although several reports indicated the relationship between pancreatic steatosis measured by CT and atherosclerosis, most of them focused on arterial intima-media or intima thickness.9,10 However, carotid plaque may provide more direct evidence of subclinical atherosclerosis than intimal thickness. In addition, predictive value of carotid plaque for cardiovascular adverse events may be higher than carotid intima-media thickness.11 Thus, demonstrating a relationship between pancreatic steatosis and carotid plaque may be more useful to identify patients at high risk of ischemic stroke. Indeed, pancreatic steatosis was related to arterial calcified plaque in healthy people.12 However, there are very few reports on the relationship between pancreatic steatosis and carotid plaque (especially hypoechoic plaque) in patients with type 2 diabetes mellitus (T2DM). Therefore, our study aims to investigate if there is a relationship between pancreatic steatosis and carotid plaque in patients with T2DM.
Methods
This retrospective study was reviewed and approved by the institutional ethics committee. This study was conducted in accordance with the Declaration of Helsinki. This study retrospectively analyzed 337 Chinese patients with T2DM from January 2016 to January 2020. Inclusion criteria were as follows: (1) age ≥20 years old; (2) diagnosis according to 2020 American Diabetes Association standards;13 (3) with complete information on upper abdominal un-enhanced CT scan, carotid artery ultrasound and biochemical examination; and (4) all the above examinations were performed within 2 weeks. Exclusion criteria were as follows: (1) with pancreatic diseases (eg, acute or chronic pancreatitis, pancreatic neoplasms); (2) liver and kidney failure; (3) systemic infectious diseases; (4) malignant tumors; (5) treatment with glucocorticoids. Basic information was recorded, including age, gender, blood pressure, height, weight, and smoking history, diabetes duration and biochemical examination.
Carotid Ultrasound Examination and Plaque Assessment (Figure 1)
Ultrasound examinations were conducted by two experienced sonographers (TW C and Y L) with more than 5-years work experience. An ultrasonic detector (Philips iE33 or GE Logic E9) with a 10 MHz linear array probe was used to evaluate the carotid artery. Patients were examined in supine position, and intima-media thickness (IMT) of bilateral carotid arteries (including common and internal carotid artery, as well as bifurcations) were measured. Carotid plaque was defined as IMT ≥ 1.5 mm or local thickness exceeding 50% of the adjacent lumen.14 Hypoechoic plaque was defined as a plaque appearing black as flowing blood, and hyperechoic plaque was defined as a plaque appearing white similar to the far wall media-adventitia interface. According to the presence or absence of carotid plaque, patients were divided into a non-plaque group and a plaque group. The plaque group was classified into a hypoechoic plaque subgroup and a non-hypoechoic (either mixed echoic or hyperechoic) plaque subgroup according to the presence or absence of hypoechoic plaque.
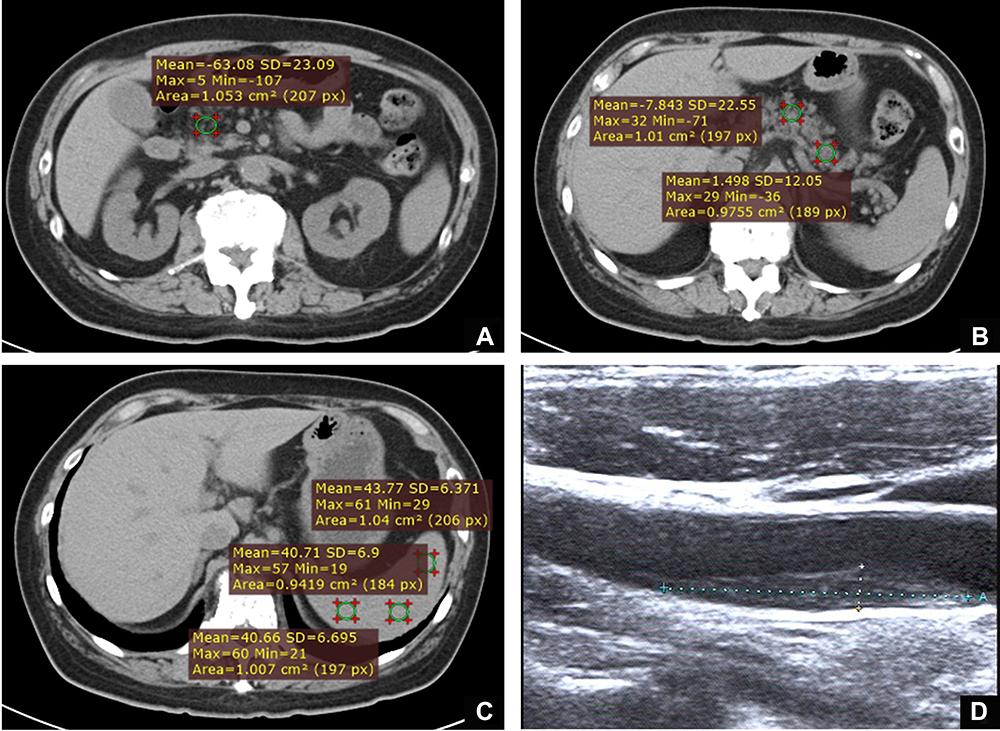 |
Figure 1 Un-enhanced axial CT and ultrasound images of a patient. The difference between pancreatic and splenic attenuation (P-S) and pancreas-to-spleen attenuation ratio (P/S) were -64.85 and -0.55, respectively. (A) CT measurement of pancreatic head. (B) CT measurement of pancreatic body and pancreatic tail. (C) CT measurement of three different parts of the spleen. (D) Ultrasound image of the carotid hypoechoic plaque. |
Thirty carotid artery ultrasound images were randomly selected from our patients for reliability analysis of plaque echogenicity. Two sonographers evaluated the echogenicity of plaque separately, and one of them re-evaluated again after 2 weeks. Since IMT of the carotid artery can only be obtained during the operation, we recollected 20 patients for reliability analysis. Two sonographers measured them separately, and one of them remeasured IMT again an hour later.
CT Scan and Pancreatic Fat Content Measurement (Figure 1)
Upper abdominal un-enhanced CT scans were performed on a spiral CT scanner (Siemens Somatom Sensation 16 CT or Brilliance iCT, Philips Healthcare). Scan parameters were as follows: kVp, 100–120; mAs, 100–250; pitch 1; slice thickness and slice spacing, 2 mm. The measurement of CT images was done by a radiologist (PT S) with more than 7-years work experience. Attenuation (Hounsfield units, HU) within the head, body and tail, respectively, of the pancreas was measured on CT axial images, where the largest diameter of anatomical part was observed. The ROI area was 1.0 cm2. The main pancreatic duct, pancreatic edge and splenic vessels were carefully avoided during measurement. CT attenuation of 3 different parts of the spleen was measured. The average CT attenuation of the pancreas and spleen, respectively, was calculated. The difference between pancreatic and splenic attenuation (P-S), and pancreas-to-spleen attenuation ratio (P/S) was calculated.
After a 1 month interval, the same radiologist performed a CT measurement again for repeatability analysis.
Statistical Analysis
Statistical analysis was performed using SAS version 9.1 (SAS, Cary, NC, USA) and SPSS version 26.0 (SPSS Inc.). The intraclass correlation coefficient (ICC) was used to evaluate the repeatability of pancreas and spleen CT attenuation, and IMT. Weighted Kappa was used to evaluate the repeatability of carotid plaque echogenicity. Basic clinical data and CT measurements were compared by using the Kruskal–Wallis rank test or the chi-square test. Receiver operating characteristic (ROC) was analyzed by MedCalc software. Cutoff values of P/S and P-S were obtained using ROC. Low P/S or low P-S was defined as pancreatic steatosis. Carotid plaque or hypoechoic plaque was considered as a dependent variable. Univariate logistic regression was created to analyze relationship of plaque with P/S or P-S. Statistically significant factors in univariate logistic regression as well as clinical factors, such as age, gender, obesity (body mass index ≥30 kg/m2), duration of diabetes, hypertension, smoking, total cholesterol, triglycerides and high-density lipoprotein, were selected for multivariate logistic regression. Statistical significance was defined at a p < 0.05 (2-sided).
Results
Patients Characteristics
A total of 337 patients with T2DM were enrolled in this study, with an average age of 60.1 ± 11.7 years old. Among them, 201 cases (59.6%) were male with an average age of 57.4 ± 11.9 years old, while 136 cases (40.4%) were female with an average age of 64.2 ± 10.3 years old. There were 101 cases (30.0%) in the non-plaque group, whereas there were 236 cases (70.0%) in the plaque group; with 146 cases in the hypoechoic plaque subgroup (43.3%) and 90 cases (26.7%) in the non-hypoechoic plaque subgroup. Basic information of the study population is summarized in Table 1.
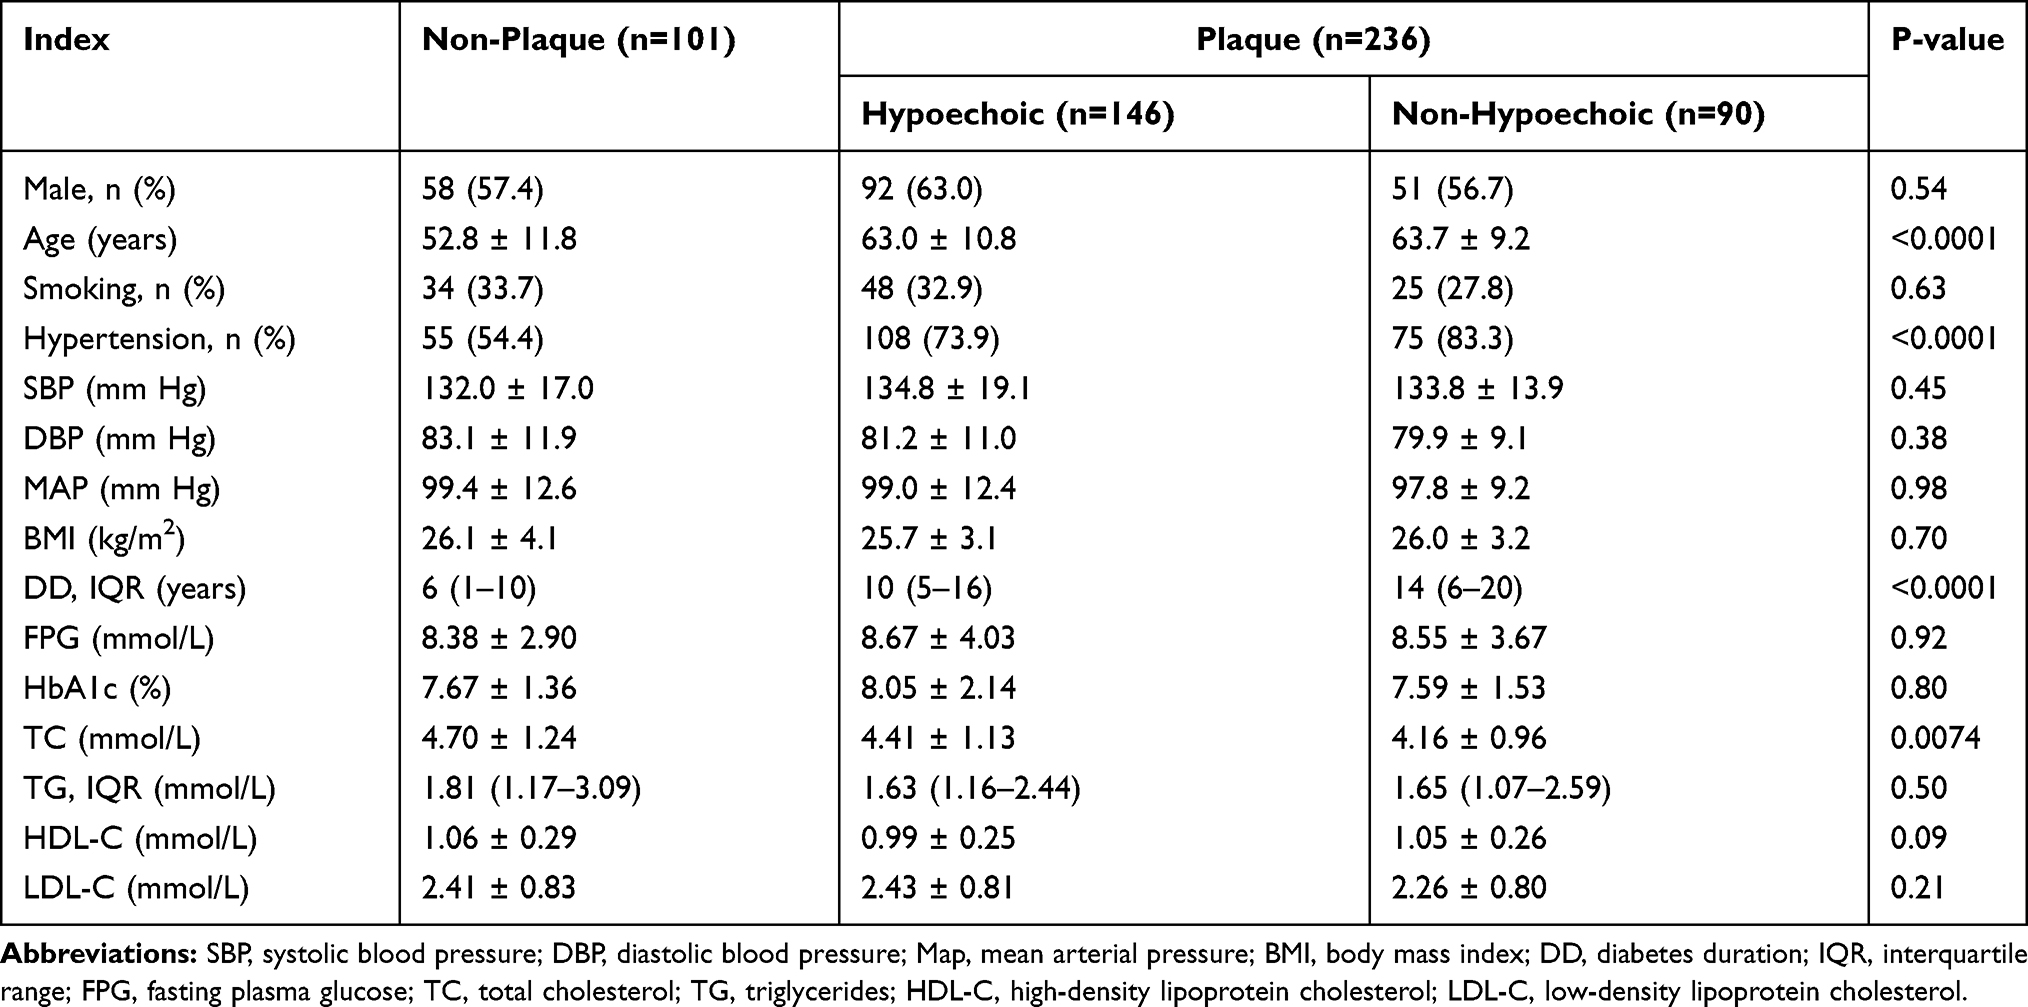 |
Table 1 Clinical and Laboratory Characteristics of Study Population |
There were statistical differences in the age, duration of diabetes, total cholesterol, and hypertension in the three groups: there were differences in age (P<0.001), the duration of diabetes (P<0.001), and the proportion of hypertension between the hypoechoic group and the non-plaque group; there were differences in age (P<0.001), duration of diabetes (P<0.001), total cholesterol (P = 0.005), and the proportion of hypertension between the non-hypoechoic group and the non-plaque group; there was no difference in the above factors between the hypoechoic group and the non-hypoechoic group. Patients in the plaque group were elder, with longer duration of T2DM. Hypertension was more common in the plaque group. Total cholesterol level was higher in the non-plaque group. Gender, smoking ratio, systolic blood pressure, diastolic blood pressure, mean arterial pressure, BMI, fasting blood glucose, HbA1c, triacylglycerol, high-density lipoprotein, and low-density lipoprotein were comparable between the three groups.
Repeatability of CT and Ultrasound Measurements
The results showed that the intra-rater ICC of the average CT attenuation of the pancreas and spleen were 0.981 (P<0.001) and 0.898 (P<0.001), respectively. The inter-rater and intra-rater ICC of the carotid arterial IMT were 0.979 (P<0.001) and 0.989 (P<0.001), respectively. The weighted Kappa of inter-rater and intra-rater ICC of plaque echogenicity were 0.808 and 0.859, respectively (P<0.001). It is suggested that the repeatability of CT and ultrasound results is good, and the analysis results in this article are credible.
CT Evaluation of Pancreatic Steatosis
There were statistical differences in the average CT attenuation of the pancreas, P/S and P-S in the three groups: there were differences in the average CT attenuation of the pancreas (P = 0.001), P/S (P = 0.002), and P-S (P = 0.003) between the hypoechoic group and the non-plaque group; there were differences in the average CT attenuation of the pancreas (P = 0.015) between the non-hypoechoic group and the non-plaque group; there was no difference in the above three indexes between the hypoechoic group and the non-hypoechoic group. Compared with the non-plaque group, CT attenuation of the pancreas, P/S and P-S were lower in the plaque group. There was no difference in CT attenuation of the spleen between the two groups (Table 2).
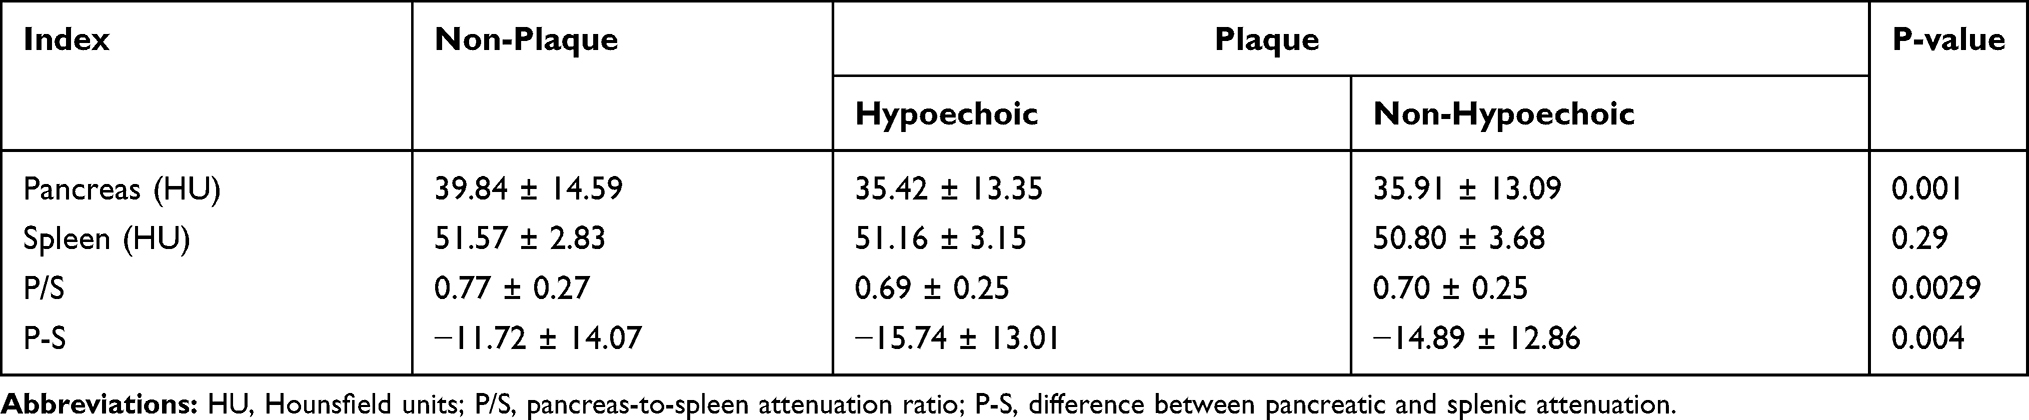 |
Table 2 Comparison of Pancreatic Fat Content |
Based on ROC curves (Figure 2), the cutoff value of P/S was 0.72, and the area under the curve was 0.61. The sensitivity and specificity of P/S for predicting carotid plaque was 41.1% and 80.2%, respectively (P = 0.0005). The cutoff value of P-S was −13.33, and the area under the curve was 0.61. The sensitivity and specificity of P-S for predicting the carotid plaque was 45.8% and 75.3%, respectively (P = 0.0009). Patients with low P/S (≤0.72) or low P-S (≤-13.33) were defined as pancreatic steatosis. Patients with low P/S or low P-S accounted for 34.7% (n = 117) and 39.5% (n = 133), respectively.
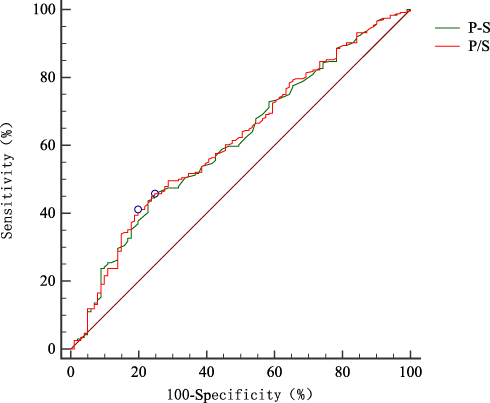 |
Figure 2 ROC analyses showing the optimal threshold of P/S and P-S for carotid plaque. |
Risk Factors for Carotid Plaque
As shown in Table 3, univariate logistic regression model identified low P/S (OR = 2.83, 95% CI = 1.62–4.91, P = 0.0002) and low P-S (OR = 2.57, 95% CI = 1.52–4.31, P = 0.0004) as risk factors of carotid plaque. Furthermore, low P/S (OR = 1.93, 95% CI = 1.22–3.03, P = 0.0047) and low P-S (OR = 1.97, 95% CI = 1.26–3.07, P = 0.0028) were risk factors of hypoechoic plaque.
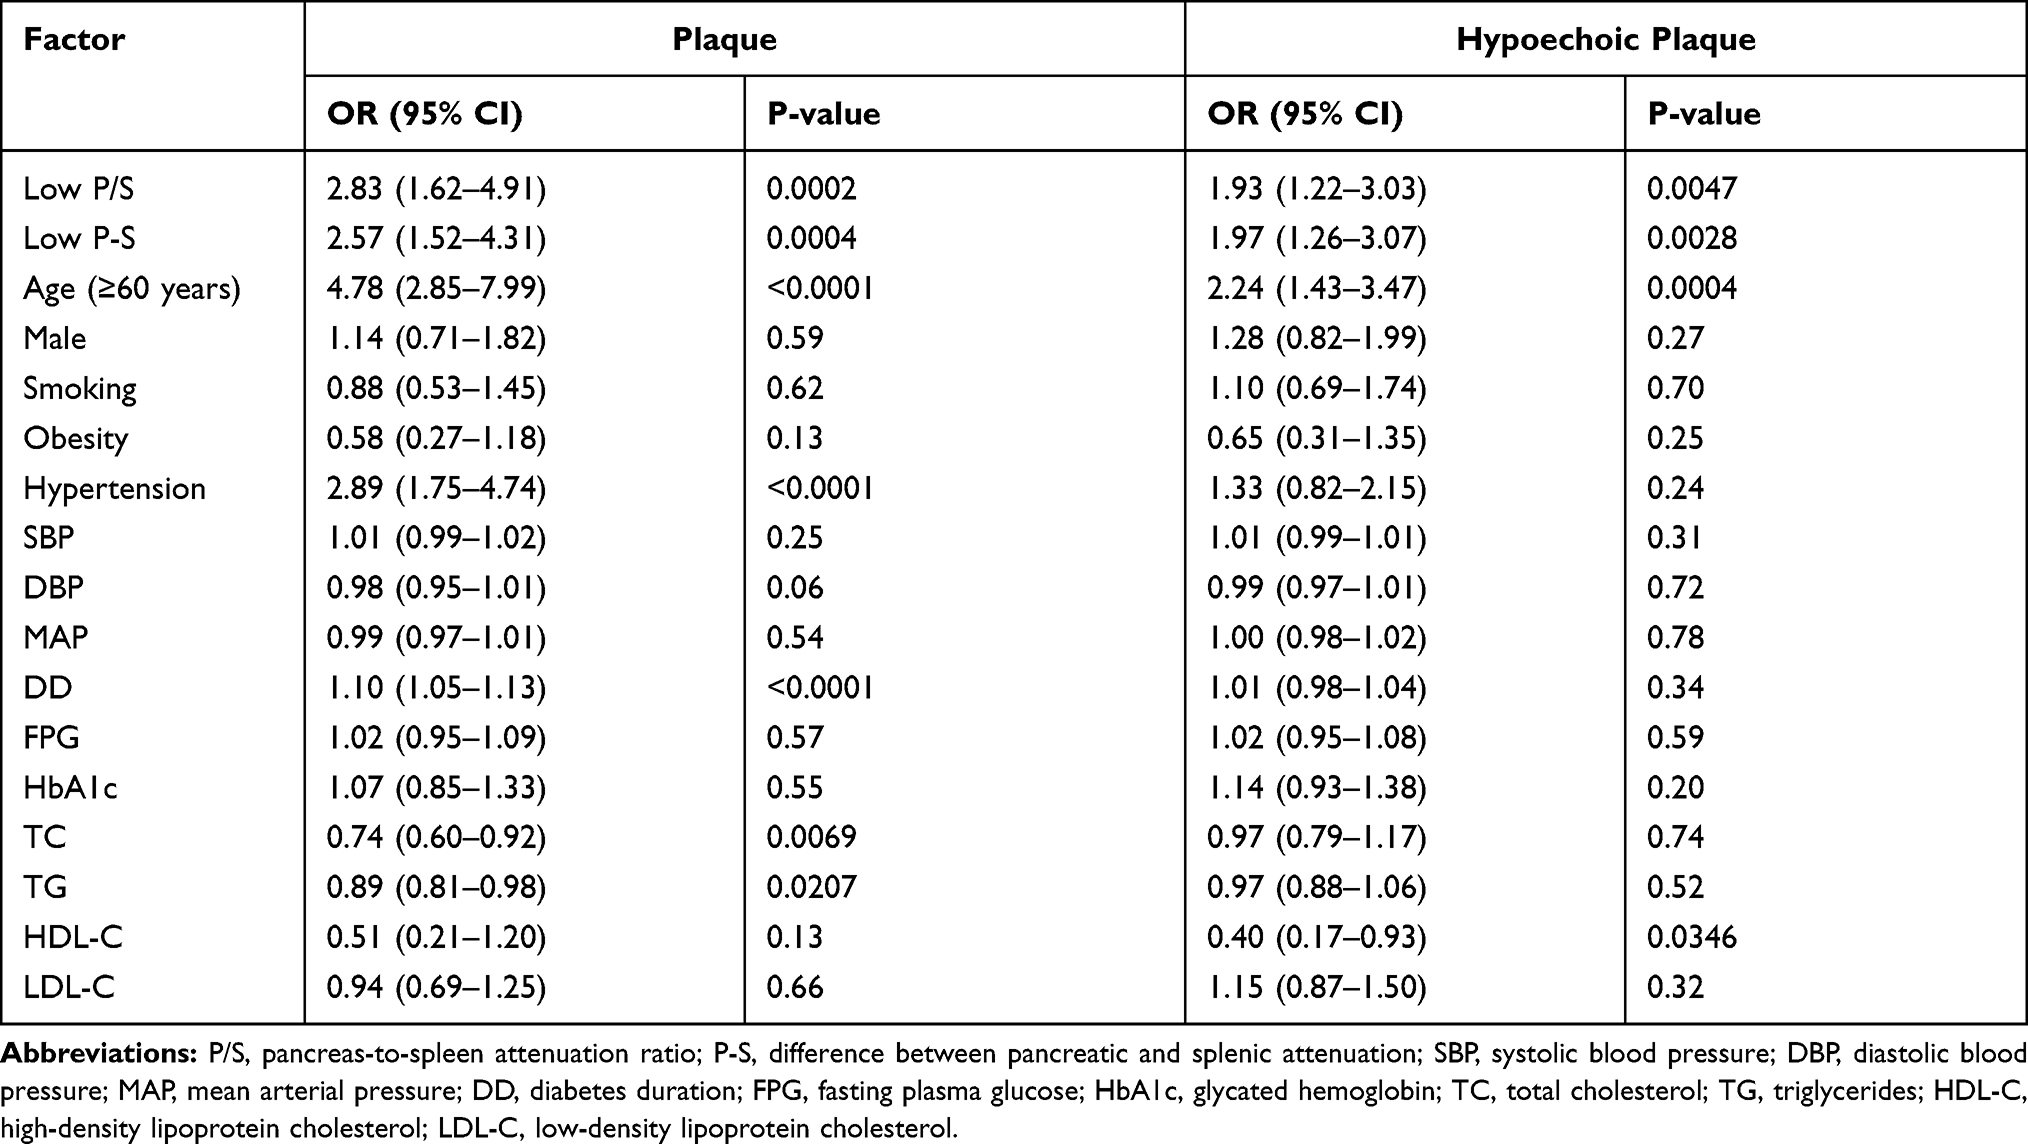 |
Table 3 Univariate Logistic Regression Models for Carotid Plaque and Hypoechoic Plaque |
After adjusting for conventional cardiovascular risk factors (including age, gender, smoking, duration of diabetes, hypertension, obesity, total cholesterol, triglycerides, high-density lipoprotein), the multivariate logistic regression model identified low P/S (OR = 3.15, 95% CI = 1.47–6.73, P = 0.0031) and low P-S (OR = 2.84, 95% CI = 1.42–5.66, P = 0.0031) as independent risk factors of carotid plaque (Table 4). Furthermore, low P/S (OR = 1.82, 95% CI = 1.07–3.08, P = 0.0259) and low P-S (OR = 1.82, 95% CI = 1.09–3.02, P = 0.021) were independent risk factors of hypoechoic plaque (Table 5).
 |
Table 4 Multivariate Logistic Regression Models for Carotid Plaque |
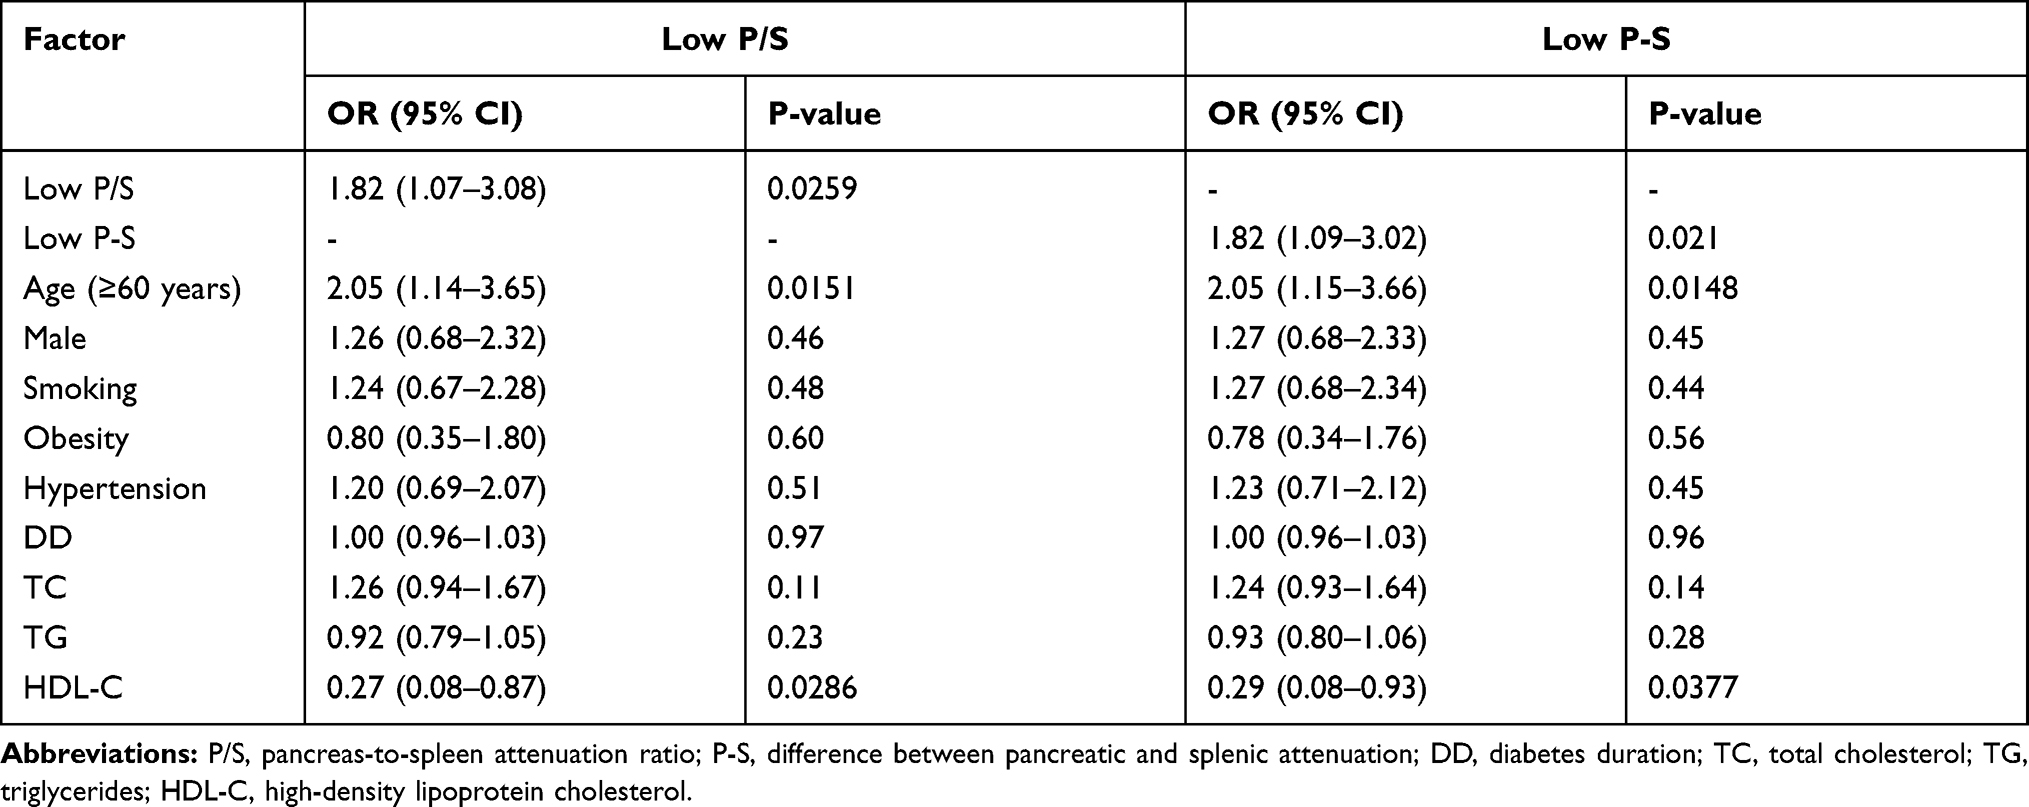 |
Table 5 Multivariate Logistic Regression Models for Carotid Hypoechoic Plaque |
Discussion
Our study has demonstrated that P/S and P-S in T2DM patients with hypoechoic plaque are lower than those without carotid plaque. After adjusting for covariates, the multivariate logistic regression model identifies low P/S and low P-S as independent risk factors for carotid plaque, in particular carotid hypoechoic plaque.
CT Quantitative Evaluation of Pancreatic Steatosis
Pancreatic steatosis has been indicated in various diseases.5,7,8 Therefore, a simple and accurate method for evaluating pancreatic fat content is of clinical significance. Ultrasound and magnetic resonance imaging (MRI) have been used to measure pancreatic fat content.15,16 However, ultrasound results may be affected by the operator’s experience, while MRI is expensive and time-consuming, which limits their clinical application. Histologically, pancreatic CT density index (P/S, P-S) had a good correlation with pancreatic fat content.6 Therefore, CT, which is widely used in clinical practice, is a reliable tool to evaluate pancreatic fat content. Rather than CT attenuation, P/S and P-S were applied to quantify pancreatic fat content in many studies,17–19 which was also applied in this study.
At present, no uniform CT cutoff value has been applied for the diagnosis of pancreatic steatosis. In this study, cutoff values of P/S (0.72) and P-S (−13.33) were obtained from ROC curves, consistent with previous reports.5,20 In this study, there were 117 patients (34.7%) with low P/S and 133 patients (39.5%) with low PS. The incidence of pancreatic steatosis was higher than previously reported in healthy Chinese adults,21 indicating that diabetes patients are more likely to suffer from pancreatic steatosis.22
Relationship Between Pancreatic Steatosis and Carotid Plaque
Ectopic fat deposition is closely related to atherosclerotic plaque and cardiovascular disease.23 Pancreatic steatosis is a manifestation of ectopic fat deposition, characterized by fat accumulation in the pancreas.5,24 Pancreatic steatosis was related to the carotid-femoral pulse wave velocity, which might predict carotid atherosclerosis in patients with non-alcoholic fatty liver disease.9 Pancreatic steatosis was in proportion to aortic intima thickness25 and systemic arterial calcification.12 Ectopic fat deposition in the pancreas increased the risk for carotid atherosclerosis in non-obese T2DM patients, but not in obese patients.26 In this study, after adjusting for obesity and other traditional risk factors, low P/S and low P-S remain correlated with carotid plaque. Thus, pancreatic steatosis is an independent risk factor for carotid atherosclerosis.
Hypoechoic plaque is a characteristic manifestation of unstable plaque, which is highly enriched in lipids and more prone to cerebrovascular diseases.27 Previous study reported that hypoechoic plaque was independently related to progression of atherosclerosis.28 The size of juxtaluminal hypoechoic area in asymptomatic carotid plaque linearly correlated with the risk of stroke.29 Additionally, carotid hypoechoic plaque predicted adverse cardiovascular events in asymptomatic carotid stenosis.30 Furthermore, hypoechoic plaque indicated cognitive impairment among patients with acute ischemic stroke.31 We propose that pancreatic steatosis confers increased risk of hypoechoic carotid plaque. Therefore, for patients with T2DM, pancreatic fat content on CT images can help identify those at high risk of stroke, and guide early clinical intervention to prevent cerebrovascular diseases.
Pathological mechanisms underlying how pancreatic steatosis increases susceptibility to carotid plaque remain unclear. Pancreatic steatosis impairs insulin secretion in patients with T2DM,32 resulting in decreased insulin secretion. Moreover, pancreatic steatosis may contribute to insulin resistance,33 leading to relatively insufficient insulin. Consequently, elevated blood glucose causes damage to blood vessel walls through a variety of molecular pathways,34 and ultimately promotes the formation of atherosclerosis plaque.
There are several limitations in the current study. Firstly, ultrasound, instead of MRI, is applied in this study. Although MRI is superior to ultrasound in evaluating plaque composition, it is not widely used in clinical practice, since most radiologists have insufficient experience in this field. By contrast, ultrasound is easy to operate and widely applied to evaluate carotid plaque. Although ultrasound is not accurate enough to distinguish stable or unstable plaque according to echo features, hypoechoic plaque retains a certain value in predicting cardiovascular events.29,30 Secondly, all subjects in this study are Chinese patients with T2DM and cannot represent the general population or other ethnicities. Thirdly, as a cross-sectional study, cause and effect relationship between pancreatic steatosis and carotid plaque needs to be further explored in future prospective studies with larger sample sizes.
Conclusions
In conclusion, T2DM patients with carotid plaque, especially hypoechoic plaque, may have more pancreatic fat content. Pancreatic steatosis may confer an independent increased risk of carotid (hypoechoic) plaque in T2DM patients.
Abbreviation
BMI, body mass index; CT, computed tomography; DBP, diastolic blood pressure; DD, diabetes duration; IQR, interquartile range; FPG, fasting plasma glucose; HbA1c, glycated hemoglobin; HDL-C, high-density lipoprotein cholesterol; IMT, intima-media thickness; LDL-C, low-density lipoprotein cholesterol; Map, mean arterial pressure; MRI, magnetic resonance imaging; P/S, pancreas-to-spleen attenuation ratio; P-S, the difference between pancreatic and splenic attenuation; SBP, systolic blood pressure; TC, total cholesterol; TG, triglycerides; T2DM, type 2 diabetes mellitus.
Ethics Approval and Consent to Participate
This study has been approved by the Ethics Committee of the Institutional Review Board (IRB) at Beijing Shijitan Hospital (sjtkyll-lx-2020 (36)).
Acknowledgments
We express gratitude to Y L for help in ultrasound measurement.
Funding
There is no funding to report.
Disclosure
The authors declare that they have no conflicts of interest.
References
1. Zhou D, Li J, Liu D, et al. Irregular surface of carotid atherosclerotic plaque is associated with ischemic stroke: a magnetic resonance imaging study. J Geriatr Cardiol. 2019;16(12):872–879. doi:10.11909/j.issn.1671-5411.2019.12.002
2. Jashari F, Ibrahimi P, Bajraktari G, et al. Carotid plaque echogenicity predicts cerebrovascular symptoms: a systematic review and meta-analysis. Eur J Neurol. 2016;23(7):1241–1247. doi:10.1111/ene.13017
3. Pieńkowska J, Brzeska B, Kaszubowski M, et al. The correlation between the MRI-evaluated ectopic fat accumulation and the incidence of diabetes mellitus and hypertension depends on body mass index and waist circumference ratio. PLoS One. 2020;15(1):e0226889. doi:10.1371/journal.pone.0226889
4. Lim S, Meigs JB. Links between ectopic fat and vascular disease in humans. Arterioscler Thromb Vasc Biol. 2014;34(9):1820–1826. doi:10.1161/ATVBAHA.114.303035
5. Dite P, Blaho M, Bojkova M, et al. Nonalcoholic Fatty Pancreas Disease: clinical Consequences. Dig Dis. 2020;38(2):143–149. doi:10.1159/000505366
6. Kim SY, Kim H, Cho JY, et al. Quantitative assessment of pancreatic fat by using unenhanced CT: pathologic correlation and clinical implications. Radiology. 2014;271(1):104–112. doi:10.1148/radiol.13122883
7. Kashiwagi K, Seino T, Fukuhara S, et al. Pancreatic fat content detected by computed tomography and its significant relationship with intraductal papillary mucinous neoplasm. Pancreas. 2018;47(9):1087–1092. doi:10.1097/MPA.0000000000001103
8. Jeong JS, Kim MK, Han KD, et al. The Association between Pancreatic Steatosis and Diabetic Retinopathy in Type 2 Diabetes Mellitus Patients. Diabetes Metab J. 2018;42(5):425–432. doi:10.4093/dmj.2017.0107
9. Ozturk K, Dogan T, Celikkanat S, et al. The association of fatty pancreas with subclinical atherosclerosis in nonalcoholic fatty liver disease. Eur J Gastroenterol Hepatol. 2018;30(4):411–417. doi:10.1097/MEG.0000000000001059
10. Sotoudehmanesh R, Tahmasbi A, Sadeghi A, et al. The Prevalence of Nonalcoholic Fatty Pancreas by Endoscopic Ultrasonography. Pancreas. 2019;48(9):1220–1224. doi:10.1097/MPA.0000000000001396
11. Inaba Y, Chen JA, Bergmann SR. Carotid plaque, compared with carotid intima-media thickness, more accurately predicts coronary artery disease events: a meta-analysis. Atherosclerosis. 2012;220(1):128–133. doi:10.1016/j.atherosclerosis.2011.06.044
12. Koo BK, Denenberg JO, Wright CM, et al. The Association Between Pancreatic Fat and Systemic Calcified Atherosclerosis. Pancreas. 2020;49(1):e16–e18. doi:10.1097/MPA.0000000000001447
13. American Diabetes Association. 2. Classification and Diagnosis of Diabetes: standards of Medical Care in Diabetes-2020. Diabetes Care. 2020;43(Suppl 1):S14–S31. doi:10.2337/dc20-S002
14. Li MF, Zhao CC, Li TT, et al. The coexistence of carotid and lower extremity atherosclerosis further increases cardio-cerebrovascular risk in type 2 diabetes. Cardiovasc Diabetol. 2016;15(1):43. doi:10.1186/s12933-016-0360-2
15. Wang CY, Ou HY, Chen MF, et al. Enigmatic ectopic fat: prevalence of nonalcoholic fatty pancreas disease and its associated factors in a Chinese population. J Am Heart Assoc. 2014;3(1):e000297. doi:10.1161/JAHA.113.000297
16. Yao WJ, Guo Z, Wang L, et al. Pancreas fat quantification with quantitative CT: an MRI correlation analysis. Clin Radiol. 2020;75(5):
17. Xie J, Xu L, Pan Y, et al. Nonalcoholic fatty pancreas disease is related independently to the severity of acute pancreatitis. Eur J Gastroenterol Hepatol. 2019;31(8):973–978. doi:10.1097/MEG.0000000000001477
18. Koc U, Taydas O. Investigation of the Relationship between Fatty Pancreas and Cholecystectomy Using Noncontrast Computed Tomography. J Med Imaging Radiat Sci. 2019;50(2):220–226. doi:10.1016/j.jmir.2018.10.007
19. Ahbab S, Ünsal A, Ataoğlu HE, et al. Prediabetes and Type 2 Diabetes are Independent Risk Factors for Computed Tomography-Estimated Nonalcoholic Fatty Pancreas Disease. Clinics. 2019;74:e1337. doi:10.6061/clinics/2019/e1337
20. Fukuda Y, Yamada D, Eguchi H, et al. CT Density in the Pancreas is a Promising Imaging Predictor for Pancreatic Ductal Adenocarcinoma. Ann Surg Oncol. 2017;24(9):2762–2769. doi:10.1245/s10434-017-5914-3
21. Zhou J, Li ML, Zhang DD, et al. The correlation between pancreatic steatosis and metabolic syndrome in a Chinese population. Pancreatology. 2016;16(4):578–583. doi:10.1016/j.pan.2016.03.008
22. Ou HY, Wang CY, Yang YC, et al. The association between nonalcoholic fatty pancreas disease and diabetes. PLoS One. 2013;8(5):e62561. doi:10.1371/journal.pone.0062561
23. Ferrara D, Montecucco F, Dallegri F, et al. Impact of different ectopic fat depots on cardiovascular and metabolic diseases. J Cell Physiol. 2019;234(12):21630–21641. doi:10.1002/jcp.28821
24. Pezzilli R, Calculli L. Pancreatic steatosis: is it related to either obesity or diabetes mellitus? World J Diabetes. 2014;5(4):415–419. doi:10.4239/wjd.v5.i4.415
25. Kul S, Karadeniz A, Dursun İ, et al. Non-Alcoholic Fatty Pancreas Disease is Associated with Increased Epicardial Adipose Tissue and Aortic Intima-Media Thickness. Acta Cardiol Sin. 2019;35(2):118–125. doi:10.6515/ACS.201903_35(2).20181009A
26. Kim MK, Chun HJ, Park JH, et al. The association between ectopic fat in the pancreas and subclinical atherosclerosis in type 2 diabetes. Diabetes Res Clin Pract. 2014;106(3):590–596. doi:10.1016/j.diabres.2014.09.005
27. Picano E, Paterni M. Ultrasound tissue characterization of vulnerable atherosclerotic plaque. Int J Mol Sci. 2015;16(12):10121–10133. doi:10.3390/ijms160510121
28. Liu Y, Hua Y, Liu R, et al. Ultrasonographical Features Associated with Progression of Atherosclerosis in Patients with Moderate Internal Carotid Artery Stenosis. Transl Stroke Res. 2018;9(4):375–381. doi:10.1007/s12975-017-0592-9
29. Kakkos SK, Griffin MB, Nicolaides AN, et al. The size of juxtaluminal hypoechoic area in ultrasound images of asymptomatic carotid plaques predicts the occurrence of stroke. J Vasc Surg. 2013;57(3):609–618. doi:10.1016/j.jvs.2012.09.045
30. Gupta A, Kesavabhotla K, Baradaran H, et al. Plaque echolucency and stroke risk in asymptomatic carotid stenosis: a systematic review and meta-analysis. Stroke. 2015;46(1):91–97. doi:10.1161/STROKEAHA.114.006091
31. Wang A, Liu X, Chen G, et al. Association between Carotid Plaque and Cognitive Impairment in Chinese Stroke Population: the SOS-Stroke Study. Sci Rep. 2017;7(1):3066. doi:10.1038/s41598-017-02435-3
32. Yokota K, Fukushima M, Takahashi Y, et al. Insulin secretion and computed tomography values of the pancreas in the early stage of the development of diabetes. J Diabetes Investig. 2012;3(4):371–376. doi:10.1111/j.2040-1124.2012.00212.x
33. Wong VW, Wong GL, Yeung DK, et al. Fatty pancreas, insulin resistance, and β-cell function: a population study using fat-water magnetic resonance imaging. Am J Gastroenterol. 2014;109(4):589–597. doi:10.1038/ajg.2014.1
34. Kitada M, Zhang Z, Mima A, et al. Molecular mechanisms of diabetic vascular complications. J Diabetes Investig. 2010;1(3):77–89. doi:10.1111/j.2040-1124.2010.00018.x
 © 2021 The Author(s). This work is published and licensed by Dove Medical Press Limited. The full terms of this license are available at https://www.dovepress.com/terms.php and incorporate the Creative Commons Attribution - Non Commercial (unported, v3.0) License.
By accessing the work you hereby accept the Terms. Non-commercial uses of the work are permitted without any further permission from Dove Medical Press Limited, provided the work is properly attributed. For permission for commercial use of this work, please see paragraphs 4.2 and 5 of our Terms.
© 2021 The Author(s). This work is published and licensed by Dove Medical Press Limited. The full terms of this license are available at https://www.dovepress.com/terms.php and incorporate the Creative Commons Attribution - Non Commercial (unported, v3.0) License.
By accessing the work you hereby accept the Terms. Non-commercial uses of the work are permitted without any further permission from Dove Medical Press Limited, provided the work is properly attributed. For permission for commercial use of this work, please see paragraphs 4.2 and 5 of our Terms.