")
Back to Journals » International Journal of Nanomedicine » Volume 11
Comprehensive evaluation of carboxylated nanodiamond as a topical drug delivery system
Authors Lim D, Kim K, Kang E, Lim S, Ricci J, Sung S, Kwon M, Jeong SH
Received 22 January 2016
Accepted for publication 15 March 2016
Published 26 May 2016 Volume 2016:11 Pages 2381—2395
DOI https://doi.org/10.2147/IJN.S104859
Checked for plagiarism Yes
Review by Single anonymous peer review
Peer reviewer comments 2
Editor who approved publication: Professor Carlos Rinaldi
Dae Gon Lim,1,* Ki Hyun Kim,1,* Eunah Kang,2 Sun Hee Lim,3 Jeremy Ricci,3 Si Kwon Sung,3 Myoung Taek Kwon,3 Seong Hoon Jeong1
1College of Pharmacy, Dongguk University-Seoul, Gyeonggi, 2School of Chemical Engineering and Material Science, Chung-Ang University, 3NanoResource Co. Ltd., Seoul, Republic of Korea
*These authors contributed equally to this work
Abstract: The best strategy in the development of topical drug delivery systems may be to facilitate the permeation of drugs without any harmful effects, while staying on the skin surface and maintaining stability of the system. Nanodiamonds (NDs) play a key role with their excellent physicochemical properties, including high biocompatibility, physical adsorption, reactive oxygen species (ROS) scavenging capability, and photostabilizing activity. Z-average sizes of carboxylated ND (ND–COOH) agglutinate decreased significantly as the pH increased. Fluorescein-conjugated ND was observed only on the stratum corneum, and no sample diffused into the dermal layer even after 48 hours. Moreover, ND–COOH and ND–COOH/eugenol complex did not show significant toxic effects on murine macrophage cells. ND improved in vitro skin permeation >50% acting as a “drug reservoir” to maintain a high drug concentration in the donor chamber, which was supported by quartz crystal microbalance results. Moreover, ND–COOH could adsorb a drug amount equivalent to 80% of its own weight. A photostability study showed that ND–COOH increased the photostability ~47% with regard to rate constant of the eugenol itself. A significant decrease in ROS was observed in the ND–COOH and ND–COOH/eugenol complex compared with the negative control during intracellular ROS assay. Moreover, ROS and cupric reducing antioxidant capacity evaluation showed that ND–COOH had synergistic effects of antioxidation with eugenol. Therefore, ND–COOH could be used as an excellent topical drug delivery system with improved permeability, higher stability, and minimized safety issue.
Keywords: nanodiamond, skin permeation, drug delivery, photostability, anti-oxidation
Introduction
Carbon-based nanoparticles (CNPs), such as carbon nanotube, fullerene, graphene, and nanodiamond (ND), have attracted great attention due to their favorable chemical and physical properties, including a large surface area, outstanding strength, and good biocompatibility.1,2 CNPs have been greatly studied with a view to being exploited in biomedical and pharmaceutical areas, with ND, in particular, gaining widespread interest in the recent years. ND is known to exhibit lower toxicity and improved cell tolerance compared with other CNPs. For instance, ND generated relatively lower levels of reactive oxygen species (ROS) and exhibited little effect on the morphology of various cells compared with other CNPs.3 Owing to these combined properties, ND has been investigated in a drug delivery system, in vivo imaging, and tissue engineering.4–6 Although ND is emerging as a promising nanomaterial in various areas, a few studies have been performed on the application of ND in topical drug delivery systems.7,8 One of the main reasons may be poor dispersibility of ND in liquid and semisolid formulations.
ND can be synthesized by the detonation technique, laser ablation, high-energy ball milling of high-pressure high-temperature diamond microcrystals, and plasma-assisted chemical vapor deposition.9 However, ND obtained by these methods tends to form aggregates rather than single particles, which has hampered the use of ND in pharmaceutical applications.10 To overcome the aggregation issue, deagglomeration of ND using ceramic bead milling, wet chemical milling, and thermal fluidizing bed methods has been investigated.11,12 Functionalization of ND was one of the solutions for solving the aggregation issue. Oxidation of ND using singlet oxygen in liquid media or ozone could modify ND with carboxylic acid groups on the surface and improve dispersity in the aqueous solution.13 In addition, modified ND can be used in various ND–drug conjugations, such as doxorubicin, menthol, and plant metabolites.14–16
Topical drug delivery systems are composed of various ingredients such as an ointment base, emulsifying agent, thickening agent, preservative, buffering agent, vehicle, antioxidant, and permeation enhancer. Among the ingredients, the permeation enhancer increases the drug delivery by promoting the diffusion, partitioning, or solubility of an active ingredient through the stratum corneum.17 Ideal penetration enhancers need to meet the following requirements: 1) absorption enhancement should be immediate and unidirectional, and the duration of the effect should be specific, predictable, and suitable; 2) after removal of the material from the applied area, the tissue should recover its normal barrier properties fully and immediately; 3) the enhancer should show no systemic or toxic effects; 4) the enhancer should not irritate or damage the skin surface; and 5) the enhancer should be physically compatible with a wide range of drugs and pharmaceutical excipients.18
Together with excellent dispersibility in aqueous solution, ND may have ideal properties as a permeation enhancer for topical drug delivery systems. In order to avoid adverse effects of permeation enhancers in topical formulations, they need to be noninvasive while facilitating permeation of drugs through the skin.19 In general, nanoparticles that have sizes >20 nm are known to poorly penetrate the skin.20 Although the single particle size of ND is ~5 nm, ND exists as particles of ~50–100 nm called agglutinates, which poorly permeate the skin.21 The adsorption of drugs on the surface of well-dispersed ND particles may be very attractive, since ND could function as a “drug-reservoir or matrix” agent for topical drug delivery.22 Additionally, ND was reported as a ultraviolet (UV) filter and photostability enhancer for drugs by absorbing and scattering light.23,24 Antioxidant properties of ND were also reported, which act by promoting oxygen reduction.25,26 These properties of ND could expand their applicability as a formulation stabilizer.
Eugenol is a member of the phenylpropanoid class of chemical compounds. It is a colorless to pale yellow oily liquid extracted from clove, nutmeg, cinnamon, basil, and bay leaf.27,28 Eugenol was selected as the model drug in this study due to its wide applications in pharmaceuticals, dental treatments, foods, and cosmetic products.29,30 In addition, eugenol is known to possess analgesic, anti-inflammatory, and antioxidant activities.31 It is relatively stable at room temperature (RT) and at neutral pH conditions; however, it has a stability issue under UV and high pH conditions.32 In particular, it exhibited cytotoxicity and prooxidant rather than antioxidant effects when exposed to photooxidation states.33
In the present study, various properties of ND were evaluated with a view to be exploited for topical drug delivery systems and to propose the capability of ND as a practical drug delivery vehicle. First of all, the surface of detonated ND was substituted with carboxyl functional groups to improve the dispersing capability of ND, and then, its physical properties were characterized using dynamic light scattering (DLS), transmission electron microscopy (TEM), Fourier transform infrared spectroscopy, and X-ray photoelectron spectroscopy (XPS). Confocal microscopy imaging was conducted to investigate the nonpermeability of ND through excised porcine skin. In addition, the cytotoxicity of carboxylated ND (ND–COOH) and the ND–COOH/eugenol complex was evaluated using a crystal violet assay. The adsorption of eugenol on the ND surface was evaluated using quartz crystal microbalance (QCM). Photostability studies were also carried out to investigate the UV screening and photostability enhancing activity of ND. Lastly, the ROS scavenging effect of eugenol and ND–COOH/eugenol complex was investigated using 2′,7′-dichlorodihydrofluorescein diacetate (DCF), cupric reducing antioxidant capacity (CUPRAC), and 1,1-diphenyl-2-picryl-hydrazil (DPPH) assay.
Experimental
Characterization of ND particles
ND–COOH particles were kindly supplied by NanoResource Co., Ltd. (Seoul, Republic of Korea). To characterize the dispersive properties of the ND–COOH, the particle size and zeta potential were measured using a Zetasizer Nano ZS90 (Malvern Instruments, Malvern, UK). ND–COOH powder was dispersed in distilled water at a concentration of 0.1 mg/mL using sonication. Various pHs of ND solution ranging from 5.0 to 9.0 were adjusted with sodium hydroxide and hydrochloric acid (Sigma-Aldrich Co., St Louis, MO, USA). Samples were equilibrated at a working temperature of 20°C, and 1 mL of each sample was measured using a disposable sizing cuvette (Sarstedt, Hildesheim, Lower Saxony, Germany) for the hydrodynamic radius and a disposable capillary cell (Malvern Instruments) for zeta potential. All measurements were performed at a fixed angle of 90°. Each sample was measured five times with an intervening interval of 30 seconds. Average particle size, polydispersity index (PdI), and zeta potential were calculated using the Zetasizer software Version 7.11 provided with the equipment.
Dispersions of ND–COOH and the ND–COOH/eugenol complex in aqueous solution were prepared for TEM analysis. ND–COOH (3 mg) was dispersed in 10 mL of distilled water and eugenol was mixed with the ND–COOH dispersion to produce the ND–COOH/eugenol complex (15 μg/mL). Each sample was casted dropwise on the lacy carbon grid. The excess water was wiped, and the grid was allowed to dry overnight. High-resolution TEM observation was performed using a JEM-3010 microscope (JEOL, Tokyo, Japan) with an acceleration voltage of 300 kV.
Infrared spectra were obtained using a Nicolet iS5 Fourier transform infrared spectrometer (Thermo Fisher Scientific, Waltham, MA, USA). The samples were thoroughly mixed with KBr in a mortar while grinding gently with a pestle and subsequently pressed to prepare the KBr pellet. XPS measurement (ESCA 2000; VG Microtech, London, UK) was performed with an Mg·Kα X-ray source (1,253.6 eV) and a hemispherical analyzer.
In vitro skin permeation imaging
ND–COOH was conjugated with fluorescein for confocal analysis. To synthesize fluorescein-conjugated ND (ND–fluorescein), ND–COOH (1 g) was mixed with 30 mL SOCl2 and 0.15 mL anhydrous dimethylformamide in a round bottom flask under an N2 atmosphere (Figure 1). The mixture was sonicated until no agglomerate was visible and heated at 70°C for 24 hours. The excess SOCl2 was distilled under reduced pressure at 50°C. ND–COCl, from the previous synthesis, was dispersed in anhydrous dimethyl sulfoxide (DMSO) (30 mL) using sonication. In all, 0.3 mL pyridine and 0.3 g ethylenediamine were added and stirred at RT for 24 hours under an N2 atmosphere. The DMSO was evaporated by distillation under a vacuum, and the powder was washed with water five times using centrifugation (10,000 rpm, 10 minutes). Fluorescein (5 g) was added to ND–CONH–(CH2)2–NH2 in the sodium bicarbonate solution (30 mL, 0.1 M, pH 8.3). The reaction solution was stirred at RT for 24 hours. The ND was washed with water using centrifugation (10,000 rpm, 10 minutes) until no fluorescein was detectable in the supernatant by UV–visible light spectroscopy analysis.
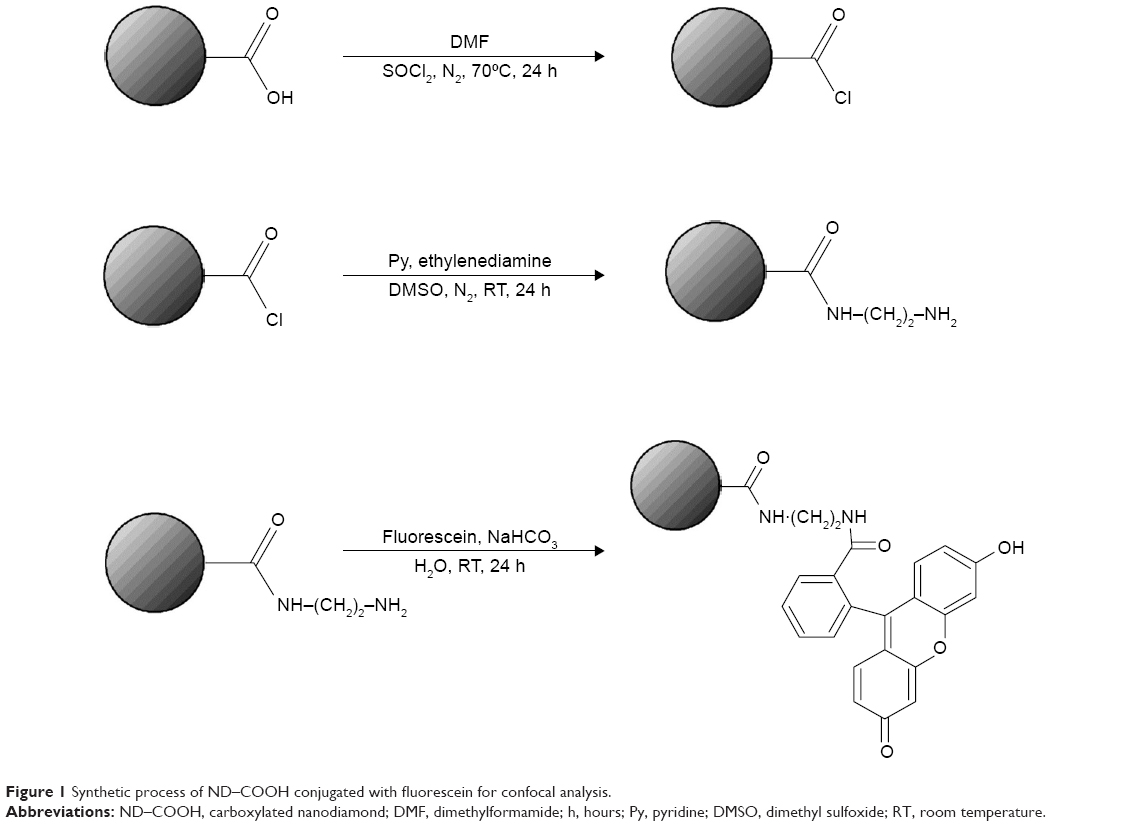 | Figure 1 Synthetic process of ND–COOH conjugated with fluorescein for confocal analysis. |
ND–fluorescein and fluorescein solution at a concentration of 1 mg/mL were applied to porcine cadaver skin and left for 12 hours, 24 hours, and 48 hours at 32°C. The study protocols were approved by the ethics committee of Dongguk University. Following exposure, skin samples were fixed with 4% paraformaldehyde for 24 hours. The fixed skin samples were embedded in the optimal cutting temperature compound and frozen overnight at -82.7°C in a deep freezer. The frozen skin samples were cross-sectioned into 20 μm thick slices using a Leica CM1520 cryostat (Leica Microsystems, Wetzlar, Germany) for cell nuclei staining. After frozen sectioning, the samples were stained with 1 μg/mL 4′,6-diamidino-2-phenylindole (DAPI) for 10 minutes at 37°C. After washing with phosphate-buffered saline (PBS), the cross-sections of the skin samples were imaged using a Nikon Digital Eclipse C1 Plus system (Nikon Corporation, Tokyo, Japan) with a dual excitation band of DAPI (358 nm) and fluorescein isothiocyanate filters (488 nm). Fluorescence image processing was performed using NIS-Elements C (Nikon Corporation) and Adobe Photoshop CS3 (Adobe Systems Incorporated, San Jose, CA, USA).
To quantify diffused ND–fluorescein and fluorescein, Franz-type diffusion cells were assembled with porcine cadaver skin between the donor and receptor chambers. The receptor chamber volume was 15 mL, and the diffusional area was 2.83 cm2. For donor solutions, 1.5 mL of ND–fluorescein and fluorescein solution were applied on the upper surface of the skin. The receptor chamber, filled with PBS at pH 7.4, was continuously stirred with a magnetic bar at 480 rpm and thermostated at 32°C±0.5°C with a circulating jacket. At predetermined time intervals (6 hours, 12 hours, 24 hours, 36 hours, and 48 hours), the samples were withdrawn from the receptor chamber and replaced with an equal volume of fresh buffer to maintain sink conditions. Fluorescence emission spectra of fluorescein and ND–fluorescein were obtained using a SpectraMax M3 Multi-Mode Microplate Reader (Molecular Devices LLC, Sunnyvale, CA, USA). The excitation wavelength was 492 nm, and the emission wavelength was 515 nm with a 4 nm slit width. The cumulative amounts of the fluorescein and ND–fluorescein released per surface area were obtained using the following equation:
|
|
where Q is the cumulative amount of compound released per unit surface area of the skin (μg/cm2), Cn is the concentration of the fluorescein (μg/mL) determined at the nth sampling interval, V is the volume of the individual Franz-type diffusion cell, S is the volume of the sampling aliquot, and A is the surface area of the skin. The cumulative amount released per surface area was plotted against time. Statistical analysis was performed with the Student’s t-test and analysis of variance (one-way analysis of variance and Dunnett’s multiple comparison test) using SigmaStat 3.5 (Systat Software, San Jose, CA, USA) with the chosen level of significance at P<0.05.
Cell viability test
The cytotoxic effect of ND–COOH and the ND–COOH/eugenol complex was assessed by using crystal violet staining. RAW 264.7 cells were seeded at 1×10⁴ cells/well into a 96-well plate and incubated with indicated concentration of ND, eugenol, ND/eugenol complex for 24 hours at 37°C, 5% CO2, and 100% humidity. After incubation, the medium was removed and the cells were washed with PBS twice and then stained with 0.05% crystal violet (Sigma-Aldrich Co.) for 30 minutes at RT. The cells were then washed with tap water twice and air dried. For the detection of optical density value, 100 μL of 1% sodium dodecyl sulfate was added per well. Absorbance was read at 570 nm with a microplate reader (BioTek, Winooski, VT, USA). All experiments were carried out in triplicate.
In vitro skin permeation test
The skin permeation profiles of eugenol and the ND–COOH/eugenol mixture were evaluated at 32°C using Franz-type diffusion cells assembled with excised hairless mouse skin between the donor and receptor chambers. The hairless mouse skins were soaked in PBS for 30 minutes before the permeation studies. For donor solutions, 1.5 mL of ND–COOH/eugenol mixture (ND–COOH 1,000 μg/mL) and eugenol solution were applied to the surface of the hairless mouse skin. The receptor chamber, filled with the PBS, was continuously stirred with a magnetic bar at 480 rpm and thermostated at 32°C±0.5°C with a circulating jacket. At predetermined time intervals (0.5 hours, 1 hour, 2 hours, 4 hours, 6 hours, 8 hours, and 12 hours), the samples were withdrawn from the receptor chamber and replaced with an equal volume of fresh buffer. The samples were centrifuged using Centrifuge 5415D (Eppendorf, Hamburg, Germany) at 14,000 rpm for 15 minutes.
The concentration of eugenol was analyzed using a high-performance liquid chromatography system (1100 Series; Agilent Technologies, Santa Clara, CA, USA) equipped with a diode array detector at an ultraviolet wavelength of 230 nm UV absorbance spectra. An Eclipse Plus C18 column (4.6×150 mm, 5 μm; Agilent Technologies) was used and maintained at 30°C. The mobile phase was a mixture of acetonitrile and distilled water at a volume ratio of 40:60. The flow rate of the mobile phase was 1.0 mL/min, and the injection volume was 10 μL. The cumulative amount released per surface area was obtained using the previous equation related to fluorescence imaging.
Quartz crystal microbalance
A QCM 200 system (Stanford Research Systems, Sunnyvale, CA, USA) was used to measure the physical adsorption of eugenol on the ND surface. The standard sensor crystal with gold surface electrode (O100RX3; Stanford Research Systems) consisted of a 1-inch disk with 5 MHz quartz mounted on a flow chamber. The solution was flowed into the 150 μL volume of the chamber, and adsorption measurements were performed under static conditions at 25°C. The solutions of polyallylamine hydrochloride (PAH; moleclular weight 15k, 1.0 mg/mL, 10.7 mM; Sigma-Aldrich Co.), ND–COOH dispersion (300 μg/mL), and eugenol (0.5 mg/mL) were prepared in distilled water, and their pH was adjusted to 7.0 with a minimal amount of NaOH. The QCM sensor was equilibrated with water exposure under static conditions. As the adsorption of solute onto the surface was equilibrated, the solution was exchanged in sequence and deionized water was carefully flowed to remove the excess solutions.
Photostability test
Photostability tests were carried out in the solution state. ND–COOH/eugenol dispersions (1,000 μg/mL ND–COOH mixed with 50 μg/mL eugenol) were prepared in a glass vial, while 50 μg/mL eugenol solution was prepared as a reference control. The samples and controls were exposed to a Suntest CPS xenon lamp (Atlas Material Testing Technology, Chicago, IL, USA) at a temperature of 35°C. The xenon light source was a full spectrum light with both UV and visible outputs (320–800 nm). The UV irradiation level was 46.25 W/m2, and the illumination was 110 klux. At predetermined times (1 hour, 2.5 hours, 4 hours, and 6 hours), the samples were withdrawn and analyzed by high-performance liquid chromatography to evaluate photostability and degradation kinetics.
Evaluation of antioxidation
Different methods of evaluating antioxidant capability may help understand mechanisms of antioxidation. In this study, ROS measurement with 2′,7′-dichlorodihydrofluorescein diacetate (H2DCF-DA 5 μM; Molecular Probes, Eugene, OR, USA) was used for evaluating the antioxidant capability in a cellular level, and CUPRAC was utilized to monitor the total antioxidant capability of substances.
ROS measurement in RAW 264.7 cells was performed using H2DCF-DA according to the manufacturer’s instructions. Briefly, RAW 264.7 cells were seeded at 1×10⁴ cells/well in 96-well plates and allowed to adhere overnight. The cells were incubated with the indicated concentrations of the ND/eugenol mixture for 1 hour at 37°C, 5% CO2, and 100% humidity. In all, 1 mM H2O2 was used as a positive control. Following the ND/eugenol treatment, the medium was removed and cells were loaded with 5 μM H2DCF-DA diluted in phenol red-free media for 30 minutes at 37°C. The cells were washed three times with phenol red-free media, and the fluorescence intensity (excitation 485 nm and emission 530 nm) was measured using a multilabel plate reader (VICTOR3; PerkinElmer Inc., Waltham, MA, USA).
The CUPRAC method is based on the absorbance measurement of Cu(I)-neocuproine (Nc) chelate formed as a result of the redox reaction of chain-breaking antioxidants with the CUPRAC reagent, Cu(II)-Nc, where absorbance is recorded at the maximum light absorption wavelength of 450 nm.34 ND–COOH (50 mg) and eugenol (2.5 mg) were dispersed in 100 mL NH4Ac buffer (1 M, pH 7.0). Then, 1 mL of each CuCl2 solution (10 mM), Nc solution (7.5 mM), and NH4Ac buffer was mixed in the sample. The absorbance at 450 nm (A450) was recorded against a reagent blank after 30 minutes of the sample preparation.
DPPH forms stable radical in solution absorbing at 515 nm. DPPH assay is based on the principle that DPPH accepts a hydrogen atom from the scavenger molecule and its color changes from purple to yellow with a concomitant decrease in absorbance at 515 nm.35 Approximately 1 mL of ND–COOH/eugenol, eugenol, and ND–COOH solutions were mixed with 1 mL of 100 μM methanol solution of DPPH and kept at RT for 30 minutes. The absorbance change was monitored using spectra M3 microplate reader. DPPH radical scavenging capacity was calculated using the following equation:
|
|
A0 is the absorbance of DPPH in the absence of antioxidant, and A1 is the absorbance of DPPH in the presence of antioxidant at 515 nm.
Results and discussion
Characterization of ND particles
The size of the dispersed ND–COOH particles in the solution was dependent on the environmental pH as confirmed by the DLS (Figure 2A). Z-average sizes of ND–COOH at pH 5.0, 6.0, and >7.0 were shown to be 1,049.9 nm, 177.9 nm, and ~50 nm, respectively. ND–COOH samples showed one uniform group of particles (Figure 2B and C). The PdI of ND–COOH was drastically decreased in proportion to the pH, with values of 1.00 at pH 5.0, 0.75 at pH 6.0, and ~0.15 at pH >7.0. Changes in particle size and PdI occurred suddenly between pH 5.0 and pH 6.0 as the dissociation constants (pKa) of carboxylic acids such as acetic acid, propionic acid, and valeric acid are ~5.0.36 The ionization extent of the carboxyl groups determined the strength of the interparticle interaction. When the carboxyl groups were ionized, the ND–COOH particles had a negative charge and repulsion between the particles became significant, resulting in a decreased particle size and zeta potential.
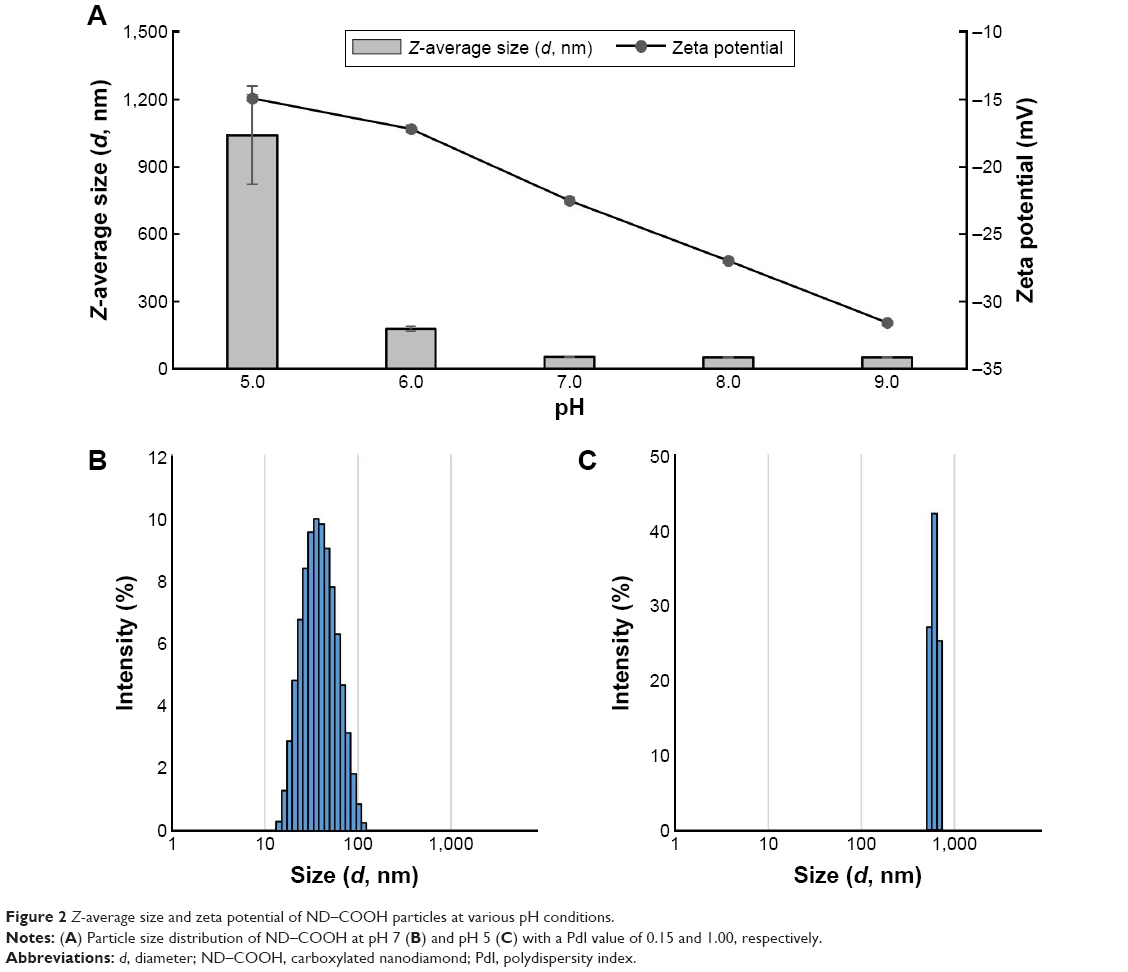 | Figure 2 Z-average size and zeta potential of ND–COOH particles at various pH conditions. |
Zeta potential may represent the electrical properties of the particle surfaces of ND–COOH. Generally, a high value of absolute zeta potential suggests that the ND–COOH will resist aggregation. Its low value may indicate that attraction among particles exceeds repulsion. The absolute zeta potential of ND–COOH gradually increased in proportion to the pH of the solution, with values being 14.90 mV, 22.50 mV, and 31.58 mV at pH 5.0, 7.0, and 9.0, respectively. In particular, ND–COOH showed 2.11 times higher absolute zeta potential at pH 9.0 compared with that at pH 5.0.
Previous studies have shown that ND exhibited a very strong tendency to aggregate and formed robust superstructures in the order of 100 nm in size.37 The particle size of ND agglutinate may be dependent on van der Waals interactions, electrostatic interactions, and dipole moments.21 The size of ND–COOH agglutinate ranged from 50 nm to 1,049.9 nm with respect to the extent of carboxyl groups on its surface. This result suggests that electrostatic interactions may be a dominant factor for the stability of ND agglutinates due to the functionalized ND. When ultrasonication was applied to the ND–COOH solution at pH 7–9 for an hour, the hydrodynamic diameter was maintained consistently at ~50 nm after 1 day, suggesting that an ND agglutinate of that size may be at the equilibrium among electrostatic interactions, dipole moments, and van der Waals interactions. Although pH of the skin surface was reported to be in the range of 5.4–5.9, formulation pH could be adjusted to 6–7 and ND–COOH particles may exist as 50 nm agglutinates.38
Bare ND–COOH was observed with high-resolution TEM (Figure 3A). The size of individual ND–COOH ranged from 4 nm to 5 nm in diameter. Mostly, NDs were well dispersed, with the state of small agglutinins. The agglutinin of NDs was formed in the form of a web with the ND–COOH alignment, and large aggregated ND–COOH particles became sphere-like nanoparticles. The long axis of ND–COOH aggregates was roughly 50 nm, consistent with the DLS measurement. TEM images of the ND–COOH/eugenol complex was observed in comparison to the bare ND images (Figure 3B). The organic layer around ND agglutinin was 2–3 nm in thickness, showing that eugenol was well adsorbed physically on the ND surface.
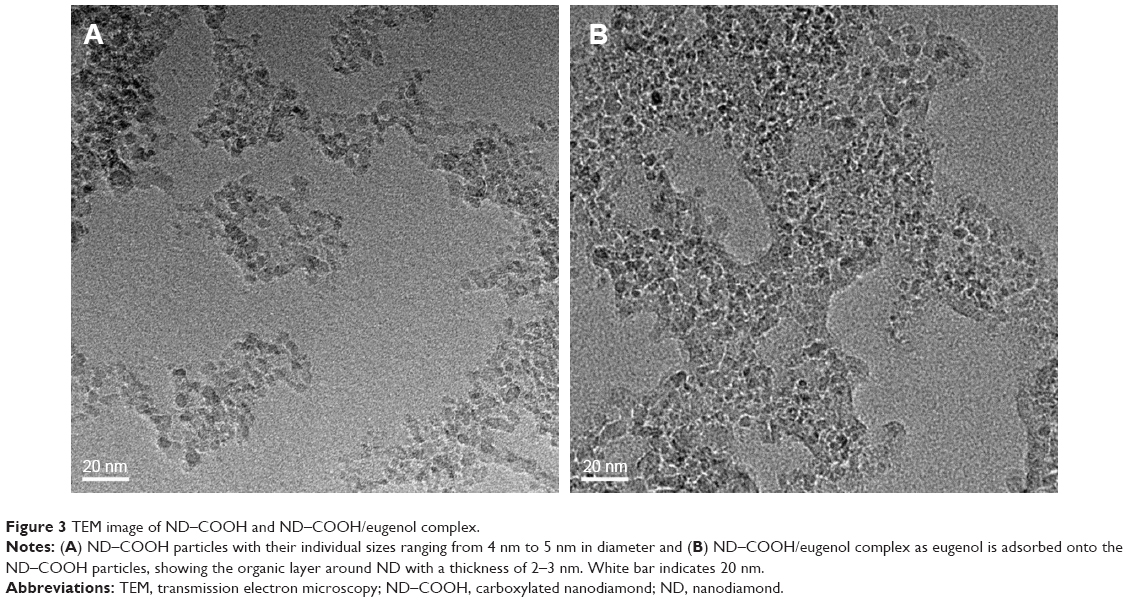 | Figure 3 TEM image of ND–COOH and ND–COOH/eugenol complex. |
Fourier transform infrared spectra were used to identify the functional groups of the ND–COOH particles (Figure 4A). The sample showed absorption bands attributed to hydroxyl bond stretching at 3,424 cm−1, carbonyl bond stretching at 1,773 cm−1, hydroxyl bond bending at 1,629 cm−1, and alcoholic C–OH bond stretching at 1,113 cm−1. ND–COOH had abundant oxygen-containing functional groups such as hydroxyls, lactones, ketones, aldehydes, and carboxylic acids and showed strong absorptions. XPS analysis was carried out to confirm that the ND–COOH in the current study had abundant carboxyl group. Figure 4B shows XPS wide scans of ND–COOH together with fits of the C1s and O1s bands of ND. The C1s peaks of ND–COOH were deconvoluted into component peaks using Gaussian fitting. The C1s peak of ND–COOH was deconvoluted with six binding energies at 282.6 eV (sp2), 283.5 eV (sp3), 284.6 eV (C–C), 286.0 eV (C–O), 287.5 eV (C=O), and 289.0 eV (–COOH) (Figure 4C). The O1s peaks were also deconvoluted with conventional two binding energies at 531.2 eV (C=O) and 533.3 eV (C–O–C/C–OH) (Figure 4D). It was noted that large area of carbonyl devolution curve of C1s and O1s was shown at 287.5 eV and 531.2 eV (C=O) of binding energies, respectively, indicating the high density of carboxyl functional group on the ND surface.
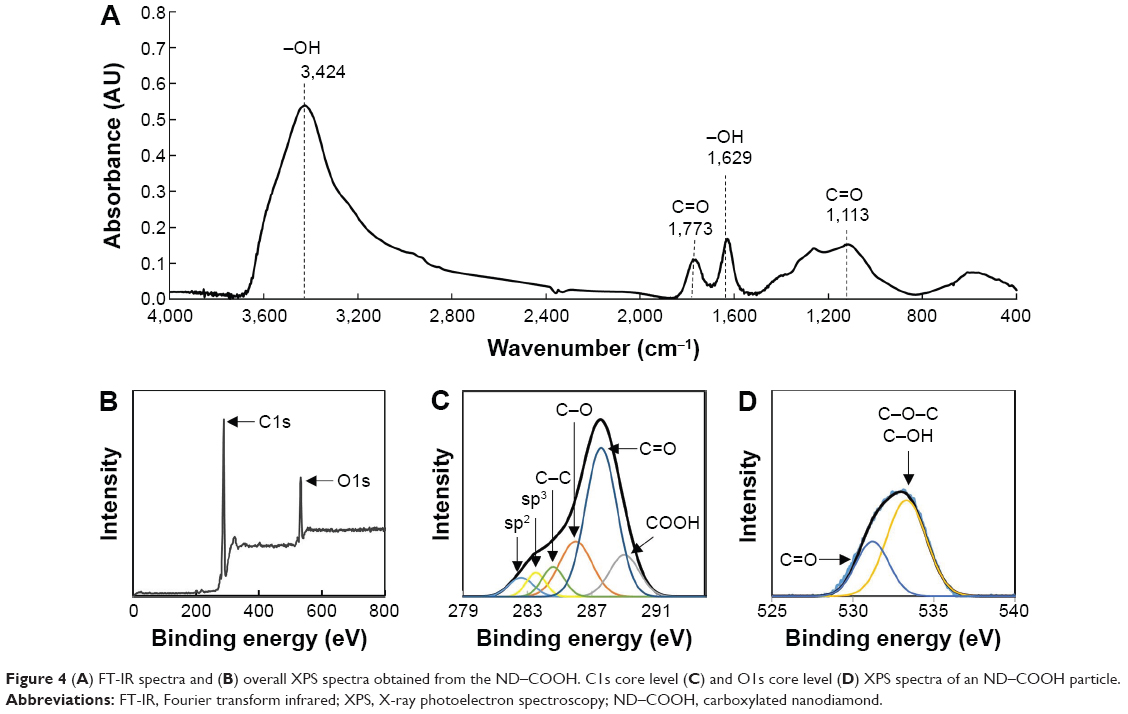 | Figure 4 (A) FT-IR spectra and (B) overall XPS spectra obtained from the ND–COOH. C1s core level (C) and O1s core level (D) XPS spectra of an ND–COOH particle. |
In vitro skin fluorescence imaging
Skin permeation of ND–fluorescein into porcine skin was evaluated using confocal microscopy. ND–fluorescein and fluorescein alone showed green emission, and DAPI-stained nuclei showed blue emission. Fluorescein diffused into the dermal layer after 12 hours of exposure (Figure 5A). In contrast, ND–fluorescein was observed only on the top of the stratum corneum and no sample diffused into the dermal layer even after 48 hours of exposure (Figure 5B).
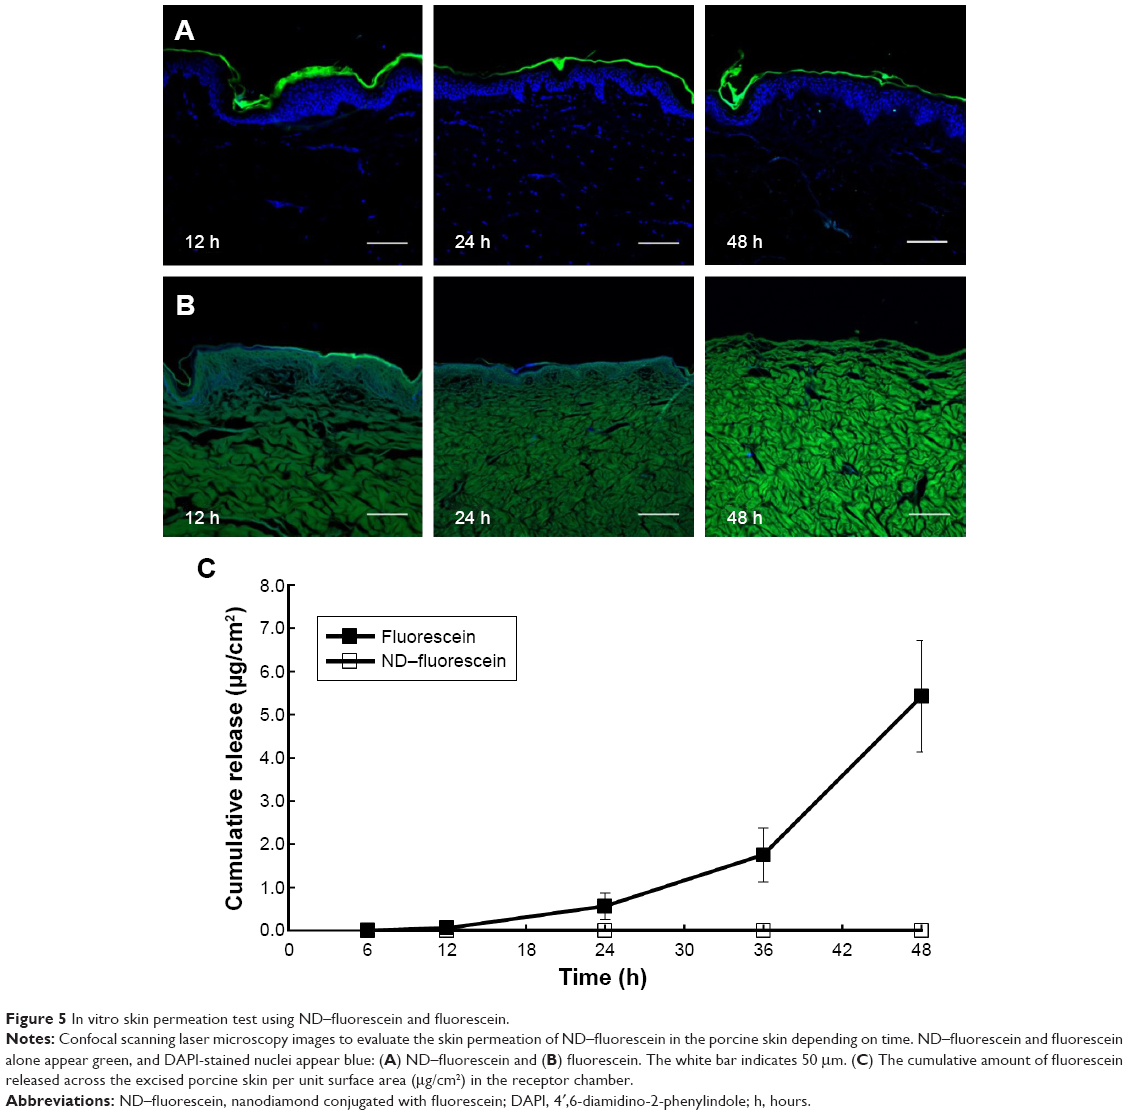 | Figure 5 In vitro skin permeation test using ND–fluorescein and fluorescein. |
The diffused samples were analyzed using a microplate reader to quantify the released amounts. The cumulative amount of fluorescein released per unit surface area in the receptor chamber gradually increased from 0.06 μg/cm2 at 6 hours to 5.43 μg/cm2 at 48 hours. No ND–fluorescein was detected in the receptor chamber after 48 hours (Figure 5C). The released amount of fluorescein was relatively low before 12 hours, as fluorescein showed a lag time for diffusion due to the thickness of porcine skin and its physicochemical properties.
ND–COOH particles could not permeate through the stratum corneum because the size of ND–COOH agglutinate was ~50 nm. Nanoparticles of ~20 nm and larger primary particle size could not penetrate into viable tissue.20 As diffusion test progresses, ND–COOH might be aggregated with the increase in the size of agglutinin while the absorption occurred and pH decreased due to the acidic skin pH.38 To be used as a permeation enhancer for topical delivery formulations, ND–COOH should not penetrate skin tissue; and hence, adverse effects via systemic circulation may not be expected. When carbon nanoparticles were absorbed into systemic circulation, there were several adverse effects reported such as immunogenicity, inflammation, and globulolysis.39,40 ND has low toxicity and high compatibility compared with other carbon nanoparticles and also has a topical delivery system. ND may have improved reliability with the expectation of minimal safety issues.41
Cell viability test
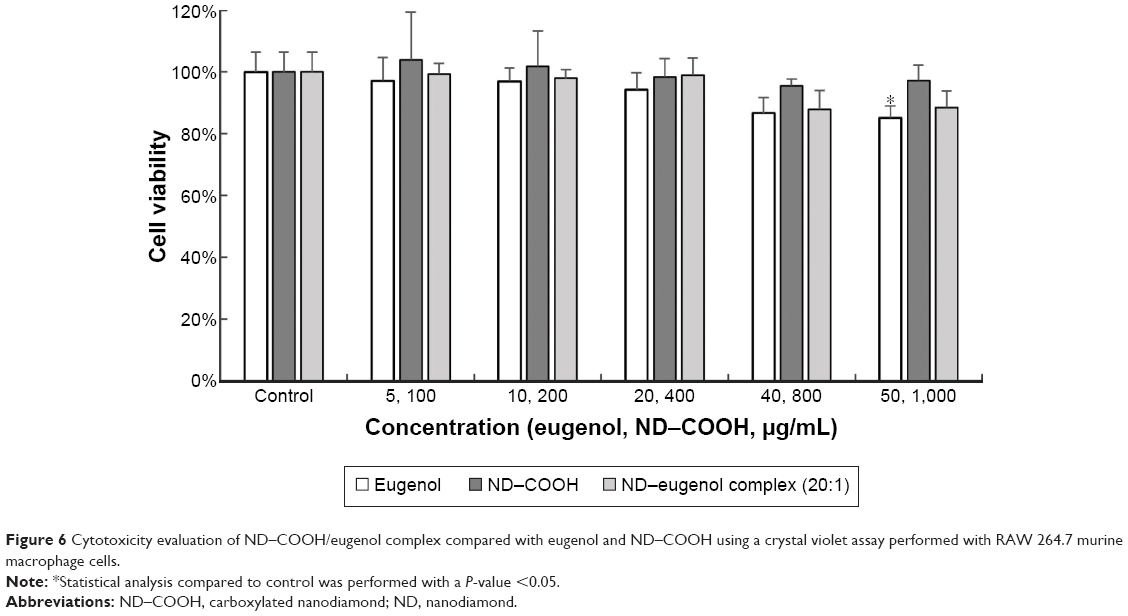
Even though ND–COOH was not permeable through the healthy skin, topical formulations might be applied on damaged skin, which might cause skin safety issues. Cytotoxicity evaluation could be useful to investigate the toxicity of ND-COOH when developing drug delivery systems. To evaluate the cytotoxicity of the ND–COOH/eugenol complex compared with both the model drug and ND–COOH alone, a crystal violet assay was performed using RAW 264.7 murine macrophage cells. This cell line is widely studied, robust, and allows repeatable results. ND–COOH and ND–COOH/eugenol complex did not induce any significant concentration-dependent decrease in the survival of RAW 264.7 cells in the concentration range of 100–1,000 μg/mL after a 24-hour incubation (Figure 6). During incubation, only 50 μg/mL of eugenol showed 85% cell viability with statistically significant difference compared to the control (P<0.05). Interestingly, eugenol did not show cytotoxicity at 50 μg/mL when mixed with ND–COOH. ND–COOH of 1,000 μg/mL and ND–COOH/eugenol complex (ND 1,000 μg/mL and eugenol 50 μg/mL) exhibited 98% and 89% cell viability, respectively. ND–COOH might reduce cytotoxicity of eugenol in the formulation with its low toxicity, adsorption ability, and high biocompatibility.
 | Figure 6 Cytotoxicity evaluation of ND–COOH/eugenol complex compared with eugenol and ND–COOH using a crystal violet assay performed with RAW 264.7 murine macrophage cells. |
ND particles showed improved biocompatibility compared to other known CNPs.42,43 It might be attributed to their chemical stability, biostability, and appropriate mechanical characteristics.44 Toxicity of nanoparticles is affected by surface physicochemical properties such as size, morphology, hydrophobicity, and charge.45 The ND–COOH in the present study was a negatively charged, hydrophilic, and highly functionalized nanoparticle. Negatively charged nanoparticles cause less disruption of plasma membrane integrity, stronger mitochondrial and lysosomal damage, and a lower number of autophagosomes than positively charged nanoparticles.46 In addition, chemically functionalized CNPs have shown reduced tissue accumulation and cytotoxicity compared with pristine CNPs.47,48 These physicochemical properties of ND–COOH may contribute to low cytotoxicity during the incubation.
In vitro skin permeation test
The permeation profiles of eugenol in solution, with or without ND, across the excised hairless mouse skin are shown in Figure 7A. The cumulative released amount of eugenol after 24 hours was 1,195.28 μg/cm2 in the ND–COOH/eugenol complex and 780 μg/cm2 in the eugenol solution. ND–COOH/eugenol complex showed ~50% higher released amount than the eugenol solution. It is highly probable that the adsorbed eugenol on the ND–COOH particles diffused rapidly upon exposure to the excised skin, which is in accordance with the TEM results. As free eugenol in the donor chamber diffused to the receptor chamber, adsorbed eugenol in ND–COOH, functioning as a “reservoir”, was released to the donor chamber maintaining a high concentration. Noteworthy, there was no significant difference in solubility between the two samples, with the concentration of eugenol in solution being 2,260 μg/mL and the concentration of free eugenol in the ND–COOH/eugenol solution being 2,310 μg/mL. Even though ND could not increase the aqueous solubility of eugenol, it may facilitate drug diffusion. Based on the solubility and TEM results, ND–COOH particles may hold higher amounts of eugenol by adsorption instead of inclusion.
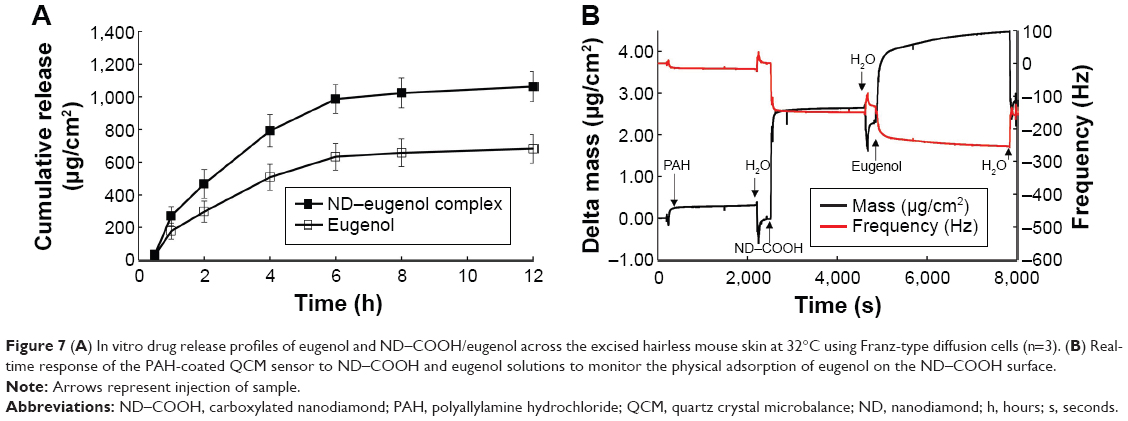 | Figure 7 (A) In vitro drug release profiles of eugenol and ND–COOH/eugenol across the excised hairless mouse skin at 32°C using Franz-type diffusion cells (n=3). (B) Real-time response of the PAH-coated QCM sensor to ND–COOH and eugenol solutions to monitor the physical adsorption of eugenol on the ND–COOH surface. |
As the cumulative diffused amount may be dependent on the initial amount in the donor chamber, the initial amount of free eugenol and that adsorbed to ND–COOH in the donor chamber could be estimated indirectly from the cumulative released amount based on the equilibrium concentration (after 12 hours in this study). As the initial concentration of free eugenol had already been observed, the amount of adsorbed eugenol to ND–COOH could be calculated as the difference between the cumulative amount and the free eugenol in the donor chamber. In this experiment, the concentration of free eugenol was 2,260 μg/mL, and hence, the initial ND–COOH/eugenol sample may have contained ~3,400 μg/mL eugenol. Therefore, 1,140 μg/mL eugenol may be adsorbed to 1,000 μg/mL ND–COOH. Although this calculation has some issues including the solubility of eugenol and the equilibrium concentration, ND–COOH particles could possess ~100% adsorption efficiency (weight ratio between ND–COOH and eugenol was 1.00:1.14).
Eugenol was permeated into the skin layer by passive diffusion. The main permeation routes of eugenol through the epidermis are intercellular and intracellular pathways.49 There were three factors to increase the skin permeation according to Fick’s law: drug concentration, diffusion coefficient, and drug partitioning into the epidermis.50 ND–COOH could maintain a high concentration of eugenol in the donor chamber by releasing absorbed eugenol, which retains the driving force for diffusion. A high adsorption capability is a favorable property of nanoparticles to be used as a drug reservoir for drug delivery. These results, in combination with the nonskin permeability of ND–COOH particles, suggest that ND–COOH could be used as an excellent topical drug permeation enhancer for poorly soluble drugs.
Quartz crystal microbalance
QCM was employed to directly monitor the physical adsorption of eugenol on the ND–COOH surface in situ. PAH, as the first layer, was adsorbed to change the negative surface charge of a gold electrode (Figure 7B). After removal of excess PAH, ND–COOH dispersion was flowed through the gold electrode. The major decrease in frequency corresponded to the adsorption of ND–COOH with a strong negative charge onto the positively charged PAH surface, suggesting that the PAH surface was dissipated by ND–COOH agglutinate. The mass of ND–COOH adsorbed on the PAH surface was 2.25 μg/cm2. As the eugenol solution was exposed to the ND–COOH-layered surface, the decreased frequency and increased resistance showed mass adsorption of eugenol onto the ND surface. As eugenol adsorption approached equilibrium, water was exposed to the ND/eugenol layer as a rinsing step. Subsequently, an increase in the frequency shift showed that eugenol was desorbed into the water.
The mass of eugenol adsorbed on the ND aggregates was 1.8 μg/cm2. In this experiment, ND–COOH could adsorb eugenol with an amount equivalent to 80% of its own mass. In addition, 75% of the eugenol was absorbed in 5 minutes after mixing and 75% of eugenol was desorbed in 1 minute after washing. From this result, ND showed immediate adsorption/desorption depending on its concentration. Although the calculated adsorption efficiency from the QCM results was smaller than the efficiency from the permeation test, this result suggested that ND has a strong physical adsorption capability as a drug reservoir.
Molecule adsorption on ND was strongly dependent on electrostatic interactions between ND and molecular species, surface group composition of ND, and particle size of ND.51 It was reported that surface adsorption of ND with protein had significant impact on surface charge, molecular weight, and protein rigidity.52 Small proteins such as lysozyme form multilayers with conformational changes in screen surface charge, while larger proteins such as albumin form monolayers with minimal conformational changes. Hydrogen bonding between eugenol and the carboxyl groups of ND–COOH may affect the physical adsorption based on the molecular structure of eugenol. Hydroxylated ND is thermodynamically more stable as observed from modeling studies of ND surface functionality.53 Since eugenol is nothing but methoxyphenol with hydroxyl group, hydrogen bonding with ND–COOH/eugenol around water may be formed to increase adsorption capability. In addition, aromatic ring of eugenol has π–π interaction with the carbon surface of ND.54,55 Since eugenol is a small molecule compared to protein and other chemical drugs, π–π interaction between ND and eugenol might not be dependent on facet size of ND, which makes eugenol easily approach ND surface. Hydrogen bonding and π–π interaction between eugenol and ND led the effective drug adsorption up to 80%. Moreover, the small particle size of ND–COOH in dispersion may induce a higher specific surface area, resulting in an improved adsorption capability of ND–COOH.
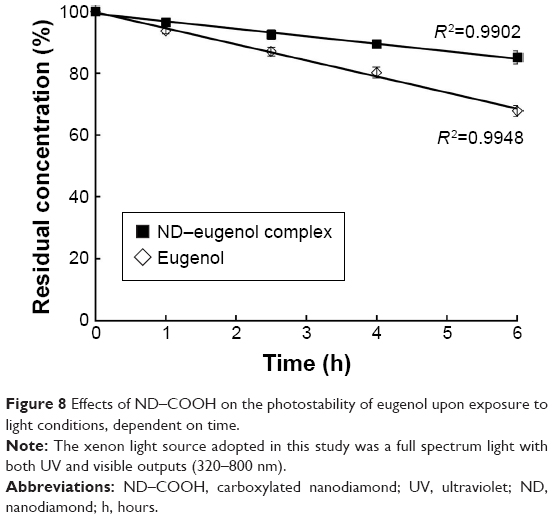
Photostability test
Eugenol, a model drug, is a well-known antioxidant; however, it exhibits increased cytotoxicity when exposed to light irradiation.33 Owing to the physicochemical properties of ND, it may be used as a UV filter.7,24 Therefore, photostability studies were carried out to investigate the effects of ND on the stability of eugenol. Figure 8 shows the content change of eugenol dependent on time, in both the ND–COOH/eugenol complex and eugenol solution, upon exposure to xenon light. The ND/eugenol complex showed improved stability compared with the eugenol solution, and after 6 hours, the concentration of eugenol decreased to 67.74% and 85.13% in the eugenol solution and ND–COOH/eugenol complex, respectively.
 | Figure 8 Effects of ND–COOH on the photostability of eugenol upon exposure to light conditions, dependent on time. |
To identify the degradation kinetics, the relative concentration of eugenol was plotted over time. Correlation coefficients (R2) of the plots exceeded 0.99, suggesting that the reaction of photodegradation may follow zero-order kinetics. The kinetic model can be expressed as the following equation:
Ct = C0 − kt | (3) |
where C0 is the concentration of eugenol at time zero, Ct is the concentration of eugenol after the reaction time (t), and k is the reaction rate constant. The rate constant of the eugenol solution was 5.208 and that of ND–COOH/eugenol was 2.425. The rate constant of ND–COOH/eugenol was ~47% to that of eugenol, suggesting that ND enhanced the photostability.
This result may be related to the “light protection” or “sun screening” properties of ND. The protection mechanism of chemical sunscreens depends mainly on absorption properties. ND absorbs high-energy radiation such as UVB (290–320 nm) and UVA (320–400 nm) and converts the remaining energy into longer wave radiation.56 The mechanism of physical sunscreens such as titanium dioxide involves reflection or scattering of UV radiation. However, ND has both the properties of UV absorption and scattering. The attenuation of UV radiation by ND is attributed to absorption by carbon in the sp2 hybridization state, present on the ND surface.23 Moreover, ND has a high refractive index (~2.4) and thus efficiently scatters light.55 The properties of ND to absorb and scatter UV radiation are dependent on the concentration and size of the ND particles. A previous report demonstrated that ND with sizes ranging from 50 nm to 100 nm effectively attenuated UV radiation, while maintaining the transparency of a sample in the visible spectral region.24 According to the DLS and TEM results, the ND in the present study has a size of ~50 nm without visible aggregates at neutral pH, indicating that our ND could attenuate UV light and stabilize eugenol, while retaining the esthetic value of topical formulations. Therefore, these results suggest that ND could be an effective photostabilizing agent and that this property of ND may be beneficial for the development of topical preparations containing eugenol as an active ingredient.
Evaluation of antioxidation
DCF analysis was performed to evaluate the intracellular antioxidant activity of eugenol and ND–COOH/eugenol complex. A significant decrease in ROS was observed in the tested concentration range of both samples compared with the negative control sample (Figure 9A). Eugenol played a role as an antioxidant scavenging cellular ROS. Interestingly, eugenol showed a concentration-independent ROS scavenging capability from 5 μg/mL to 50 μg/mL. Low concentrations of eugenol acted as an antioxidant, whereas high concentrations acted as a prooxidant, resulting from the enhanced generation of tissue-damaging free radicals.32 However, ND–COOH/eugenol complex showed a concentration-dependent ROS scavenging capability. Relative fluorescence intensity decreased from 80.89% to 46.25% with increasing concentrations from 5 μg/mL to 50 μg/mL eugenol with ND–COOH. ND–COOH may form a synergetic interaction with eugenol, thus exhibiting improved antioxidation. In the cell viability test, ND–COOH/eugenol complex showed higher cell viability than eugenol or ND–COOH, perhaps indicating a synergetic effect of ND–COOH and eugenol.
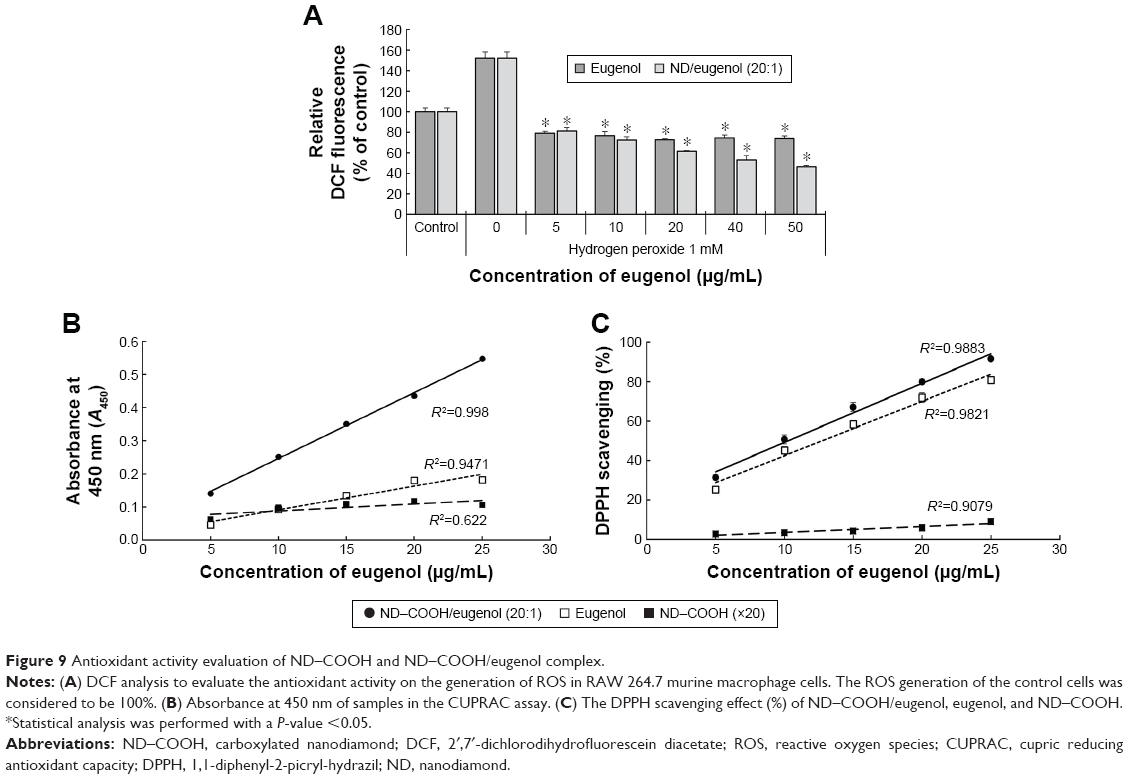 | Figure 9 Antioxidant activity evaluation of ND–COOH and ND–COOH/eugenol complex. |
CUPRAC assay showed similar results with the DCF analysis (Figure 9B). ND–COOH/eugenol complex showed improved antioxidant activity in the concentration range of 5–25 μg/mL. Correlation coefficient (R2) of the plots exceeded 0.99, suggesting that the antioxidation reaction may be concentration dependent. Eugenol and ND–COOH also showed antioxidant activity in CUPRAC assay, while the concentration dependency was not significant compared to the ND–COOH/eugenol complex. Moreover, ND–COOH/eugenol complex showed synergistic effect as the absorbance of ND–COOH/eugenol complex was more than the sum of ND–COOH and eugenol absorbance (P<0.05). CUPRAC is an electron transfer-based antioxidant quantification method that measures the capacity of an antioxidant by the reduction of Cu(II)-Nc.57
DPPH assay also showed antioxidant activity of ND–COOH/eugenol, eugenol, and ND–COOH (Figure 9C). All samples showed concentration-dependent antioxidant activity. However, ND–COOH/eugenol complex did not show synergistic effect. There was little difference between ND–COOH/eugenol complex and eugenol. Most of the DPPH radicals were reduced in the assay, and amounts of DPPH might not be sufficient for showing synergistic effect. The antiradical activity of a compound might be dependent on which assay is used.58
From these results, it is found that ND–COOH may act as an antioxidant in formulations and even can be a booster for antioxidation. This property may be beneficial for the development of topical drug delivery systems because oxidation is one of the most important degradation pathways during storage. Oxidation stress to drugs could induce toxic degradants, and oxidative damage to proteins including enzymes can lead to alterations in their primary, secondary, and tertiary structure and cause inactivation. ND–COOH could improve the stability and safety of formulations by preventing oxidation.
Conclusion
Various physicochemical properties of ND–COOH were investigated for use as a topical drug delivery system. It demonstrated the possibility to be used as a noble drug permeation enhancer with its high biocompatibility, physical adsorption, ROS scavenging effect, and photostabilizing capability. ND–COOH did not show significant toxic effects to murine macrophage cells, and it is nonpermeable into skin due to its surface physicochemical properties, including size, morphology, hydrophobicity, and surface charge. In the QCM experiment, ND–COOH could adsorb an amount of model drug equivalent to 80% of its own mass, showing an application of ND–COOH as a topical drug delivery reservoir. Potentially, ND–COOH could help disperse poorly soluble drugs with high drug adsorption, and it also exhibited an improved photostability in formulation. ND–COOH/eugenol complex showed ~53% slower reaction rate than the eugenol solution. Moreover, ND–COOH showed a high reactivity with ROS and the opportunity to be used as an antioxidant in various formulations. From these results, ND–COOH could be recommended as an excellent topical drug delivery system, especially for oxidation- and light-sensitive drugs with its improved permeability, higher stability, and minimized safety issues.
Acknowledgments
This research was supported by the Bio & Medical Technology Development Program of the National Research Foundation of Korea (NRF) funded by the Korean government, MSIP (NRF-2014M3A9A9073811), and the Basic Science Research Program through the NRF funded by the Ministry of Science, ICT and Future Planning (NRF-2015R1C1A2A01053307).
Disclosure
The authors report no conflicts of interest in this work.
References
Fisher C, Rider AE, Han ZJ, Kumar S, Levchenko I, Ostrikov K. Applications and nanotoxicity of carbon nanotubes and graphene in biomedicine. J Nanomater. 2012;2012:3. | ||
Khabashesku V, Margrave J, Barrera E. Functionalized carbon nanotubes and nanodiamonds for engineering and biomedical applications. Diamond Relat Mater. 2005;14(3–7):859–866. | ||
Schrand AM, Huang H, Carlson C, et al. Are diamond nanoparticles cytotoxic? J Phys Chem B. 2007;111(1):2–7. | ||
McGuinness L, Yan Y, Stacey A, et al. Quantum measurement and orientation tracking of fluorescent nanodiamonds inside living cells. Nat Nanotechnol. 2011;6(6):358–363. | ||
Zhang Q, Mochalin VN, Neitzel I, et al. Fluorescent PLLA-nanodiamond composites for bone tissue engineering. Biomaterials. 2011;32(1):87–94. | ||
Zhao L, Xu Y-H, Akasaka T, et al. Polyglycerol-coated nanodiamond as a macrophage-evading platform for selective drug delivery in cancer cells. Biomaterials. 2014;35(20):5393–5406. | ||
Wu M-S, Sun D-S, Lin Y-C, et al. Nanodiamonds protect skin from ultraviolet B-induced damage in mice. J Nanobiotechnology. 2015;13(1):1–12. | ||
Ostadhossein F, Mahmoudi N, Morales-Cid G, et al. Development of Chitosan/Bacterial Cellulose Composite Films Containing Nanodiamonds as a Potential Flexible Platform for Wound Dressing. Materials. 2015;8(9):6401–6418. | ||
Mochalin VN, Shenderova O, Ho D, Gogotsi Y. The properties and applications of nanodiamonds. Nat Nanotechnol. 2012;7(1):11–23. | ||
Krüger A, Kataoka F, Ozawa M, et al. Unusually tight aggregation in detonation nanodiamond: identification and disintegration. Carbon N Y. 2005;43(8):1722–1730. | ||
Aleksenskiy A, Eydelman E, Vul AY. Deagglomeration of detonation nanodiamonds. Nanosci Nanotechnol Lett. 2011;3(1):68–74. | ||
Mochalin VN, Gogotsi Y. Wet chemistry route to hydrophobic blue fluorescent nanodiamond. J Am Chem Soc. 2009;131(13):4594–4595. | ||
Petrov I, Shenderova O, Grishko V, et al. Detonation nanodiamonds simultaneously purified and modified by gas treatment. Diamond Relat Mater. 2007;16(12):2098–2103. | ||
Turcheniuk V, Raks V, Issa R, et al. Antimicrobial activity of menthol modified nanodiamond particles. Diamond Relat Mater. 2015;57:2–8. | ||
Gismondi A, Reina G, Orlanducci S, et al. Nanodiamonds coupled with plant bioactive metabolites: a nanotech approach for cancer therapy. Biomaterials. 2015;38:22–35. | ||
Xiao J, Duan X, Yin Q, Zhang Z, Yu H, Li Y. Nanodiamonds-mediated doxorubicin nuclear delivery to inhibit lung metastasis of breast cancer. Biomaterials. 2013;34(37):9648–9656. | ||
Chang R-K, Raw A, Lionberger R, Yu L. Generic development of topical dermatologic products: formulation development, process development, and testing of topical dermatologic products. AAPS J. 2013;15(1):41–52. | ||
Junginger HE, Verhoef JC. Macromolecules as safe penetration enhancers for hydrophilic drugs – a fiction? Pharm Sci Technolo Today. 1998;1(9):370–376. | ||
Baroli B, Ennas MG, Loffredo F, Isola M, Pinna R, López-Quintela MA. Penetration of metallic nanoparticles in human full-thickness skin. J Invest Dermatol. 2007;127(7):1701–1712. | ||
Prow TW, Grice JE, Lin LL, et al. Nanoparticles and microparticles for skin drug delivery. Adv Drug Deliv Rev. 2011;63(6):470–491. | ||
Chang L-Y, Ōsawa E, Barnard AS. Confirmation of the electrostatic self-assembly of nanodiamonds. Nanoscale. 2011;3(3):958–962. | ||
Mochalin VN, Pentecost A, Li X-M, et al. Adsorption of drugs on nanodiamond: toward development of a drug delivery platform. Mol Pharm. 2013;10(10):3728–3735. | ||
Aleksenskii A, Osipov VY, Vul AY, et al. Optical properties of nanodiamond layers. Phys Solid State. 2001;43(1):145–150. | ||
Shenderova O, Grichko V, Hens S, Walch J. Detonation nanodiamonds as UV radiation filter. Diamond Relat Mater. 2007;16(12):2003–2008. | ||
Adach K, Fijalkowski M, Skolimowski J. Antioxidant effect of hydroxylated diamond nanoparticles measured in soybean oil. Fullerenes Nanotubes Carbon Nanostruct. 2015;23(12):1024–1032. | ||
Holt KB, Ziegler C, Caruana DJ, et al. Redox properties of undoped 5 nm diamond nanoparticles. Phys Chem Chem Phys. 2008;10(2):303–310. | ||
Mallavarapu GR, Ramesh S, Chandrasekhara R, Rajeswara Rao B, Kaul P, Bhattacharya A. Investigation of the essential oil of cinnamon leaf grown at Bangalore and Hyderabad. Flavour Fragrance J. 1995;10(4):239–242. | ||
Barnes J, Anderson LA, Phillipson JD, Newall CA. Herbal Medicines. London: Pharmaceutical Press; 2007. | ||
Culleré L, Escudero A, Cacho J, Ferreira V. Gas chromatography-olfactometry and chemical quantitative study of the aroma of six premium quality Spanish aged red wines. J Agric Food Chem. 2004;52(6):1653–1660. | ||
Markowitz K, Moynihan M, Liu M, Kim S. Biologic properties of eugenol and zinc oxide-eugenol: a clinically oriented review. Oral Surg Oral Med Oral Pathol. 1992;73(6):729–737. | ||
Pramod K, Ansari SH, Ali J. Eugenol: a natural compound with versatile pharmacological actions. Nat Prod Commun. 2010;5(12):1999–2006. | ||
Fujisawa S, Atsumi T, Kadoma Y, Sakagami H. Antioxidant and prooxidant action of eugenol-related compounds and their cytotoxicity. Toxicology. 2002;177(1):39–54. | ||
Atsumi T, Iwakura I, Fujisawa S, Ueha T. Reactive oxygen species generation and photo-cytotoxicity of eugenol in solutions of various pH. Biomaterials. 2001;22(12):1459–1466. | ||
Apak R, Güçlü K, Özyürek M, Karademir SE. Novel total antioxidant capacity index for dietary polyphenols and vitamins C and E, using their cupric ion reducing capability in the presence of neocuproine: CUPRAC method. J Agric Food Chem. 2004;52(26):7970–7981. | ||
Mishra K, Ojha H, Chaudhury NK. Estimation of antiradical properties of antioxidants using DPPH assay: a critical review and results. Food Chem. 2012;130(4):1036–1043. | ||
Serjeant EP, Dempsey B. Ionisation Constants of Organic Acids in Aqueous Solution. Vol. 23. Oxford: Pergamon Press; 1979. | ||
Barnard AS. Self-assembly in nanodiamond agglutinates. J Mater Chem. 2008;18(34):4038–4041. | ||
Schmid-Wendtner M-H, Korting HC. The pH of the skin surface and its impact on the barrier function. Skin Pharmacol Physiol. 2006;19(6):296–302. | ||
Chou C-C, Hsiao H-Y, Hong Q-S, et al. Single-walled carbon nanotubes can induce pulmonary injury in mouse model. Nano Lett. 2008;8(2):437–445. | ||
Poland CA, Duffin R, Kinloch I, et al. Carbon nanotubes introduced into the abdominal cavity of mice show asbestos-like pathogenicity in a pilot study. Nat Nanotechnol. 2008;3(7):423–428. | ||
Figarol A, Pourchez J, Boudard D, et al. In vitro toxicity of carbon nanotubes, nano-graphite and carbon black, similar impacts of acid functionalization. Toxicol In Vitro. 2015;30(1 pt B):476–485. | ||
Yuan J, Gao H, Ching CB. Comparative protein profile of human hepatoma HepG2 cells treated with graphene and single-walled carbon nanotubes: an iTRAQ-coupled 2D LC–MS/MS proteome analysis. Toxicol Lett. 2011;207(3):213–221. | ||
Zhang Y, Ali SF, Dervishi E, et al. Cytotoxicity effects of graphene and single-wall carbon nanotubes in neural phaeochromocytoma-derived PC12 cells. ACS Nano. 2010;4(6):3181–3186. | ||
Solarska K, Gajewska A, Kaczorowski W, Bartosz G, Mitura K. Effect of nanodiamond powders on the viability and production of reactive oxygen and nitrogen species by human endothelial cells. Diamond Relat Mater. 2012;21:107–113. | ||
Gajewicz A, Rasulev B, Dinadayalane TC, et al. Advancing risk assessment of engineered nanomaterials: application of computational approaches. Adv Drug Deliv Rev. 2012;64(15):1663–1693. | ||
Fröhlich E. The role of surface charge in cellular uptake and cytotoxicity of medical nanoparticles. Int J Nanomedicine. 2012;7:5577. | ||
Bianco A, Kostarelos K, Prato M. Making carbon nanotubes biocompatible and biodegradable. Chem Commun. 2011;47(37):10182–10188. | ||
Trpkovic A, Todorovic-Markovic B, Trajkovic V. Toxicity of pristine versus functionalized fullerenes: mechanisms of cell damage and the role of oxidative stress. Arch Toxicol. 2012;86(12):1809–1827. | ||
Bolzinger M-A, Briançon S, Pelletier J, Chevalier Y. Penetration of drugs through skin, a complex rate-controlling membrane. Curr Opin Colloid In. 2012;17(3):156–165. | ||
Moser K, Kriwet K, Naik A, Kalia YN, Guy RH. Passive skin penetration enhancement and its quantification in vitro. Eur J Pharm Biopharm. 2001;52(2):103–112. | ||
Gibson NM, Luo T-JM, Shenderova O, Koscheev AP, Brenner DW. Electrostatically mediated adsorption by nanodiamond and nanocarbon particles. J Nanopart Res. 2012;14(3):1–12. | ||
Aramesh M, Shimoni O, Ostrikov K, Prawer S, Cervenka J. Surface charge effects in protein adsorption on nanodiamonds. Nanoscale. 2015;7(13):5726–5736. | ||
Lai L, Barnard AS. Modeling the thermostability of surface functionalisation by oxygen, hydroxyl, and water on nanodiamonds. Nanoscale. 2011;3(6):2566–2575. | ||
Gibson N, Luo T, Brenner D, Shenderova O. Immobilization of mycotoxins on modified nanodiamond substrates. Biointerphases. 2011;6(4):210–217. | ||
Schrand AM, Hens SAC, Shenderova OA. Nanodiamond particles: properties and perspectives for bioapplications. Crit Rev Solid State Mater Sci. 2009;34(1–2):18–74. | ||
Lowe NJ. Sunscreens: Development: Evaluation, and Regulatory Aspects. Boca Raton FL: CRC Press; 1996. | ||
Özyürek M, Güçlü K, Tütem E, et al. A comprehensive review of CUPRAC methodology. Anal Methods. 2011;3(11):2439–2453. | ||
Ou B, Huang D, Hampsch-Woodill M, Flanagan JA, Deemer EK. Analysis of antioxidant activities of common vegetables employing oxygen radical absorbance capacity (ORAC) and ferric reducing antioxidant power (FRAP) assays: a comparative study. J Agric Food Chem. 2002;50(11):3122–3128. |
 © 2016 The Author(s). This work is published and licensed by Dove Medical Press Limited. The full terms of this license are available at https://www.dovepress.com/terms.php and incorporate the Creative Commons Attribution - Non Commercial (unported, v3.0) License.
By accessing the work you hereby accept the Terms. Non-commercial uses of the work are permitted without any further permission from Dove Medical Press Limited, provided the work is properly attributed. For permission for commercial use of this work, please see paragraphs 4.2 and 5 of our Terms.
© 2016 The Author(s). This work is published and licensed by Dove Medical Press Limited. The full terms of this license are available at https://www.dovepress.com/terms.php and incorporate the Creative Commons Attribution - Non Commercial (unported, v3.0) License.
By accessing the work you hereby accept the Terms. Non-commercial uses of the work are permitted without any further permission from Dove Medical Press Limited, provided the work is properly attributed. For permission for commercial use of this work, please see paragraphs 4.2 and 5 of our Terms.