")
Back to Journals » International Journal of General Medicine » Volume 15
Comprehensive Analysis of Potential Correlation Between Solute Carrier 1A (SLC1A) Family and Lung Adenocarcinoma
Authors Zhong X , Yao L, Xu L, Ma Q, Huang G, Yang M, Gao C, Cheng J, Zhou X, Li Q , Guo X
Received 21 December 2021
Accepted for publication 15 February 2022
Published 24 February 2022 Volume 2022:15 Pages 2101—2117
DOI https://doi.org/10.2147/IJGM.S350986
Checked for plagiarism Yes
Review by Single anonymous peer review
Peer reviewer comments 2
Editor who approved publication: Dr Scott Fraser
Xiaowu Zhong,1– 3,* Lihua Yao,1,2,* Lei Xu,3,* Qiang Ma,1,2 Guangcheng Huang,1,2 Miyuan Yang,2 Chuanli Gao,2 Jibing Cheng,1,2 Xi Zhou,2 Qinrong Li,2 Xiaolan Guo1– 3
1Department of Clinical Laboratory, Affiliated Hospital of North Sichuan Medical College, Nanchong, 637000, People’s Republic of China; 2Department of Laboratory Medicine, North Sichuan Medical College, Nanchong, 637000, People’s Republic of China; 3Translational Medicine Research Center, North Sichuan Medical College, Nanchong, 637000, People’s Republic of China
*These authors contributed equally to this work
Correspondence: Xiaolan Guo, Department of Clinical Laboratory, Affiliated Hospital of North Sichuan Medical College, Nanchong, 637000, People’s Republic of China, Tel +86-817-2282059, Fax +86-817-2282059, Email [email protected]
Background: Lung adenocarcinoma (LUAD) is the most common dangerous malignant tumor and the leading cause of global cancer incidence and mortality. The Solute Carrier 1A (SLC1A) family play a significant part in cellular biological process, inflammation, and immunity. Specific functions of the SLC1A family in lung cancer are still not systematically described.
Objective: This study aimed to explore the best biological understanding of SLC1A family in lung cancer.
Methods: To study the expression and role of the SLC1A family in lung cancer, researchers used a variety of bioinformatics databases and tools.
Results: Aberrant expression of SLC1A family genes were demonstrated and analyzed the association with gender, tumor grade, cancer stages, and nodal metastasis status. The ectopic expression of SLC1A family genes has prognostic value for LUAD patients. Immune infiltration revealed a significant correlation between SLC1A family genes expression in LUAD. SLC1A family genes were involved in manifold biological processes and have different levels of DNA methylation and genetic alteration.
Conclusions: These findings suggested that members of the SLC1A family could be a potential target for the development of LUAD therapeutics as well as a reliable indicator of LUAD prognostic value.
Keywords: lung adenocarcinoma, SLC1A family, expression, prognosis, bioinformatics analysis
Graphical Abstract:

Introduction
Lung cancer includes two major histological groups, small cell lung cancer (SCLC) and non-small cell lung cancer (NSCLC). Lung adenocarcinoma (LUAD) is a histological subtype of NSCLC, accounting for about 50% of all lung cancer cases.1 LUAD is the most common cancer in both men and women, and it is also the leading cause of cancer death. In recent years, many countries had reported that LUAD had the highest incidence and mortality rate, and was one of the most dangerous malignant tumors for people’s health and life.2 As a result, it’s critical to look for potential prognostic biomarkers for early detection and novel therapeutic targets.
The members of the Solute Carrier 1A (SLC1A) family consists of five homologous glutamate transporters: EAATs (EAAT1/SLC1A3, EAAT2/SLC1A2, EAAT3/SLC1A1, EAAT4/SLC1A6 and EAAT5/SLC1A7) and two neutral amino acid transporters: ASCTs (ASCT1/SLC1A4, and ASCT2/ SLC1A5). The main function of EAATs is maintaining the low synaptic concentration of glutamate, and ASCTs play an important role in tumor biology.3 Numerous studies reported the SLC1A family members’ aberrant expression in various tumors and predict adverse prognosis. SLC1A1 dysregulates in lung cancer cells, and is tightly intertwined with Glutathione Synthesis.4 SLC1A2 enhances glutamate release from glioma cells may contribute to tumor-associated necrosis.5 Meanwhile, SLC1A2 expression is highly correlated with tumor grade in glioma patients, and play important role in controlling cell proliferation in vitro and in vivo.6,7 Upregulated SLC1A3 correlates with poor prognosis and activates the PI3K/AKT pathway in gastric cancer.8 The latest study reported that SLC1A4 is upregulated in HCC and involved in various carcinogenesis-associated signaling pathways and processes.9 Previous studies have shown that SLC1A5 is found to be overexpressed in multiple tumors, including breast cancer,10 endometrial carcinoma,11 esophageal cancer,12 prostate cancer,13 gastric cancer.14 In addition, SLC1A5 regulates glutamine uptake cancer growth and tumor development in vitro and in vivo.11–14 During radiation treatment, SLC1A6 is upregulated and correlated with poor prognosis in nasopharyngeal carcinoma patients.15 In a word, the members of the SLC1A genes family play an important role in multiple tumors. Nonetheless, few studies investigating the functions and prognostic values of SLC1A and LUAD on a systemic level are still lacking.
In the present study, we first comprehensive analysis to investigate the significance of the SLC1A family members expression, prognosis, and biological function in LUAD via multiple bioinformatics databases. We hope that our research will be beneficial to the diagnosis and treatment of LUAD.
Materials and Methods
Expression Analysis of SLC1A Family Members
Oncomine (https://www.oncomine.org/resource/main.html), an integrated online cancer microarray database, was used to compute gene expression signatures, clusters and gene-set modules, automatically extracting biological insights from 715 datasets of 86,733 samples.16 The pan-cancer studies in SLC1A family genes were selected to compare the expression levels in tumors vs normal tissues. The selection criteria for the Oncomine studies were P < 0.05, 1.5-fold change and expressed gene rank in the top 10% were input as our selection threshold.
UALCAN (http://ualcan.path.uab.edu/index.html) is a web-portal platform to facilitate the comprehensive analysis of the relative expression of a query gene in various molecular subtypes based on individual cancer stages, tumor grade, race, body weight or other clinico-pathologic parameters features using The Cancer Genome Atlas (TCGA) data.17 TCGA provides web resources including RNA-sequencing and patients’ Clinical data from 33 different cancer types.18 Gene expression of the SLC1A family genes in various tumor subgroups of LUAD was estimated using UALCAN from a primary TCGA-LUAD dataset (n=574). UALCAN also discovered the effect of SLC1A gene expression levels and relative clinic-pathologic characteristics.
Differentially Expressed SLC1A Family Members at Protein Level
The Human Protein Atlas (http://www.proteinatlas.org) is a user-friendly online platform that contains the protein expression of in cells, tissues, and organs of the human body based on proteomics, transcriptomics, and systems biology.19 The Human Protein Atlas between normal lung and LUAD tissues was used to show Immunohistochemistry (IHC) data for Clinical potential application of distinct SLC1A family members.
Kaplan–Meier Plotter Analysis
Kaplan-Meier Plotter (http://kmplot.com/analysis/index.php?p=background) is a comprehensive and user-friendly online tool to analyze the prognostic value of a particular gene, which contains the gene expression and survival information of 661 LUAD patients.20 The cancer patients were divided into high and low expression groups according to the median mRNA expression values to evaluate overall survival (OS), first progression survival (FPS) and post progression survival (PPS) by Kaplan-Meier Plotter, with the hazard ratio (HR) with 95% confidence intervals (CI) and log-rank P-value. Furthermore, the Kaplan-Meier Plotter was also used to assess the relationship between mRNA expression of SLC1A family genes and other clinic-pathological variables such as gender, clinical stage, smoking history, and surgery mode.
DNA Methylation Analysis
We utilized the UALCAN to analyze promoter methylation of SLC1A family genes between the normal and primary lung tumor tissues. Also, we used the MEXPRESS to measure the correlation between DNA methylation and gene expression of SLC1A family genes from TCGA-LUAD cohorts.21,22
Genetic Alteration Analysis
cBioPortal (https://www.cbioportal.org/) is an online open-access resource for exploring, visualizing, and analyzing multidimensional cancer genomics data.23 The cBioPortal was used to browse, visualize, and analyze genomic profiles of SLC1A family genes in TCGA-LUAD cohorts, including mutations and probable copy-number changes (CNA). Furthermore, mRNA expression Z-scores (RNASeq V2 RSEM) and protein expression Z-scores (RPPA) were obtained. The correlation analyses of SLC1A genes family were performed using TCGA-LUAD cohorts.
Immune Infiltration Analysis
TIMER 2.0 (http://timer.cistrome.org/) is an online database for systematically investigating and visualizing the clinical impact of different immune cells in diverse cancer types, which incorporated 10,009 samples across 23 cancer types from TCGA.24 The immune infiltration estimation of SLC1A family genes was carried out in LUAD by TIMER. All analyses were performed using Spearman correlation and a P-value less than 0.05 indicated statistical significance.
Construction of Related Genes Network
GeneMANIA (http://www.genemania.org) is a tool for finding other genes that are related to a set of input genes using available genomics and proteomics data.25 In this study, the SLC1A genes family were submitted to the software Cytoscape version 3.8.226 to illustrate the functional association network among SLC1A family genes and their related genes using GeneMANIA Manage app. The advanced statistical options were that max resultant attributes were 20, max resultant genes were 10, and the weighing method used was automatically selected.
Functional Annotation and Pathway Enrichment Analysis
The Database for Annotation, Visualization and Integrated Discovery (DAVID, https://david.ncifcrf.gov/) provided a comprehensive set of functional annotation tools for investigators to understand the biological meaning of genes.27 Gene Ontology (GO) and Kyoto Encyclopedia of Genes and Genomes (KEGG) pathway enrichment analysis functions of SLC1A family genes and their 20 related genes were enriched by DAVID. P<0.05 was set as the threshold to indicate a statistically significant difference.
Results
Transcriptional Expression Studies of the SLC1A Family Members in LUAD Tissues
Oncomine examined the mRNA expression of SLC1A family members in LUAD patients in comparison to normal tissues. As shown in Figure 1 and Table 1, we found that mRNA expressions of SLC1A1 and SLC1A2 was lower in LUAD tissues compared to normal tissues with fold changes of 4.377, 3.960, 3.085, 3.826, 2.826, 1.768, 2.642and 2.439 (p=2.72E-11, 2.24E-8, 1.55E-4, 1.02E-19, 4.14E-7, 5.25E-13, 1.74 E-8, 4.09E-4), respectively. mRNA expressions of SLC1A4 and SLC1A5 were obviously higher in LUAD tissues with fold changes of 1.904, 1.724, 1.549, 1.640, 1.586 and 1.688 (p=2.16E-8, 5.57E-6, 7.10E-13, 1.79 E-10, 3.14 E-5, 3.96 E-10), respectively.
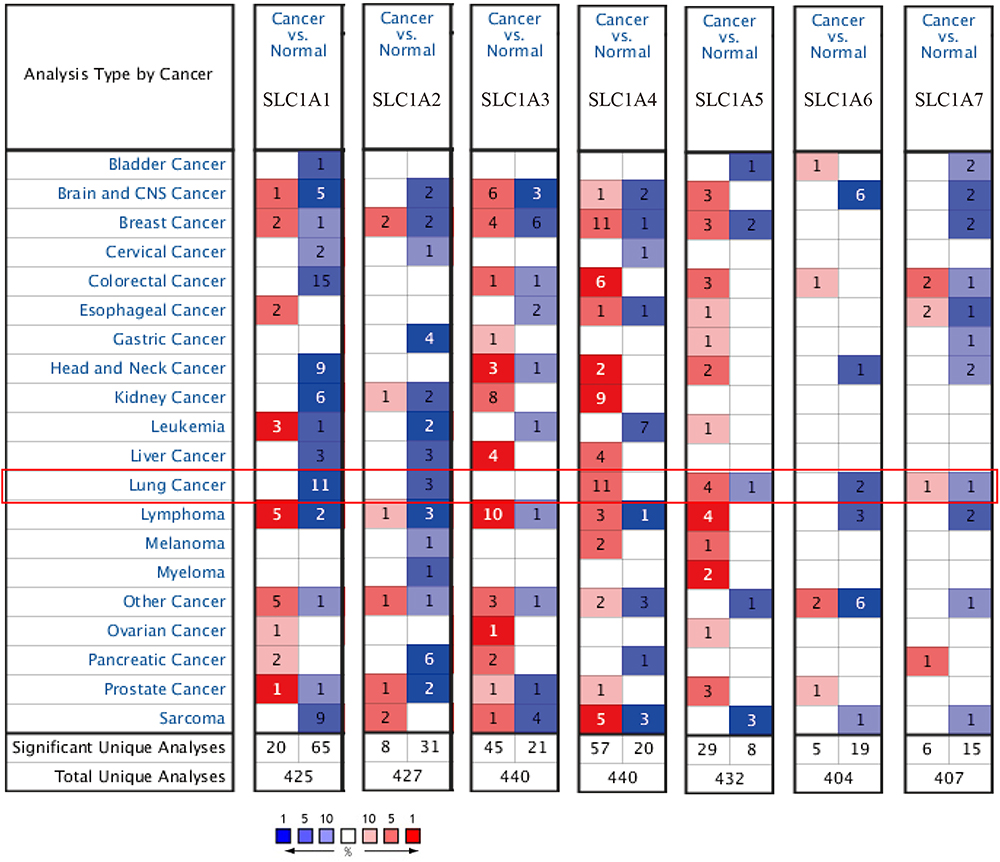 |
Figure 1 Transcriptional expressions of SLC1A family members in human cancers. The number in the cell represents the number of analyses that meet our threshold. Cell color is determined by the gene rank. Red: up-regulation; Blue: down-regulation. |
Further analysis of the transcriptional expression of SLC1A family members in LUAD using TCGA database. The results were consistent with Oncomine database, as shown in Figure 2, the transcription expression of SLC1A1 and SLC1A2 was significantly down-regulated in LUAD tissues compared to the normal tissues (Figure 2A and B). On the contrary, the expression of SLC1A4, SLC1A5 and SLC1A7 in LUAD tissues was significantly higher than the corresponding normal tissues (Figure 2D–E and G). SLC1A3 and SLC1A6 showed no significant difference compared with normal tissues (Figure 2C and F). However, SLC1A2 was significantly down-regulated in tumor compared with the paired normal tissues of 59 LUAD patients. SLC1A3, SLC1A4, SLC1A5 and SLC1A6 were overexpression in LUAD tissues compared with their paired normal tissues (Figure S1).
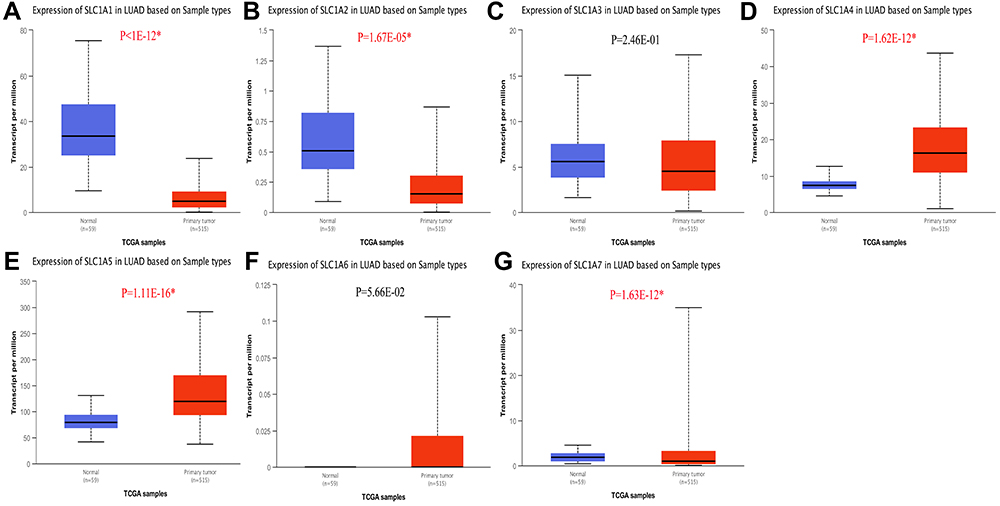 |
Figure 2 The expression of SLC1A family genes in LUAD patients. Expression panels for SLC1A1 (A), SLC1A2 (B), SLC1A3 (C), SLC1A4 (D), SLC1A5 (E), SLC1A6 (F) and SLC1A7 (G) based on major cancer stage comparing 59 normal individuals and data for 515 LUAD patients in TCGA database. *P<0.05 was considered statistically significant. Abbreviation: LUAD, lung adenocarcinoma. |
Association of SLC1A Family Members’ Prognostic Values in LUAD Patients with Different Clinicopathological Features
The relationship between the transcription expression of SLC1A family genes and clinicopathological features was analyzed by UALCAN. As shown in Figure S2-S9, the mRNA expression of SLC1A1, SLC1A2, SLC1A4, SLC1A5 and SLC1A7 were significantly correlated with tumor stages, race, gender, smoking, tumor histological subtypes, nodal metastasis status and TP53 mutation status of LUAD patients. However, SLC1A3 and SLC1A6 were no obvious relativity with clinical factors, it may be that the transcriptional expression of SLC1A3 and SLC1A6 were no significant difference in LUAD patients (Figure 2C and F). The above results indicated that part of SLC1A family genes correlated with different clinicopathological features.
Protein Expression of Different SLC1A Family Members in Patients with LUAD
The Human Protein Atlas also looked into the protein expression of SLC1A family members in LUAD patients. As shown in Figure 3, the protein expression of SLC1A1 and SLC1A6 was lower expressed in LUAD tissues compared with normal tissues. Consisted with the mRNA expression, the protein level of SLC1A4 and SLC1A5 highly expressed in LUAD tissues, while lower expressed in normal tissues. In short, the aberrant expression of SLC1A family genes in LUAD tissues both in the transcriptional and protein expressions.
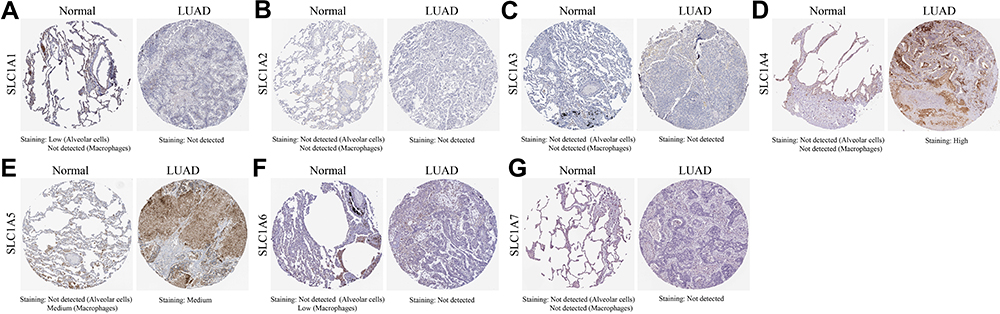 |
Figure 3 The immunohistochemistry expression pattern of SLC1A family members in LUAD tissues and normal lung tissues. Protein Expression for SLC1A1 (A), SLC1A2 (B), SLC1A3 (C), SLC1A4 (D), SLC1A5 (E), SLC1A6 (F) and SLC1A7 (G) obtain from Human Protein Atlas database. Abbreviation: LUAD, lung adenocarcinoma. |
Prognostic Value of SLC1A Family Members in LUAD Patients
The prognostic value of SLC1A genes family for LUAD patients was investigated using Kaplan-Meier plotter. As shown in Figure 4, low expression of SLC1A1, SLC1A2, SLC1A4 and SLC1A7 showed poorer OS, while high SLC1A5 and SLC1A6 were related to worse prognosis in LUAD patients. And SLC1A3 was not associated with OS. The median OS of SLC1A1, SLC1A2, SLC1A3, SLC1A4, SLC1A5, SLC1A6 and SLC1A7 in LUAD patients were 93.165, 103.87, 101, 100.885, 98.985, 102.585, and 103.165 months (p=0.133, 0.0712, 0.259, 0.0225, 0.587, 0.161, 0.132), respectively. To evaluate the association between mRNA expression of SLC1A family genes and OS in various clinic-pathological features by Kaplan-Meier Plotter, the results revealed that SLC1A family genes correlated with OS in gender, clinical stage, smoking history, and surgery method (Tables 2–345). Figure 5 shows a negative link between high SLC1A5 and improved FPS in LUAD patients, but high SLC1A1, SLC1A2, and SLC1A7 exhibited a positive correlation with favorable FPS. The results showed that the high expression of SLC1A1and SLC1A4 had a good PPS in Figure 6.
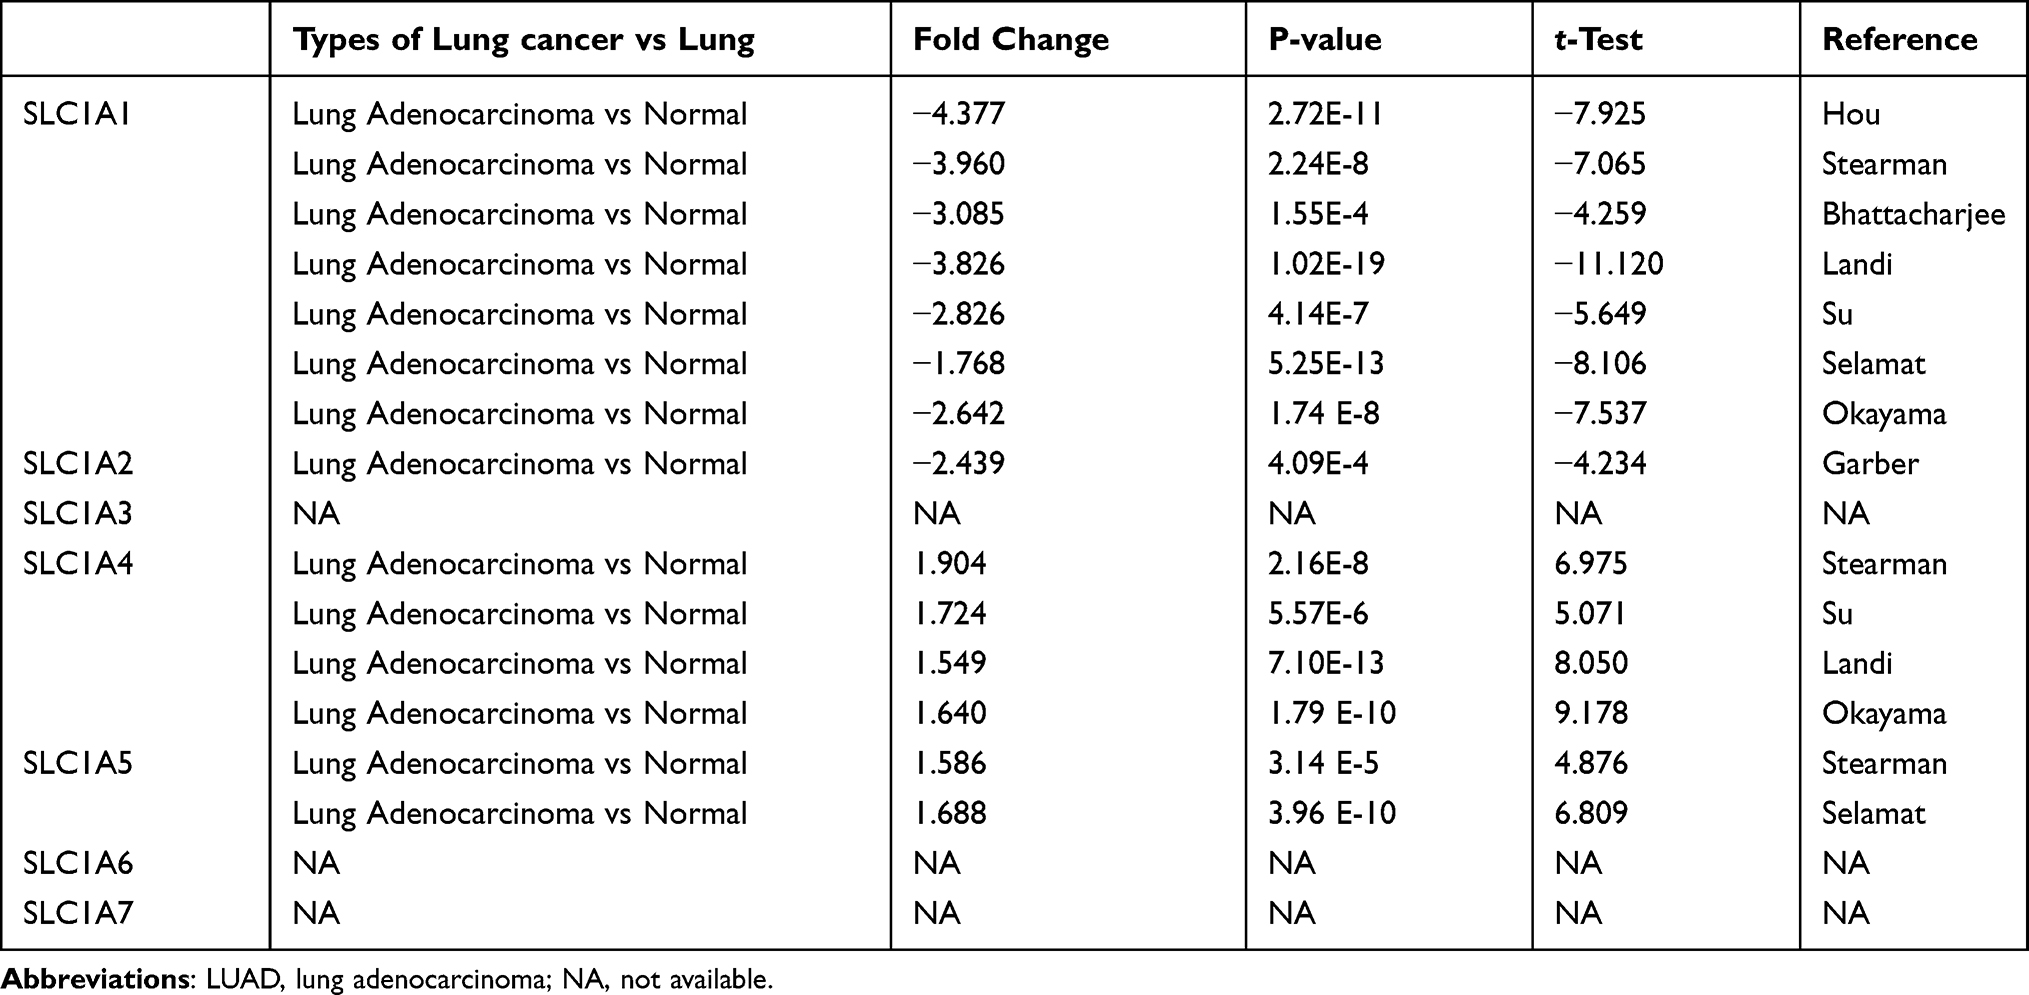 |
Table 1 The Transcription Level of SLC1A Family Genes Between LUAD and Normal Lung Tissues |
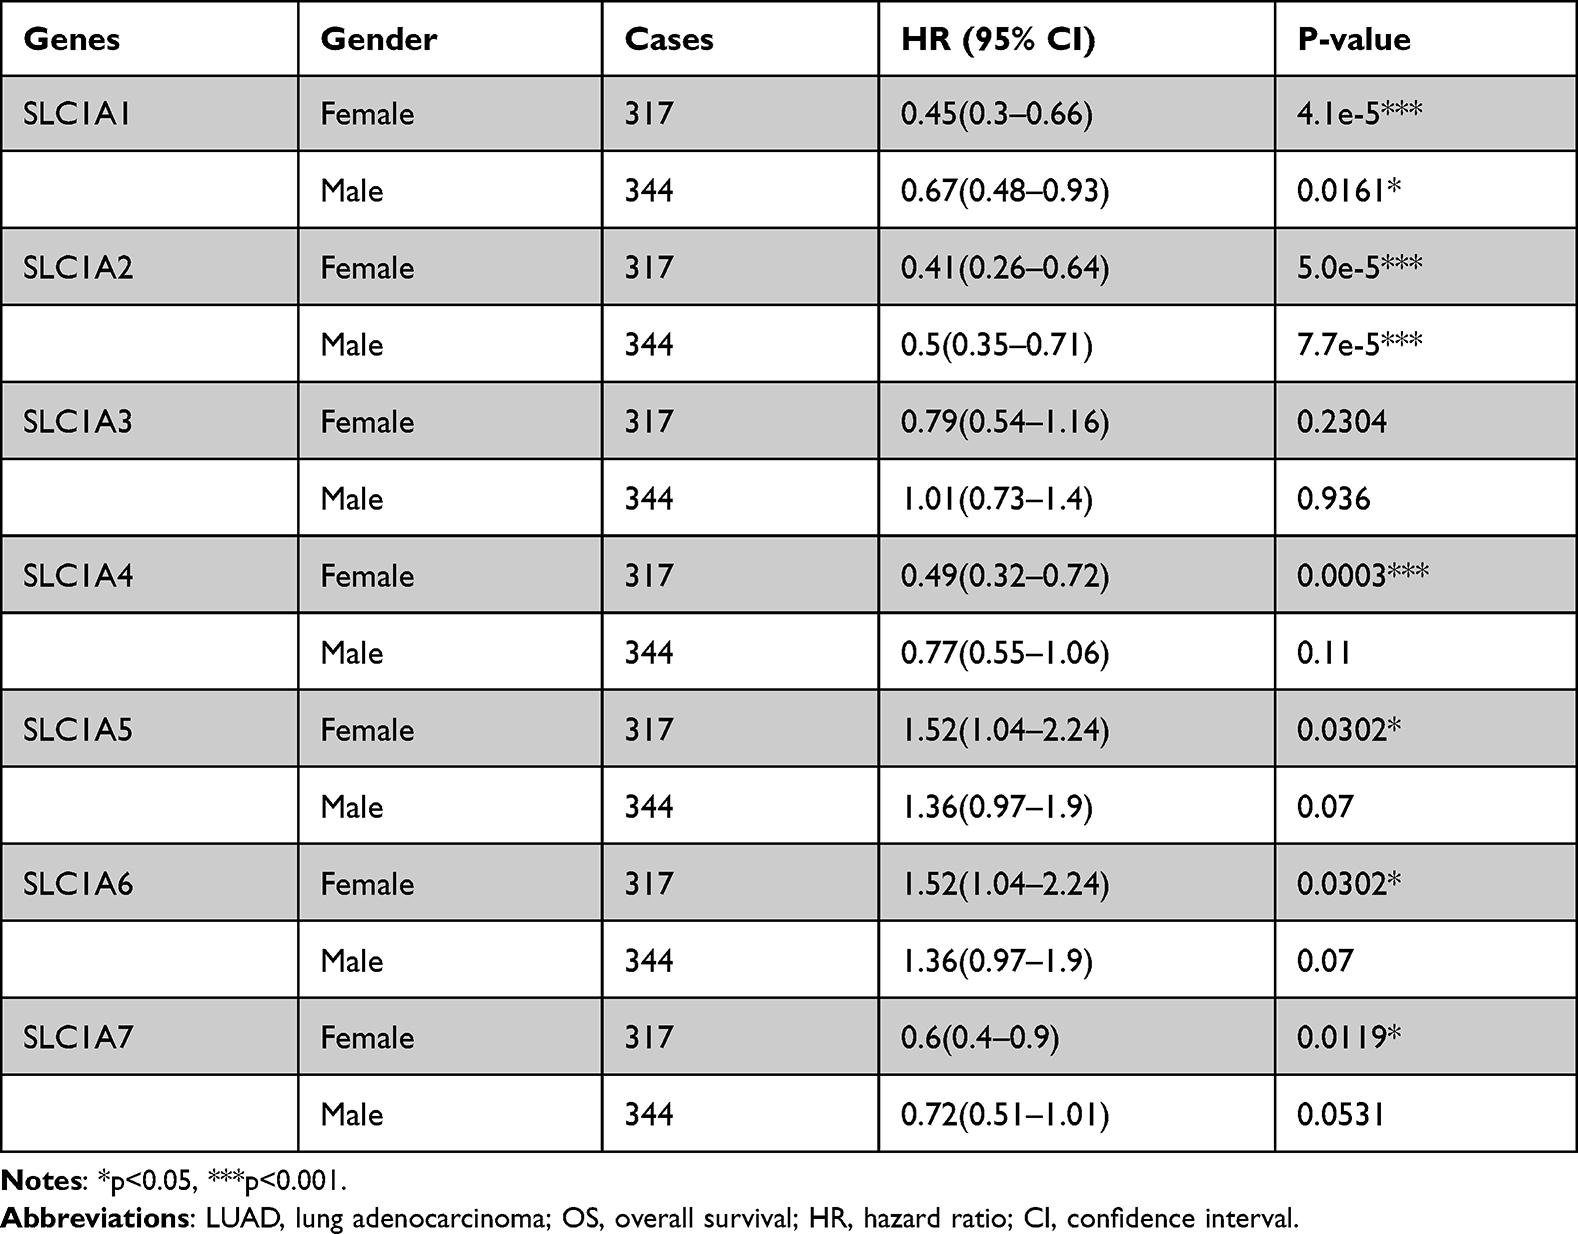 |
Table 2 The Relationship Between SLC1A Family Genes and OS in Different Gender of LUAD Patients |
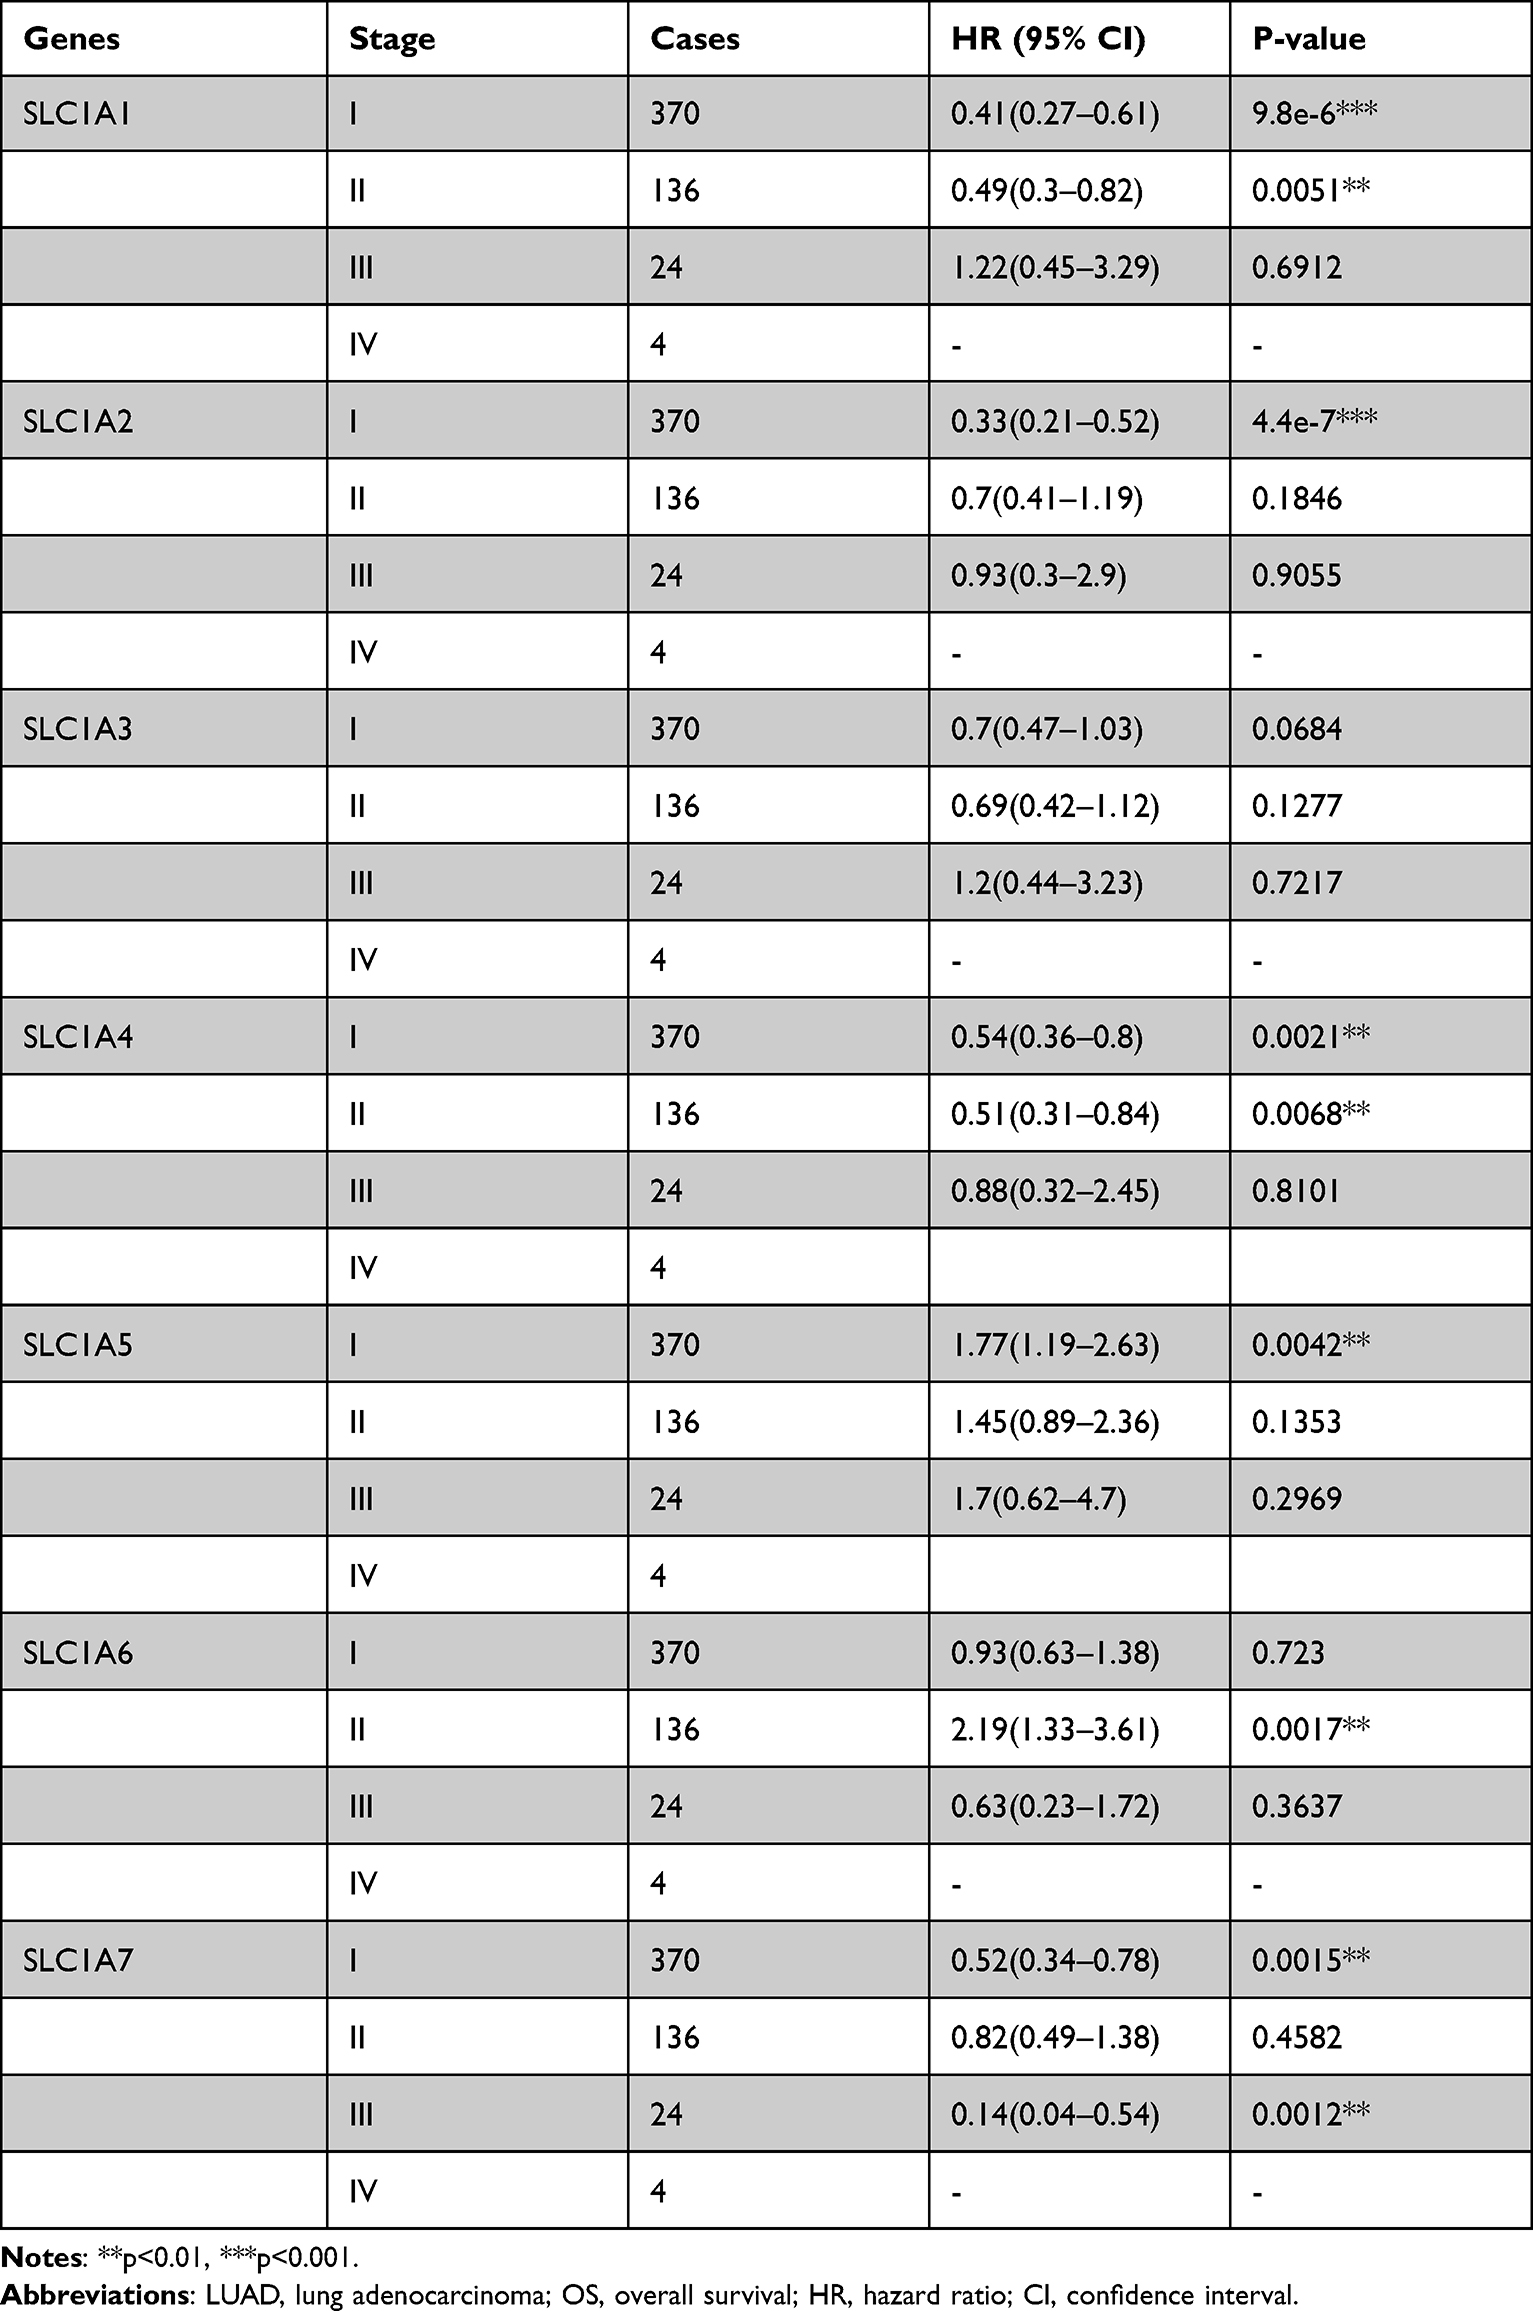 |
Table 3 The Relationship Between SLC1A Family Genes and OS in Different Stages of LUAD Patients |
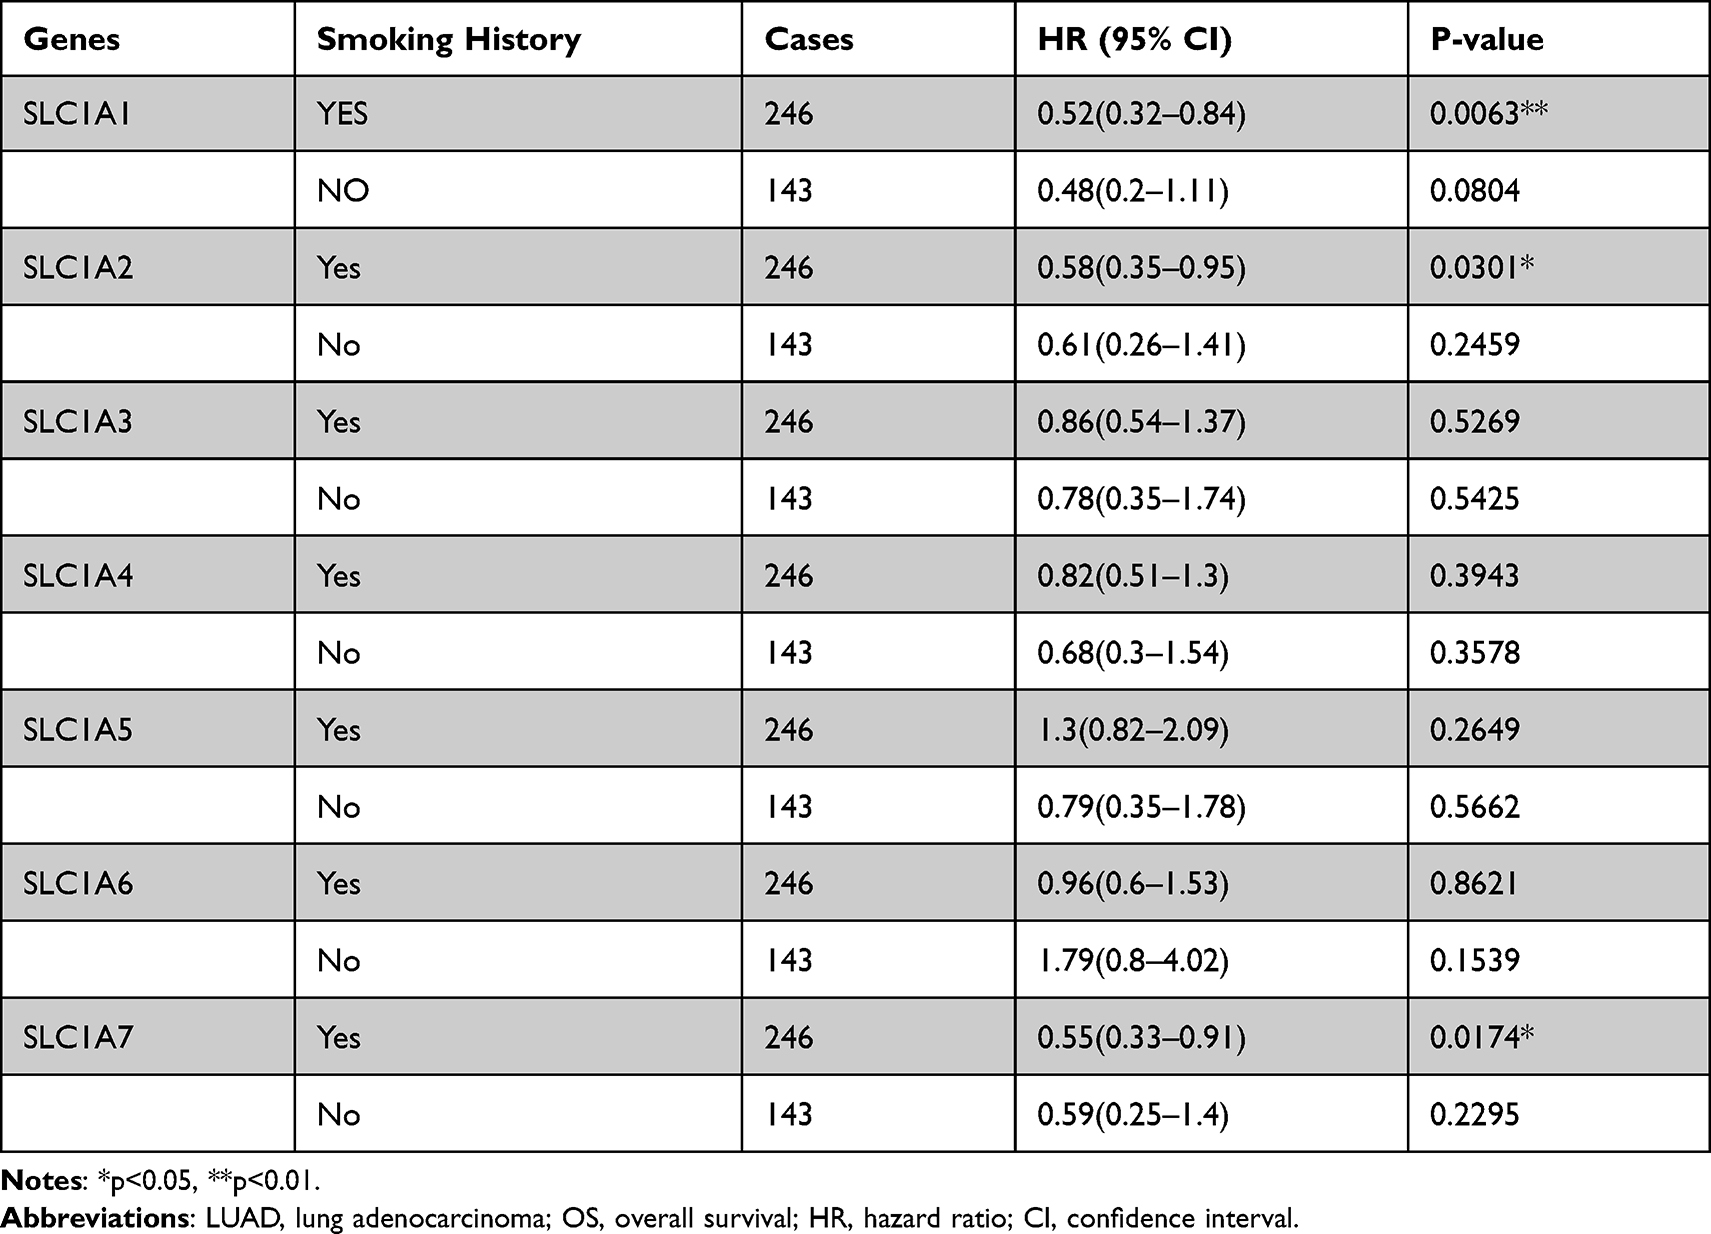 |
Table 4 The Relationship Between SLC1A Family Genes and OS in Different Smoking History of LUAD Patients |
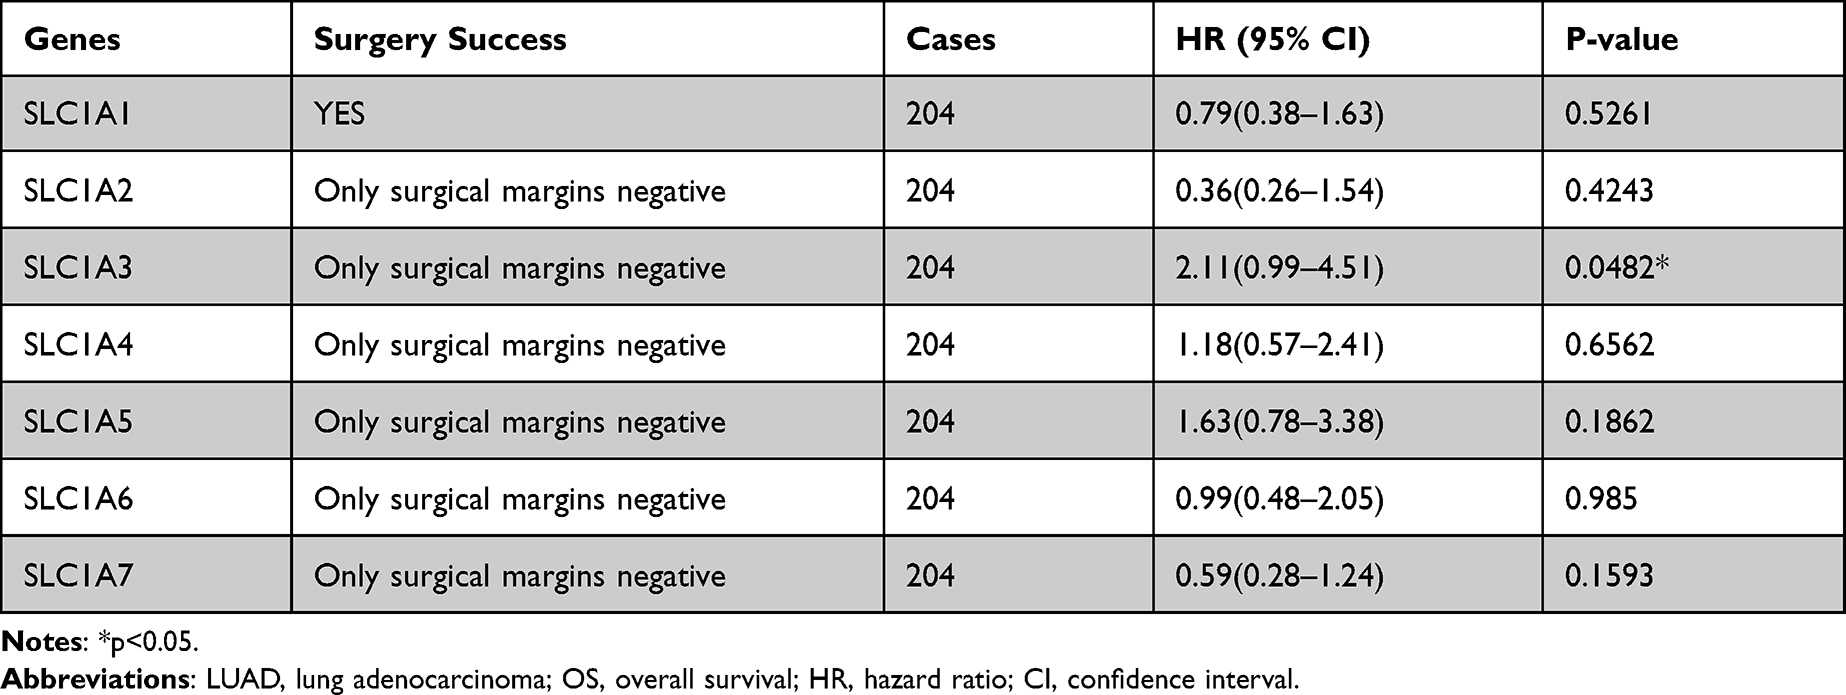 |
Table 5 The Relationship Between SLC1A Family Genes and OS in Surgery Methods of LUAD Patients |
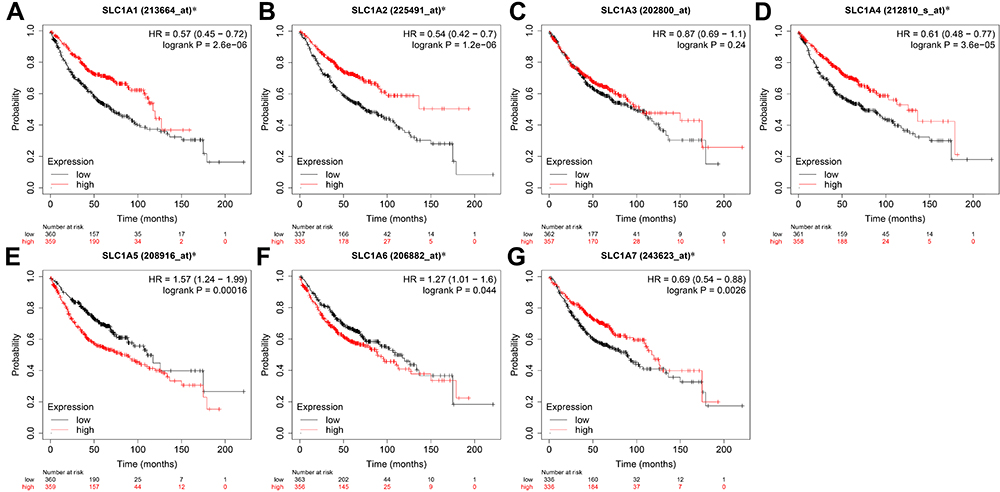 |
Figure 4 The correlation between expression level of SLC1A family genes and overall survival in LUAD patients. Overall survival curves for SLC1A1 (A), SLC1A2 (B), SLC1A3 (C), SLC1A4 (D), SLC1A5 (E), SLC1A6 (F) and SLC1A7 (G) in ESCA patients. *P<0.05 was considered statistically significant. The red line indicates high expression, and the black line indicates low expression. Abbreviation: LUAD, lung adenocarcinoma. |
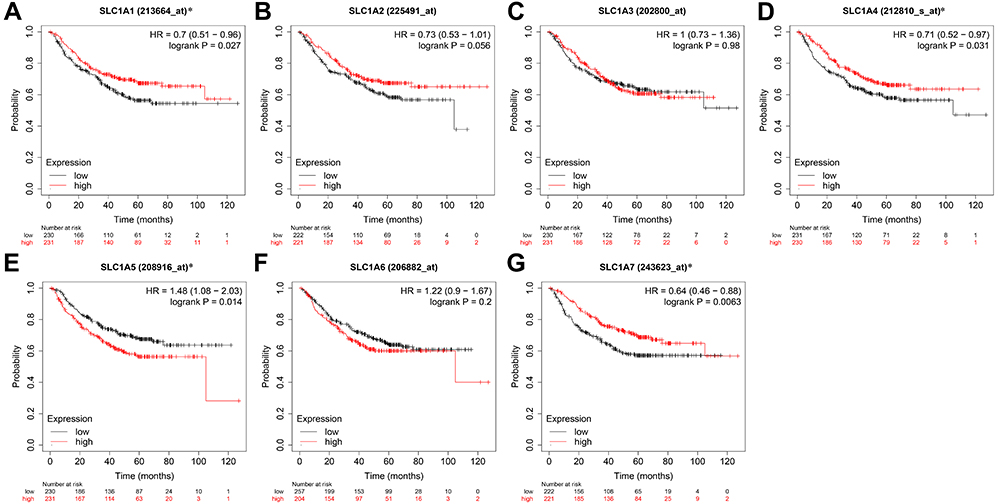 |
Figure 5 The correlation between expression level of SLC1A family genes and first progression survival in LUAD patients. First Progression Survival curves for SLC1A1 (A), SLC1A2 (B), SLC1A3 (C), SLC1A4 (D), SLC1A5 (E), SLC1A6 (F) and SLC1A7 (G) in ESCA patients. *P<0.05 was considered statistically significant. The red line indicates high expression, and the black line indicates low expression. Abbreviation: LUAD, lung adenocarcinoma. |
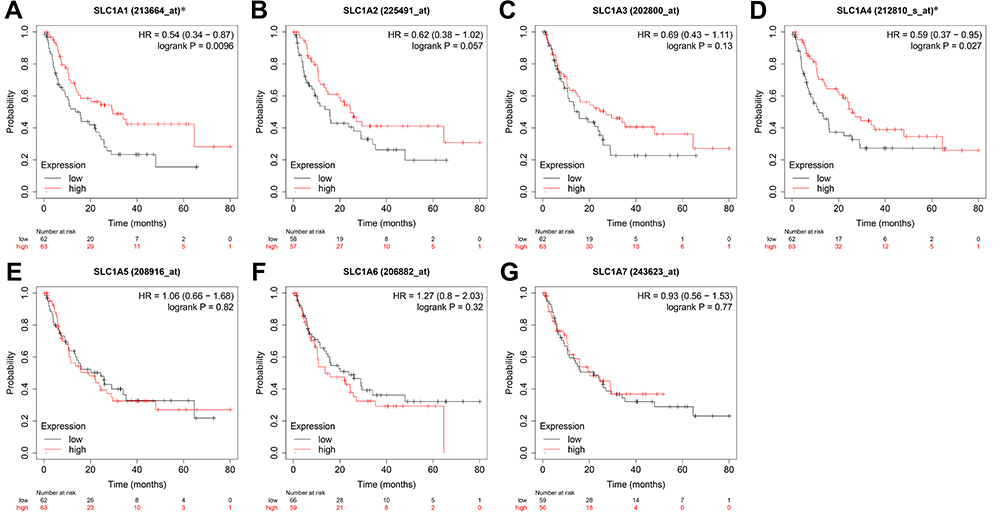 |
Figure 6 The correlation between expression level of SLC1A family genes and PPS in LUAD patients. Post progression survival curves for SLC1A1 (A), SLC1A2 (B), SLC1A3 (C), SLC1A4 (D), SLC1A5 (E), SLC1A6 (F) and SLC1A7 (G) in ESCA patients. *P<0.05 was considered statistically significant. The red line indicates high expression, and the black line indicates low expression. Abbreviation: LUAD, lung adenocarcinoma. |
DNA Methylation of SLC1A Family Genes in LUAD Patients
We analyzed the methylation level of SLC1A family genes promoter according to TCGA-LUAD dataset. It was found that there was no significant promoter methylation level of SLC1A1, SLC1A4 and SLC1A7 between normal and LUAD tissues (Figure 7A, D and G). Compared with normal tissues, the promoter methylation level of SLC1A2 and SLC1A3 in LUAD tissues was significantly higher (Figure 7B and C). And the promoter methylation level of SLC1A5 and SLC1A6 was significantly lower (Figure 7E and F). Using the MEXPRESS database, we discovered that the expression of SLC1A family genes was positively linked with the methylation signal levels of most methylation probe sites in the promoters of SLC1A family genes (Figure S10A-G). This indicated that there may be a potential correlation between the methylation of gene promoter and the expression of SLC1A family genes.
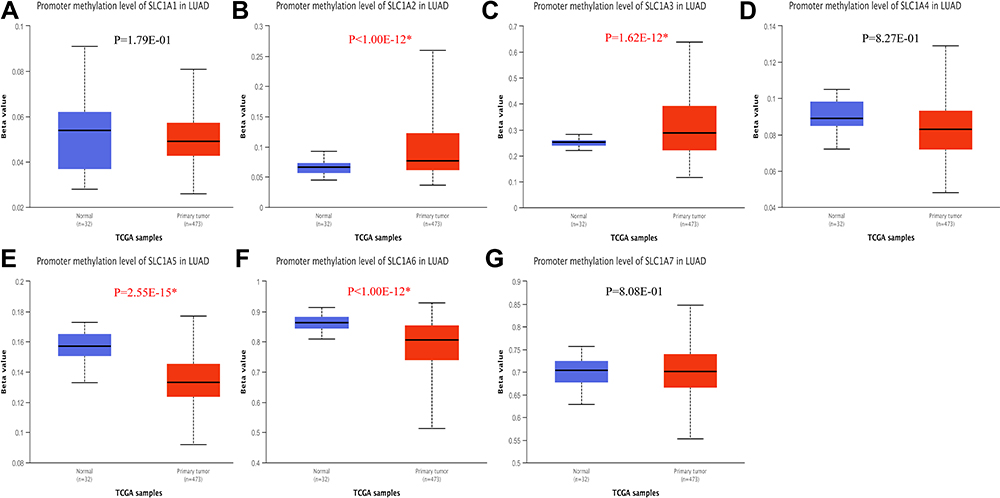 |
Figure 7 The promoter methylation level of SLC1A family members between the normal and primary LUAD. (A) SLC1A1, (B) SLC1A2, (C) SLC1A3, (D) SLC1A4, (E) SLC1A5, (F) SLC1A6 and (G) SLC1A7. *P<0.05 was considered statistically significant. |
Genetic Alteration Differences of SLC1A Family Genes in LUAD Patients
We analyzed the SLC1A family genes alterations and correlations from TCGA-LUAD dataset using c-BioPortal. The chance genes genetic alteration of SLC1A1, SLC1A2, SLC1A3, SLC1A4, SLC1A5, SLC1A6 and SLC1A7 were 6%, 5%, 13%, 5% 5%, 5% and 7%, respectively (Figure 8A). The form of SLC1A family in LUAD includes missense mutation, amplification and so on. However, the genetic alteration of SLC1A family genes had no correlation with the clinical prognosis of LUAD patients. We also used c-BioPortal to calculate the correlations of SLC1A family genes by analyzing their mRNA expression (RNA Seq V2 RSEM) and using Pearson’s correction. The results indicated significant and positive correlations in the following: SLC1A1 with SLC1A2, SLC1A3, SLC1A4 and SLC1A7; SLC1A2 with SLC1A3, SLC1A4 and SLC1A7; SLC1A3 with SLC1A4, SLC1A6 and SLC1A7; SLC1A4 with SLC1A5 and SLC1A6; SLC1A5 with SLC1A6. The results indicated significant and negative correlations in the following: SLC1A1 and SLC1A2 with SLC1A5 and SLC1A6, respectively; SLC1A3 with SLC1A5; SLC1A4, SLC1A5 and SLC1A6 with SLC1A7, respectively (Figure 8B).
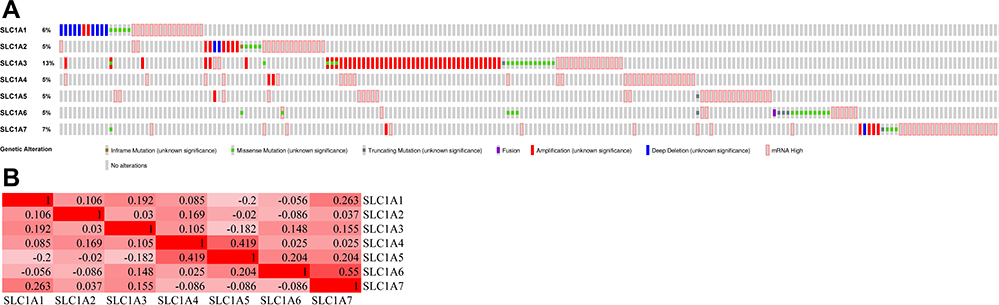 |
Figure 8 Genetic alteration of SLC1A family members in LUAD. (A) Oncoprint in c-BioPortal showed the distribution and proportion of samples with alterations in SLC1A family genes. (B) Correction between different SLC1A family genes in LUAD. Color depth represents Spearman correlation coefficients calculated by c-BioPortal. Abbreviation: LUAD, lung adenocarcinoma. |
Immune Infiltrates in Correlation with SLC1A Family Genes in LUAD
Consequently, we evaluated the correlation between the expression of SLC1A family genes and the level of immune infiltration. As shown in Figure 9, the expression of SLC1A1, SLC1A3, SLC1A4, SLC1A6 and SLC1A7 were negatively correlated with tumor purity. SLC1A1 was positively correlated with CD8+ T cells, CD4+ T cells, macrophages, neutrophils and dendritic cells. There is also has a positive correlation between SLC1A2 with B cells, CD4+ T cells and dendritic cells. For SLC1A3, the results showed a significant positive correlation with B cells, CD8+ T cells, CD4+ T cells, macrophages, neutrophils and dendritic cells. SLC1A4 was positively correlated with the infiltrating levels of B cells, CD4+ T cells and dendritic cells. Conversely, SLC1A5 was negatively correlated with macrophages, neutrophils and dendritic cells. We observed a weak correlation between SLC1A6 and neutrophils. Furthermore, SLC1A7 has significant positive correlations with B cells, CD4+ T cells, macrophages and dendritic cells. All the above results showed that SLC1A family genes could affect immune infiltration in LUAD.
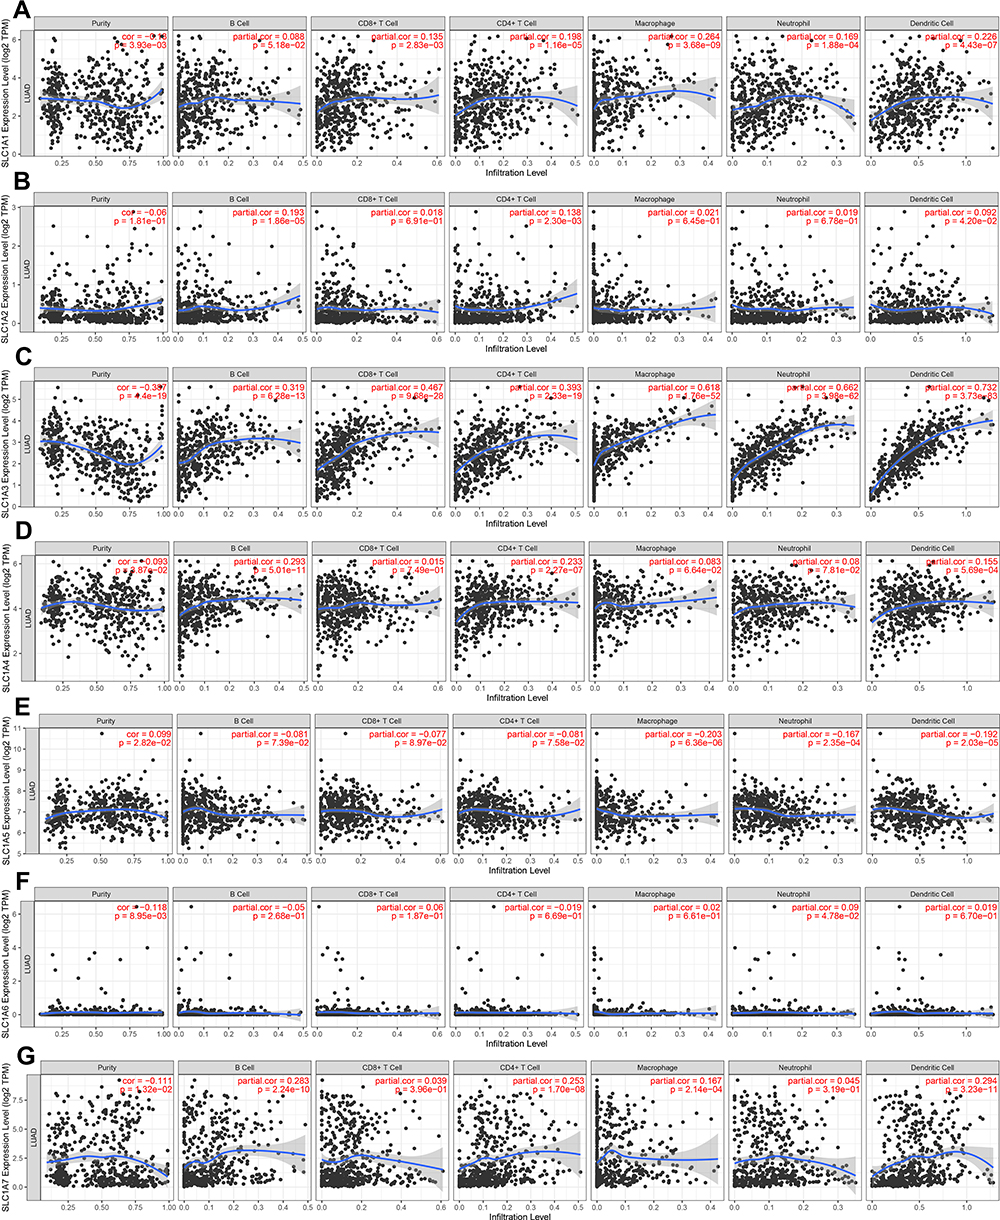 |
Figure 9 The correlation between SLC1A family members and immune infiltration. The expression level of SLC1A1 (A), SLC1A2 (B), SLC1A3 (C), SLC1A4 (D), SLC1A5 (E), SLC1A6 (F) and SLC1A7 (G) was associated with immune cell infiltration. |
Correlation and Functional Enrichment Analysis of SLC1A Family Genes
In this study, we used GeneMANIA to construct a network map of SLC1As and their 20 related genes. Different colored lines in the network map represent different modes of action, including physical interactions, co-expression, predicted, co-location, genetic interactions, pathway, and shared protein domains (Figure 10A). SLC1As and their related genes were introduced into DAVID for enrichment analysis. These genes were found to be involved in 9 different cell components, including integral component of membrane, plasma membrane, membrane, extracellular exosome, integral component of plasma membrane, endoplasmic reticulum membrane, golgi apparatus, cell surface, melanosome, were significantly associated with SLC1As (Figure 10B). Biological processes, including ion transport, L-glutamate transport, glutamine transport, glutamate secretion, amino acid transport, chemical synaptic transmission, D-aspartate import, were remarkably regulated by the SLC1As in cancers (Figure 10C). These genes mainly participated in the regulation of 8 molecular functions, such as amino acid transmembrane transporter activity, glutamate sodium symporter activity, and glutamate binding (Figure 10D). KEGG pathway enrichment analysis showed that these genes were mainly enriched in 2 pathways, Glutamatergic synapse, and Protein digestion and absorption (Figure 10E).
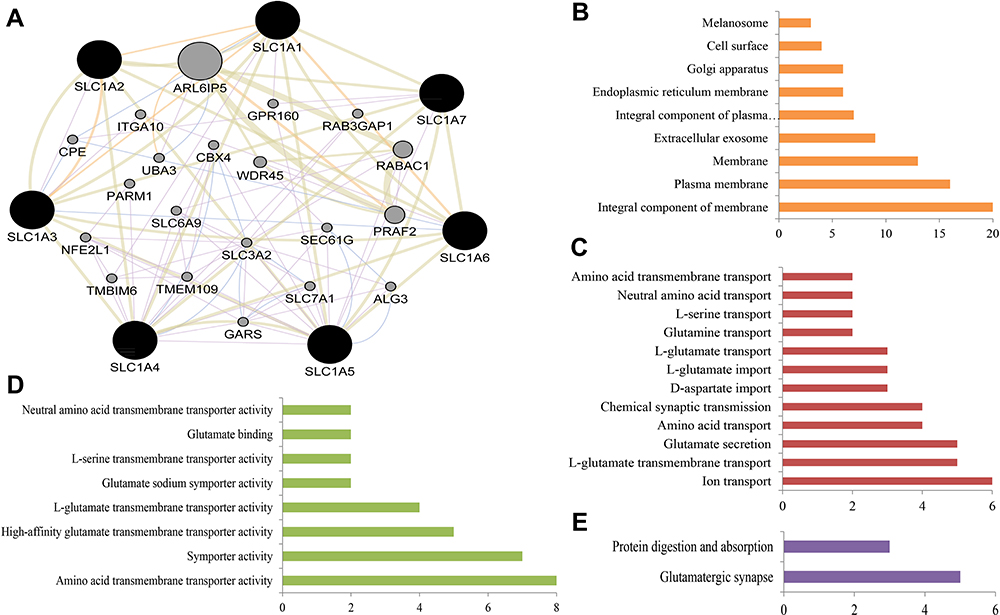 |
Figure 10 Functional enrichment analysis of SLC1A family related genes. (A) Network of SLC1A family members and its 20 related genes was analyzed by GeneMANIA. (B) Cellular component; (C) Biological processes; (D) Molecular functions; (E) KEGG pathway analysis. P<0.01 is regarded as statistically significant. |
Discussion
Lung cancer is the most common cancer, with about 1,700,000 new cases every year.28 LUAD is continuously growing in the proportion of lung cancer, which is presently the top diagnosed histological type in both males and females.29 The overall outcomes for advanced stage LUAD are still poor.30 As a result, it’s worth looking into new prognostic biomarkers and therapeutic targets for LUAD lesions.
Abnormal intracellular energy metabolism is one of the characteristic changes of tumor cells.31,32 Glutamine is one of the important energy sources of malignant tumor cells, which provides carbon and nitrogen sources for the rapid proliferation of tumors.33 A series of amino acid transporters are required to transport hydrophilic glutamine from extracellular to intracellular and different members of the solute carrier transporter family can recognize and transport it. SLC1A family genes are belong to the transporter family, which were abnormally expressed and involved in carcinoma-associated molecular mechanisms in various tumors. Nevertheless, the expression and role of each SLC1A family genes have not yet been comprehensively elucidated in LUAD. In this study, we systemically analyzed the expression, prognostic role, DNA methylation, genetic alteration, immune infiltrates, and biological function of SLC1A family genes in LUAD through a variety of bioinformatics tools.
The studies of SLC1A1 have widely participated in neuropsychiatric disorders.34,35 The article showed that the expression of SLC1A1 in clear cell renal cell carcinoma tissues significantly increased than normal kidney tissues, and was higher in males than females.36 Bianchi et al, reported that high-expressed SLC1A1 was associated with the differentiation of glioma cells.37 Fan’s study suggests that SLC1A1 may be involved in the occurrence and development of osteosarcoma by bioinformatics analysis.38 The expression and glutamate transporter activity of SLC1A1 were altered in SN38-resistant colorectal cancer cells.39 A recent report believed that lower expression of SLC1A1 was significantly positively correlated with infiltrating levels of CD8+T cells and dendritic cells. Meanwhile, SLC1A1 has clinical diagnostic value for colorectal cancer.40 In our results, lower-expressed SLC1A1 in LUAD cancer tissues was correlated with tumor stages, race, gender, smoking, tumor histological subtypes, nodal metastasis status and showed poorer overall survival in LUAD. SLC1A2 is important for the nervous system function.41 Few studies explored the relation between SLC1A2 and cancer. SLC1A3 is primarily expressed in the cerebellum and cerebral neocortex, and its abnormal expression has been linked to neurological disorders like Alzheimer’s disease,42 and episodic ataxia.43 However, research revealed that SLC1A3 has also related to tumor metabolism and progression.44 Recent research suggests that SLC1A3 promotes gastric cancer progression via the PI3K/AKT signaling pathway.8 Sun et al, believed that overexpressed SLC1A3 contributed to L-asparaginase resistance in solid tumors.45 Previous studies demonstrated that high expression of SLC1A3 in glioblastoma,46 chondrosarcoma,47 thyroid cancer.48 Nevertheless, there was no significant difference in the expression of SLC1A3 between LUAD tissues and control normal tissues in our study. As a Na-dependent amino acid transporter, SLC1A4 has been characterized in early neuronal development and diseases. However, more and more studies focused on its role in cancer in recent years. Morozova et al, found that SLC1A4 was overexpressed in neuroblastoma tumor-initiating cells, and might constitute a therapeutic target for this cancer.49 In Hepatocellular Carcinoma (HCC), the mRNA and protein expression of SLC1A4 were upregulated, and that could be a novel prognostic marker and promising immunotherapeutic targets of HCC.9 White et al, demonstrated that SLC1A4 and SLC1A5 might be regulated by androgen receptor (AR), Myc and mechanistic target of rapamycin complex 1 (mTOR) and was high-expressed in prostate cancer. Our results showed the mRNA and protein levels of SLC1A4 were also significantly elevated in LUAD, and were associated with a poor prognosis. SLC1A5 is known to be critical for tumor growth and proliferation across many cancer subtypes.50 Numerous studies showed that SLC1A5 is involved in the genesis and progress of various malignancies including lung cancer. SLC1A5 was upregulated in non-small cell lung cancer and associated with lymph node metastasis,51 and could promote cancer cell proliferation via activating mTOR signaling,52 and impair apoptotic cell death.53 Consistent with these studies, our results demonstrated that higher expression of SLC1A5 was correlated with tumor stages, race, gender, smoking, tumor histological subtypes, nodal metastasis status in LUAD. The reports found that SLC1A6 expression was upregulated in nasopharyngeal carcinoma cells and decreased cisplatin sensitivity.15 The potential roles of SLC1A7 in tumor are not well documented so far. Our results elucidated that the expression of SLC1A6 and SLC1A7 were down-regulated and up-regulated in LUAD, respectively.
SLC1A family is thought to involve in tumor progression via regulating microenvironments and multiple pathways.3–8,39,45,54 To explore the potential mechanism of SLC1A family members in LUAD, we used various bioinformatics software for analysis. We deduced missense mutation and amplification is the frequent form in SLC1A family genes genetic alteration, and the genetic alteration frequency was not higher than 7%, which suggested that might be associated with the pathogenesis of LUAD. Clinically relevant genomic alterations were identified in LUAD patients.55 The landscape of genetic alterations found in squamous cell lung cancer, the difficulties in identifying and treating these alterations could facilitate targeted therapy.56 It showed that the occurrence and pathogenesis of lung cancer are closely linked to the issues of genetic mutation. Previous studies have also demonstrated the important role of SLC1A1, SLC1A4 and SLC1A5 in tumor microenvironment and immune response. SLC1A1 regulates impaired T-cell immunity and beneficial for immunotherapy of natural-killer T-cell lymphoma.57 SLC1A4 was identified as lymphocyte phosphatase-associated phosphoprotein partners that were involved in human lymphocyte activation.58 SLC1A5 attenuated inflammatory T cell responses through activate mTORC1 signaling.59 SLC1A5 expression correlated highly with tumor immune-cell infiltration in hepatocellular carcinoma.60 SLC1A5 reflected the status of the tumor immune microenvironment in gastric cancer.61 These findings revealed that SLC1A family genes had an impact on immune infiltration, and varying levels of genetic alteration in LUAD. This study was a pioneer work to a comprehensive analysis of the expression and major role of SLC1A family genes in LUAD based on bioinformatics analysis, but the main limitations of our research should be noted. More sample sizes, protein expression, clinical and basic experimental data are needed to verify the biological significance of SLC1A family genes in LUAD in the future study.
Conclusion
The expression of SLC1A family genes was associated with the clinicopathological features. Besides, SLC1A family genes have prognostic value for LUAD patients and are associated with the immune infiltrates. The findings suggested that members of the SLC1A family could be a promising target for the development of LUAD therapeutics as well as a reliable predictor of LUAD prognosis.
Ethics Approval and Consent to Participate
Because all data sources were from public databases, Ethics Committee of Affiliated Hospital of North Sichuan Medical College waived the requirement for an ethics statement.
Acknowledgments
This work was supported by the Applied Basic Research Program of Sichuan Province (grant no. 2021YJ0202), Scientific Research Project of Sichuan Medical Association (grant no. S20048), the Science and Technology Support Program of Nanchong (grant nos. 20YFZJ0113 and 19SXHZ0244), and the Development of Scientific Research Plan of North Sichuan Medical College (grant no. 2020ZD022).
Disclosure
The authors declare no conflicts of interest, financial or otherwise.
References
1. Herbst RS, Heymach JV, Lippman SM. Lung cancer. N Engl J Med. 2008;359:1367–1380. doi:10.1056/NEJMra0802714
2. Siegel RL, Miller KD, Jemal A. Cancer statistics, 2017. CA Cancer J Clin. 2017;67(1):7–30. doi:10.3322/caac.21387
3. Freidman N, Chen I, Wu Q, et al. Amino acid transporters and exchangers from the SLC1A family: structure, mechanism and roles in physiology and cancer. Neurochem Res. 2020;45(6):1268–1286. doi:10.1007/s11064-019-02934-x
4. Guo W, Li K, Sun B, et al. Dysregulated glutamate transporter SLC1A1 propels cystine uptake via xc − for glutathione synthesis in lung cancer. Cancer Res. 2021;81(3):552–566. doi:10.1158/0008-5472.CAN-20-0617
5. Ye ZC, Rothstein JD, Sontheimer H. Compromised glutamate transport in human glioma cells: reduction-mislocalization of sodium-dependent glutamate transporters and enhanced activity of cystine-glutamate exchange. J Neurosci. 1999;19(24):10767–10777. doi:10.1523/JNEUROSCI.19-24-10767.1999
6. de Groot JF, Liu TJ, Fuller G, Yung WK. The excitatory amino acid transporter-2 induces apoptosis and decreases glioma growth in vitro and in vivo. Cancer Res. 2005;65(5):1934–1940. doi:10.1158/0008-5472.CAN-04-3626
7. Tao J, Deng NT, Ramnarayanan K, et al. CD44-SLC1A2 gene fusions in gastric cancer. Sci Transl Med. 2011;3(77):77ra30. doi:10.1126/scitranslmed.3001423
8. Xu L, Chen J, Jia L, et al. SLC1A3 promotes gastric cancer progression via the PI3K/AKT signalling pathway. J Cell Mol Med. 2020;24(24):14392–14404. doi:10.1111/jcmm.16060
9. Peng X, Chen R, Cai S, Lu S, Zhang Y. SLC1A4: a powerful prognostic marker and promising therapeutic target for HCC. Front Oncol. 2021;11:650355. doi:10.3389/fonc.2021.650355
10. Kim S, Kim DH, Jung WH, Koo JS. Expression of glutamine metabolism-related proteins according to molecular subtype of breast cancer. Endocr Relat Cancer. 2013;20:339–348. doi:10.1530/ERC-12-0398
11. Marshall AD, van Geldermalsen M, Otte NJ, et al. ASCT2 regulates glutamine uptake and cell growth in endometrial carcinoma. Oncogenesis. 2017;6(7):e367. doi:10.1038/oncsis.2017.70
12. Lin J, Yang T, Peng Z, et al. SLC1A5 silencing inhibits esophageal cancer growth via cell cycle arrest and apoptosis. Cell Physiol Biochem. 2018;48(1):397. doi:10.1159/000491769
13. Wang Q, Hardie RA, Hoy AJ, et al. Targeting ASCT2-mediated glutamine uptake blocks prostate cancer growth and tumour development. J Pathol. 2015;236:278–289. doi:10.1002/path.4518
14. Jian LM, Zhenhua Tao C, Gao S, et al. Effects of targeting SLC1A5 on inhibiting gastric cancer growth and tumor development in vitro and in vivo. oncotarget. 2017;8(44):76458–76467. doi:10.18632/oncotarget.19479
15. Hao W, Wu L, Cao L, et al. Radioresistant nasopharyngeal carcinoma cells exhibited decreased cisplatin sensitivity by inducing SLC1A6 expression. Front Pharmacol. 2021;12:629264. doi:10.3389/fphar.2021.629264
16. Rhodes DR, Shankerz JY,K, Deshpandez N, et al. ONCOMINE: a cancer microarray database and integrated data-mining platform1. Neoplasia. 2004;6:1–6.
17. Chandrashekar DS, Bashel B, Balasubramanya SAH, et al. UALCAN: a portal for facilitating tumor subgroup gene expression and survival analyses. Neoplasia. 2017;19(8):649–658. doi:10.1016/j.neo.2017.05.002
18. Cancer Genome Atlas, N. Comprehensive molecular portraits of human breast tumours. Nature. 2012;490:61–70. doi:10.1038/nature11412
19. Thul PJ, Åkesson L, Wiking M, et al. A subcellular map of the human proteome. Science. 2017;356(6340). doi:10.1126/science.aal3321
20. Nagy A, Lanczky A, Menyhart O, Gyorffy B. Validation of miRNA prognostic power in hepatocellular carcinoma using expression data of independent datasets. Sci Rep. 2018;8:9227. doi:10.1038/s41598-018-27521-y
21. Koch A, De meyer T, Jeschke J, Van Criekinge W. MEXPRESS: visualizing expression, DNA methylation and clinical TCGA data. BMC Genomics. 2015;16(1). doi:10.1186/s12864-015-1847-z
22. Koch A, Van Criekinge JJ. MEXPRESS update 2019. Nucleic Acids Res. 2019;47(W1):W561–W565. doi:10.1093/nar/gkz445
23. Gao J, Aksoy BA, Dogrusoz U, et al. Integrative analysis of complex cancer genomics and clinical profiles using the cBioPortal. Sci Signal. 2013;6(269):pl1. doi:10.1126/scisignal.2004088
24. Liu T, Fu J, Zeng Z, et al. TIMER2.0 for analysis of tumor-infiltrating immune cells. Nucleic Acids Res. 2020;48(W1):W509–W514. doi:10.1093/nar/gkaa407
25. Warde-Farley D, Donaldson SL, Comes O, et al. The GeneMANIA prediction server: biological network integration for gene prioritization and predicting gene function. Nucleic Acids Res. 2010;38(suppl_2):W214–W220. doi:10.1093/nar/gkq537
26. Frédéric Biemar MF. Global progress against cancer—challenges and opportunities. Cancer Biol Med. 2013;10(4):183–186. doi:10.7497/j.issn.2095-3941.2013.04.001
27. da Huang W,SB, Lempicki RA. Systematic and integrative analysis of large gene lists using DAVID bioinformatics resources. Nat Protoc. 2009;4(1):44–57. doi:10.1038/nprot.2008.211
28. Bray F, Ferlay J, Soerjomataram I, et al. Global cancer statistics 2018: GLOBOCAN estimates of incidence and mortality worldwide for 36 cancers in 185 countries. CA Cancer J Clin. 2018;68(6):394–424. doi:10.3322/caac.21492
29. Meza R, Meernik C, Jeon J, Cote ML. Lung cancer incidence trends by gender, race and histology in the United States, 1973-2010. PLoS One. 2015;10:e0121323. doi:10.1371/journal.pone.0121323
30. Doroshow DB, Herbst RS. Treatment of advanced non-small cell lung cancer in 2018. JAMA Oncol. 2018;4:569–570. doi:10.1001/jamaoncol.2017.5190
31. Coller HA. Is cancer a metabolic disease? Am J Pathol. 2014;184(1):4–17. doi:10.1016/j.ajpath.2013.07.035
32. Hanahan D, Weinberg RA. Hallmarks of cancer: the next generation. Cell. 2011;144:646–674. doi:10.1016/j.cell.2011.02.013
33. Altman BJ, Stine ZE, Dang CV. From Krebs to clinic: glutamine metabolism to cancer therapy. Nat Rev Cancer. 2016;16:749. doi:10.1038/nrc.2016.114
34. Abdolhosseinzadeh S, Sina M, Ahmadiani A, Asadi S, Shams J. Genetic and pharmacogenetic study of glutamate transporter (SLC1A1) in Iranian patients with obsessive-compulsive disorder. J Clin Pharm Ther. 2019;44(1):39–48. doi:10.1111/jcpt.12766
35. Delgado-Acevedo C, Estay SF, Radke AK, et al. Behavioral and synaptic alterations relevant to obsessive-compulsive disorder in mice with increased EAAT3 expression. Neuropsychopharmacology. 2019;44(6):1163–1173. doi:10.1038/s41386-018-0302-7
36. Ergun S, Gunes S, Buyukalpelli R, Aydin O. Glutamate transporter SLC1A1 is associated with clear cell renal cell carcinoma. Turk J Med Sci. 2019;49:531–537. doi:10.3906/sag-1808-130
37. Bianchi MG, Gazzola GC, Tognazzi L, Bussolati O. C6 glioma cells differentiated by retinoic acid overexpress the glutamate transporter excitatory amino acid carrier 1 (EAAC1). Neuroscience. 2008;151(4):1042–1052. doi:10.1016/j.neuroscience.2007.11.055
38. Fan H, Lu S, Wang S, Zhang S. Identification of critical genes associated with human osteosarcoma metastasis based on integrated gene expression profiling. Mol Med Rep. 2019;20(2):915–930. doi:10.3892/mmr.2019.10323
39. Pedraz-Cuesta E, Christensen S, Jensen AA, et al. The glutamate transport inhibitor DL-Threo-beta-Benzyloxyaspartic acid (DL-TBOA) differentially affects SN38- and oxaliplatin-induced death of drug-resistant colorectal cancer cells. BMC Cancer. 2015;15:411. doi:10.1186/s12885-015-1405-8
40. Zhou J, Xie Z, Cui P, et al. SLC1A1, SLC16A9, and CNTN3 are potential biomarkers for the occurrence of colorectal cancer. Biomed Res Int. 2020;2020:1204605. doi:10.1155/2020/1204605
41. Zhou Y, Waanders LF, Holmseth S, et al. Proteome analysis and conditional deletion of the EAAT2 glutamate transporter provide evidence against a role of EAAT2 in pancreatic insulin secretion in mice. J Biol Chem. 2014;289(3):1329–1344. doi:10.1074/jbc.M113.529065
42. Scott HL, Pow DV, Tannenberg AE, Dodd PR. Aberrant expression of the glutamate transporter excitatory amino acid transporter 1 (EAAT1) in Alzheimer’s disease. J Neurosci. 2002;22:RC206. doi:10.1523/JNEUROSCI.22-03-j0004.2002
43. Jen JC, Wan J, Palos TP, Howard BD, Baloh RW. Mutation in the glutamate transporter EAAT1 causes episodic ataxia, hemiplegia, and seizures. Neurology. 2005;65(4):529–534. doi:10.1212/01.wnl.0000172638.58172.5a
44. Tajan M, Hock AK, Blagih J, et al. A role for p53 in the adaptation to glutamine starvation through the expression of SLC1A3. Cell Metab. 2018;28(5):721–736.e726. doi:10.1016/j.cmet.2018.07.005
45. Sun J, Nagel R, Zaal EA, et al. SLC 1A3 contributes to L-asparaginase resistance in solid tumors. EMBO J. 2019;38:e102147. doi:10.15252/embj.2019102147
46. Corbetta C, Di Ianni N, Bruzzone MG, et al. Altered function of the glutamate-aspartate transporter GLAST, a potential therapeutic target in glioblastoma. Int J Cancer. 2019;144:2539–2554. doi:10.1002/ijc.31985
47. He L, Shi X, Liu Z, et al. Roles of EAAT1, DHFR, and fetuin-A in the pathogenesis, progression and prognosis of chondrosarcoma. Onco Targets Ther. 2019;12:8411–8420. doi:10.2147/OTT.S222426
48. Wang C, Wang Z, Liu W, Ai Z. CD133 promotes the self-renewal capacity of thyroid cancer stem cells through activation of glutamate aspartate transporter SLC1A3 expression. Biochem Biophys Res Commun. 2019;511(1):87–91. doi:10.1016/j.bbrc.2019.02.023
49. Morozova O, Vojvodic M, Grinshtein N, et al. System-level analysis of neuroblastoma tumor-initiating cells implicates AURKB as a novel drug target for neuroblastoma. Clin Cancer Res. 2010;16(18):4572–4582. doi:10.1158/1078-0432.CCR-10-0627
50. Scalise M, Pochini L, Console L, Losso MA, Indiveri C. The human SLC1A5 (ASCT2) amino acid transporter: from function to structure and role in cell biology. Front Cell Dev Biol. 2018;6:96. doi:10.3389/fcell.2018.00096
51. Csanadi A, Oser A, Aumann K, et al. Overexpression of SLC1a5 in lymph node metastases outperforms assessment in the primary as a negative prognosticator in non-small cell lung cancer. Pathology. 2018;50(3):269–275. doi:10.1016/j.pathol.2017.10.016
52. Hassanein M, Hoeksema MD, Shiota M, et al. SLC1A5 mediates glutamine transport required for lung cancer cell growth and survival. Clin Cancer Res. 2013;19(3):560–570. doi:10.1158/1078-0432.CCR-12-2334
53. Hassanein M, Qian J, Hoeksema MD, et al. Targeting SLC1a5-mediated glutamine dependence in non-small cell lung cancer. Int J Cancer. 2015;137(7):1587–1597. doi:10.1002/ijc.29535
54. Fu S, Li Z, Xiao L, et al. Glutamine synthetase promotes radiation resistance via facilitating nucleotide metabolism and subsequent DNA damage repair. Cell Rep. 2019;28(5):1136–1143 e1134. doi:10.1016/j.celrep.2019.07.002
55. Liu L, Liu J, Shao D, et al. Comprehensive genomic profiling of lung cancer using a validated panel to explore therapeutic targets in East Asian patients. Cancer Sci. 2017;108(12):2487–2494. doi:10.1111/cas.13410
56. Friedlaender A, Banna G, Malapelle U, Pisapia P, Addeo A. Next generation sequencing and genetic alterations in squamous cell lung carcinoma: where are we today? Front Oncol. 2019;9:166. doi:10.3389/fonc.2019.00166
57. Xiong J, Wang N, Zhong H-J, et al. SLC1A1 mediated glutamine addiction and contributed to natural killer T-cell lymphoma progression with immunotherapeutic potential. EBioMedicine. 2021;72:103614. doi:10.1016/j.ebiom.2021.103614
58. Kruglova NA, Kopylov AT, Filatov AV, et al. Filatov identification of the molecular partners of lymphocyte phosphatase-associated phosphoprotein (LPAP) that are involved in human lymphocyte activation. Mol Biol. 2019;53(5):838–848. doi:10.1134/S0026898419050112
59. Nakaya M, Xiao Y, Zhou X, et al. Inflammatory T cell responses rely on amino acid transporter ASCT2 facilitation of glutamine uptake and mTORC1 kinase activation. Immunity. 2014;40(5):692–705. doi:10.1016/j.immuni.2014.04.007
60. Zhao J, Yang Z, Tu M, et al. Correlation between prognostic biomarker SLC1A5 and immune infiltrates in various types of cancers including hepatocellular carcinoma. Front Oncol. 2021;11:608641. doi:10.3389/fonc.2021.608641
61. Wang F, Chen C, Chen WP, Li ZL, Cheng H. Development and validation of a novel ferroptosis-related gene signature for predicting prognosis and the immune microenvironment in gastric cancer. Biomed Res Int. 2021;2021:6014202. doi:10.1155/2021/6014202
 © 2022 The Author(s). This work is published and licensed by Dove Medical Press Limited. The full terms of this license are available at https://www.dovepress.com/terms.php and incorporate the Creative Commons Attribution - Non Commercial (unported, v3.0) License.
By accessing the work you hereby accept the Terms. Non-commercial uses of the work are permitted without any further permission from Dove Medical Press Limited, provided the work is properly attributed. For permission for commercial use of this work, please see paragraphs 4.2 and 5 of our Terms.
© 2022 The Author(s). This work is published and licensed by Dove Medical Press Limited. The full terms of this license are available at https://www.dovepress.com/terms.php and incorporate the Creative Commons Attribution - Non Commercial (unported, v3.0) License.
By accessing the work you hereby accept the Terms. Non-commercial uses of the work are permitted without any further permission from Dove Medical Press Limited, provided the work is properly attributed. For permission for commercial use of this work, please see paragraphs 4.2 and 5 of our Terms.