")
Back to Journals » Journal of Inflammation Research » Volume 16
Comprehensive Analysis of NABP2 as a Prognostic Biomarker and Its Correlation with Immune Infiltration in Hepatocellular Carcinoma
Authors Li B , Liu J, Xu L, Xu Q, Liu Z, Liu T
Received 14 January 2023
Accepted for publication 12 April 2023
Published 21 April 2023 Volume 2023:16 Pages 1783—1804
DOI https://doi.org/10.2147/JIR.S403370
Checked for plagiarism Yes
Review by Single anonymous peer review
Peer reviewer comments 3
Editor who approved publication: Dr Adam D Bachstetter
Bowen Li,* Jinghang Liu,* Liangzhi Xu, Qi Xu, Zhaohui Liu, Tiande Liu
Department of General Surgery, Second Affiliated Hospital of Nanchang University, Nanchang, Jiangxi Province, 330000, People’s Republic of China
*These authors contributed equally to this work
Correspondence: Tiande Liu, Departments of General Surgery, Second Affiliated Hospital of Nanchang University, Nanchang, Jiangxi Province, 330000, People’s Republic of China, Tel +8613479101447, Email [email protected]
Background: The DNA binding protein NABP2 (nucleic acid binding protein 2) is a member of the SSB (single-stranded DNA-binding) protein family, which is involved in DNA damage repair. Its prognostic significance and relationship with immune infiltration in hepatocellular carcinoma (HCC), however, remain unknown.
Methods: The purpose of this study was to estimate the prognostic value of NABP2 and to investigate its possible immune function in HCC. By applying multiple bioinformatics methods, we gathered and analysed data from The Cancer Genome Atlas (TCGA), Cancer Cell Lineage Encyclopedia (CCLE), and Gene Expression Omnibus (GEO) to investigate the potential oncogenic and cancer-promoting role of NABP2, including the differential expression, prognostic value, immune cell infiltration association, and drug sensitivity of NABP2 in HCC. Immunohistochemistry and Western blotting were used to validate the expression of NABP2 in HCC. The knockdown of NABP2 expression by siRNA was further used to validate its role in hepatocellular carcinoma.
Results: Our findings indicated that NABP2 was overexpressed in HCC samples and was related to poor survival, clinical stage, and tumour grade in HCC patients. Analysis of functional enrichment indicated that NABP2 was potentially involved in the cell cycle, DNA replication, G2M checkpoint, E2F targets, apoptosis, P53 signalling, TGFA signalling via NF-κB, and so on. NABP2 was shown to be significantly linked to immune cell infiltration and immunological checkpoints in HCC. Analyses of drug sensitivity predict a number of drugs that could potentially be used to target NABP2. Moreover, in vitro experiments verified the promoting effect of NABP2 on the migration and proliferation of hepatocellular carcinoma cells.
Conclusion: Based on these findings, NABP2 appears to be a candidate biomarker for HCC prognosis and immunotherapy.
Keywords: bioinformatics analysis, NABP2, hepatocellular carcinoma, prognostic value, immune infiltration
Introduction
Primary liver cancer is a highly malignant tumour that has posed a serious threat to human health for a long time. According to some research statistics, it ranks sixth in the incidence of liver cancer and third in the mortality of liver cancer.1 Hepatocellular carcinoma (HCC), which is also referred to as LIHC (liver hepatocellular carcinoma), accounts for 90% of cases.2–4 The most important and common cause of HCC is infection with the hepatitis B virus, which is predicted to account for approximately half of all cases.5 Surgical resection, liver transplantation, radiotherapy, and chemotherapy are the primary treatment options for many liver cancer patients. Bioavailable multikinase inhibitors (MKIs), particularly regorafenib, benefit the survival of HCC patients.6,7 As the effectiveness of immunotherapy has been proven in other solid tumours, it is gradually being used in liver cancer. However, HCC patients treated only with immune checkpoint inhibitors (ICIs) do not respond well to therapy.8,9 The PD-L1 inhibitor atezolizumab plus the antiangiogenic agent bevacizumab has been proven to have better treatment outcomes.10–13 Based on these therapeutic approaches, identifying more effective biomarkers and implementing combination therapy may benefit patients with liver cancer more.11
NABP2 (nucleic acid binding protein 2), also known as hSSB1 and OBFC2B, is a critical member of the single-stranded DNA-binding (SSB) protein family and has been demonstrated to have an important role in genomic stability.12,13 In the presence of DNA damage, SSB proteins can bind to DNA through oligonucleotide-binding (OB) structural domains and recruit other DNA repair proteins to facilitate DNA repair.14,15 There are two other common protein members in the SSB protein family: NAPB1 (hSSB1 and OBFC2B) and the replication protein A (RPA) complex. Replication protein A (RPA), the most studied SSB protein, is involved in many critical cellular metabolism processes, including chromosomal replication, cell cycle checkpoints, DNA damage checkpoints, and other signalling in response to DNA damage.16,17 RPAs contain four members, RPA1-4, which have been proven to be prognostic indicators for various tumours, including oesophageal carcinoma,18 colon cancer,19 ovarian cancer,20 bladder urothelial carcinoma,21 and hepatocellular carcinoma.22 NABP2 and NABP1 are newly discovered SSB proteins capable of binding to DNA and repairing DNA damage, as well as binding to RNA to participate in RNA processing.23 Only a few studies have explored the role of NABP2 and NABP1 in carcinogenesis and cancer development. According to previous research in hepatocellular carcinoma, NABP2 could regulate the cell cycle by modulating p21, suggesting that hSSB1 might be a novel and potential therapeutic target for HCC.24 However, there are no relatively complete reports on the prognostic and therapeutic value of NABP2 and its correlation with tumour immunity in HCC.
In this study, we investigated the prognostic and immunological relevance of NABP2 as a therapeutic target in hepatocellular carcinoma through bioinformatics analysis and several in vitro experiments.
Materials and Methods
Different Gene Expression Analysis
The RNA-seq gene expression data were downloaded from the TCGA database (The Cancer Genome Atlas, https://portal.gdc.cancer.gov/) and the GTEx database (Genotype Tissue Expression Project, https://commonfund.nih.gov/gtex), including data across 33 human cancer and non-cancerous tissues. The Cancer Cell Line Encyclopedia (CCLE) (https://portals.broad institute.org/ccle) dataset,25 which features gene expression in over 1000 cancer cell lines, was used to analyse the expression profiles of NABP2 in different cancer cell lines. We also collected the gene expression profiles of 11 HCC datasets from GEO (NCBI’s Gene Expression Omnibus, https://www.ncbi.nlm.nih.gov/geo/) database, including GSE76427, GSE112790, GSE25097, GSE14520 (GPL3921), GSE22058 (GPL6793), GSE36376, GSE63898, GSE84005, GSE87630, GSE102079, and GSE45267. These datasets were analysed and graphed in R software by the ggplot2 R package to evaluate the different gene expression levels of NABP2 in hepatocellular carcinoma and its corresponding normal liver tissues.
Prognostic Analysis, Model Construction, and Estimation
To evaluate the prognostic significance of NABP2 expression for overall survival (OS), disease-specific survival (DSS), and progression-free interval (PFI) in 33 common cancers using data downloaded from TCGA, Cox regression and Kaplan‒Meier survival analyses were conducted using R software (version 3.6.3) and the “survival” and “survminer” packages. In addition, a subgroup survival analysis of HCC was constructed to verify the prognostic value of NABP2 in patients with hepatocellular carcinoma. Meanwhile, univariate and multivariate Cox analyses, as well as logistic analysis, were performed to demonstrate the prognostic impact of NABP2 expression concerning other clinicopathological factors (TNM stage, age, sex, pathological stage, histologic grade, and vascular invasion). The R packages ggplot2 and tidyverse in R software were employed to visually present the common relationship between NABP2 expression and some factors involved in clinical pathology according to the data from TCGA. Using data from GEO on the TNMplot (https://tnmplot.com/analysis/)26 website, the relationship between NABP2 expression and liver cancer metastasis was investigated. The statistical method here mainly used Kruskal. Wallis test. To further clarify the prognostic and diagnostic value of NABP2 in hepatocellular carcinoma, we established a receiver operating characteristic curve (ROC) by utilizing TCGA and GEO data. The pROC and ggplot2 packages in R software were applied for analysis and visualization, respectively. The independent prognostic factors obtained from the multivariate Cox analysis were used to construct nomograms, which aimed to evaluate the prognosis at 1 year, 3 years, and 5 years respectively. Nomograms were constructed using the RMS package (https://cran.r-project.org/web/packages/rms/index.html), which included calibration charts as well as clinically relevant factors.
Functional Enrichment Analysis
According to the median NABP2 value, 374 LIHC patients were split into groups with high and low NABP2 expression. Differentially expressed genes (DEGs) between the two groups were identified using the R package “limma”, with criteria set at a log-fold change larger than 1 and an adjusted P value under 0.05. Some of the results are shown in the form of heatmaps by the R package “pheatmap”.27 These genes were analysed by GO enrichment [Gene Ontology, including biological process (BP), cellular component (CC), and molecular function (MF)] by the R package cluster profiler,28 enrichplot,29 and ggplot2. In addition, we downloaded the gene set data in gmt format from the GSEA website (http://www.gsea-msigdb.org/gsea/index.jsp), including c2.cp.kegg.v7.4.symbols and h.all.v7.5.1.symbols. Then, the R package clusterProfiler was used to perform gene set enrichment analysis (GSEA),30 and significantly enriched terms were defined as those having a false discovery rate (FDR) < 0.25 and an adjusted p value < 0.05.
Protein‒protein Interaction and Gene‒gene Interaction Network Analysis
STRING (https://version11.string-db.org/) is a protein‒protein interaction (PPI) platform that can be used to predict a comprehensive network of targeted protein lists.31 Another resource for predicting protein interactions is GeneMANIA (http://genemania.org/), which also predicts and displays data on the common protein domains, interactions, pathways, and coexpression of submitted genes between proteins or genes.32 The NABP2-protein interaction networks were constructed by using these two databases. The results from the STRING website were beautifully revisualized by Cytoscape software.33
Correlation Analysis Between NABP2 Expression and Immune Infiltration
Single-sample gene set enrichment analysis (ssGSEA) in the “GSVA” package34 was employed to assess immune infiltration in HCC, and the expression profiles of 23 immune cell types were analysed to determine infiltration levels. Based on Spearman correlation analysis, we looked for relationships between NABP2 expression and these immune cells, and Wilcoxon rank-sum tests were conducted to determine whether the high and low NABP2 expression groups differed in their levels of immune infiltration. TIMER2.0 (Tumour Immune Estimation Resource 2.0) is an online tool for the systematic evaluation of immune infiltration in common cancers.35 Therefore, correlation modules of the TIMER2 database were used to examine the correlation between NABP2 expression and genes of other tumour-infiltrating immune cells. These data will help further understand the relationship between immune infiltration and NABP2. Furthermore, using the R packages corrplot36 and reshape2,37 we examined the association between key immune checkpoint molecules and NABP2 expression in hepatocellular carcinoma.
Drug Discovery and Prediction
To identify prospective medication candidates that exhibit effectiveness in the NABP2 high expression group, we employed the half-maximum inhibitory concentration (IC50) of some drugs to assess their treatment response on hepatocellular carcinoma via the R package pRRophetic.38 Then, the CellMinerTM database39 (https://discover.nci.nih.gov/cellminer/home.do) was used to retrieve the drug sensitivity data. To analyse and visualize the data, the R packages “impute”, “limma”, “ggplot2”, and “ggpubr” were utilized.
Tumour Specimens and Cell Culture
A total of 20 pairs of cancerous and non-cancerous tissue specimens were gathered from 20 patients with liver cancer who underwent surgery in the Department of General Surgery at the Second Affiliated Hospital of Nanchang University from 2021 to 2022. For future experiments, specimens are stored at −80°C in a refrigerator. Research procedures were approved by the Ethics and Research Committees of the Second Affiliated Hospital of Nanchang University with the written consent of all patients. HCC human cell lines purchased from Procell Life Science and Technology Co., Ltd. (Wuhan, China). The cells were grown in DMEM with 10% FBS, 100 U mL-1 penicillin, and 100 mg mL-1 streptomycin at 37 °C and 5% CO2.
Western Blot and Immunohistochemistry (IHC)
First, we obtained total protein using RIPA lysis buffer containing protease inhibitor (Solarbio, Beijing, China), and the protein samples from different specimens or cells were equally quantified with a BCA kit (Solarbio, Beijing, China). By electrophoresis in 10% sodium dodecyl sulphate‒polyacrylamide gel electrophoresis (SDS‒PAGE) at a constant voltage (80–120 V), equal amounts of total proteins were separated and then transferred to a PVDF membrane at a current of 260 mA for approximately 80 min. After being blocked with 5% skimmed milk in TBST buffer, the membranes were incubated with the corresponding antibody. The antibodies used were anti-OBFC2B (1:2000, Proteintech, 14809-1-AP), anti-GAPDH (1:10000, Proteintech, 60004-1-lg), and anti-Beta Actin (1:10000, Proteintech, 60004-1-lg).
The matched samples of normal and malignant liver tissue were fixed, embedded, sectioned, and deparaffinized before IHC staining. A small number of dewaxed sections were stained with haematoxylin and eosin (H&E). IHC staining was carried out using the Dako EnVisionTM system in accordance with the manufacturer’s instructions (Agilent Technologies, USA).
RNA Interference and Transfection
To explore the effect of NABP2 on hepatocellular carcinoma, RNA interference was applied to transiently downregulate NABP2 expression in the liver cancer cell line HCCLM3. Transfections were performed using Lipofectamine 3000 transfection reagent (Invitrogen; Thermo Fisher Scientific, Inc.) and small interfering RNA in accordance with the manufacturer’s instructions. The cells were collected 48 hours after transfection using siNABP2-1 (5’- GAACCAGAAUGGGAAUGGACU-3’), siNABP2-1 (5’-GCAGCAUCAAUAUCUCUGU-3’), and siNC, which were purchased from GENERAL BIOL in Anhui, China.
Cell Proliferation Assay
A 5-ethynyl-2′-deoxyuridine (EdU) assay (Click-iT EdU Imaging Kits, UElandy, Suzhou, China) was used to detect cell proliferation. First, the siRNA-transfected HCC cells were gathered and evenly replanted in 96-well plates with 100 µL culture media containing 10% FBS (2×10⁴ cells/well). After 24 hours of culture, 100 µL and 50 mmol/L EdU Marking Solution diluted with complete DMEM was then added to each well and incubated with cells for 2 h at room temperature. The experiment was then carried out according to the instructions in the kit’s operation manual. Finally, the image was visualized by fluorescence microscopy.
Wound-Healing Assay and Transwell Assay
Cell migration ability was examined using wound-healing and transwell assays. Before these two experiments, exponentially growing cells were seeded in 6-well plates and divided into two groups: cells with/without NABP2 downregulation. For the wound-healing assay, the cells in culture plates were scratched with a micropipette tip (200 µL) when the cell concentration almost reached 90%. To track cellular movement and wound closure, images of the scratches were taken after 24 and 48 hours. Then, the percentage of wound healing was calculated by using ImageJ. For the Transwell migration assay, HCCLM3 cells were counted and reseeded into the upper Transwell chamber with serum-free medium (2× 10⁴ cells/Transwell). Meanwhile, complete medium with 15% FBS was added to the lower chamber. A solution of 3% paraformaldehyde in saline was used to fix the cells after 24 hours, and then crystal violet was added to stain the cells. The cells that migrated to the lower layer of the chamber were photographed with a microscope and counted using ImageJ.
Result
Differences in NABP2 Expression Between Human Tumours and Normal Tissues
We constructed a flowchart to briefly illustrate our study process (Figure 1). The comparison of NABP2 mRNA expression in various human cancers and adjacent normal tissues was explored based on the analysis of the data from TCGA and Genotype-Tissue, which were analysed by the Wilcoxon test. Among 33 common cancers, NABP2 expression was significantly upregulated in most cancers compared to their corresponding normal tissues. However, this distinction was not evident in some forms of tumours, including mesothelioma (MESO), pheochromocytoma and paraganglioma (PCPG), sarcoma (SARC) and uveal melanoma (UVM). One of the reasons may be due to the lack of normal samples of the corresponding cancers (Supplementary Figure S1A). Afterwards, we used data from the Cancer Cell Line Encyclopedia (CCLE) to investigate the expression of NABP2 in cancer cell lines. As shown in Supplementary Figure S1B, NABP2 presented high expression in the majority of cancer cell lines, which is consistent with its expression in cancerous tissues.
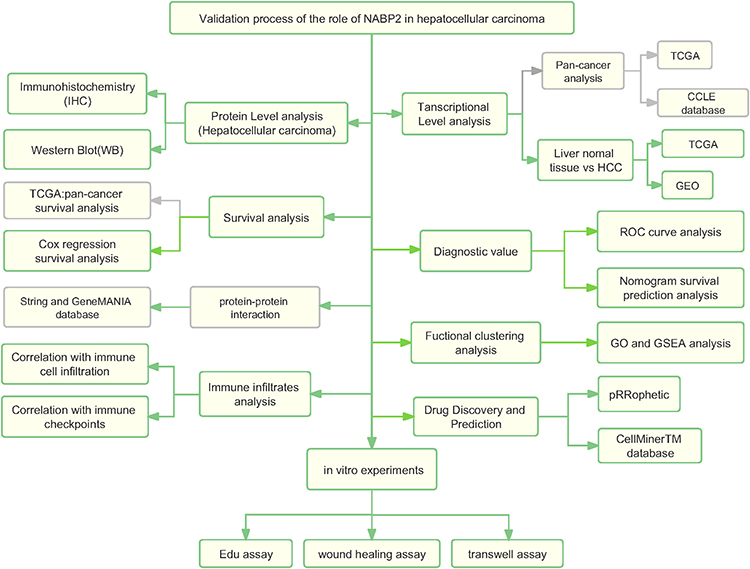 |
Figure 1 Analysis flow diagram of this study. |
Significantly Elevated Expression of NABP2 in HCC
To verify the expression level of NABP2 in HCC, we selected paired-sample data from the TCGA-LIHC cohort and 11 independent external datasets from the GEO database, including GSE76427, GSE112790, GSE25097, GSE14520 (GPL3921), GSE22058 (GPL6793), GSE36376, GSE63898, GSE84005, GSE87630, GSE102079, and GSE45267. The statistical details of these datasets regarding the transcriptional expression of NABP2 in HCC and normal liver tissues are shown in Supplementary Table S1. The results of the analysis of these data are also shown in scatter plots displayed in Figure 2A. All of these results indicated that the transcriptional levels of NABP2 were significantly higher in LIHC than in non-cancerous adjacent tissues.
 |
Figure 2 Confirmation of the high expression of NABP2 in hepatocellular carcinoma. (A) Expression of NABP2 in HCC and paired normal tissues from TCGA and datasets from the GEO database, including GSE76427, GSE112790, GSE25097, GSE14520 (GPL3921), GSE22058 (GPL6793), GSE36376, GSE63898, GSE84005, GSE87630, GSE102079, and GSE45267. (B) Immunohistochemistry (IHC) images for verifying the protein expression of NABP2 in HCC and normal tissues from the Human Protein Atlas. (C) Western blot for validating the different protein expression of NABP2 between liver cancer tissues and paired adjacent normal tissues. (*p value < 0.05; **p value < 0.01; ***p value < 0.001). |
To confirm the posttranscriptional expression level of NABP2 in HCC, we evaluated the variations in NABP2 expression between tissue specimens and their matching normal tissues using immunohistochemistry (IHC) and Western blotting. As shown in Figure 2B, immunohistochemistry results revealed that NABP2 was overexpressed in cancer tissue specimens compared to normal tissues. Furthermore, the upregulation of NABP2 expression in liver cancer tissues was further confirmed by Western blotting (Figure 2C, Supplementary Figure S2A). These results corresponded with the mRNA expression of NABP2 in the TCGA and GEO datasets.
Ki67 and PCNA levels are significantly higher in many kinds of cancers than in paraneoplastic tissue and are important proliferation markers of malignant tumours. Therefore, we performed a correlation analysis based on the TCGA-LIHC cohort. As shown in Supplementary Figure S2B, the expression levels of Ki67 and PCNA were both correlated with NABP2 expression. This implied that NABP2 is likely to affect the proliferation of hepatocellular carcinoma cells.
Correlation Between the Expression of NABP2 in HCC and Clinical Features
To probe the clinical significance of NABP2 expression, we analysed the patient characteristics and NABP2 expression data of the TCGA-LIHC cohort. Detailed information on some clinical features is shown in Table 1. The results showed that the expression of NABP2 in hepatocellular carcinoma increased with the progression of cancer T stage, pathologic stage, and histological tumour grade (Figure 3A–C). We also found that NABP2 was significantly upregulated in liver cancer patients with vascular invasion compared to patients without vascular invasion (Figure 3D). Similarly, NABP2 expression was significantly higher in hepatocellular carcinoma in patients with AFP greater than 400 ng/mL than in patients with AFP less than 400 ng/mL. (Figure 3E). However, NABP2 expression did not differ between older and younger HCC patients (Figure 3F), nor did it differ between males and females (Figure 3G). Additionally, we investigated the relationship between NABP2 expression and metastasis in HCC patients based on GEO chip data on the TMNplot website. As shown in Figure 3H, compared to patients without metastases, liver cancer patients with metastases had greater levels of NABP2 expression. Additionally, we conducted univariate logistic regression to examine the relationship between NABP2 expression and several prognostic variables. There was a positive correlation between NABP2 expression and clinical T stage [OR=2.205 (1.449–3.377) for T2&T3 vs T1], pathologic stage [2.196 (1.432–3.389) for Stage II & Stage III vs Stage I], histological grade [OR = 1.998 (1.109–3.702) for G2&G3 vs G1)], and vascular invasion [OR = 2.083 (1.305–3.354) for patients with and without vascular invasion)] (Table 2). All of these results indicated that NABP2 expression is significantly associated with the disease progression of hepatocellular carcinoma.
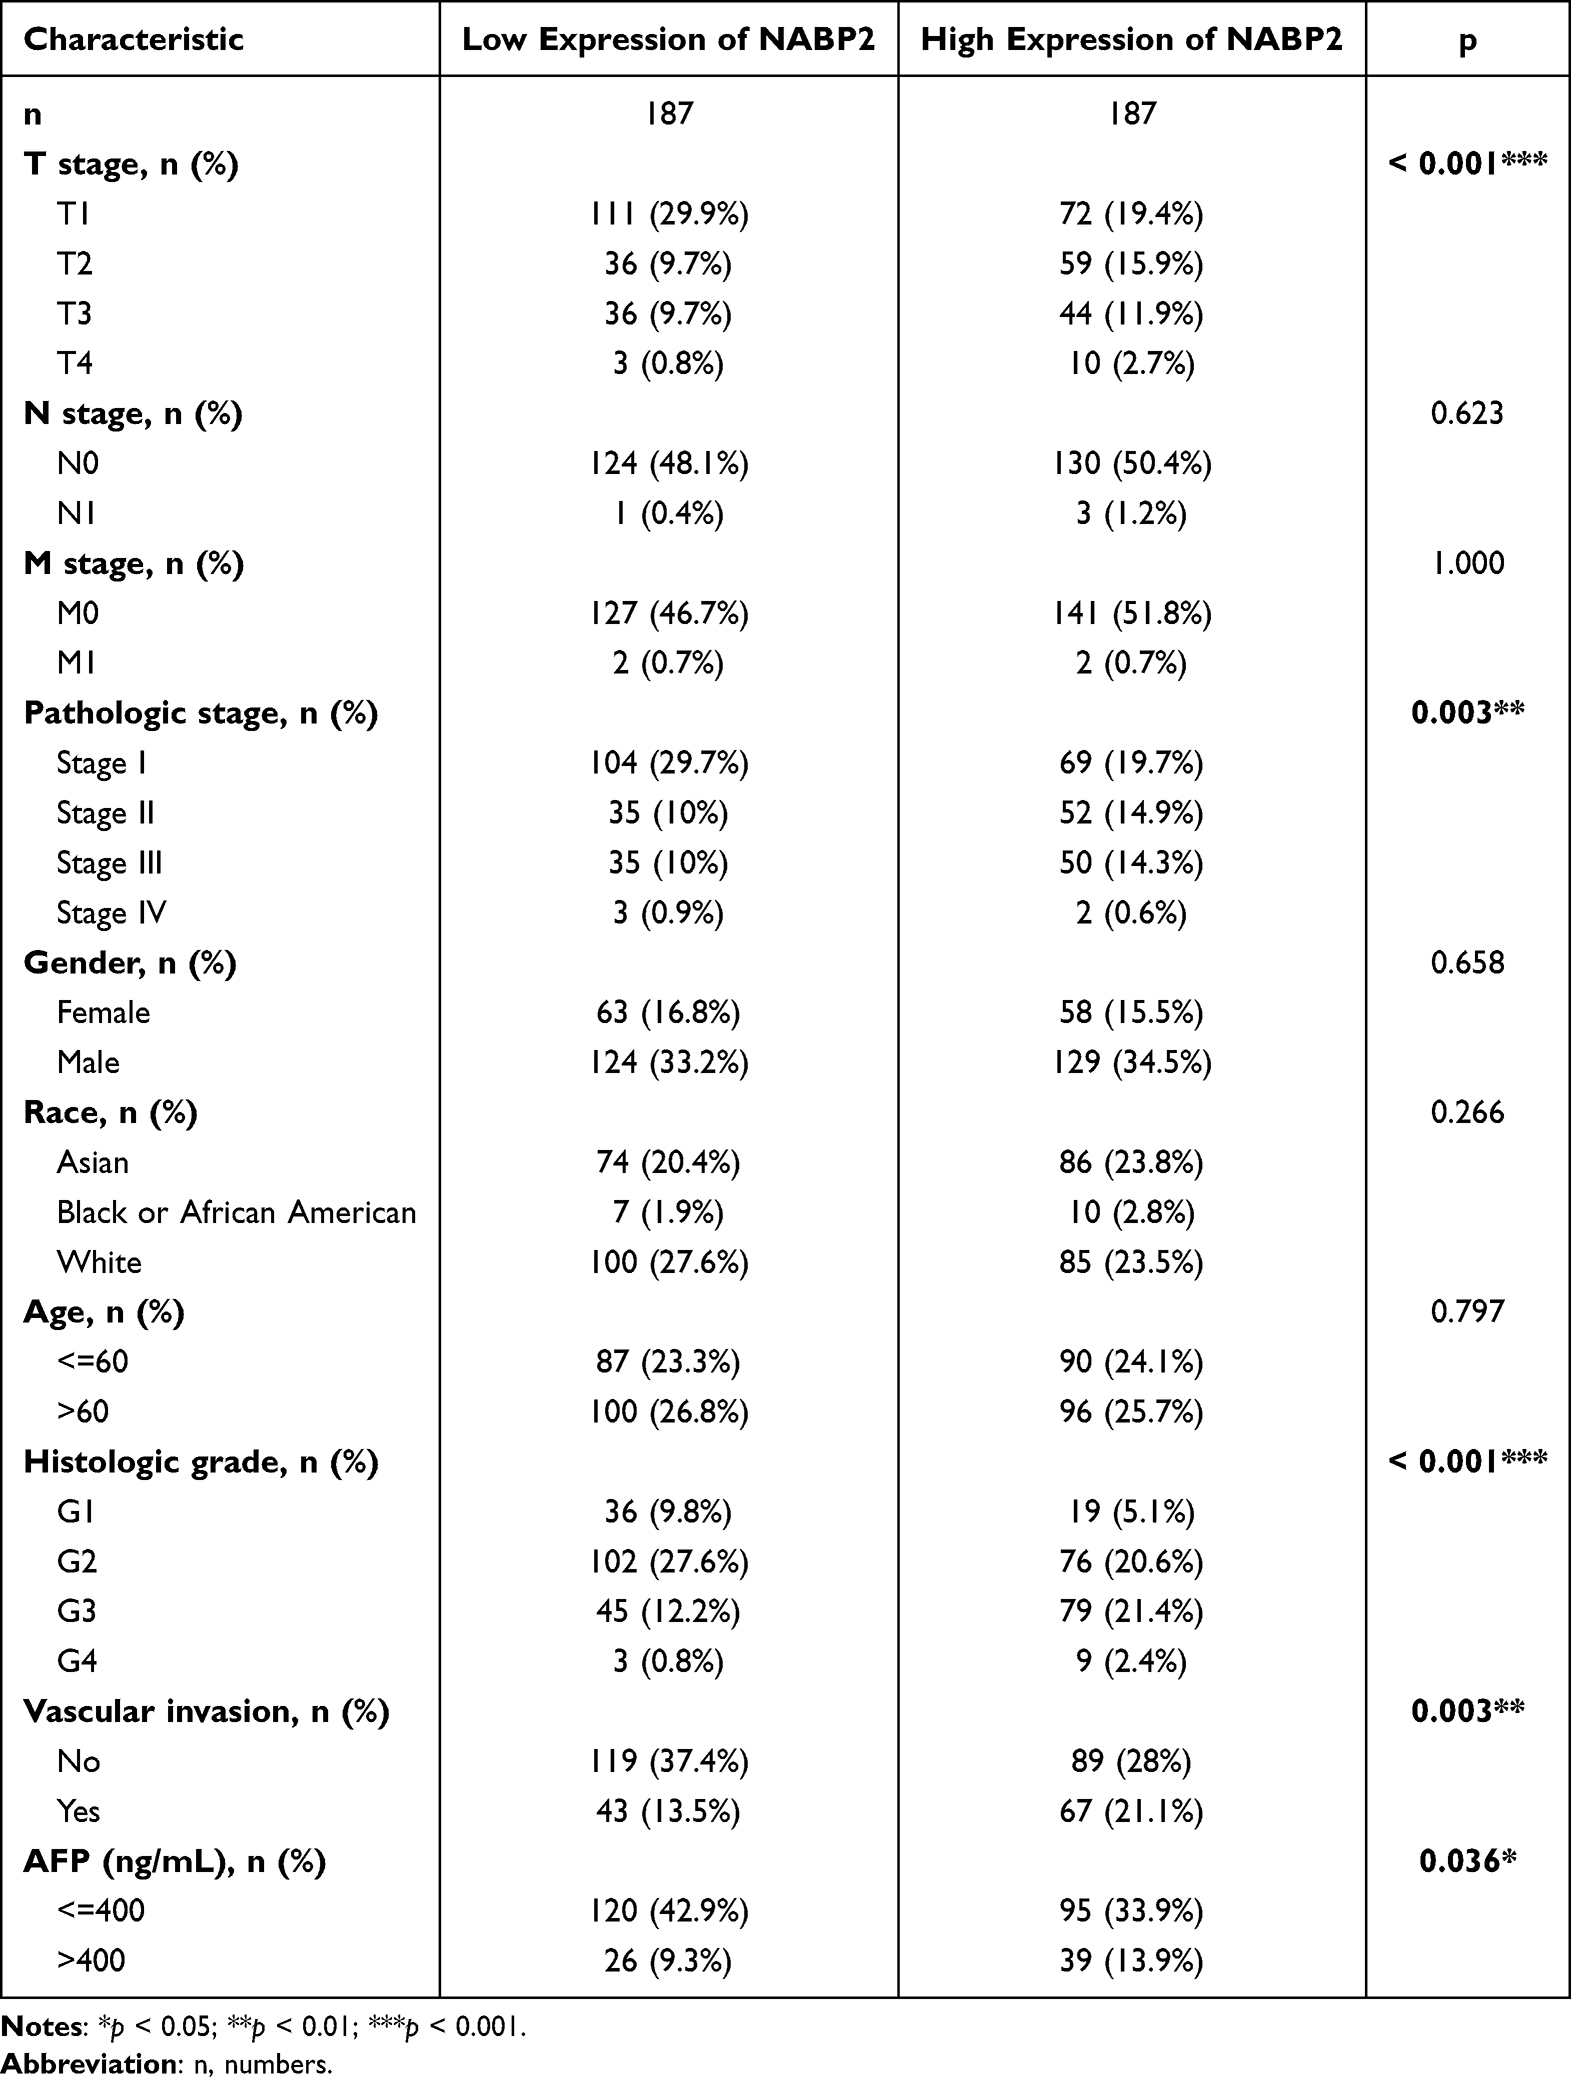 |
Table 1 The Correlation Between Clinicopathological Variables and NABP2 Expression |
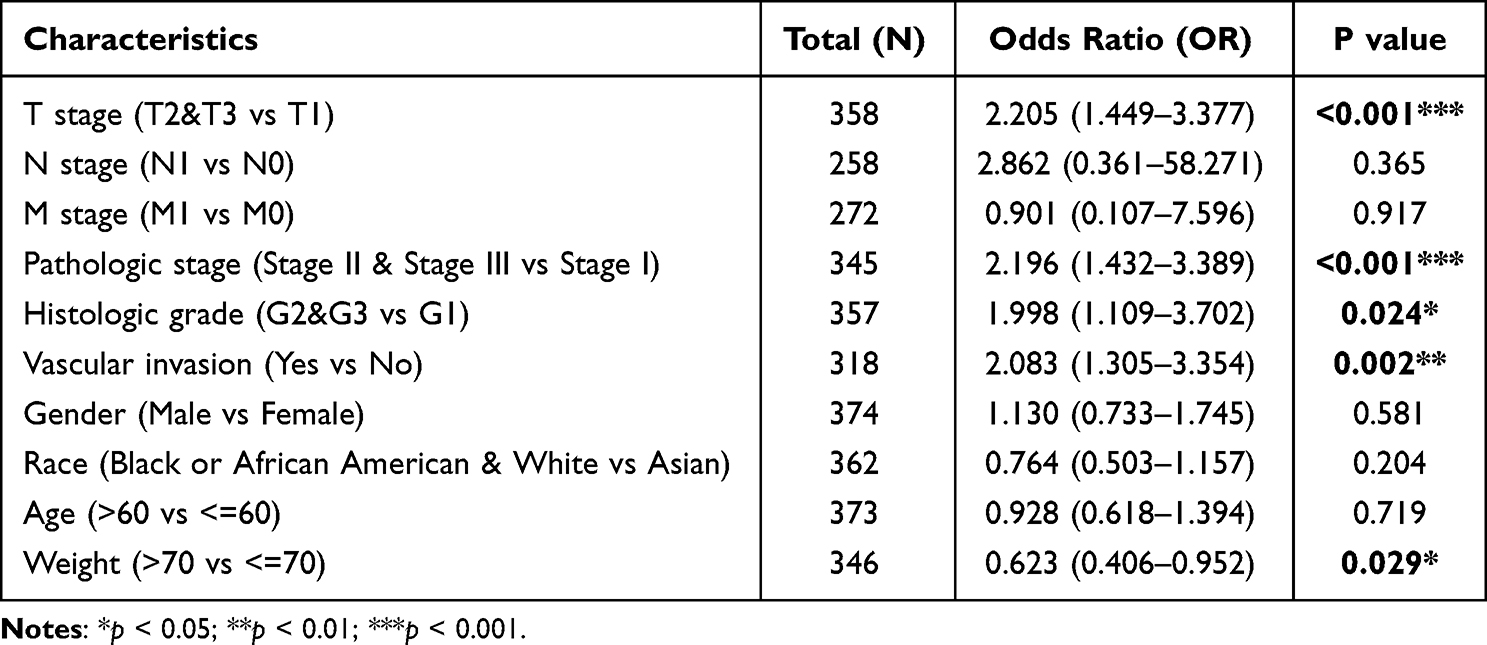 |
Table 2 Logistic Regression of NABP2 Expression and Clinical Characteristics |
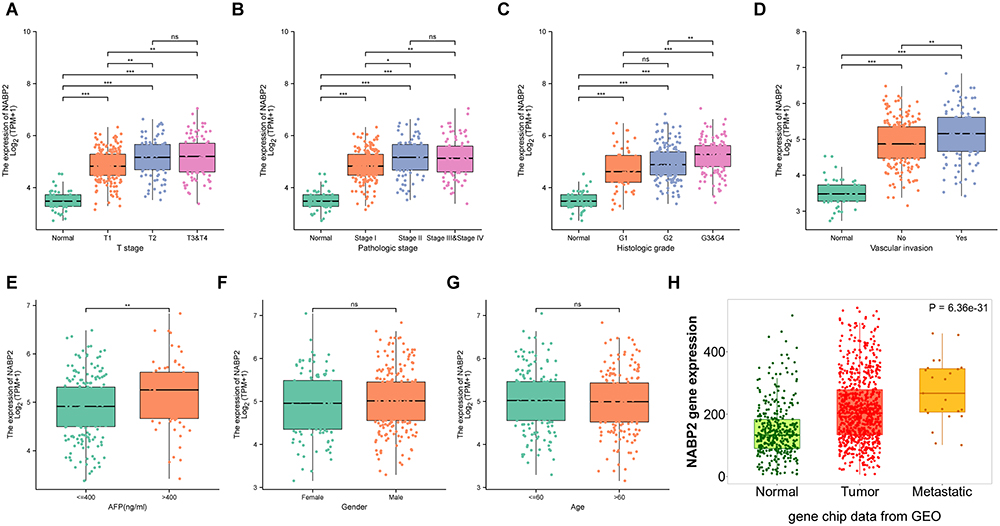 |
Figure 3 Association between NABP2 expression and clinical factors. (A–C) NABP2 mRNA expression in normal liver tissues and LHIC tissues from TCGA with different T stage (A), pathologic tumor stages (B), and histological tumor grades (C). (D) The expression of NABP2 between the LHIC patients with and without vascular invasion. (E) The different expression of NABP2 between the LHIC patients with AFP less than and more than 400ng/mL.(F and G) Box plot revealing the relationship between NABP2 expression and other different clinical factors, including gender (F) and age (G). (H) NABP2 gene expression in normal liver and liver cancer tissues without and with metastasis from GEO analyzed in TMNplot online tool. (*p value < 0.05; **p value < 0.01; ***p value < 0.001). Abbreviation: ns, no significance. |
Pancancer Prognostic Value of NABP2, Especially in Hepatocellular Carcinoma
We first investigated the association of NABP2 expression with patient prognosis across cancers. Based on the TCGA pancancer data, we conducted a Cox regression analysis of overall survival (OS, Supplementary Figure S3A and B), disease-specific survival (DSS, Supplementary Figure S3C and D) and progression-free interval (PFI, Supplementary Figure S3E and F). Our study found that NABP2 showed significant prognostic value in a variety of cancers. High NABP2 expression was associated with shorter OS in ACC, BLCA, HNSC, KIRP, LAML, LHIC, and UVM and longer OS in CESC. Similar results were obtained by Cox regression analysis in DSS and PFI, revealing the significant prognostic value for ACC, BLCA, CESC, HNSC, KIRP, LIHC, and UVM.
To further confirm the prognostic value of NABP2 in hepatocellular carcinoma, we performed survival analysis for different clinical subgroups of HCC patients. These clinical subgroups included T stage, pathological stage, histologic grade, sex, presence of vascular invasion, sex, race, and age. The results fully demonstrated that NABP2 was associated with poor OS and DSS in all different subgroups of patients with hepatocellular carcinoma (Figure 4, Supplementary Figure S4). In terms of PFI (Supplementary Figure S5), NABP2 expression also had a significant influence in most of the subgroups except for HCC patients in T stage 3 and 4, pathological stage III&IV, and histologic grade G3&G4. Furthermore, Cox regression, both univariate and multivariate, for only LIHC patients was conducted with some clinical factors, including T stage, N stage, M stage, sex, age, pathologic stage, histologic grade, tumour status, and NABP2 expression. The results of the univariate regression analysis verified that elevated expression of NABP2 contributed to poor OS (HR=2.03, CI: 1.427–2.889, p <0.001) (Table 3) and DSS (HR=2.321, CI: 1.468–3.671, p <0.001) (Supplementary Table S2). The multivariate regression analysis demonstrated that higher expression of NABP2 was still independently associated with poorer OS (HR=2.050, CI: 1.302–3.227, p = 0.002) (Table 3) and DSS (HR=2.648, CI: 1.378–5.089, p=0.003) (Supplementary Table S2). The above results generally suggested that NABP2 is a poor prognostic indicator for hepatocellular carcinoma.
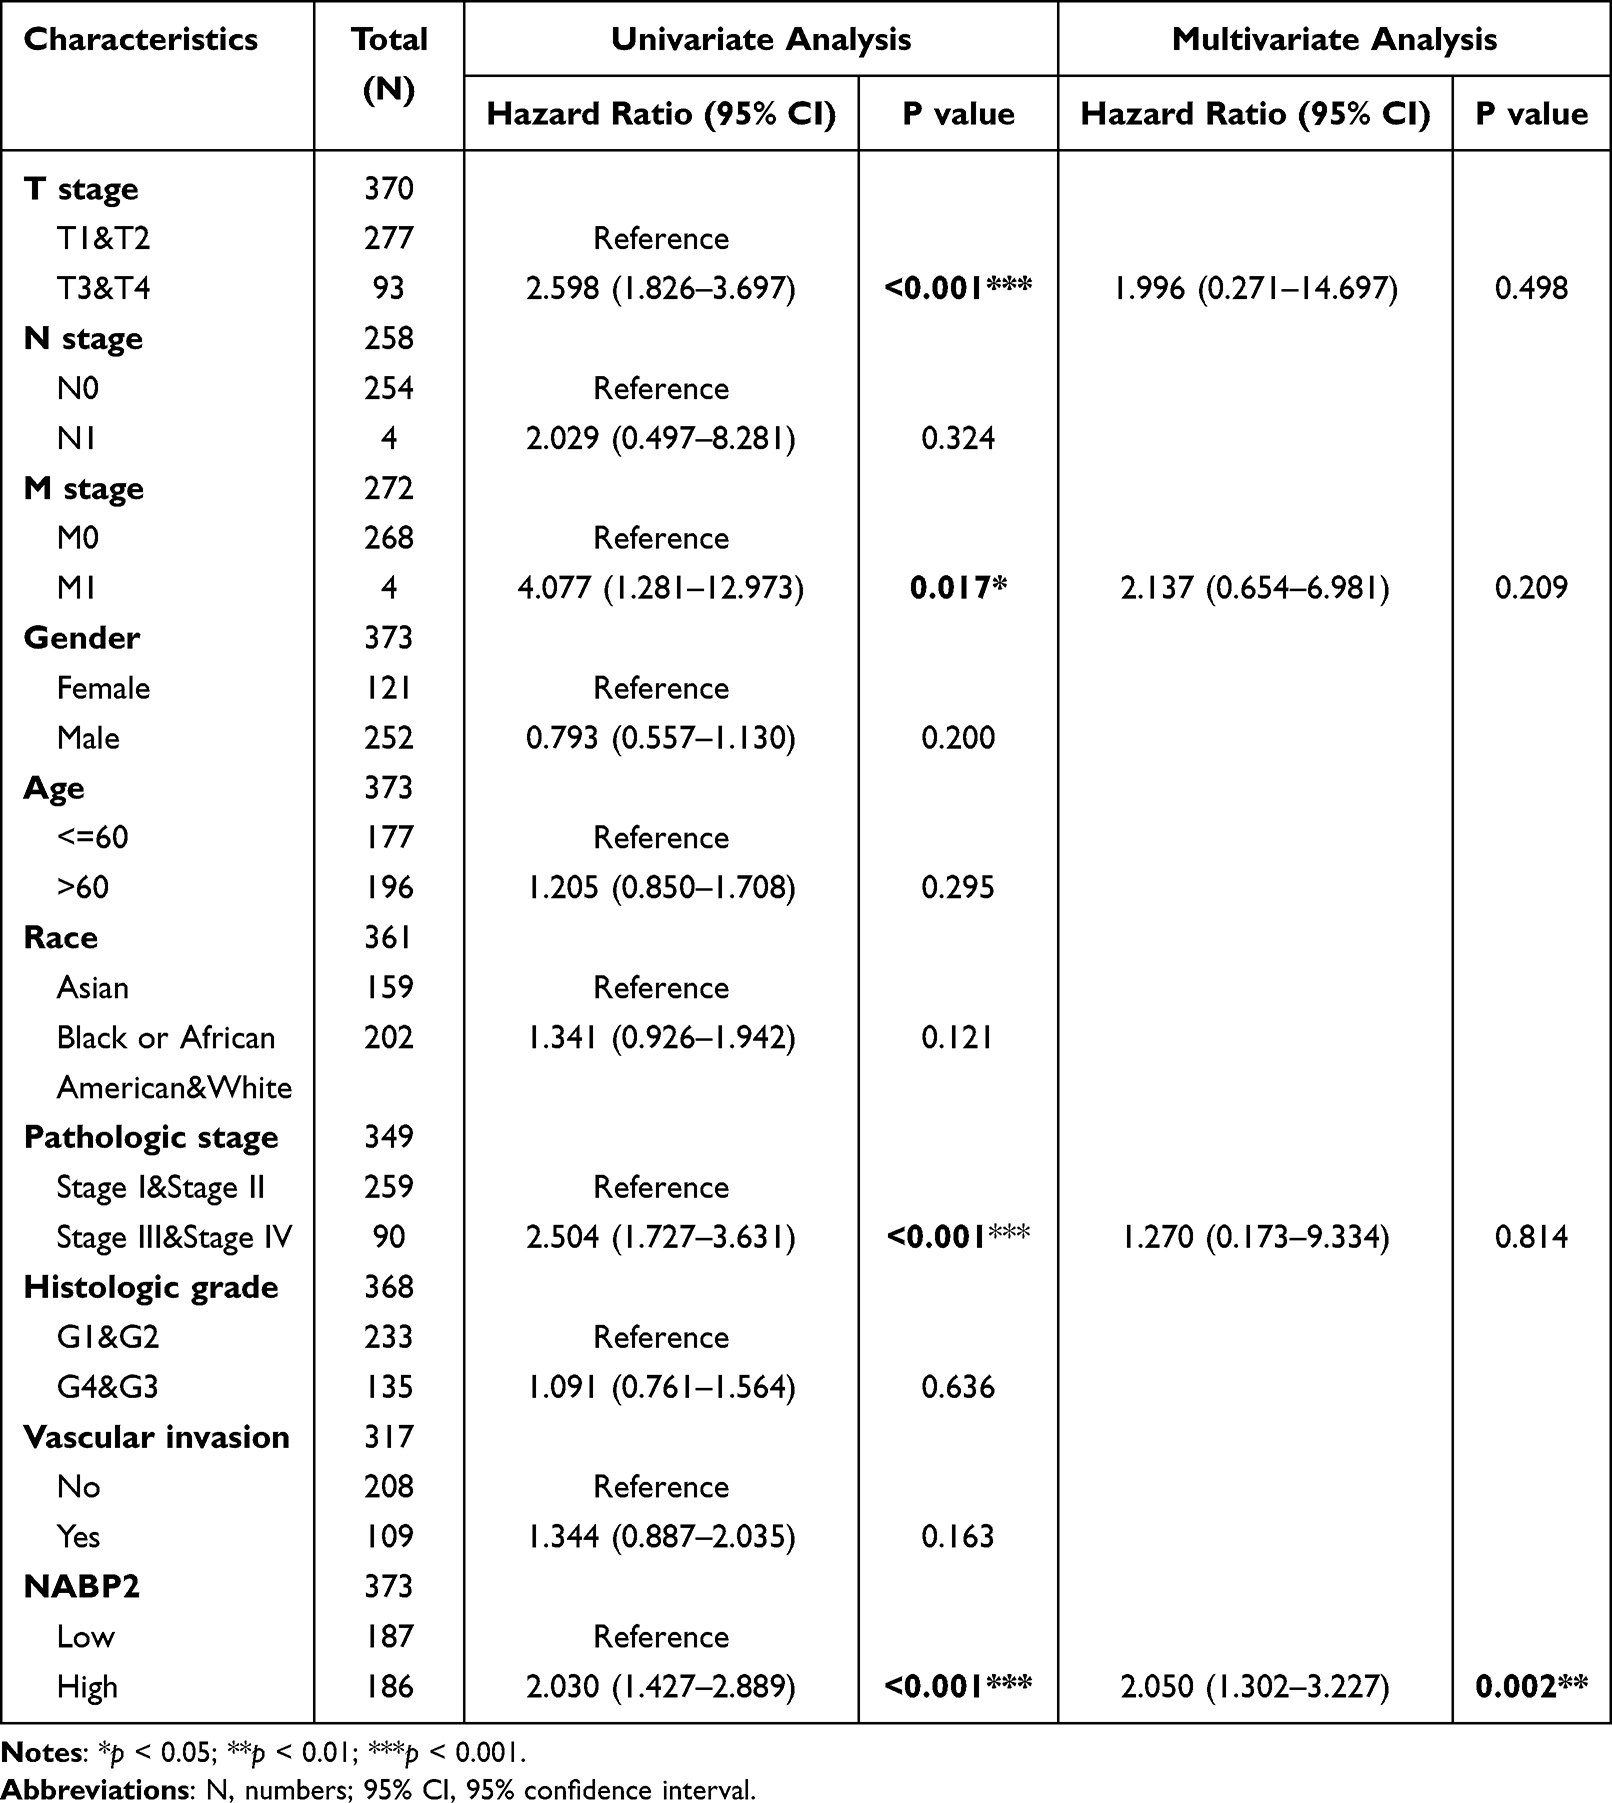 |
Table 3 Univariate and Multivariate Survival Method (Overall Survival) of Prognostic Covariates in Patients with Hepatocellular Carcinoma |
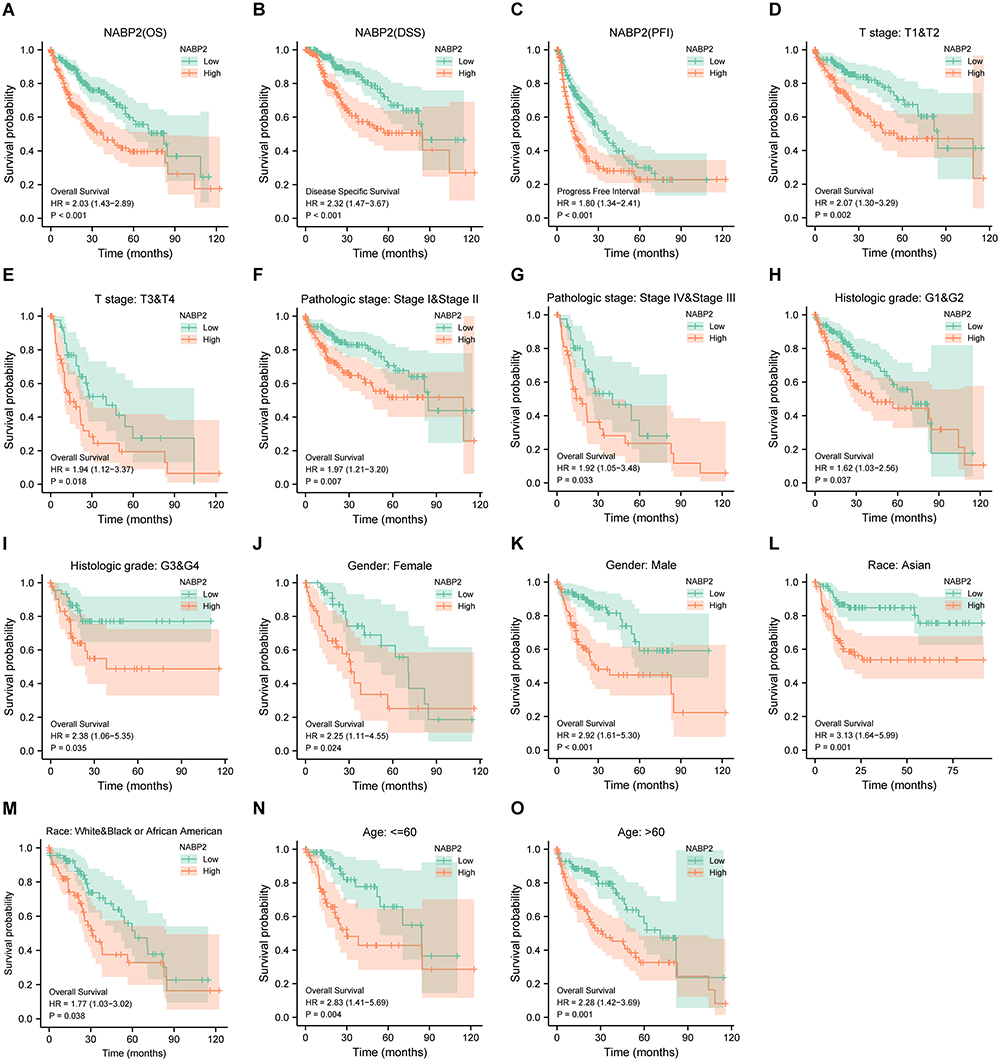 |
Figure 4 Prognostic analysis of the NABP2 in HCC. (A–C) Cox regression survival analysis of OS (A), DSS (B), and PFI (C) in HCC patients from the TCGA database. (D–O) Subgroup survival analysis in HCC based on a variety of clinicopathological factors. (D and E) T Stage; (F and G) Pathological stage; (H and I) Histologic grade; (J and K) Gender; (L and M) Race; (N and O) Age. |
Promising Diagnostic Value of NABP2 Overexpression in HCC
The current findings suggested that NABP2 expression was significantly different between liver cancer and corresponding nontumor tissues and predicted an unfavourable prognosis for HCC patients. We constructed a receiver operating characteristic (ROC) curve to predict the diagnostic value of NABP2 in HCC based on data from the TCGA and GEO databases. The areas under the ROC curve (AUCs) were 0.970 (TCGA, Figure 5A), 0.830 (GSE76427, Figure 5B), 0.950 (GSE112790, Figure 5C), 0.842 (GSE25097, Figure 5D), 0.840 (GSE14520/GPL3921, Figure 5E), 0.929 (GSE22058/GPL6793, Figure 5F), 0.966 (GSE36376, Figure 5G), 0.921 (GSE63898, Figure 5H), 0.972 (GSE87630, Figure 5I), 0.902 (GSE102079, Figure 5J), 0.952 (GSE84005, Figure 5K), and 0.950 (GSE45267, Figure 5L). These findings provided compelling evidence that NABP2 had a significant ability to distinguish HCC from normal liver tissues and promising diagnostic value in HCC. In addition, a time-dependent ROC curve analysis was performed to evaluate the predictive accuracy and risk scores of NABP2 in the survival analysis of patients with hepatocellular carcinoma. The results revealed that NABP2 had a good ability to predict the prognosis of HCC patients at 1, 3, and 5 years with AUCs of 0.681, 0.667, and 0.655 under the ROC curve, respectively (Figures 5M). Next, we built a nomogram to predict OS by introducing some clinical factors, including the levels of expression of NABP2, T stage, pathologic stage, and tumour status of patients (Figure 5N). The nomogram of the prediction model revealed that the established lines of 1-, 3-, and 5-year survival were highly compatible with the ideal line (Figure 5O), signifying that the model had a high degree of reliability in predicting individual survival probability.
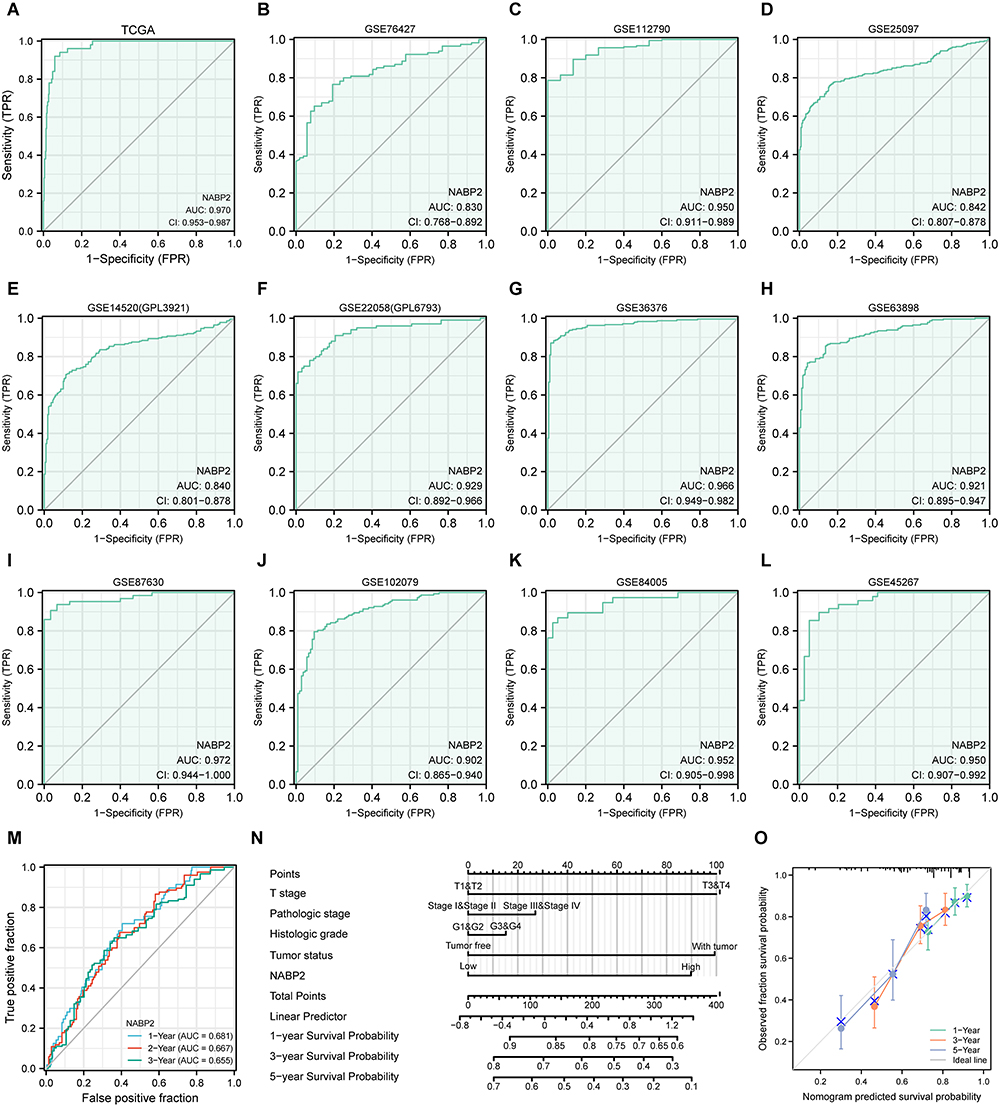 |
Figure 5 Diagnostic significance of NABP2 in HCC. (A–L) Receiver operating characteristic (ROC) curve analysis for NABP2 expression in HCC and adjacent tissues based on data from TCGA (A), GSE76427 (B), GSE112790 (C), GSE25097 (D), GSE14520/GPL3921 (E), GSE22058/GPL6793 (F), GSE36376 (G), GSE63898 (H), GSE87630, (I), GSE102079 (J), GSE84005 (K), and GSE45267 (L). (M) The Time-dependent ROC curve analyses survival prediction by the prognostic model. (N) Nomogram chart for predicting overall survival rates at 1-, 3-, and 5-year. (O) Calibration plots of the nomogram for evaluating the probability of OS at 1, 3, and 5 years. |
Functional Enrichment Analysis of NABP2 in HCC
We discovered a total of 2850 differentially expressed genes (DEGs), with an adjusted p value <0.05 and absolute log2-fold change>1.0, including 2675 upregulated genes and 175 downregulated genes, by comparing the expression of additional genes in the NABP2-high and NABP2-low groups. (Supplementary Table S3). The heatmap in Figure 6A shows the top 50 upregulated genes and top 50 downregulated genes. To better understand the enrichment of biological functions of NABP2, GO enrichment analysis of DEGs, including biological processes (BP), cellular compositions (CC), and molecular functions (MF), was performed and demonstrated that these genes were predominantly involved in cell division, such as nuclear division, cell cycle checkpoint signalling, cell cycle G2/M phase transition, and DNA replication (Figure 6B). Furthermore, we performed GSEA between the high and low NABP2 expression groups to discover the activated signalling pathways and more NABP2-related biological processes by using the MSigDB hallmark gene sets, C2 curated gene sets and C6 oncogenic signature gene sets. As shown in Figure 6C, the MSigDB hallmark gene sets involved in the process of E2F-target, G2M checkpoint, and DNA repair were upregulated in the NABP2-high group, and the process of apoptosis, hypoxia, oxidative phosphorylation, and TGFA signalling via NF-κB was downregulated in the NABP2-low group. The KEGG-related gene sets and Reactome-related gene sets involved in the process of the cell cycle were upregulated in the NABP2-high group (Figure 6D and E). The results also demonstrated that NABP2 might be involved in several pathways or biological processes related to cancer progression, such as apoptosis and TGFA signalling via NF-κB, the cell cycle, P53 signalling, and oxidative phosphorylation.
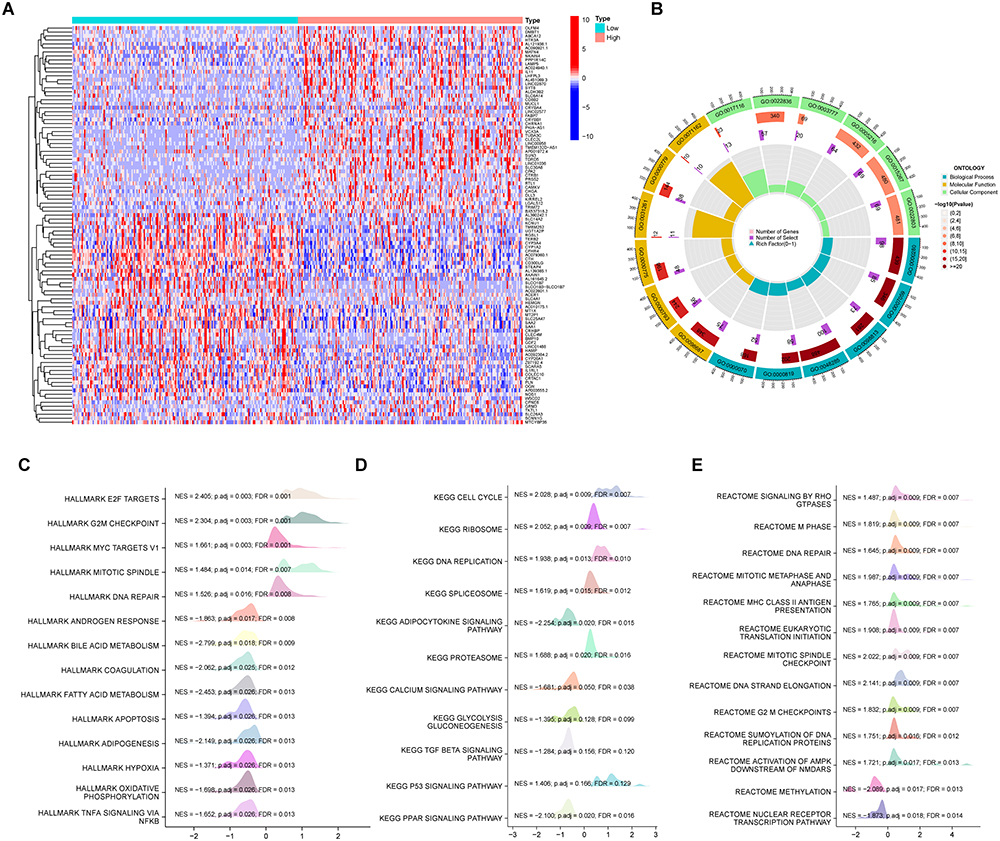 |
Figure 6 Functional enrichment analysis in HCC. (A) Heat maps showing the top 50 upregulated genes and top 50 downregulated genes in NABP2 high-expression groups compared to NABP2 low- expression groups. (B) Circle graph depicting categories obtained from GO term enrichment analysis of the DEGs. (C–E) Gene set enrichment analysis (GSEA) of the DEGs by using the MSigDB hallmark gene sets (C), C2 Curated gene sets (D), and C6 Oncogenic signature gene sets (E). Abbreviations: NSE, normalized enrichment score; p.adj, p adjust value; FDR, false discovery rate. |
Protein‒protein Interaction Networks
Protein‒protein interaction (PPI) network analysis of NABP2 was performed by using the STRING and GeneMANIA databases to explore the potential interactions among the proteins that interacted with NABP2. First, we obtained a list of proteins interacting with the NABP2 protein on the STING website. We then input the list of genes into Cytoscape to obtain a more brief and explicit PPI network map (Supplementary Figure S6A). Similarly, we used the GeneMANIA database to analyse the potential proteins that interacted with NABP2 (Supplementary Figure S6B). The image showed that the roles of these NABP2-related proteins or genes were potentially linked to ncRNA transcription, DNA-templated transcription, RNA polymerase complex, and so on. This indicated that NABP2 was associated with gene transcription and translation.
Role of NABP2 in Tumour Immunity in Hepatocellular Carcinoma
Tumour-infiltrating lymphocytes (TILs) execute a remarkable function in antitumour immunity and strongly affect the survival of tumour patients.40–42 To understand the effect of NABP2 expression on the immune microenvironment of hepatocellular carcinoma, Spearman correlations between the infiltration levels of major immune cells and NABP2 expression in HCC were calculated. The results indicated that the expression of NABP2 was significantly negatively correlated with the infiltration levels of cytotoxic cells, CD8+ T cells, and DCs (Figure 7A). Conversely, the infiltration levels of other immune cells, including Th2 cells and NK CD56bright cells (Figure 7A), were positively correlated with the expression of NABP2. By analysing the TIMER2.0 website, we found that the infiltration level of both CAFs (cancer-associated fibroblasts) and MDSCs (myeloid-derived suppressor cells) showed a significant positive correlation with the expression level of NABP2 (Figure 7B). In addition, we also analysed the infiltration levels of these immune cells at different NABP2 expression levels using the ssGSEA algorithm (Figure 7C). The enrichment scores of mast cells, B cells, cytotoxic cells, DCs, CD8+ T cells, eosinophils, neutrophils, NK cells, pDCs, and Tgd were lower in the NABP2-high expression group than in the NABP2-low expression group, while aDCs, NK CD56bright cells, and Th2 cells showed a higher enrichment fraction in the NABP2 high expression group. The abovementioned results indicate that there were fewer cytotoxic cells, DCs, CD8+ T cells, eosinophils, neutrophils, and NK cells and more CAFs, MDSCs, and Th2 cells in the tumour microenvironment of HCC patients with higher expression of NABP2. As we have previously found, high expression of NABP2 in hepatocellular carcinoma potentially causes a decrease in immune cell infiltration and leads to a weakening of antitumour immunity. This could partly explain why an increase in NABP2 expression in patients with hepatocellular carcinoma was associated with worse outcomes.
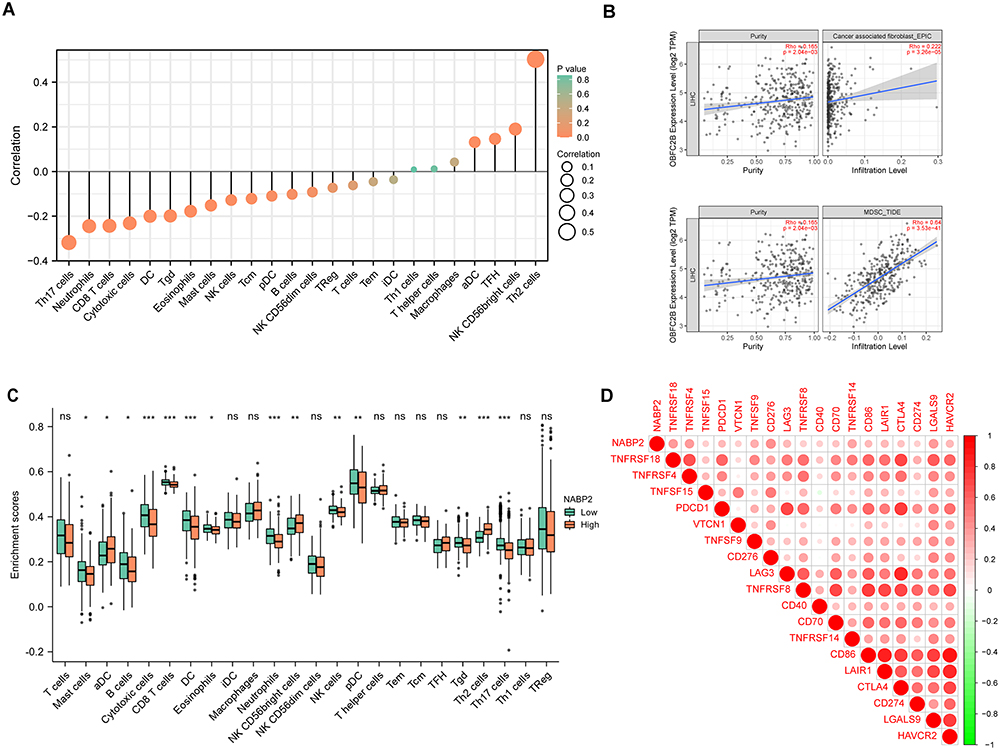 |
Figure 7 Correlation of NABP2 expression with immune infiltration level in HCC. (A) Correlation between NABP2 expression and the relative infiltration of 24 immune cells in HCC. The size of the dots corresponds to the value of Spearman correlation coefficient. (B) Correlation diagrams between the relative enrichment scores of immunosuppressive cells CAFs (Cancer-associated fibroblast) and MDSCs (Myeloid-derived suppressor cells). (C) Different enrichment scores of 24 immune cells between NABP2-high and -low patients. (D) Correlation between immune checkpoints and NABP2 expression in HCC. (*p value < 0.05; **p value < 0.01; ***p value < 0.001). Abbreviation: ns, no significance. |
With the rise of immunotherapy, many clinical tumour patients have benefited from it, and immune checkpoints play an important role in this process. We examined the association between NABP2 and some prevalent checkpoints in HCC (Figure 7D). The findings showed that the higher levels of immunological checkpoints in HCC, including PDCD1, CD274 (PD-L1), CD276, CTLA4, LGALS9, TNFRSF18, TNFRSF4, and TNFRSF14, were substantially correlated with the NABP2 level. This implied that high expression of NABP2 in HCC patients may affect the efficacy of clinical immune checkpoint therapy.
In addition, we also selected GSE36376 from the GEO database for the immunocorrelation analysis of NABP2. As shown in Supplementary Figure S7, there were significant differences in the infiltration of CD4 T cells, Tregs, macrophages (M0, M1 and M2), DCs and neutrophils in the two groups of hepatocellular carcinoma samples with high and low expression of NABP2 (Supplementary Figure S7A). Further analysis of NABP2 and immune checkpoint correlations using this dataset revealed that the expression of NABP2 showed a positive correlation with most of the immune checkpoints, especially stronger correlations with TNFRSF25, ADORA2A, LGALS9, TNFSF4, TNFRSF9, LAIR1, and PDCD1. This result is partially consistent with the results of the TCGA analysis (Supplementary Figure S7B).
Potential Chemo Drugs Targeting NABP2 for Treatment
Through bioinformatic analysis, we found that NABP2 influences the disease progression of hepatocellular carcinoma and its antitumour immune environment. Therefore, we looked for possible chemotherapy medicines to thwart the NABP2-regulated oncogenic process. First, we calculated the IC50 of some drugs, including a few medicines used in cancer treatment. Patients with high NABP2 expression had lower IC50 values for tipifarnib (Figure 8A), 5-fluorouracil (Figure 8B), A-770041 (Figure 8C), Bix02189 (Figure 8D), Bi2536 (Figure 8E), cyclopamine (Figure 8F), dasatinib (Figure 8G), etoposide (Figure 8H), gemcitabine (Figure 8I), imatinib (Figure 8J), OSU-03012 (Figure 8K), paclitaxel (Figure 8L), parthenolide (Figure 8M), sunitinib (Figure 8N), temozolomide (Figure 8O), thapsigargin (Figure 8P), and vinorelbine (Figure 8Q), suggesting that patients with high NABP2 expression were more vulnerable to these medical treatments and may have a better outcome. Conversely, patients with high NABP2 expression had higher IC50 values for (5z)-7-oxozeaenol (Figure 8R), trametinib (Figure 8S), and Xav939 (Figure 8T), indicating that these drugs are not suitable for treating patients with high NABP2 expression. Furthermore, we used the CellMinerTM database to analyse the correlation between the IC50 of some drugs and NABP2 expression (Supplementary Figure S8). The analysis showed that the IC50 of SNS-314, methylprednisolone, cladribine, quizartinib, 5-fluoro deoxy uridine 10-mer, fludarabine, fenretinide, dexamethasone decadron, nelarabine, 7-ethyl-10-hydroxycamptothecin, teglarinad, karenitecin, and PF-04217903 increased with the elevated expression of NABP2. These drugs were less effective in treating patients with hepatocellular carcinoma in the NABP2 high-expression group. Other drugs, such as TAK-733, pluripotin, and depsipeptide, showed a higher sensitivity for the treatment of patients with high NABP2 expression.
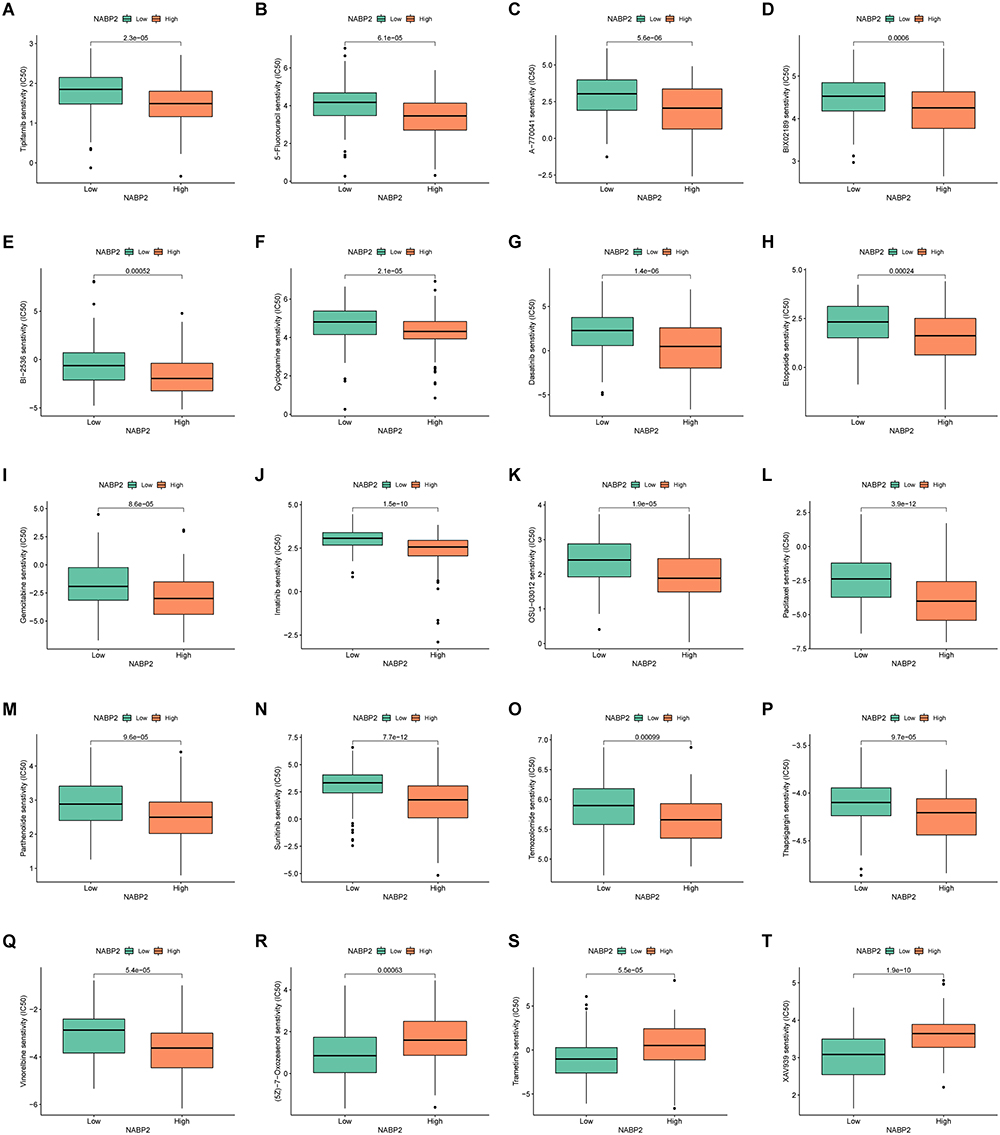 |
Figure 8 Comparison of chemotherapeutic effects in groups with high and low NABP2 levels based on TCGA-LIHC cohort and analysed by R package pRRophetic. IC50 was calculated for Tipifarnib (A), 5-Fluorouracil (B), A-770041 (C), Bix02189 (D), Bi-2536 (E), Cyclopamine (F), Dasatinib (G), Etoposide (H), Gemcitabine (I), Imatinib (J), OSU-03012 (K), Paclitaxel (L), Parthenolide (M), Sunitinib (N), Temozolomide (O), Thapsigargin (P), Vinorelbine (Q), (5z)-7-Oxozeaenol (R), Trametinib (S), and Xav939 (T). |
Knockdown of NABP2 Suppresses the Malignant Phenotype of Hepatocellular Carcinoma in vitro
To explore the role played by NABP2 in HCC, we downregulated the expression of NABP2 in hepatocellular carcinoma cell lines by RNA interference. By Western blot, we verified the knockdown efficiency of NABP2 siRNA-1 and siRNA-2. The results showed that si-NABP2-1 exhibited the highest level of inhibitory effectiveness (Figure 9A) in the HCCLM3 cell line. To investigate the effect of NABP2 on the proliferation of hepatocellular carcinoma cells, an EdU assay was used. The NABP2-knockdown group had a lower cell proliferation rate than the control group (Figure 9B). Next, we investigated the impact of NABP2 on the migration ability of hepatocellular carcinoma cells using wound healing assays and Transwell experiments. After downregulating NABP2 expression in hepatocellular carcinoma cells, their migration ability was significantly lower than that of the control group (Figure 9C and D). These results suggested that NABP2 can promote the ability of hepatocellular carcinoma cells to proliferate and migrate, indicating that NABP2 is very likely to be a cancer-promoting factor in hepatocellular carcinoma.
 |
Figure 9 Knockdown of the expression of NABP2 inhibits proliferation, and migration of liver cancer cells in vitro. (A) The transfection efficiency of si-NABP2-1 and si-NABP2-2 in the HCCLM3 cell lines were detected by Western blotting. (B) EdU assay was applied to detect the efficiency of NABP2 knockdown on the proliferation of HCCLM3 cell lines. (C) Wound-healing assay showing delayed wound-healing of NABP2-downregulated HCCLM3. (D) Transwell migration assay was utilized to detect the changes in the migration ability of HCCLM3 after NABP2 silencing. (*p value < 0.05; **p value < 0.01; ***p value < 0.001). |
Discussion
Single-stranded DNA-binding (SSB) proteins play an essential role in DNA replication, transcription, and DNA repair.43 SSB proteins can detect and attach to damaged DNA, protect single-stranded DNA (ssDNA), and recruit other repair factors to help repair DNA.43,44 The DNA-binding function of SSB proteins is exerted by its oligonucleotide/oligosaccharide-binding fold (OB-fold), which is a structural protein domain that also facilitates protein‒protein interactions.14,16 The number of OB-folds determines the type of SSB protein: simple SSBs with only one OB-fold and higher order SSBs with multiple OB-folds.45 To date, only three simple SSBs (NABP1, NABP2, and mtSSB) have been identified, with mtSSB specifically localized in mitochondria and the other two positioned in the nucleus. Replication protein A (RPA) is the higher order SSB that processes four members: RPA1, RPA2, RPA3, and RPA4.43
NABP1 and NABP2, also known as OBFC2B or hSSB2 and OBFC2A or hSSB1, respectively, can both interact with integrator complex subunit 3 (INTS3) and C9ORF80 to construct a complex involved in the DNA damage repair response.13,46,47 In addition to its role in the repair of DNA double-strand breaks, DNA replication forks,48 and oxidative DNA damage,43,49 NABP2 is also involved in RNA processing50 and protection of telomerase.51 NABP2 also protects certain proteins from degradation, such as P53 and P21, and is therefore involved in the regulation of DNA damage checkpoints and the cell cycle.24,52
Thus, there has been an increase in research showing the capability of NABP2 to perform a range of functions in living organisms, but its role in cancer has not been extensively explored. A few studies have suggested that NABP2 may play a role in the development of skin cancers, including basal cell carcinomas.53 In hepatocellular carcinoma, NABP2 can stabilize p21 to regulate the cell cycle. Hepatocellular carcinoma (HCC) is a refractory cancer with a poor prognosis that poses a severe threat to human health and places significant financial pressure on individuals and society.54 This study aims to explore the potential utility of NABP2 as a prognostic indicator and therapeutic target for hepatocellular carcinoma.
In this study, we found that NABP2 mRNA expression was aberrant in most malignancies and significantly high in hepatocellular carcinoma by analysing it in several databases, including TCGA, CCLE, and GEO. Immunohistochemistry and Western blotting similarly demonstrated that the protein expression of NABP2 was significantly higher in hepatocellular carcinoma than in normal liver tissue. Additionally, overexpression of NABP2 in liver cancer tissues was linked to clinicopathological factors, including cancer stage, tumour grade, and vascular invasion. Similarly, high NABP2 expression was found to be strongly linked with poor overall survival (OS), disease-specific survival (DSS), and PFI (progression-free interval) in HCC patients compared to low NABP2 expression. Likewise, through Cox regression analysis, we found that NABP2 exhibited significant prognostic value in other varieties of cancers, such as ACC, BLCA, CESC, HNSC, KIRP, and UVM. Additionally, liver cancer patients with elevated NABP2 expression had shorter OS, DSS, and PFI in various clinical categories, according to subgroup survival analyses. Moreover, ROC curve analysis revealed that NABP2 had significant diagnostic value for hepatocellular carcinoma. Clinical correlation analysis, Cox regression analysis, and logistic analysis suggested that an enhanced level of NABP2 expression was related to some clinical characteristics, such as clinical stage, tumour grade, and even vascular invasion, in HCC patients. Accumulating evidence suggests that NABP2 plays an oncogenic role in promoting the development of hepatocellular carcinoma and may also serve as an unfavourable biomarker for HCC.
To understand the mechanism of NABP2 in promoting hepatocellular carcinoma, we performed GO enrichment analysis of the intersectional gene list of NABP2 coexpressed genes and significantly upregulated survival-related genes in hepatocellular carcinoma. The results showed that these genes are mainly enriched in cell cycle checkpoint signalling, cell cycle G2/M phase transition, and DNA replication, which could affect cancer cell division and growth and may even influence the progression of HCC. In addition, the results of the GSEA also indicated that multiple tumour biological processes and cancer-related pathways were enriched, such as the G2M checkpoint, E2F targets, apoptosis, P53 signalling, and TGFA signalling via NF-κB. Another aim of our study was to construct PPI networks of NABP2-related genes and identify proteins that may interact with NABP2 in hepatocellular carcinoma. The genes or interacting proteins associated with NABP2 were also mainly associated with DNA damage and involved in the transcriptional-translational process of genes, as analysed in the GMINA and STRING databases.
Another noteworthy finding of this study was that NABP2 expression is related to the tumour microenvironment (TME). Cancer cells, blood vessels, immune cells, mesenchymal cells, inflammatory factors, and the extracellular matrix are the main components of the TME, which influence cancer progression and clinical outcome.55
As determined by drug IC50 prediction, we discovered that most of the cancer-related medications analysed in the article have a higher sensitivity for HCC patients with high NABP2 expression. For example, tipifarnib has shown good efficacy in head and neck squamous cell carcinomas with HRAS mutations.56 Therefore, we speculated that the HRAS mutation in hepatocellular carcinoma is associated with NABP2 expression. Cyclopamine is an inhibitor of the hedgehog signalling pathway that plays an anticancer role in many malignancies.57 The results of our analysis predicted a positive correlation between the therapeutic sensitivity of cyclopamine and NABP2 expression in patients with hepatocellular carcinoma. This finding implicitly suggests a correlation between NABP2 and the hedgehog signalling pathway in liver cancer. Parthenolide is an inhibitor of the NF-κB signalling pathway and is now used as a cooperating agent in the anticancer treatment of various malignancies.58 In conjunction with the analysis in the article, NABP2 may also influence the progression of hepatocellular carcinoma through the NF signalling pathway. Conversely, patients with high NABP2 expression had higher IC50 values for (5z)-7-oxozeaenol (Figure 8R), trametinib (Figure 8S), and Xav939 (Figure 8T), indicating that these drugs are not suitable for treating patients with high NABP2 expression. These three drugs are also common antitumour drugs. (5z)-7-Oxozeaenol is an inhibitor of TAK1 (transforming growth factor-β-activated kinase 1) and promotes apoptosis in many cancers.59,60 Trametinib inhibits tumour development by blocking the RAS/RAF/MEK/ERK signalling pathway and is now used in the treatment of various cancers.61–63 Xav939, as a WNT pathway inhibitor, can also inhibit tumour growth.64,65 Thus, we conjectured that the high expression of NABP2 in hepatocellular carcinoma could induce some drug resistance mechanism that affects the inhibitory effects on the corresponding pathways and molecules by these three drugs. These potential mechanisms of drug resistance need to be further explored and validated in the future.
As a major part of the TME, immune infiltrates have been proven to have a great influence on the process of tumour development and immunotherapy responses.66 In our study, the infiltration of various immune cells, such as cytotoxic cells, CD8+ T cells, and DCs, was found to be negatively correlated with NABP2 expression in HCC. DCs are a type of antigen-presenting cell that plays a key role in the development and modulation of anticancer immune responses.67,68 Conventional dendritic cells (cDCs) preferentially activate T cells, which is a foundational step of the “cancer-immunity cycle” outlined by Chen and Mellman.69
Cytotoxic cells, such as cytotoxic T cells, include cytotoxic CD8+ T cells, cytotoxic CD4+ T cells, and other lymphocytes. Cytotoxic CD8+ T cells, which express CD8 on the cell surface, are the most powerful executors of the anticancer immune response.70 Cytotoxic CD4+ T cells also have a strong influence on tumour immunity. Some studies have proven that a deficiency of cytotoxic CD4+ T and cytotoxic CD8+ T cells caused by an increase in regulatory T cells leads to poor survival and a high rate of recurrence in HCC patients.71 Therefore, high expression of NABP2 in hepatocellular carcinoma is very likely to lead to the reduction of infiltration of CDs and cytotoxic T cells, resulting in the impairment of antitumour immunity and consequently the worse outcome of HCC patients.
Through the secretion of cytokines and chemokines, tumour cells and stromal cells within the TME can recruit immunosuppressive cells, such as Tregs, TAMs, MDSCs, and CAFs, which leads to greater difficulty in stimulating and maintaining the antitumour immune response.72 Some studies have reported that the increase in CD4(+) CD25 (+) FoxP3(+) Tregs could impair CD8(+) T-cell effector function and promote liver cancer progression.73,74 Additionally, TAMs and CAFs have been found to regulate the tumour environment to facilitate cancer metastasis and drug resistance.75–78 Other studies have confirmed that MDSCs can suppress the function of T and NK cells while activating Treg cells.79,80 Based on data analysis from the TIMER database, we found that the infiltration levels of MDSCs and CAFs were significantly and positively correlated with NABP2. This might partially explain why elevated NABP2 expression in hepatocellular carcinoma leads to reduced antitumour immunity.
Cancer immunotherapy targeting immunological checkpoints has made significant progress in recent years, opening up new strategies for treating a wide range of malignancies.81 CTLA-4, PD-1 (PDCD1), and PD-L1 (CT274) are the most studied and therapeutically relevant checkpoints in hepatocellular carcinoma and other cancers.82 Immune checkpoints and antiangiogenic medications have been found in recent clinical studies to improve HCC patient survival, and this combination therapy is also employed as the first line of defence against advanced liver cancer.83,84 Identifying immune-related therapeutic target genes in liver cancer may help to further improve the treatment of the disease. Thus, our study further analysed the relationship between NABP2 and immune checkpoints, and a significant positive correlation was found between NABP2 and many common immune checkpoints, including PD-1, PD-L1, and CTLA-4, in HCC. We contemplate that a combination of NABP2 blockade and immunotherapy may result in better antitumour effects.
Using the R package pRRophetic, we then predicted chemotherapy sensitivity based on the expression level of NABP2. According to our findings, some commonly used anticancer drugs were more effective when used on patients with tumours that expressed high levels of NABP2, such as tipifarnib, 5-fluorouracil, dasatinib, gemcitabine, and imatinib.
Finally, we validated the role of NABP2 in HCC with a series of experiments. EdU assays demonstrated that NABP2 could promote the proliferation of hepatocellular carcinoma cells. Wound-healing assays and transwell experiments showed that NABP2 could enhance the migration of liver cancer cells. These experimental results were in line with the results of our bioinformatic analysis.
In conclusion, we mainly explored the relationship between NABP2 and hepatocellular carcinoma through bioinformatics analysis and a few experiments in this study. Immune checkpoints and antiangiogenic medications have been proven to improve HCC patient survival, and this combination therapy is also employed as the first line of defence against advanced liver cancer.83,84 Identifying immune-related therapeutic target genes in liver cancer may help to further improve the treatment of the disease. Therefore, through the analysis of this study, NABP2 may provide a new direction in immunotherapy for liver cancer. However, there are still many limitations. First, the data we utilized for the study came from a range of samples and laboratories, and we analysed the data using multiple statistical approaches and algorithms, which may result in systemic bias. Second, bioinformatics analysis is not the same as experimental validation, and we conducted only a few simple experiments to verify the effect of NABP2 on HCC. However, these experiments are not enough. Only through further experiments can we explore how NABP2 affects HCC development and occurrence. Third, even though our results found a significant correlation between NABP2 and HCC tumour immunity, how NABP2 affects immune infiltration is not clear. This also requires additional experimental verification. Thus, we hope to conduct a more detailed investigation of the mechanism by which NABP2 affects hepatocellular carcinoma through more rational experiments.
Conclusion
In our study, the mRNA and protein expression of NABP2 were found to be significantly upregulated in hepatocellular carcinoma, which was correlated with a poor prognosis. Finally, we proposed NABP2 as a potential biomarker that is associated with the regulation of the immunosuppressive microenvironment and can also be considered as a prognostic indicator for HCC patients.
Data Sharing Statement
The datasets generated for this study could be found in online repositories. The names of the repository/repositories and accession numbers can be found in the article/Supplementary Material.
Ethics Statement
Inclusion of human tissue in this study was approved by the Ethics Committee of the Second Affiliated Hospital of Nanchang University (Nanchang, China). All experiments in our study were undertaken in accordance with The Code of Ethics of the World Medical Association (Declaration of Helsinki).
Acknowledgments
We are grateful to XianTao Academic (https://www.xiantao.love/products) for the assistance with bioinformatics and statistical analysis.
Author Contributions
All authors made a significant contribution to the work reported, whether that is in the conception, study design, execution, acquisition of data, analysis and interpretation, or in all these areas; took part in drafting, revising or critically reviewing the article; gave final approval of the version to be published; have agreed on the journal to which the article has been submitted; and agree to be accountable for all aspects of the work.
Funding
This work was supported by the Project of Jiangxi Provincial Department of Science and Technology (20202BABL206081).
Disclosure
The authors declare that they have no competing interests in this work.
References
1. Sung H, Ferlay J, Siegel RL, et al. Global cancer statistics 2020: GLOBOCAN estimates of incidence and mortality worldwide for 36 cancers in 185 countries. CA Cancer J Clin. 2021;71(3):209–249. doi:10.3322/caac.21660
2. Llovet JM, Kelley RK, Villanueva A, et al. Hepatocellular carcinoma. Nat Rev Dis Primers. 2021;7(1):6. doi:10.1038/s41572-020-00240-3
3. Siegel RL, Miller KD, Jemal A. Cancer statistics, 2020. CA Cancer J Clin. 2020;70(1):7–30. doi:10.3322/caac.21590
4. World Health Organization. International Agency for Research on Cancer. World Health Organization; 2019.
5. Akinyemiju T, Abera S, Ahmed M, et al. The burden of primary liver cancer and underlying etiologies from 1990 to 2015 at the global, regional, and national level: results from the global burden of disease study 2015. JAMA Oncol. 2017;3(12):1683–1691. doi:10.1001/jamaoncol.2017.3055
6. Bruix J, Qin S, Merle P, et al. Regorafenib for patients with hepatocellular carcinoma who progressed on sorafenib treatment (RESORCE): a randomised, double-blind, placebo-controlled, Phase 3 trial. Lancet. 2017;389(10064):56–66. doi:10.1016/s0140-6736(16)32453-9
7. Rizzo A, Nannini M, Novelli M, Dalia Ricci A, Scioscio VD, Pantaleo MA. Dose reduction and discontinuation of standard-dose regorafenib associated with adverse drug events in cancer patients: a systematic review and meta-analysis. Ther Adv Med Oncol. 2020;12:1758835920936932. doi:10.1177/1758835920936932
8. Pinter M, Jain RK, Duda DG. The current landscape of immune checkpoint blockade in hepatocellular carcinoma: a review. JAMA Oncol. 2021;7(1):113–123. doi:10.1001/jamaoncol.2020.3381
9. Cheng AL, Hsu C, Chan SL, Choo SP, Kudo M. Challenges of combination therapy with immune checkpoint inhibitors for hepatocellular carcinoma. J Hepatol. 2020;72(2):307–319. doi:10.1016/j.jhep.2019.09.025
10. Finn RS, Qin S, Ikeda M, et al. Atezolizumab plus bevacizumab in unresectable hepatocellular carcinoma. N Engl J Med. 2020;382(20):1894–1905. doi:10.1056/NEJMoa1915745
11. Rizzo A, Ricci AD, Di Federico A, et al. Predictive biomarkers for checkpoint inhibitor-based immunotherapy in hepatocellular carcinoma: where do we stand? Front Oncol. 2021;11:803133. doi:10.3389/fonc.2021.803133
12. Paquet N, Adams MN, Leong V, et al. hSSB1 (NABP2/ OBFC2B) is required for the repair of 8-oxo-guanine by the hOGG1-mediated base excision repair pathway. Nucleic Acids Res. 2015;43(18):8817–8829. doi:10.1093/nar/gkv790
13. Li Y, Bolderson E, Kumar R, et al. HSSB1 and hSSB2 form similar multiprotein complexes that participate in DNA damage response. J Biol Chem. 2009;284(35):23525–23531. doi:10.1074/jbc.C109.039586
14. Bochkarev A, Bochkareva E. From RPA to BRCA2: lessons from single-stranded DNA binding by the OB-fold. Curr Opin Struct Biol. 2004;14(1):36–42. doi:10.1016/j.sbi.2004.01.001
15. Gamsjaeger R, Kariawasam R, Gimenez AX, et al. The structural basis of DNA binding by the single-stranded DNA-binding protein from Sulfolobus solfataricus. Biochem J. 2015;465(2):337–346. doi:10.1042/bj20141140
16. Iftode C, Daniely Y, Borowiec JA. Replication protein A (RPA): the eukaryotic SSB. Crit Rev Biochem Mol Biol. 1999;34(3):141–180. doi:10.1080/10409239991209255
17. Zou Y, Liu Y, Wu X, Shell SM. Functions of human replication protein A (RPA): from DNA replication to DNA damage and stress responses. J Cell Physiol. 2006;208(2):267–273. doi:10.1002/jcp.20622
18. Dahai Y, Sanyuan S, Hong L, Di Z, Chong Z. A relationship between replication protein A and occurrence and prognosis of esophageal carcinoma. Cell Biochem Biophys. 2013;67(1):175–180. doi:10.1007/s12013-013-9530-y
19. Givalos N, Gakiopoulou H, Skliri M, et al. Replication protein A is an independent prognostic indicator with potential therapeutic implications in colon cancer. Mod Pathol. 2007;20(2):159–166. doi:10.1038/modpathol.3800719
20. Bélanger F, Fortier E, Dubé M, et al. Replication protein A availability during DNA replication stress is a major determinant of cisplatin resistance in ovarian cancer cells. Cancer Res. 2018;78(19):5561–5573. doi:10.1158/0008-5472.Can-18-0618
21. Levidou G, Gakiopoulou H, Kavantzas N, et al. Prognostic significance of replication protein A (RPA) expression levels in bladder urothelial carcinoma. BJU Int. 2011;108(2 Pt 2):E59–E65. doi:10.1111/j.1464-410X.2010.09828.x
22. Wang J, Yang T, Chen H, Li H, Zheng S. Oncogene RPA1 promotes proliferation of hepatocellular carcinoma via CDK4/Cyclin-D pathway. Biochem Biophys Res Commun. 2018;498(3):424–430. doi:10.1016/j.bbrc.2018.02.167
23. Vidhyasagar V, He Y, Guo M, et al. C-termini are essential and distinct for nucleic acid binding of human NABP1 and NABP2. Biochim Biophys Acta. 2016;1860(2):371–383. doi:10.1016/j.bbagen.2015.11.003
24. Xu S, Feng Z, Zhang M, et al. hSSB1 binds and protects p21 from ubiquitin-mediated degradation and positively correlates with p21 in human hepatocellular carcinomas. Oncogene. 2011;30(19):2219–2229. doi:10.1038/onc.2010.596
25. Nusinow DP, Szpyt J, Ghandi M, et al. Quantitative proteomics of the cancer cell line encyclopedia. Cell. 2020;180(2):387–402.e16. doi:10.1016/j.cell.2019.12.023
26. Bartha Á, Győrffy B. TNMplot.com: a web tool for the comparison of gene expression in normal, tumor and metastatic tissues. Int J Mol Sci. 2021;22(5). doi:10.3390/ijms22052622
27. Kolde R. pheatmap: pretty Heatmaps. R package version 1.0. 12. CRAN R-project org/package=pheatmap; 2019.
28. Yu G, Wang LG, Han Y, He QY. clusterProfiler: an R package for comparing biological themes among gene clusters. Omics. 2012;16(5):284–287. doi:10.1089/omi.2011.0118
29. Yu G. enrichplot: visualization of functional enrichment result. R package version 1.10. 2. Molecular Therapy: Nucleic Acids; 2021.
30. Subramanian A, Tamayo P, Mootha VK, et al. Gene set enrichment analysis: a knowledge-based approach for interpreting genome-wide expression profiles. Proc Natl Acad Sci U S A. 2005;102(43):15545–15550. doi:10.1073/pnas.0506580102
31. Szklarczyk D, Gable AL, Lyon D, et al. STRING v11: protein-protein association networks with increased coverage, supporting functional discovery in genome-wide experimental datasets. Nucleic Acids Res. 2019;47(D1):D607–D613. doi:10.1093/nar/gky1131
32. Warde-Farley D, Donaldson SL, Comes O, et al. The GeneMANIA prediction server: biological network integration for gene prioritization and predicting gene function. Nucleic Acids Res. 2010;38(WebServer issue):W214–W320. doi:10.1093/nar/gkq537
33. Shannon P, Markiel A, Ozier O, et al. Cytoscape: a software environment for integrated models of biomolecular interaction networks. Genome Res. 2003;13(11):2498–2504.
34. Hänzelmann S, Castelo R, Guinney J. GSVA: gene set variation analysis for microarray and RNA-seq data. BMC Bioinform. 2013;14:7. doi:10.1186/1471-2105-14-7
35. Li T, Fu J, Zeng Z, et al. TIMER2.0 for analysis of tumor-infiltrating immune cells. Nucleic Acids Res. 2020;48(W1):W509–W514. doi:10.1093/nar/gkaa407
36. Wei T, Simko V, Levy M. package “corrplot”: visualization of a Correlation Matrix. 2017. Version 084; 2021.
37. Wickham H. Reshaping data with the reshape package. J Stat Softw. 2007;21:1–20.
38. Geeleher P, Cox N, Huang RS. pRRophetic: an R package for prediction of clinical chemotherapeutic response from tumor gene expression levels. PLoS One. 2014;9(9):e107468.
39. Reinhold WC, Sunshine M, Liu H, et al. CellMiner: a web-based suite of genomic and pharmacologic tools to explore transcript and drug patterns in the NCI-60 cell line set. Cancer Res. 2012;72(14):3499–3511. doi:10.1158/0008-5472.Can-12-1370
40. Azimi F, Scolyer RA, Rumcheva P, et al. Tumor-infiltrating lymphocyte grade is an independent predictor of sentinel lymph node status and survival in patients with cutaneous melanoma. J Clin Oncol. 2012;30(21):2678–2683. doi:10.1200/jco.2011.37.8539
41. Federico L, McGrail DJ, Bentebibel SE, et al. Distinct tumor-infiltrating lymphocyte landscapes are associated with clinical outcomes in localized non-small-cell lung cancer. Ann Oncol. 2022;33(1):42–56. doi:10.1016/j.annonc.2021.09.021
42. Bindea G, Mlecnik B, Tosolini M, et al. Spatiotemporal dynamics of intratumoral immune cells reveal the immune landscape in human cancer. Immunity. 2013;39(4):782–795. doi:10.1016/j.immuni.2013.10.003
43. Richard DJ, Bolderson E, Khanna KK. Multiple human single-stranded DNA binding proteins function in genome maintenance: structural, biochemical and functional analysis. Crit Rev Biochem Mol Biol. 2009;44(2–3):98–116. doi:10.1080/10409230902849180
44. Richard DJ, Bolderson E, Cubeddu L, et al. Single-stranded DNA-binding protein hSSB1 is critical for genomic stability. Nature. 2008;453(7195):677–681.
45. Ashton NW, Bolderson E, Cubeddu L, O’Byrne KJ, Richard DJ. Human single-stranded DNA binding proteins are essential for maintaining genomic stability. BMC Mol Biol. 2013;14:9. doi:10.1186/1471-2199-14-9
46. Huang J, Gong Z, Ghosal G, Chen J. SOSS complexes participate in the maintenance of genomic stability. Mol Cell. 2009;35(3):384–393. doi:10.1016/j.molcel.2009.06.011
47. Zhang F, Wu J, Yu X. Integrator3, a partner of single-stranded DNA-binding protein 1, participates in the DNA damage response. J Biol Chem. 2009;284(44):30408–30415. doi:10.1074/jbc.M109.039404
48. Bolderson E, Petermann E, Croft L, et al. Human single-stranded DNA binding protein 1 (hSSB1/NABP2) is required for the stability and repair of stalled replication forks. Nucleic Acids Res. 2014;42(10):6326–6336. doi:10.1093/nar/gku276
49. Paquet N, Adams MN, Ashton NW, et al. hSSB1 (NABP2/OBFC2B) is regulated by oxidative stress. Sci Rep. 2016;6:27446. doi:10.1038/srep27446
50. Skaar JR, Ferris AL, Wu X, et al. The Integrator complex controls the termination of transcription at diverse classes of gene targets. Cell Res. 2015;25(3):288–305. doi:10.1038/cr.2015.19
51. Gu P, Deng W, Lei M, Chang S. Single strand DNA binding proteins 1 and 2 protect newly replicated telomeres. Cell Res. 2013;23(5):705–719. doi:10.1038/cr.2013.31
52. Xu S, Wu Y, Chen Q, et al. hSSB1 regulates both the stability and the transcriptional activity of p53. Cell Res. 2013;23(3):423–435. doi:10.1038/cr.2012.162
53. Lin Y, Chahal HS, Wu W, et al. Association study of genetic variation in DNA repair pathway genes and risk of basal cell carcinoma. Int J Cancer. 2017;141(5):952–957. doi:10.1002/ijc.30786
54. Forner A, Reig M, Bruix J. Hepatocellular carcinoma. Lancet. 2018;391(10127):1301–1314. doi:10.1016/s0140-6736(18)30010-2
55. Quail DF, Joyce JA. Microenvironmental regulation of tumor progression and metastasis. Nat Med. 2013;19(11):1423–1437. doi:10.1038/nm.3394
56. Ho AL, Brana I, Haddad R, et al. Tipifarnib in head and neck squamous cell carcinoma with HRAS mutations. J Clin Oncol. 2021;39(17):1856–1864. doi:10.1200/jco.20.02903
57. Bariwal J, Kumar V, Dong Y, Mahato RI. Design of Hedgehog pathway inhibitors for cancer treatment. Med Res Rev. 2019;39(3):1137–1204. doi:10.1002/med.21555
58. Sztiller-Sikorska M, Czyz M. Parthenolide as cooperating agent for anti-cancer treatment of various malignancies. Pharmaceuticals. 2020;13(8). doi:10.3390/ph13080194
59. Li P, Zhao QL, Jawaid P, et al. Enhancement of hyperthermia-induced apoptosis by 5Z-7-oxozeaenol, a TAK1 inhibitor, in Molt-4 cells. Int J Hyperthermia. 2017;33(4):411–418. doi:10.1080/02656736.2017.1278629
60. Ninomiya-Tsuji J, Kajino T, Ono K, et al. A resorcylic acid lactone, 5Z-7-oxozeaenol, prevents inflammation by inhibiting the catalytic activity of TAK1 MAPK kinase kinase. J Biol Chem. 2003;278(20):18485–18490. doi:10.1074/jbc.M207453200
61. Subbiah V, Lassen U, Élez E, et al. Dabrafenib plus trametinib in patients with BRAF(V600E)-mutated biliary tract cancer (ROAR): a Phase 2, open-label, single-arm, multicentre basket trial. Lancet Oncol. 2020;21(9):1234–1243. doi:10.1016/s1470-2045(20)30321-1
62. Planchard D, Smit EF, Groen HJM, et al. Dabrafenib plus trametinib in patients with previously untreated BRAF(V600E)-mutant metastatic non-small-cell lung cancer: an open-label, phase 2 trial. Lancet Oncol. 2017;18(10):1307–1316. doi:10.1016/s1470-2045(17)30679-4
63. Subbiah V, Kreitman RJ, Wainberg ZA, et al. Dabrafenib plus trametinib in patients with BRAF V600E-mutant anaplastic thyroid cancer: updated analysis from the Phase II ROAR basket study. Ann Oncol. 2022;33(4):406–415. doi:10.1016/j.annonc.2021.12.014
64. Wu X, Luo F, Li J, Zhong X, Liu K. Tankyrase 1 inhibitior XAV939 increases chemosensitivity in colon cancer cell lines via inhibition of the Wnt signaling pathway. Int J Oncol. 2016;48(4):1333–1340. doi:10.3892/ijo.2016.3360
65. Shetti D, Zhang B, Fan C, Mo C, Lee BH, Wei K. Low dose of paclitaxel combined with XAV939 attenuates metastasis, angiogenesis and growth in breast cancer by suppressing wnt signaling. Cells. 2019;8(8). doi:10.3390/cells8080892
66. Balkwill FR, Capasso M, Hagemann T. The tumor microenvironment at a glance. J Cell Sci. 2012;125(Pt 23):5591–5596. doi:10.1242/jcs.116392
67. Wculek SK, Cueto FJ, Mujal AM, Melero I, Krummel MF, Sancho D. Dendritic cells in cancer immunology and immunotherapy. Nat Rev Immunol. 2020;20(1):7–24. doi:10.1038/s41577-019-0210-z
68. Kvedaraite E, Ginhoux F. Human dendritic cells in cancer. Sci Immunol. 2022;7(70):eabm9409. doi:10.1126/sciimmunol.abm9409
69. Chen DS, Mellman I. Oncology meets immunology: the cancer-immunity cycle. Immunity. 2013;39(1):1–10. doi:10.1016/j.immuni.2013.07.012
70. Raskov H, Orhan A, Christensen JP, Gögenur I. Cytotoxic CD8(+) T cells in cancer and cancer immunotherapy. Br J Cancer. 2021;124(2):359–367. doi:10.1038/s41416-020-01048-4
71. Fu J, Zhang Z, Zhou L, et al. Impairment of CD4+ cytotoxic T cells predicts poor survival and high recurrence rates in patients with hepatocellular carcinoma. Hepatology. 2013;58(1):139–149. doi:10.1002/hep.26054
72. Junttila MR, de Sauvage FJ. Influence of tumour micro-environment heterogeneity on therapeutic response. Nature. 2013;501(7467):346–354. doi:10.1038/nature12626
73. Fu J, Xu D, Liu Z, et al. Increased regulatory T cells correlate with CD8 T-cell impairment and poor survival in hepatocellular carcinoma patients. Gastroenterology. 2007;132(7):2328–2339. doi:10.1053/j.gastro.2007.03.102
74. Pedroza-Gonzalez A, Verhoef C, Ijzermans JN, et al. Activated tumor-infiltrating CD4+ regulatory T cells restrain antitumor immunity in patients with primary or metastatic liver cancer. Hepatology. 2013;57(1):183–194. doi:10.1002/hep.26013
75. Riabov V, Gudima A, Wang N, Mickley A, Orekhov A, Kzhyshkowska J. Role of tumor associated macrophages in tumor angiogenesis and lymphangiogenesis. Front Physiol. 2014;5:75. doi:10.3389/fphys.2014.00075
76. Weichand B, Popp R, Dziumbla S, et al. S1PR1 on tumor-associated macrophages promotes lymphangiogenesis and metastasis via NLRP3/IL-1β. J Exp Med. 2017;214(9):2695–2713. doi:10.1084/jem.20160392
77. Fiori ME, Di Franco S, Villanova L, Bianca P, Stassi G, De Maria R. Cancer-associated fibroblasts as abettors of tumor progression at the crossroads of EMT and therapy resistance. Mol Cancer. 2019;18(1):70. doi:10.1186/s12943-019-0994-2
78. Zhang H, Deng T, Liu R, et al. CAF secreted miR-522 suppresses ferroptosis and promotes acquired chemo-resistance in gastric cancer. Mol Cancer. 2020;19(1):43. doi:10.1186/s12943-020-01168-8
79. Hoechst B, Voigtlaender T, Ormandy L, et al. Myeloid derived suppressor cells inhibit natural killer cells in patients with hepatocellular carcinoma via the NKp30 receptor. Hepatology. 2009;50(3):799–807. doi:10.1002/hep.23054
80. Kalathil S, Lugade AA, Miller A, Iyer R, Thanavala Y. Higher frequencies of GARP(+)CTLA-4(+)Foxp3(+) T regulatory cells and myeloid-derived suppressor cells in hepatocellular carcinoma patients are associated with impaired T-cell functionality. Cancer Res. 2013;73(8):2435–2444. doi:10.1158/0008-5472.Can-12-3381
81. Pardoll DM. The blockade of immune checkpoints in cancer immunotherapy. Nat Rev Cancer. 2012;12(4):252–264. doi:10.1038/nrc3239
82. Xu F, Jin T, Zhu Y, Dai C. Immune checkpoint therapy in liver cancer. J Exp Clin Cancer Res. 2018;37(1):110. doi:10.1186/s13046-018-0777-4
83. Viscardi G, Tralongo AC, Massari F, et al. Comparative assessment of early mortality risk upon immune checkpoint inhibitors alone or in combination with other agents across solid malignancies: a systematic review and meta-analysis. Eur J Cancer. 2022;177:175–185. doi:10.1016/j.ejca.2022.09.031
84. Kelley RK. Atezolizumab plus Bevacizumab - a landmark in liver cancer. N Engl J Med. 2020;382(20):1953–1955. doi:10.1056/NEJMe2004851
 © 2023 The Author(s). This work is published and licensed by Dove Medical Press Limited. The full terms of this license are available at https://www.dovepress.com/terms.php and incorporate the Creative Commons Attribution - Non Commercial (unported, v3.0) License.
By accessing the work you hereby accept the Terms. Non-commercial uses of the work are permitted without any further permission from Dove Medical Press Limited, provided the work is properly attributed. For permission for commercial use of this work, please see paragraphs 4.2 and 5 of our Terms.
© 2023 The Author(s). This work is published and licensed by Dove Medical Press Limited. The full terms of this license are available at https://www.dovepress.com/terms.php and incorporate the Creative Commons Attribution - Non Commercial (unported, v3.0) License.
By accessing the work you hereby accept the Terms. Non-commercial uses of the work are permitted without any further permission from Dove Medical Press Limited, provided the work is properly attributed. For permission for commercial use of this work, please see paragraphs 4.2 and 5 of our Terms.