")
Back to Journals » International Journal of General Medicine » Volume 14
Comprehensive Analysis of LPCATs Highlights the Prognostic and Immunological Values of LPCAT1/4 in Hepatocellular Carcinoma
Authors Lin T , Zhang E, Lin Z, Peng L
Received 21 October 2021
Accepted for publication 18 November 2021
Published 30 November 2021 Volume 2021:14 Pages 9117—9130
DOI https://doi.org/10.2147/IJGM.S344723
Checked for plagiarism Yes
Review by Single anonymous peer review
Peer reviewer comments 2
Editor who approved publication: Dr Scott Fraser
Tong Lin,1 E Zhang,1 Zhimei Lin,1 Lisheng Peng2
1The Fourth Clinical Medical School, Guangzhou University of Chinese Medicine, Shenzhen, People’s Republic of China; 2Department of Science and Education, Shenzhen Traditional Chinese Medicine Hospital, Shenzhen, People’s Republic of China
Correspondence: Lisheng Peng
Department of Science and Education, Shenzhen Traditional Chinese Medicine Hospital, No. 1 Fuhua Road, Futian District, Shenzhen, Guangdong Province, People’s Republic of China
Email [email protected]
Background: The prognosis of patients with advanced hepatocellular carcinoma (HCC) remains poor. Lipid remodeling modulators are considered promising therapeutic targets of cancers, owing to their functions of facilitating cancer cells’ adaption to the limited environment. Lysophosphatidylcholine acyltransferases (LPCATs) are enzymes regulating bio-membrane remodeling, whose roles in HCC have not been fully illuminated.
Methods: Multiple bioinformatic tools were applied to comprehensively evaluate the expression, genetic alterations, clinical relevance, prognostic values, DNA methylation, biological functions, and correlations with immune infiltration of LPCATs in HCC.
Results: We found LPCAT1 was significantly overexpressed and the most frequently altered in HCC. The high-expression of LPCAT1/4 indicated clinicopathological advancements and poor prognoses of HCC patients. Even though the global DNA methylation of LPCATs in HCC showed no significant difference with that in normal liver, the hypermethylation of numerous CpG sites of them implied worse survivals of HCC patients. Thirty LPCATs’ interactive genes were identified, which were generally membrane components and partook in phospholipid metabolism pathways. Finally, we found the expression of LPCATs was extensively positively correlated with the infiltration of various stimulatory and suppressive tumor-infiltrating immune cells (TIICs) in the tumor microenvironment.
Conclusion: This study addressed LPCAT1/4 were potential prognostic and immunotherapeutic biomarkers of HCC targeting bio-membrane lipid remodeling.
Keywords: hepatocellular carcinoma, LPCATs, bioinformatics, biomarker, immune infiltration
Introduction
Hepatocellular carcinoma (HCC) is one of the most prevalent and fatal cancers worldwide. Most HCC patients are diagnosed at advanced stages and miss opportunities for curative remedies. Despite appreciable progress has been achieved in systematic treatments, especially molecular target agents and immune checkpoint inhibitors, the overall clinical benefits are still unsatisfying. The prognosis of patients with advanced HCC remains poor, with a 5-year survival rate of 12%.1 Thus, there are urgent calls for effective diagnostic and therapeutic targets of HCC.
Metabolic reprogramming is a hallmark of cancers, especially the enhancement of aerobic glycolysis and glutaminolysis in cancer cells. Recently, lipid remodeling has attracted rising attention for its participation in cancer promotion.
Lysophosphatidylcholine acyltransferases (LPCATs) are enzymes catalyzing lysophosphatidylcholine (LPC) to phosphatidylcholine (PC) conversion, which comprises four isoforms (LPCAT1-4) in humans.2,3 PCs are the most abundant constituents of cellular membrane lipids. PC metabolic dysregulation and subsequent membrane composition alterations are observed in various cancers, which can provide energy, signaling molecule substrates, and epigenetic regulators to conduce cancer cells’ adaptation to the local tumor microenvironment (TME).4,5 In view of the importance of LPCATs in PC generation, it was not surprising that some studies suggested LPCATs contributed to cancer development.
LPCAT1 is essential for pulmonary surfactant homeostasis, which had been observed to be upregulated and might indicate negative outcomes for several malignancies, including kidney,3 breast,7 prostate,8 and liver cancers.9 Lipid droplet accumulation regulated by LPCAT2 might drive chemoresistance and curtailment of cancer immunogenicity in colorectal cancer patients.10 LPCAT3 regulates very-low-density lipoprotein secretion and intestinal lipid absorption, whose deficiency would increase cholesterol biosynthesis and promote tumorigenesis in mice.11 LPCAT4 was ever found overexpressed in colorectal cancer, too.12 However, the specific clinical, prognostic values, and potential regulatory mechanisms of every LPCAT member in HCC have not been fully elucidated yet.
Cell behaviors are modulated by both genetic and epigenetic mechanisms, and DNA methylation is a type of most studied epigenetic alteration concerning the ordination and promotion of HCC.13 In addition, emerging researches have shed light on the crosstalk between aberrant lipid metabolism and the immune microenvironment in HCC.14
In this study, we comprehensively analyzed the expression, genetic alterations, clinical relevance, prognostic significance, DNA methylation, correlations with immune infiltration, and underlying functional mechanisms of LPCATs in HCC. The findings of our study might help to deepen the understanding of LPCATs in HCC, and inspire lipid metabolism-targeting insights for further investigations and therapeutic strategies.
Materials and Methods
Analysis of the mRNA Expression of LPCATs in HCC
Oncomine (https://www.oncomine.org) is an analytic tool integrating published transcriptome data of over 18,000 cancer microarrays.15 A meta-analysis of the differential mRNA expression of LPCATs in HCC versus normal liver tissues was performed using Oncomine, with the significance threshold of fold change >2.0, P value <0.05, and a gene rank of top 10%.
Gene Expression Profiling Interactive Analysis 2 (GEPIA2, http://gepia2.cancerpku.cn/) provides comprehensive transcriptomic analysis using mRNA sequencing data from Cancer Genome Atlas (TCGA) and GTEx projects.16 The mRNA expression of LPCATs in HCC and normal liver samples was confirmed using GEPIA2, and the significance criteria were set as fold change >2 and P value <0.05.
Analysis of the Protein Expression of LPCATs in HCC
The protein expression of LPCATs in HCC and normal liver tissues was evaluated using immunohistochemistry (IHC) staining data from the Human Protein Atlas (HPA) (https://www.proteinatlas.org).17 Protein expression levels were measured by the intensity and quantity of IHC staining, and were categorized into four grades: negative, weak, medium, and strong.
Analysis of Genetic Alterations of LPCATs in HCC
cBioPortal (http://www.cbioportal.org) is a web platform providing visual and multidimensional cancer genomics resources.18,19 Genetic alterations of LPCATs including mutations, copy-number alterations, and mRNA expression (z-scores relative to diploid samples with a score threshold of ± 2.0) were analyzed using the data of 360 HCC samples from “TCGA, Firehose Legacy” dataset by cBioPortal. To discover the survival significance of LPCATs’ global alteration on HCC patients, the overall survival (OS) and disease-free survival (DFS) of patients between “altered” and “unaltered” groups were compared respectively.
Analysis of the Clinicopathological Relevance of LPCATs in HCC Patients
UALCAN(http://ualcan.path.uab.edu)20 and LinkedOmics(http://www.linkedomics.org)21 are both online tools providing in-depth cancer omics analysis based on TCGA data. Relationships between LPCATs expression and pathological stages and tumor grades of HCC patients were explored using UALCAN. Associations between LPCATs expression and TNM stages were analyzed using LinkedOmics.
Analysis of the Prognostic Significance of LPCATs in HCC Patients
Kaplan–Meier (KM) plotter (http://www.kmplot.com/) is a widely used platform for survival analysis of 54k genes in various cancers.22 KM plotter was applied to evaluate associations between LPCATs expression and OS, relapse-free survival (RFS), progression-free survival (PFS), and disease-specific survival (DSS) of all HCC patients. Furthermore, associations between LPCATs expression and OS of HCC patients with distinct clinicopathological features were assessed.
Analysis of DNA Methylation of LPCATs in HCC
Comparison of global DNA methylation levels of LPCATs and methylation levels of cytosine-phosphate-guanine (CpG) sites between HCC and normal controls was performed integrating two tools, DNA Methylation Interactive Visualization Database (DNMIVD, http://www.unimd.org/dnmivd/)23 and SurvivalMeth (http://biobigdata.hrbmu.edu.cn/survivalmeth/).24 Effects of methylation levels of LPCATs’ CpG sites on OS of HCC patients was evaluated using MethSurv (https://biit.cs.ut.ee/methsurv/).25
Genetic Interactions, Protein–Protein Interactions, and Functional Enrichment Analysis of LPCATs
Interactive genes of LPCATs were investigated using GeneMANIA (http://genemania.org).26 Next, protein–protein interaction (PPI) analysis for LPCATs and their interactive genes was conducted using the Search Tool for the Retrieval of Interacting Genes (STRING, https://string-db.org), with the settings of “homo sapiens” and a minimum interaction score of 0.4. The PPI network was visualized using Cytoscape software (version 3.7.0), and five core genes were identified using the CytoHubba plugin, according to their degree values in the network. Furthermore, the expression of the core genes and their correlations with LPCATs in HCC were analyzed using GEPIA2.
Gene Ontology (GO) and Kyoto Encyclopedia of Genes and Genomes (KEGG) pathway enrichment analyses were carried out for LPCATs and their interactive genes using Database for Annotation, Visualization, and Integrated Discovery (DAVID) server (https://david.ncifcrf.gov/home.jsp).27 GO functional annotation describes genes’ functions in biological process (BP), cellular component (CC), and molecular function (MF) aspects.
Analysis of Correlations Between LPCATs Expression and Immune Infiltration in HCC
Tumor IMmune Estimation Resource (TIMER, http://timer.cistrome.org) is a web server for the investigation of tumor-immune interactions, covering 32 TCGA cancer types.28 Correlations between LPCATs expression and infiltration levels of diverse tumor-infiltrating immune cells (TIICs), including CD8+ T cells, CD4+ T cells, neutrophils, macrophages, B cells, myeloid dendritic cells (mDCs), regulatory T cells (Tregs), and myeloid-derived suppressor cells (MDSCs) in the TME of HCC were analyzed using TIMER. Besides, correlations between the expression of LPCATs and biomarkers of some TIICs were analyzed using GEPIA2.
Statistical Analysis
Comparison of the mRNA expression of a gene between any two groups was performed using Student’s t-test (Oncomine and UALCAN), one-way ANOVA test (GEPIA), or Kruskal–Wallis test (LinkedOmics). For survival analysis, all cases were split into two groups by the median of expression levels or DNA methylation beta values of a gene. KM curves and Log rank test were used to identify differences between two groups and calculate P values. Then, Cox proportional hazards regression was performed to generate hazard ratio (HR) and 95% confidence interval (CI). Correlations between any two genes were evaluated using Pearson test. Correlations between gene expression and infiltration levels of TIICs were analyzed using Spearman’s test. Correlation strengths were measured by correlation coefficient (r): 0.00–0.19 was very weak, 0.20–0.39 was weak, 0.40–0.59 was moderate, 0.60–0.79 was strong, and 0.80−1.0 was very strong.29,30 All tests were two-tailed paired and P values <0.05 were considered statistically significant. Besides, false discovery rate (FDR) <0.05 was an additional criterion for functional enrichment analysis.
Results
Expression of LPCATs in HCC and Normal Liver Tissues
Initially, a meta-analysis of the differential expression of LPCATs in HCC versus normal liver tissues was performed using Oncomine. As shown in Figure 1A and Table 1, LPCAT1 was significantly higher expressed in HCC than normal liver tissues in the three datasets, while no significant difference referring LPCAT2-4 was found. Additionally, the up-expression of LPCAT1 was identified in multitudinous datasets of other cancers. Given the results from GEPIA, although LPCAT1/2/4 were higher expressed in HCC than normal controls, only the difference of LPCAT1 showed statistical significance (Figure 1B). Nevertheless, LPCAT3 expressed similarly between two kinds of tissues.
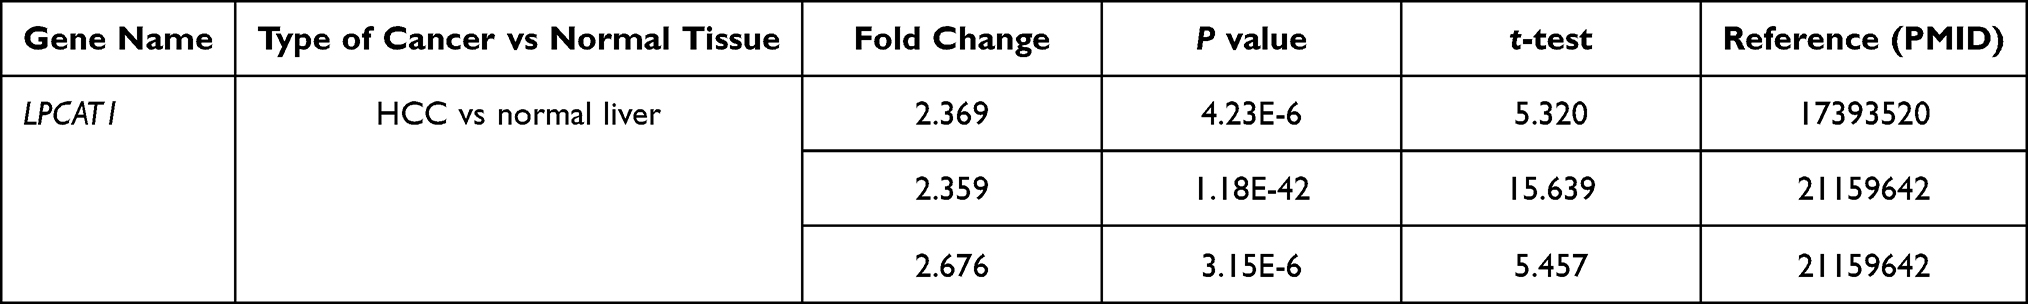 |
Table 1 Comparison of LPCAT1 Expression Between HCC and Normal Liver Tissues (Oncomine) |
 |
Figure 1 The mRNA expression of LPCATs in HCC and normal liver tissues. (A) A summary of the datasets in which LPCATs were significantly up- (red) or down- (blue) expressed in various cancers, compared with the corresponding normal liver tissues (Oncomine). Numbers in colored cells represent the counts of datasets. The color of cells is paralleled with the best gene rank percentile for the analyses within the cell. (B) The mRNA expression of LPCATs in HCC and normal liver samples (GEPIA2). *P < 0.05. Abbreviation: TPM, transcript per million. |
Next, the protein expression of LPCATs in HCC and normal liver was further validated using IHC data. Except for the absence of LPCAT3 data, LPCAT1/2/4 proteins were expressed strongly, moderately, and strongly in HCC tissues, respectively, while those were expressed weakly, weakly, and moderately in normal liver tissues, respectively (Supplementary Figure 1). Thus, consistent with their mRNA expression, LPCAT1/2/4 proteins were elevated in HCC, compared with normal liver.
Genetic Alterations of LPCATs in HCC
Genetic alterations of LPCATs in HCC patients were analyzed using cBioPortal. Overall, six types of alterations, including mutations of missense, splice, and truncating; copy-number alterations of amplification and deep deletion; also, mRNA overexpression of LPCATs were observed in a total of 78 out of 360 (21.67%) HCC samples (Figure 2A). The most frequent alteration was mRNA overexpression, which occurred in 56 of all the cases (15.56%). And LPCAT1 has the highest alteration frequency of 9.72%. However, the overall genetic alteration of LPCATs had no significant association with OS and DFS of HCC patients (Figure 2B and C).
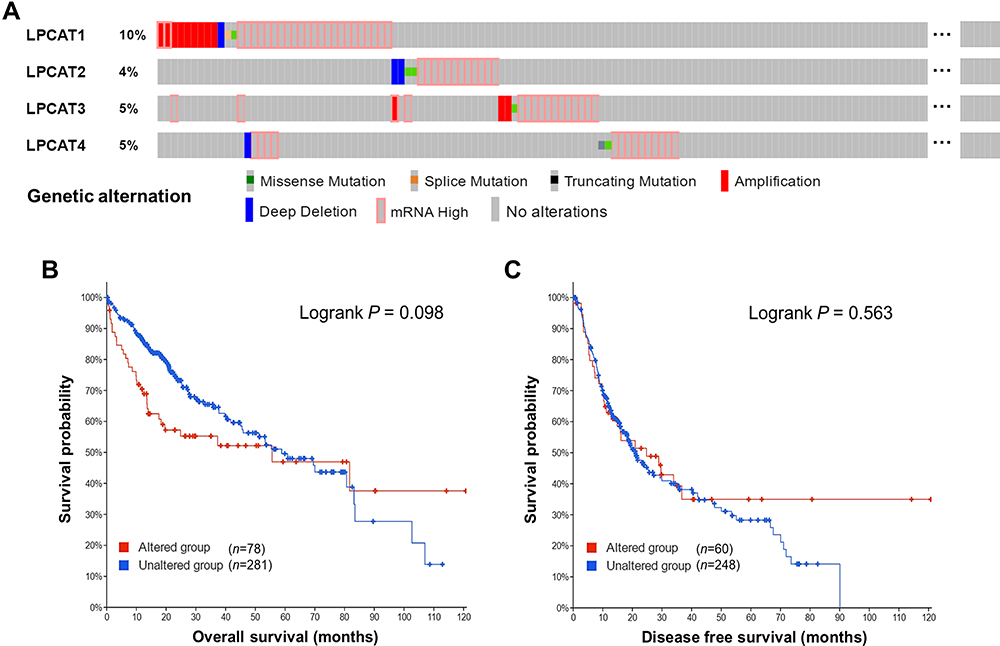 |
Figure 2 Genetic alterations of LPCATs in HCC. (A) An overview of the genetic alterations of LPCATs occurring in HCC samples. (B and C) The impacts of the overall genetic alteration of LPCATs on (B) OS and (C) DFS of HCC patients (cBioPortal). Abbreviations: OS, overall survival; DFS, disease-free survival. |
 |
Figure 3 Associations between LPCATs expression and distinct clinicopathological features of HCC patients. The expression of LPCAT1-4 in HCC patients with diverse (A–D) pathological stages and (E–H) tumor grades (UALCAN). *P < 0.05, **P < 0.01, ***P < 0.001. The expression of (I) LPCAT1 and (J) LPCAT4 in HCC patients in different pathologic T stages (LinkedOmics). |
Clinicopathological Relevance of LPCATs in HCC Patients
Since pathological stages and tumor histological grades were critical factors determining patients’ outcomes, we subsequently investigated associations of LPCATs expression with these clinicopathological characteristics of HCC patients. Generally, LPCATs expression was significantly increased in most stages and tumor grades of HCC, compared with normal liver samples (P < 0.05) (Figure 3A–H). The expression of LPCAT1 (Figure 3A) and LPCAT4 (Figure 3D) in HCC samples was significantly raised as the stages advanced from I to III and was also associated with pathologic T stage progression (P < 0.01) (Figure 3I and J). However, relationships between LPCATs expression and N/M stages could not be analyzed for insufficient sample sizes of positive groups (Supplementary Figure 2). Moreover, LPCAT4 expression was significantly elevated grade by grade in HCC samples (P < 0.05) (Figure 3H). And LPCAT2 expression was significantly higher in Grade-3 tumors than that in Grade-2 ones (P < 0.05) (Figure 3F). Briefly, the high-expression of LPCAT1/4 displayed significant clinicopathological relevance in HCC patients.
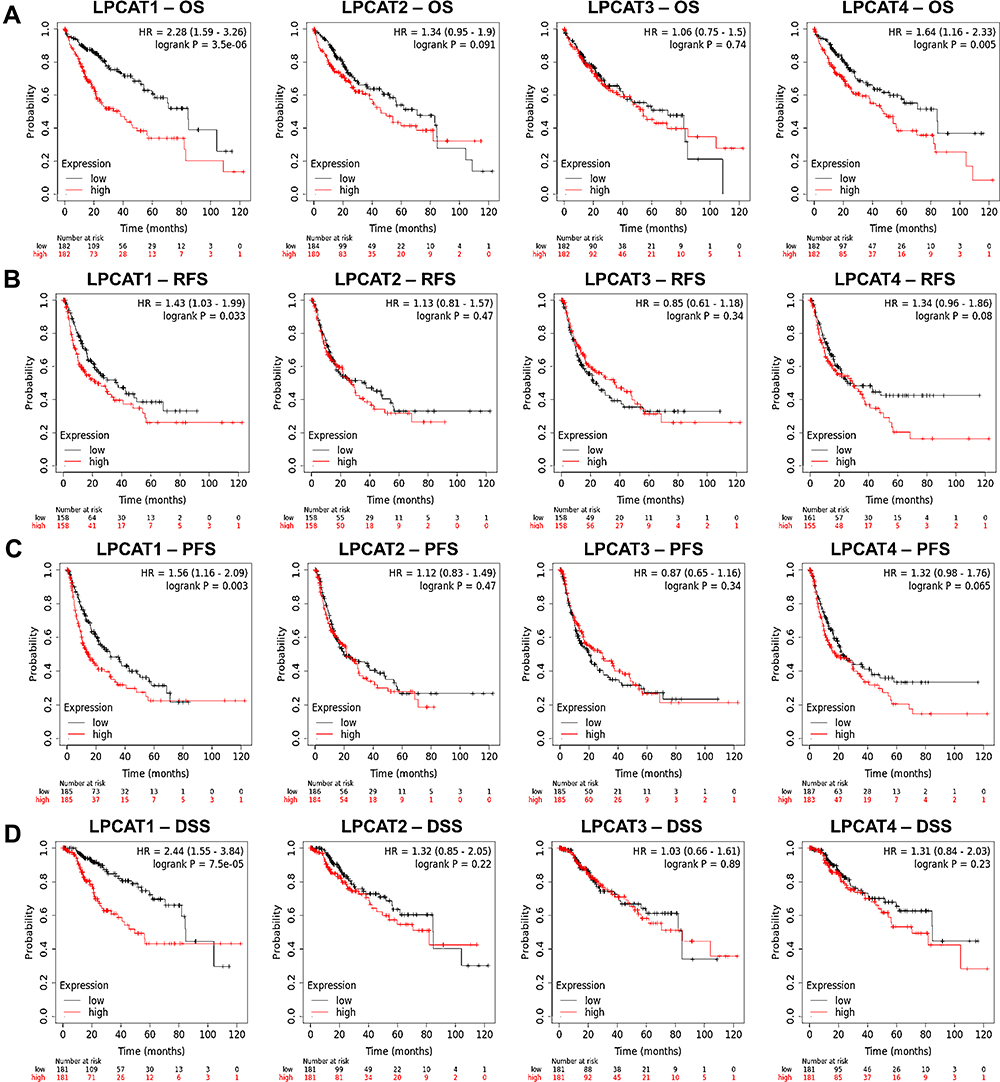 |
Figure 4 Prognostic significance of LPCATs in HCC patients. Associations between LPCATs expression with (A) OS, (B) RFS, (C) PFS, and (D) DSS of HCC patients (KM plotter). Abbreviations: OS, overall survival; RFS, relapse-free survival; PFS, progression-free survival; DSS, disease-specific survival; HR, hazard ratio. |
Prognostic Values of LPCATs in HCC Patients
Following, associations between LPCATs expression and survivals of all HCC patients were explored using KM plotter. It turned out that LPCAT1 high-expression was significantly associated with bad OS (HR = 2.28, P = 3.5E-6), RFS (HR = 1.43, P = 0.033), PFS (HR = 1.56, P = 0.003), and DSS (HR = 2.44, P=7.5E-5) of HCC patients. LPCAT4 high-expression was linked with unfavorable OS (HR = 1.64, P=0.05) of all HCC patients. Nevertheless, no prognostic significance was found for LPCAT2/3 (Figure 4).
Relationships between LPCATs expression and OS of HCC patients with diverse clinicopathological parameters were further assessed. We found LPCAT1 upregulation indicated unfavorable OS of HCC patients, regardless of genders, pathological stages, tumor grades, and alcohol intakes; also, patients without hepatitis history. The overexpression of LPCAT4 suggested worse OS of male HCC patients, and patients with Grade-2 tumors, or alcohol intakes, or without a hepatitis history. Additionally, high-expressed LPCAT3 was related to worse OS of HCC patients with Grade-2 tumors (Table 2).
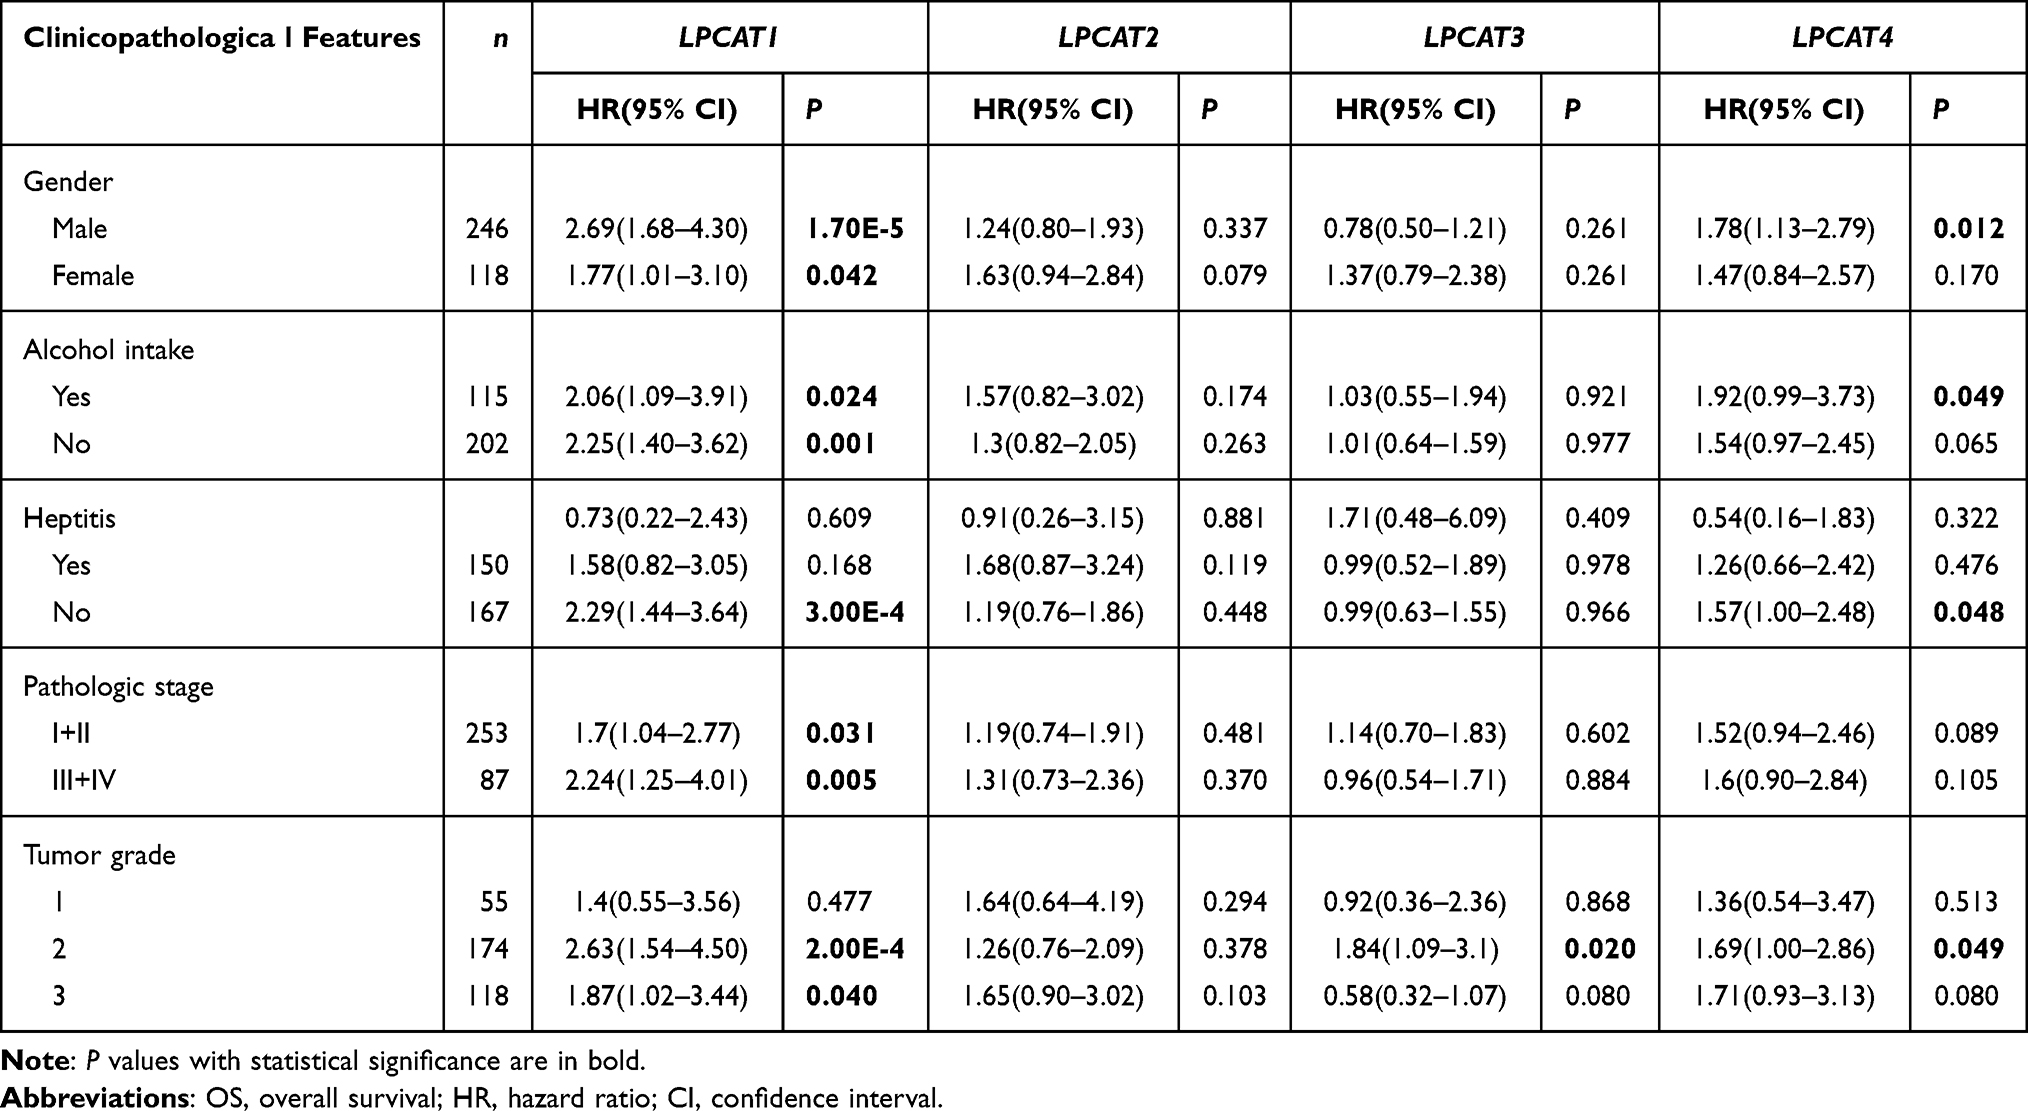 |
Table 2 Associations Between LPCATs Expression and OS of HCC Patients with Diverse Clinicopathological Features |
Prognostic Impacts of DNA Methylation of LPCATs on HCC Patients
Since DNA methylation alterations affect biological behaviors and clinical outcomes of HCC patients.31 We subsequently investigated correlations between LPCATs’ methylation and their expression, and patients’ survivals. In terms of the global DNA methylation of LPCATs, LPCAT1/3/4 were almost unmethylated; LPCAT2 was hypermethylated with a beta value of about 0.9 in both HCC and normal liver samples, but no significant difference was found between the two tissues (Supplementary Figure 3A). Moreover, the DNA methylation of LPCAT2/4 was significantly negatively correlated with their expression in HCC (Supplementary Figure 3B).
In terms of the methylation of CpG sites, three CpG sites of LPCAT1, five CpG sites of LPCAT2, two CpG sites of LPCAT3, and one CpG site of LPCAT4 were significantly hypermethylated, while 53 CpG sites of LPCAT1, four CpG sites of LPCAT2, six CpG sites of LPCAT3, and four CpG sites of LPCAT4 were significantly hypomethylated in HCC, compared with normal liver samples (Supplementary Table 1). Among them, the hypermethylation of 10 CpG sites of LPCAT1, one CpG site of LPCAT2, five CpG sites of LPCAT3, and two CpG sites of LPCAT4 was significantly associated with worse OS of HCC patients; while one CpG site of LPCAT3 did oppositely (Figure 5). Additionally, methylation levels of these CpG sites were slightly higher in normal liver than HCC tissues (Supplementary Table 1).
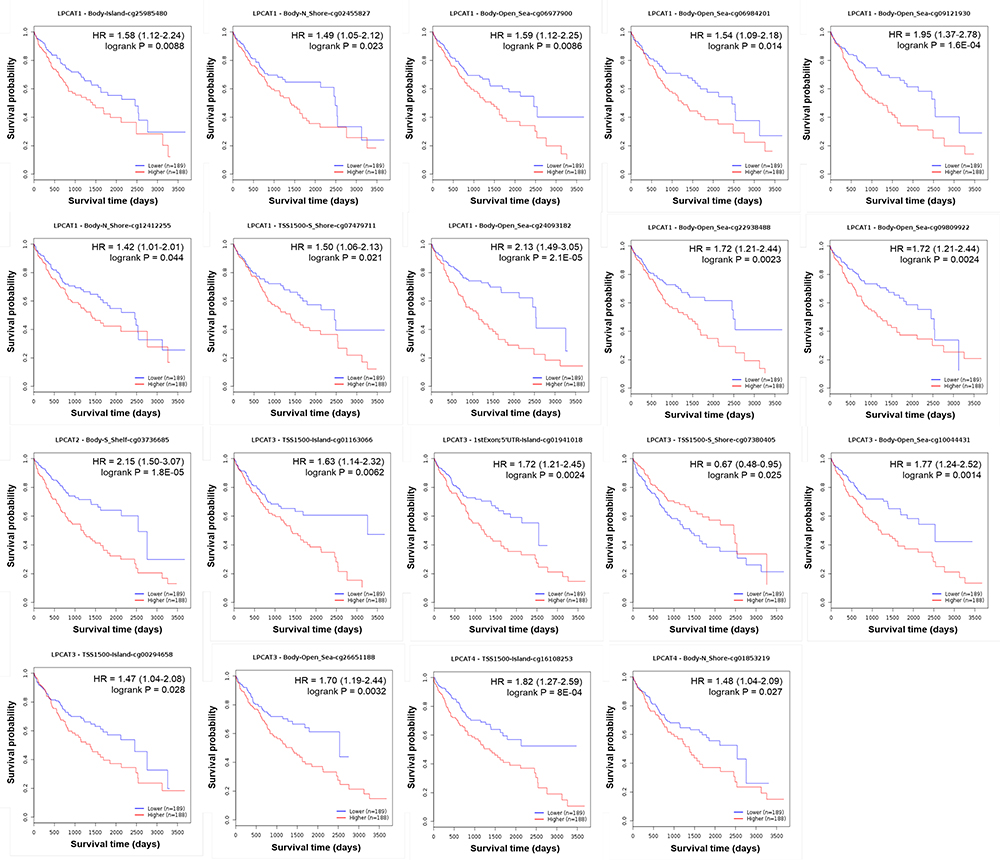 |
Figure 5 Prognostic significance of the methylated CpG sites of LPCATs on OS of HCC patients (MethSurv). Abbreviation: HR, hazard ratio. |
Putative Functions of the Gene Interaction Network of LPCATs
To learn potential functional mechanisms of LPCATs in HCC, 30 interactive genes of LPCATs were identified based on physical interactions, co-expression, and protein domain sharing (Figure 6A). Then, a PPI network was constructed with the 34 interactive genes (Figure 6B). In the PPI network, membrane bound O-acyltransferase domain containing 1 (MBOAT1), 1-acylglycerol-3-phosphate O-acyltransferase 4/3/1 (AGPAT4/3/1), and glycerol-3-phosphate acyltransferase, mitochondrial (GPAM) turned out to be the core genes (Figure 6C and Table 3). Among these core genes, AGPAT1 was significantly up-expressed in HCC, compared with normal controls (Supplementary Figure 4). The following analyses revealed that LPCAT1 and LPCAT4 had the closest correlation with each other, with an r value over 0.6 (P = 2.1E−44). And the correlations between LPCATs and the five core genes ranged from weak to moderate (Figure 6D).
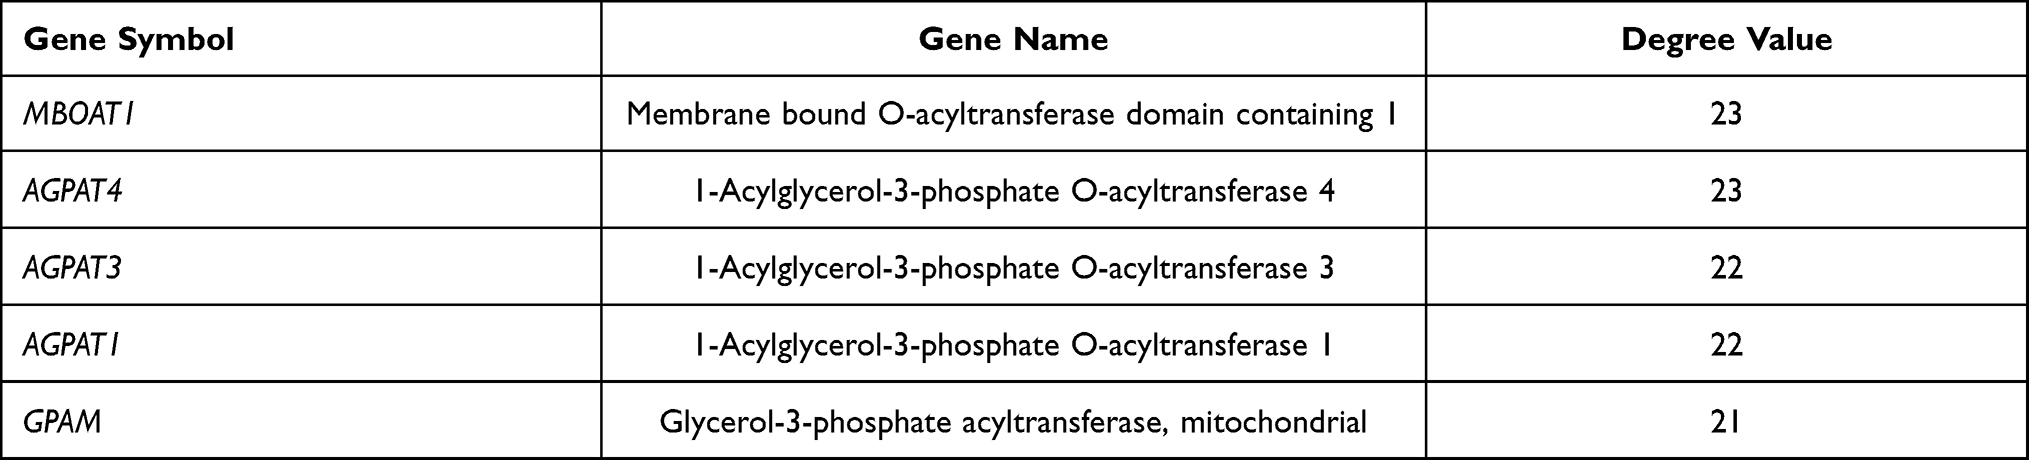 |
Table 3 The Core Genes in the PPI Network |
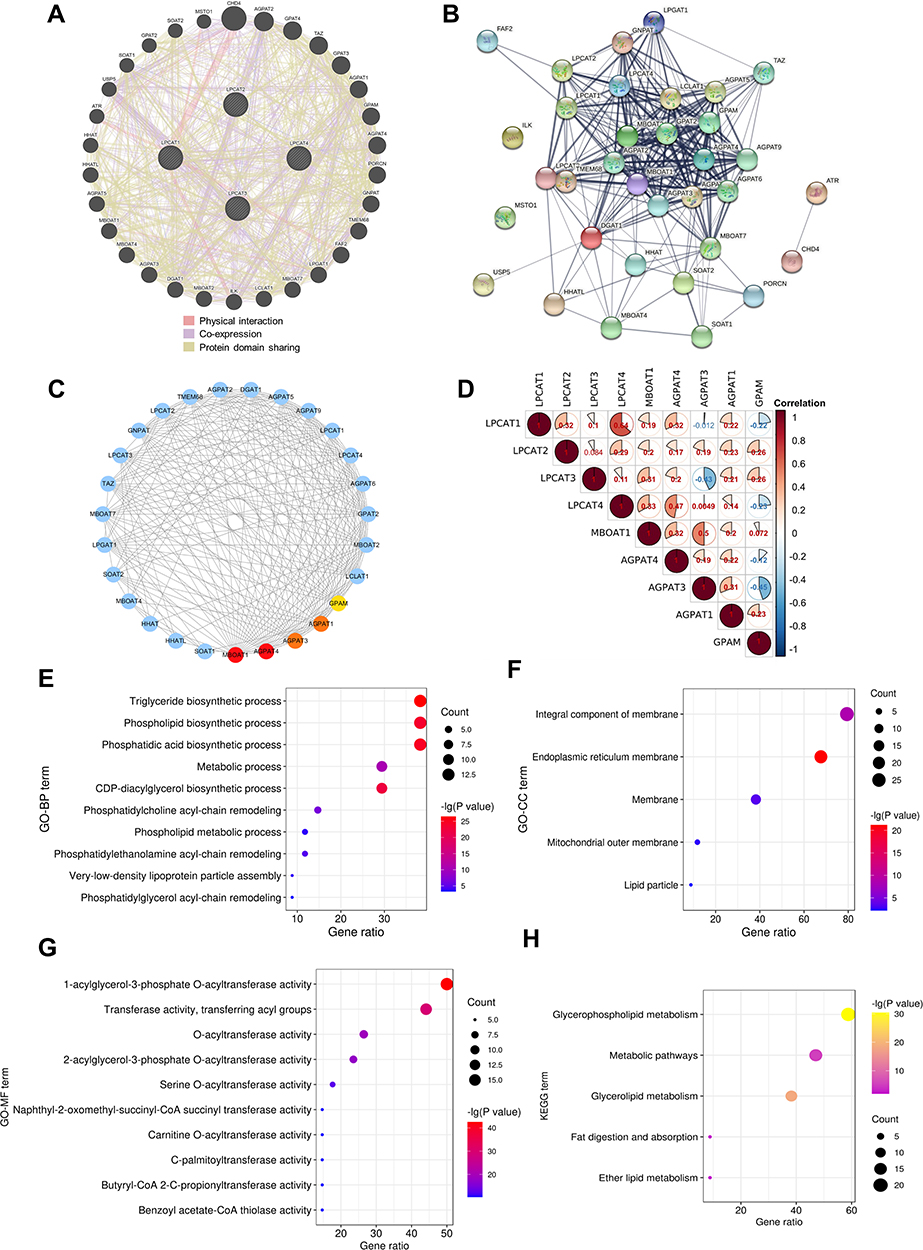 |
Figure 6 Underlying functional mechanisms of LPCATs and their interactive genes. (A) Thirty interactive genes of LPCATs identified by GeneMANIA. In the network, nodes represent genes, edges represent interactions between any two genes, and edge colors represent interaction types. (B) The PPI network constructed using LPCATs and their interactive genes by STRING. Edge thicknesses indicate confidence strengths. (C) The five core genes in the PPI network. The redder the color of a node, the higher the degree value is. (D) Correlations among LPCATs and the five core genes. The significantly enriched (E) GO-BP, (F) GO-CC, (G) GO-MF, and (H) KEGG pathway terms for LPCATs and their interactive genes. |
Finally, the GO functional annotation analysis uncovered the interactive genes were generally components of bio-membranes and participated in phospholipid biosynthetic and metabolic processes, mostly by exerting as AGPATs and acyltransferases (Figure 6E–G). Moreover, the significantly enriched KEGG terms elucidated signaling pathways of glycerophospholipid and glycerolipid metabolism were the most involved (Figure 6H).
Correlations Between LPCATs Expression and Immune Infiltration in HCC
To deepen the knowledge of LPCATs, correlations between LPCATs expression and immune infiltration in HCC were investigated using TIMER server. Because tumor purity impacts the evaluation of immune infiltration, all analyses were adjusted with the corresponding tumor purity.32 As exhibited in Figure 7A, LPCATs expression was significantly positively correlated with infiltration densities of CD8+ T cells, CD4+ T cells, mDCs, neutrophils, macrophages, B cells, Tregs, and MDSCs (P < 0.05); no significant negative correlation was observed. Noteworthy, infiltration levels of mDCs and MDSCs were moderately to strongly correlated with the expression of LPCAT1 (mDCs: r = 0.579, P = 3.29E-32; MDSCs: r = 0.557, P = 1.69E-29) and LPCAT4 (mDCs: r = 0.623, P = 1.63E-38; MDSCs: r = 0.494, P = 1.18E-22).
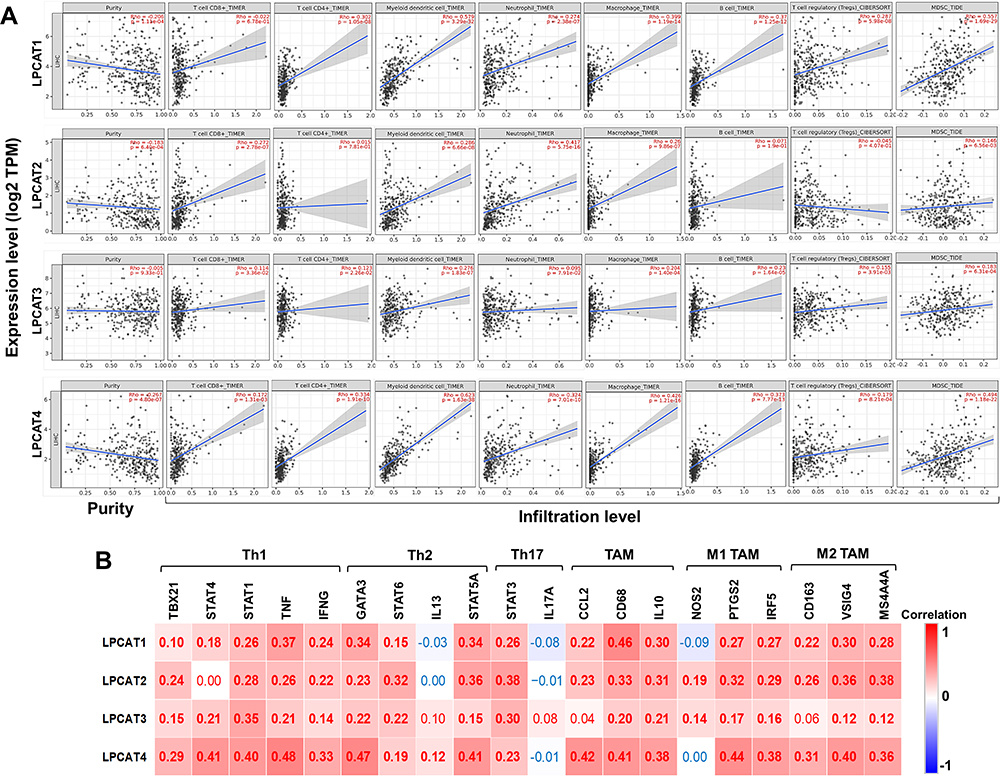 |
Figure 7 Correlations between LPCATs expression and immune infiltration of HCC. (A) Correlations between LPCATs expression with tumor purity, and infiltration levels of CD8+ T cells, CD4+ T cells, mDCs, neutrophils, macrophages, B cells, Tregs, and MDSCs in the TME of HCC (TIMER). (B) Correlations between LPCATs and the expression of biomarkers of Th cells and TAMs in HCC. Red or blue color represents positive or negative correlation, respectively. Correlation coefficients with statistical significance are in bold. Abbreviations: mDCs, myeloid dendritic cells; Tregs, regulatory T cells; MDSCs, myeloid-derived suppressor cells; TAMs, tumor-associated macrophages; Th cells, helper T cells. |
Since diverse subsets of CD4+ T cells [helper T cell (Th) 1, Th2, and Th17] and tumor-associated macrophages (TAMs) function very differently, correlations between LPCATs expression and biomarkers of these subsets were further analyzed to explore their participation. It turned out that LPCATs expression was consistently positively correlated with the biomarkers of Th1, Th2, Th17, and M1/M2 TAMs with weak to moderate correlation strengths (P < 0.05) (Figure 7B).
Discussion
Molecules regulating lipid reprogram are emerging as prospective cancer therapeutic targets, for their roles in fulfilling increased needs of cell membrane materials and nutrients of cancer cells.33 In this study, comprehensive analyses were carried out to excavate prognostic and immunotherapeutic values of a lipometabolism regulator family, LPCATs in HCC.
Enhanced PC remodeling can not only supply more biomass materials for the proliferation of cancer cells but also make membranes more saturated. More saturated lipids in membrane bilayers can increase structural stabilities to protect cancer cells from peroxidative injuries and sustain the activities of protein receptors on plasma membranes.3,34 For example, LPCAT1 is a central link between oncogenic epidermal growth factor receptor (EGFR) signaling and membrane lipid remodeling.4 LPCAT1 upregulation had been observed in various malignancies, including clear renal cell carcinoma,6 breast cancer,7 prostate cancer,8,35 HCC,9 gastric cancer,36 lung cancer,37 head and neck cancer,37 acute myeloid leukemia,38 and colorectal cancer,39 and might promote cancer progression, metastasis, therapeutic resistance, and deteriorated patients’ outcomes. In this work, we found only LPCAT1 significantly up-expressed in HCC, and it was the most frequently altered one among LPCAT members. LPCAT1 upregulation was significantly associated with clinicopathological advancements and unfavorable prognoses of HCC patients with different clinical parameters. What is new, we reported high LPCAT4 expression indicated worse pathological features and survivals of HCC patients for the first time.
Subsequently, we found the hypermethylation of numerous CpG sites of LPCATs implied unfavorable prognoses of HCC patients, even though their global methylation levels were almost indifferent between HCC and normal liver tissues. Therefore, we inferred that DNA methylation was not a major epigenetic mechanism underlying LPCATs’ participation in the development of HCC, but some existing molecular dysregulations in HCC might have susceptibility to the hypermethylation of LPCATs’ CpG sites, which afterward activated downstream signals conducive to tumor promotion.
LPCATs and their interactive genes were the main components of cellular membranes and worked as acyltransferases in phospholipid-related metabolism processes, among which MBOAT1, AGPAT1/3/4, and GPAM might play the hub roles. In fact, LPCAT3 (also named MBOAT5)40 and LPCAT4 (also named AGPAT7)41 belong to MBOAT and AGPAT families, respectively. AGPATs and MBOATs both engage in modifying fatty chain compositions of membrane glycerophospholipids in the Lands’ cycle.42 By the way, LPCAT1 and LPCAT4 had a strong correlation with each other, indicating their close collaborations.
Furthermore, we found LPCATs expression was extensively positively correlated with the infiltration levels of various TIICs in the TME, including subsets of TAMs and Th cells. It was no surprise to see these observations, since PC reprogramming occurs in both cancer cells and peripheral immune or inflammatory cells.43 Here were some pieces of evidence, Taylor et al observed plasma inflammatory indexes were elevated as LPC to PC conversion rates in cancer patients.44 LPCAT2 is abundantly expressed in inflammatory cells to biosynthesize PCs and pro-inflammatory lipid platelet-activating factors. Particularly, LPCAT2 is essential for the expression and release of macrophage cytokines in response to the stimulation of bacterial ligands.45,46 Besides, LPCAT3 is a primary responder of liver X receptors’ modulations on inflammatory responses through affecting both cellular membrane composition and substrate availability for inflammatory mediator production.47,48
Notably, we found LPCAT1/4 expression was closely correlated with the infiltration densities of MDSCs, TAMs, and mDCs, which are plastic myeloid cells at the crossroad of energy and immune regulations, under the environmental stress in cancers. Mounting evidence suggests dysregulated lipid reprogramming can change endoplasmic reticulum and Golgi expansion of immune cells, thereby molding their pro-cancer phenotypes.48,49 M2 TAMs are the predominant population of TAMs in solid cancers. M2 TAMs and MDSCs are the main immunosuppressors in the TME, high infiltration levels of both of them indicate dismal outcomes of patients. MDCs are professional antigen-presenting cells; however, they usually exhibit an impaired immune-stimulating capacity and can induce immunosuppression in HCC. CD8+ T cells are the principal immunosurveillance undertakers in the TME, whose functions are activated by the proinflammatory cytokines secreted by Th1 cells. Oppositely, Th2, Th17, and Tregs secret inhibitory cytokines to foment immune escape and subsequent cancer metastasis. B cells and neutrophils act flexibly depending on the inflammatory factors in the TME.50–52 To summary, LPCATs, particularly LPCAT1/4, might interact with both immunostimulatory and immunosuppressive TIICs in the TME of HCC, which should partly explain their roles in HCC progression.
Conclusions
LPCATs extensively rebuild bio-membrane structures via synthesizing PCs, thereby can promote cancer by directly facilitating cancer cell growth and indirectly regulating component cells in the TME. Within the LPCAT family, high LPCAT1/4 expression was significantly associated with unfavorable clinicopathological features and survivals of HCC patients; also, the infiltration of immunosuppressive MDSCs and DCs in the TME of HCC. However, only LPCAT1 was markedly overexpressed in HCC. Additionally, numerous hypermethylated CpG islands of LPCATs showed unfavorable prognostic significance in HCC patients. Although validations are still needed, this study proposed LPCAT1/4 might serve as promising prognostic and immunotherapeutic biomarkers of HCC targeting membrane lipid remodeling.
Data Sharing Statement
All data supporting the findings of this study had been provided in the article, Supplementary Materials, or were publicly available from the databases mentioned in the Materials and Methods section.
Ethics Approval and Consent to Participate
This study contained no data from human participants or animals performed by any of the authors, so its need for ethical approval was waived by the Ethics Committee of Shenzhen Traditional Chinese Medicine Hospital.
Author Contributions
All authors contributed to conception, design, and data analysis; took part in drafting and revising the article; gave approval of the final version to be published; and agreed to be accountable for all aspects of the work.
Funding
There is no funding to report.
Disclosure
The authors declare no conflict of interest in this work.
References
1. Duran SR, Jaquiss R. Hepatocellular carcinoma. N Engl J Med. 2019;381(1):e2. doi:10.1056/NEJMc1906565
2. Bi J, Ichu TA, Zanca C, et al. Oncogene amplification in growth factor signaling pathways renders cancers dependent on membrane lipid remodeling. Cell Metab. 2019;30(3):525–538. doi:10.1016/j.cmet.2019.06.014
3. Wang B, Tontonoz P. Phospholipid remodeling in physiology and disease. Annu Rev Physiol. 2019;81:165–188. doi:10.1146/annurev-physiol-020518-114444
4. Sangineto M, Villani R, Cavallone F, et al. Lipid metabolism in development and progression of hepatocellular carcinoma. Cancers (Basel). 2020;12(6):1419. doi:10.3390/cancers12061419
5. Szlasa W, Zendran I, Zalesińska A, et al. Lipid composition of the cancer cell membrane. J Bioenerg Biomembr. 2020;52(5):321–342. doi:10.1007/s10863-020-09846-4
6. Du Y, Wang Q, Zhang X, et al. Lysophosphatidylcholine acyltransferase 1 upregulation and concomitant phospholipid alterations in clear cell renal cell carcinoma. J Exp Clin Cancer Res. 2017;36(1):66. doi:10.1186/s13046-017-0525-1
7. Abdelzaher E, Mostafa MF. Lysophosphatidylcholine acyltransferase 1 (LPCAT1) upregulation in breast carcinoma contributes to tumor progression and predicts early tumor recurrence. Tumour Biol. 2015;36(7):5473–5483. doi:10.1007/s13277-015-32148
8. Grupp K, Sanader S, Sirma H, et al. High lysophosphatidylcholine acyltransferase 1 expression independently predicts high risk for biochemical recurrence in prostate cancers. Mol Oncol. 2013;7(6):1001–1011. doi:10.1016/j.molonc.2013.07.009
9. Morita Y, Sakaguchi T, Ikegami K, et al. Lysophosphatidylcholine acyltransferase 1 altered phospholipid composition and regulated hepatoma progression. J Hepatol. 2013;59(2):292–299. doi:10.1016/j.jhep.2013.02.030
10. Cotte AK, Aires V, Fredon M, et al. Lysophosphatidylcholine acyltransferase 2 mediated lipid droplet production supports colorectal cancer chemoresistance. Nat Commun. 2018;9(1):322. doi:10.1038/s41467-017-02732-5
11. Wang B, Rong X, Palladino E, et al. Phospholipid remodeling and cholesterol availability regulate intestinal stemness and tumorigenesis. Cell Stem Cell. 2018;22(2):206–220. doi:10.1016/j.stem.2017.12.017
12. Kurabe N, Hayasaka T, Ogawa M, et al. Accumulated phosphatidylcholine (16:0/16:1) in human colorectal cancer; Possible involvement of lpcat4. Cancer Sci. 2013;104(10):1295–1302. doi:10.1111/cas.12221
13. Liu A, Wu Q, Peng D, et al. A novel strategy for the diagnosis, prognosis, treatment, and chemoresistance of hepatocellular carcinoma: DNA methylation. Med Res Rev. 2020;40(5):1973–2018. doi:10.1002/med.21696
14. Hu B, Lin JZ, Yang XB, et al. Aberrant lipid metabolism in hepatocellular carcinoma cells as well as immune microenvironment: a review. Cell Prolif. 2020;53(3):e12772. doi:10.1111/cpr.12772
15. Rhodes DR, Kalyana-Sundaram S, Mahavisno V, et al. Oncomine 3.0: genes, pathways, and networks in a collection of 18,000 cancer gene expression profiles. Neoplasia. 2007;9(2):166–180. doi:10.1593/neo.07112
16. Tang Z, Li C, Kang B, et al. GEPIA: a web server for cancer and normal gene expression profiling and interactive analyses. Nucleic Acids Res. 2017;45(W1):W98- W102. doi:10.1093/nar/gkx247
17. Uhlen M, Zhang C, Lee S, et al. A pathology atlas of the human cancer transcriptome. Science. 2017;357(6352). doi:10.1126/science.aan2507
18. Cerami E, Gao J, Dogrusoz U, et al. The cBio cancer genomics portal: an open platform for exploring multidimensional cancer genomics data. Cancer Discov. 2012;2(5):401–404. doi:10.1158/2159-8290.CD-12-0095
19. Gao J, Aksoy BA, Dogrusoz U, et al. Integrative analysis of complex cancer genomics and clinical profiles using the cBioPortal. Sci Signal. 2013;6(269):l1. doi:10.1126/scisignal.2004088
20. Chandrashekar DS, Bashel B, Balasubramanya S, et al. UALCAN: a portal for facilitating tumor subgroup gene expression and survival analyses. Neoplasia. 2017;19(8):649–658. doi:10.1016/j.neo.2017.05.002
21. Vasaikar SV, Straub P, Wang J, et al. LinkedOmics: analyzing multi-omics data within and across 32 cancer types. Nucleic Acids Res. 2018;46(D1):D956–D963. doi:10.1093/nar/gkx1090
22. Györffy B, Lanczky A, Eklund AC, et al. An online survival analysis tool to rapidly assess the effect of 22,277 genes on breast cancer prognosis using microarray data of 1809 patients. Breast Cancer Res Treat. 2010;123(3):725–731. doi:10.1007/s10549-009-0674-9
23. Ding W, Chen J, Feng G, et al. DNMIVD: DNA methylation interactive visualization database. Nucleic Acids Res. 2020;48(D1):D856–D862. doi:10.1093/nar/gkz830
24. Zhang C, Zhao N, Zhang X, et al. SurvivalMeth: a web server to investigate the effect of DNA methylation-related functional elements on prognosis. Brief Bioinform. 2020;22(3):bbaa162. doi:10.1093/bib/bbaa162
25. Modhukur V, Iljasenko T, Metsalu T, et al. MethSurv: a web tool to perform multivariable survival analysis using DNA methylation data. Epigenomics-UK. 2018;10(3):277–288. doi:10.2217/epi-2017-0118
26. Franz M, Rodriguez H, Lopes C, et al. GeneMANIA update 2018. Nucleic Acids Res. 2018;46(W1):W60–W64. doi:10.1093/nar/gky311
27. Huang DW, Sherman BT, Lempicki RA. Systematic and integrative analysis of large gene lists using DAVID bioinformatics resources. Nat Protoc. 2009;4(1):44–57. doi:10.1038/nprot.2008.211
28. Li T, Fu J, Zeng Z, et al. TIMER2.0 for analysis of tumor-infiltrating immune cells. Nucleic Acids Res. 2020;48(W1):W509–W514. doi:10.1093/nar/gkaa407
29. Pan J, Zhou H, Cooper L, et al. LAYN is a prognostic biomarker and correlated with immune infiltrates in gastric and colon cancers. Front Immunol. 2019;10:6. doi:10.3389/fimmu.2019.00006
30. Xiao Z, Hu L, Yang L, et al. TGFβ2 is a prognostic‐related biomarker and correlated with immune infiltrates in gastric cancer. J Cell Mol Med. 2020;24(13):7151–7162. doi:10.1111/jcmm.15164
31. Sceusi EL, Loose DS, Wray CJ. Clinical implications of DNA methylation in hepatocellular carcinoma. HPB (Oxford). 2011;13(6):369–376. doi:10.1111/j.1477-2574.2011.00303.x
32. Aran D, Sirota M, Butte AJ. Systematic pan-cancer analysis of tumour purity. Nat Commun. 2015;6:8971. doi:10.1038/ncomms9971
33. Pope ER, Kimbrough EO, Vemireddy LP, et al. Aberrant lipid metabolism as a therapeutic target in liver cancer. Expert Opin Ther Targets. 2019;23(6):473–483. doi:10.1080/14728222.2019.1615883
34. Swinnen JV, Dehairs J, Talebi A. Membrane lipid remodeling takes center stage in growth factor receptor-driven cancer development. Cell Metab. 2019;30(3):407–408. doi:10.1016/j.cmet.2019.08.016
35. Han C, Yu G, Mao Y, et al. LPCAT1 enhances castration resistant prostate cancer progression via increased mRNA synthesis and PAF production. PLoS One. 2020;15(11):e240801. doi:10.1371/journal.pone.0240801
36. Uehara T, Kikuchi H, Miyazaki S, et al. Overexpression of lysophosphatidylcholine acyltransferase 1 and concomitant lipid alterations in gastric cancer. Ann Surg Oncol. 2016;23 Suppl 2:S206–S213. doi:10.1245/s10434-015-4459-6
37. Liu F, Wu Y, Liu J, et al. A miR-205-LPCAT1 axis contributes to proliferation and progression in multiple cancers. Biochem Biophys Res Commun. 2020;527(2):474–480. doi:10.1016/j.bbrc.2020.04.071
38. Wang K, Wu Z, Si Y, et al. Identification of LPCAT1 expression as a potential prognostic biomarker guiding treatment choice in acute myeloid leukemia. Oncol Lett. 2021;21(2):105. doi:10.3892/ol.2020.12366
39. Mansilla F, Da CK, Wang S, et al. Lysophosphatidylcholine acyltransferase 1 (LPCAT1) overexpression in human colorectal cancer. J Mol Med (Berl). 2009;87(1):85–97. doi:10.1007/s00109-008-0409-0
40. Zarini S, Hankin JA, Murphy RC, et al. Lysophospholipid acyltransferases and eicosanoid biosynthesis in zebrafish myeloid cells. Prostaglandins Other Lipid Mediat. 2014;113–115:52–61. doi:10.1016/j.prostaglandins.2014.08.003
41. Ye GM, Chen C, Huang S, et al. Cloning and characterization a novel human 1acyl-sn-glycerol-3-phosphate acyltransferase gene AGPAT7. DNA Seq. 2005;16(5):386–390. doi:10.1080/10425170500213712
42. Valentine WJ, Hashidate-Yoshida T, Yamamoto S, et al. Biosynthetic enzymes of membrane glycerophospholipid diversity as therapeutic targets for drug development. Adv Exp Med Biol. 2020;1274:5–27. doi:10.1007/978-3-030-50621-6_2
43. Shindou H, Hishikawa D, Nakanishi H, et al. A single enzyme catalyzes both platelet-activating factor production and membrane biogenesis of inflammatory cells. Cloning and characterization of acetyl-CoA:LYSO-PAF acetyltransferase. J Biol Chem. 2007;282(9):6532–6539. doi:10.1074/jbc.M609641200
44. Taylor LA, Arends J, Hodina AK, et al. Plasma lyso-phosphatidylcholine concentration is decreased in cancer patients with weight loss and activated inflammatory status. Lipids Health Dis. 2007;6:17. doi:10.1186/1476-511X-6-17
45. Abate W, Alrammah H, Kiernan M, et al. Lysophosphatidylcholine acyltransferase 2 (LPCAT2) co-localises with TLR4 and regulates macrophage inflammatory gene expression in response to LPS. Sci Rep. 2020;10(1):10355. doi:10.1038/s41598-020-67000-x
46. Tarui M, Shindou H, Kumagai K, et al. Selective inhibitors of a PAF biosynthetic enzyme lysophosphatidylcholine acyltransferase 2. J Lipid Res. 2014;55(7):1386–1396. doi:10.1194/jlr.M049205
47. Rong X, Albert CJ, Hong C, et al. LXRs regulate er stress and inflammation through dynamic modulation of membrane phospholipid composition. Cell Metab. 2013;18(5):685–697. doi:10.1016/j.cmet.2013.10.002
48. Ishibashi M, Varin A, Filomenko R, et al. Liver X receptor regulates arachidonic acid distribution and eicosanoid release in human macrophages: a key role for lysophosphatidylcholine acyltransferase 3. Arterioscler Thromb Vasc Biol. 2013;33(6):1171–1179. doi:10.1161/ATVBAHA.112.300812
49. Dou L, Ono Y, Chen YF, et al. Hepatic dendritic cells, the tolerogenic liver environment, and liver disease. Semin Liver Dis. 2018;38(2):170–180. doi:10.1055/s-0038-1646949
50. Garnelo M, Tan A, Her Z, et al. Interaction between tumour-infiltrating B cells and T cells controls the progression of hepatocellular carcinoma. Gut. 2017;66(2):342–351. doi:10.1136/gutjnl-2015-310814
51. Endig J, Buitrago-Molina LE, Marhenke S, et al. Dual role of the adaptive immune system in liver injury and hepatocellular carcinoma development. Cancer Cell. 2016;30(2):308–323. doi:10.1016/j.ccell.2016.06.009
52. Nagarsheth N, Wicha MS, Zou W. Chemokines in the cancer microenvironment and their relevance in cancer immunotherapy. Nat Rev Immunol. 2017;17(9):559–572. doi:10.1038/nri.2017.49
 © 2021 The Author(s). This work is published and licensed by Dove Medical Press Limited. The full terms of this license are available at https://www.dovepress.com/terms.php and incorporate the Creative Commons Attribution - Non Commercial (unported, v3.0) License.
By accessing the work you hereby accept the Terms. Non-commercial uses of the work are permitted without any further permission from Dove Medical Press Limited, provided the work is properly attributed. For permission for commercial use of this work, please see paragraphs 4.2 and 5 of our Terms.
© 2021 The Author(s). This work is published and licensed by Dove Medical Press Limited. The full terms of this license are available at https://www.dovepress.com/terms.php and incorporate the Creative Commons Attribution - Non Commercial (unported, v3.0) License.
By accessing the work you hereby accept the Terms. Non-commercial uses of the work are permitted without any further permission from Dove Medical Press Limited, provided the work is properly attributed. For permission for commercial use of this work, please see paragraphs 4.2 and 5 of our Terms.