")
Back to Journals » Cancer Management and Research » Volume 11
Comprehensive analysis of genes based on chr1p/19q co-deletion reveals a robust 4-gene prognostic signature for lower grade glioma
Authors Zhang C, Yu R, Li Z , Song H, Zang D, Deng M, Fan Y, Liu Y , Zhang Y , Qu X
Received 24 December 2018
Accepted for publication 24 April 2019
Published 29 May 2019 Volume 2019:11 Pages 4971—4984
DOI https://doi.org/10.2147/CMAR.S199396
Checked for plagiarism Yes
Review by Single anonymous peer review
Peer reviewer comments 2
Editor who approved publication: Dr Kenan Onel
Chuang Zhang,1,2,* Ruoxi Yu,1,2,* Zhi Li,1,2 Huicong Song,1,2 Dan Zang,1,2 Mingming Deng,1 Yibo Fan,1,2 Yunpeng Liu,1,2 Ye Zhang,1,2 Xiujuan Qu1,2
1Key Laboratory of Anticancer Drugs and Biotherapy, the First Hospital of China Medical University, Shenyang, Liaoning, 110001, People’s Republic of China; 2Department of Medical Oncology, The First Hospital of China Medical University, Shenyang 110001, Liaoning, People’s Republic of China
*These authors contributed equally to this work
Purpose: The chr1p/19q co-deletion is a favorable prognostic factor in patients with lower grade glioma. The aim of this study was to reveal key genes for prognosis and establish prognostic gene signatures based on genes encoded by chr1p/19q.
Materials and methods: The data was downloaded from The Cancer Genome Atlas (TCGA), Chinese Glioma Genome Atlas (CGGA) and Gene Expression Omnibus (GEO). Differentially expressed genes (DEGs) between lower grade glioma tissue and normal brain were identified. The univariate COX regression, robust likelihood-base survival analysis (rbsurv) and multivariate COX regression analysis were used to establish the 4-gene-signature based on the DEGs. The receiver operating characteristic (ROC) curve and the Kaplan-Mere curve were used to verify the prediction accuracy of the signature. Gene Set Enrichment Analysis (GSEA) and Kyoto Encyclopedia of Genes and Genomes (KEGG) analysis were also performed to explore the reasons for good prognosis in patients with chr1p/19q deletion.
Results: A total of 1346 DEGs were identified between lower grade glioma samples and normal brain samples in GSE16011, including 56 up-regulated mRNAs located on chr1p and 20 up-regulated mRNAs located on chr19q. We established a 4-gene-signature that was significantly associated with survival based on the 76 gene. The AUC of the 4-gene-signature for 5-year OS in TCGA and CGGA was 0.837 and 0.876, respectively, which was superior compared to other parameters such as chr1p/19q co-deletion, IDH mutant, WHO grade and histology type, especially in chr1p/19q non-co-deletion patients. GSEA and KEGG analysis suggested that the prolongation of chr1p/19q in patients could be associated with cell cycle and DNA mismatch repairing.
Conclusions: We established a robust 4-gene-signature based on the chr1p/19q and we explored the potential function of these newly identified survival-associated genes by bioinformatics analysis. The 4-gene from the signature are promising molecular targets to be used in the future.
Keywords: lower grade glioma, prognostic signature, 1p/19q co-deletion, rbsurv
Introduction
Diffuse low-grade and intermediate-grade gliomas (which together make up the lower-grade gliomas, World Health Organization grades II and III) is an infiltrative neoplasm of young adults that mostly arise from cerebral hemispheres1 Despite the recent progress in neurosurgery, radiotherapy and chemotherapy, no great improvement of the surveillance, epidemiology and end results has been reported in the past 10 years2
The prognosis of lower grade gliomas has traditionally been determined by histological type and WHO grade. More recently, molecular markers have received more and more attention3 Chromosomal 1p and 19q (chr1p/19q) co-deletion is considered to be a good prognostic factor in lower grade glioma. About half of patients have chr1p/19q co-deletion, and such patients are often sensitive to radiotherapy and chemotherapy, especially alkylating agents4 However, we found that predicting with prognosis using only the chr1p/19q co-deletion was not accurate enough. The survival of patients without chr1p/19q co-deletion ranged from 5 years to less than 1 year. Therefore, the establishment of a more accurate model to predict the prognosis of lower grade glioma patients is very important.
It is welll known that chr1p and chr19q contain genes associated with DNA damage repairing, spindle checkpoint function, apoptosis, WNT signaling pathways, TGF-βsignaling pathways and tumor suppression.5,6 Chromosome 1p deletion is generally associated with the initiation of carcinogenesis7 However, in lower grade glioma, chr1p/19q co-deletion is a beneficial marker to the prognosis, which is contrary to previous knowledge8 We hypothesize that the co-deletion of chr1p/19q leads to the loss of important genes during tumor development. The primary objective of this study was to identify “driver” genes from “passengers” on chr1p/19q and to establish a more accurate prognostic model to account for survival prolongation caused by chr1p/19q co-deletion. We used multiple bioinformatics techniques to identify and validate the gene signature based on deletion gene on chr1p/19q. Through this study, we hoped to find more prognostic biomarkers and therapeutic targets for lower grade glioma patients.
Materials and methods
Patients and samples information
RNASeqV2 level3 data from 510 lower grade glioma patients with complete clinical data in The Cancer Genome Atlas (TCGA) cohort were downloaded from TCGA data portal (
Establishment of 4-gene-signature
GSE16011 was used for differential expression gene (DEG) analysis. The TCGA-LGG cohort was selected as the training set and the CGGA cohort was selected as the validation set (Table 1). The establishment of 4-gene-signature included the following steps (Figure S1): 1) by performing differential expression gene analysis on the expression profile chip of GSE16011, 1346 genes with significantly higher expression in cancer samples compared to normal samples were obtained. |log2FC| >1 and adjusted P-value <0.05 served as the screening conditions for significantly differential expression genes. A total of 76 genes encoded by chr1p/19q were selected based on annotation information of the GSE16011. 2) The univariate COX analysis was performed on the 76 expressed genes in the TCGA cohort. A total of 66 significant genes were obtained with P<0.05 as a threshold. 3) The robustness test was performed on the 66 genes using robust likelihood-based survival modeling. The histological type, chr1p/19q deletion status, IDH1 mutation status and WHO grade were included as prognostic risk factors to exclude their effects. After 100 iterations, a total of 23 prognostic-related robust genes were selected. 4) Multivariate COX analysis was performed on 23 genes using the coxph package in R software. Analysis was performed using the maximum likelihood ratio method. Four genes were finally obtained at a threshold of P<0.05.
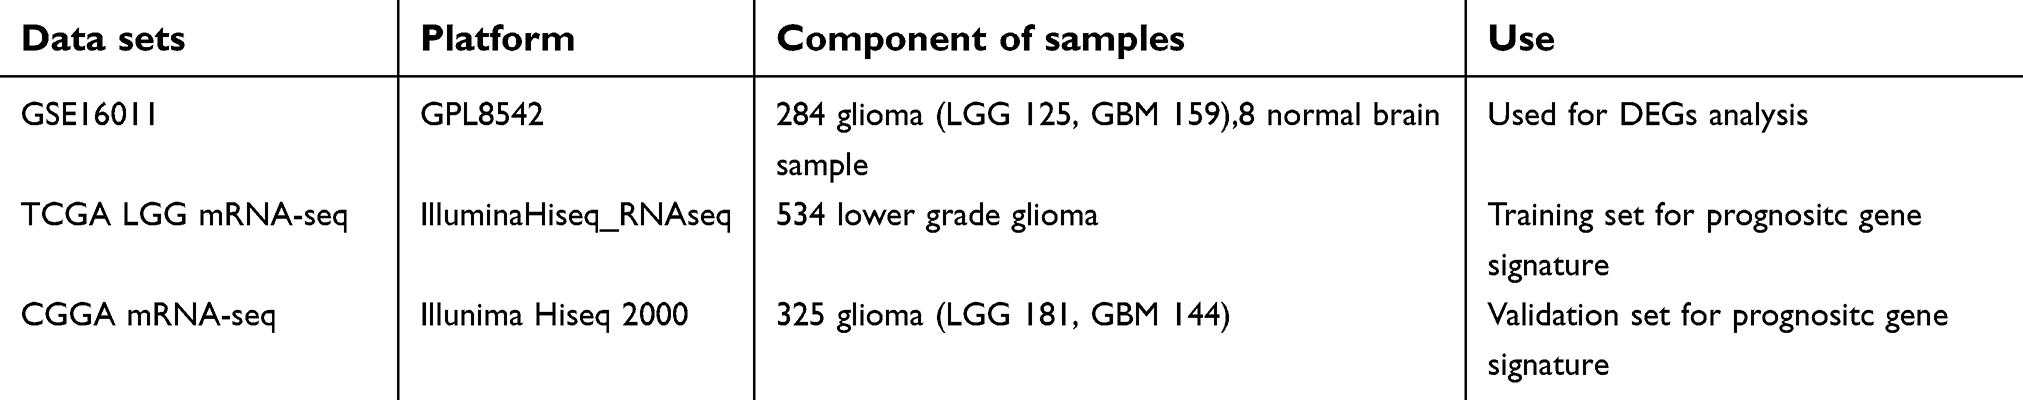 | Table 1 Three lower grade glioma datasets used in this study |
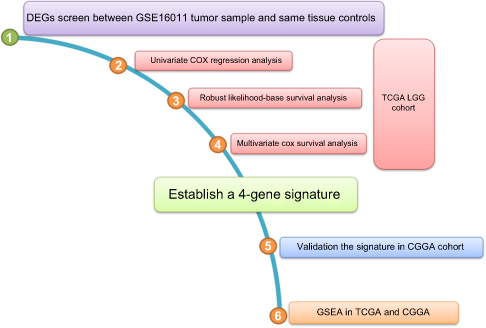 | Figure S1 Flowchart of the present study. Abbreviations: DEGs, differentially expressed genes; TCGA, The Cancer Genome Atlas; LGG, lower grade glioma; CGGA, Chinese Glioma Genome Altas; GSEA, gene set enrichment analysis. |
Risk score calculation
The following linear equation was established by a multivariate COX proportional hazard model to calculate the risk score for each patient: Risk score= expression of IFI44×0.012 + expression of KIF2C×0.068 + expression of GNG12×0.035 + expression of EMP3×0.0200.
Validation of 4-gene-signature
The area under the curve (AUC) values of 1 year, 3 years, and 5 years were calculated in the training set (TCGA) and the validation set (CGGA), respectively. The median of the risk score in TCGA was used as the cut off value to define the high-risk group and the low risk group, and a Kaplan-Meier curve was drawn to visualize the conclusion. Kaplan-Meier curves were plotted in different subgroups to verify the independence of the 4-gene-signature. To clarify whether the proposed 4-gene-signature was more accurate, we compared the index of concordance (C-index) of the published model with the signature model using the time-dependent AUC curve.
KEGG of DEGs on chr1p/19q
Kyoto Gene and Genomic Encyclopedia (KEGG) analysis was used to analyze the biological pathways where there was an obvious enrichment of DEGs on chr1p/19q. At the P-value of <0.05, the KEGG pathway was significantly enriched by these genes.
Gene set enrichment analysis (GSEA)
GSEA was performed using GSEA v2.2.2 (
Statistical analysis
The R package limma was used for differential gene analysis11 The R-package survival and survminer were used for survival analysis and COX regression analysis. The R package pROC was used to plot the ROC curve12 The R package rbsurv was used for robustness testing. The comparison of different models was performed with the R package pec::cindex13 The R package clusterProfiler was used for KEGG analysis. JavaGSEA was used for GSEA analysis.
Results
Identification of cancer-associated genes on the chr1p/19q of lower grade glioma
In order to identify cancer-associated genes on chr1p/19q, we first used the GSE16011 to screen for differential expressed genes (DEGs) between lower grade glioma patients and normal brain. A total of 1,346 up-regulated genes in cancer were screened (Figure 1A). Among them, 56 genes were located on chr1p and 20 genes were located on chr19q (Figure 1B). These 76 genes were significantly higher in chr1p/19q non-co-deletion lower grade glioma compared to normal tissues and chr1p/19q co-deletion lower grade glioma, which suggests they may be associated with prolonged overall survival (OS) in patients with chr1p/19q co-deletion.
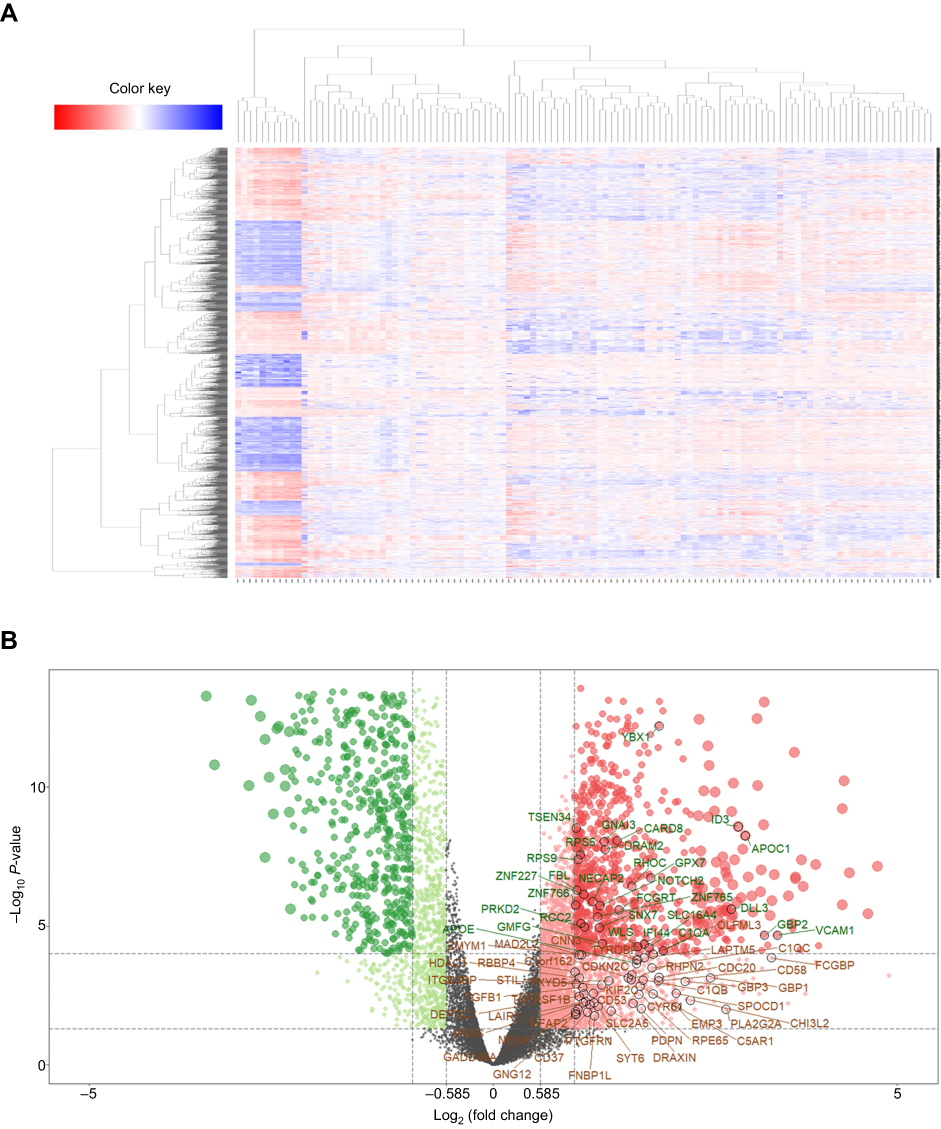 | Figure 1 Differentially expressed genes between lower grade glioma samples and normal samples in GSE16011. (A) Heat maps show hierarchical clustering of differentially expressed gene expression levels. Each row represents a patient; each column represents a gene. Red dots represent up-regulated genes, and green dots represent down-regulated genes. (B) The volcano plot shows 1,346 differential genes using the limma package with |log2FC| >1 and adj-P<0.05. Red dot indicates a gene that is up-regulated in cancer compared to normal, and green dot indicates a gene that is down-regulated in cancer. The 76 genes encoded by chr1p/19q are labeled. |
Kyoto encyclopedia of genes and genomes (KEGG) analysis of DEGs in chr1p/19q
To elucidate the mechanisms of longer survival in patients with chr1p/19q deletion, we performed KEGG analysis on 76 DEGs encoded by chr1p/19q. KEGG analysis showed that the up-regulated gene encoded by chr1p/19q was most significantly enriched in the “cell cycle,” and were also associated with “breast cancer,” “chronic myeloid leukemia,” and “Notch signaling pathway” (Figure 2A). Genes specifically enriched in each KEGG term were visualized (Figure 2B and C).
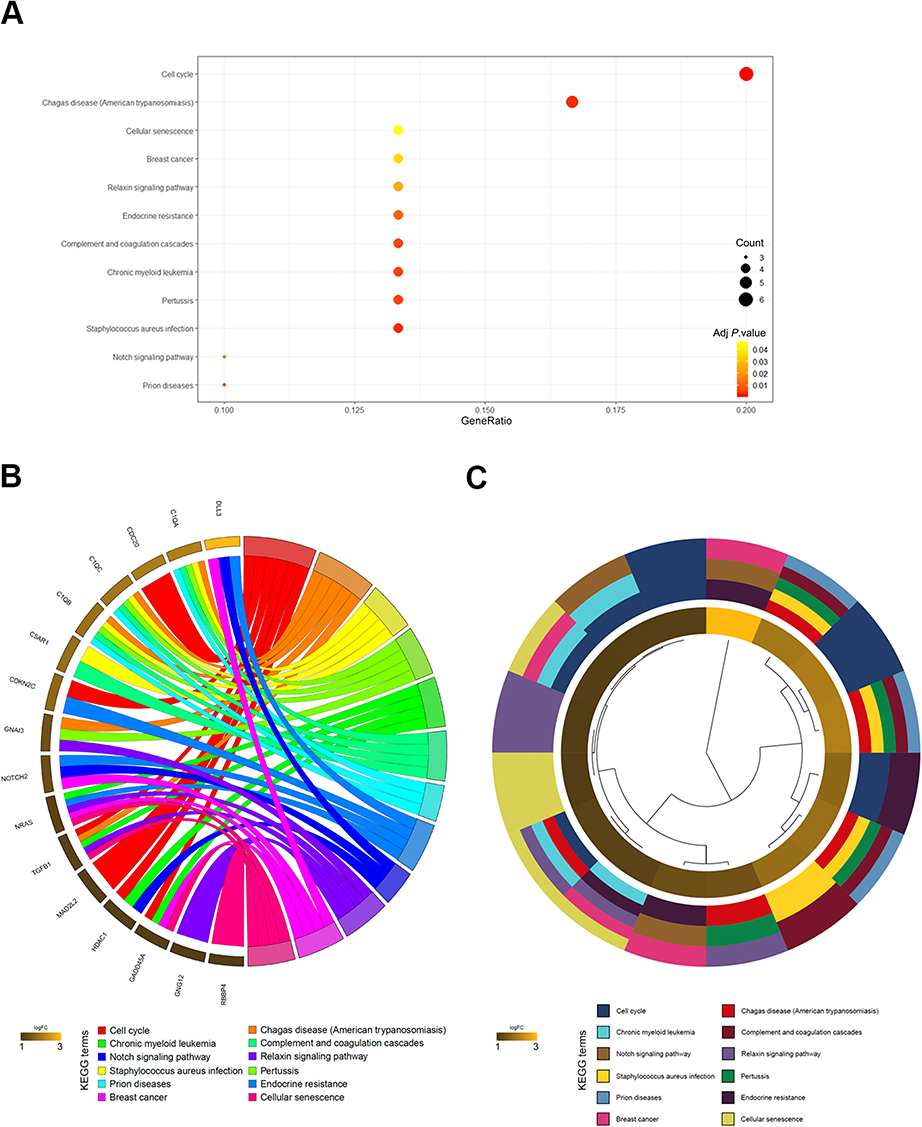 | Figure 2 KEGG results of 76 up-regulated DEGs encoded by chr1p/19q in GSE16011. (A) DEGs enriched in KEGG pathways “cell cycle,” “breast cancer,” “chronic myeloid leukemia,” and “Notch signaling pathway,” etc. Fold enrichment of each KEGG term is indicated by the x-axis and bar color. (B) Hierarchical clustering of gene expression profiles in each KEGG pathway. (C) Chord plots show the relationship between genes and the KEGG pathway. |
Establishment of the 4-gene prognosis signature
The model was tested on 510 patients in TCGA-LGG with complete clinical pathology parameters. The chr1p/19q co-deletion status and the IDH1 mutation status were predicted by the UCSC xena website. First, we used COX proportional hazard regression model to compute the univariate analysis of 76 genes, where 66 genes appeared to be associated with OS (P<0.05). We used the rbsurv package in R to further test the robustness of these 66 genes. As shown in Table 2, 23 genes were considered to be robust prognosis-related genes. They were included in the COX multivariate proportional hazard model, and finally four genes were obtained as independent prognostic factors for OS, including IFI44, KIF2C, GNG12, and EMP3 (Figure 3).
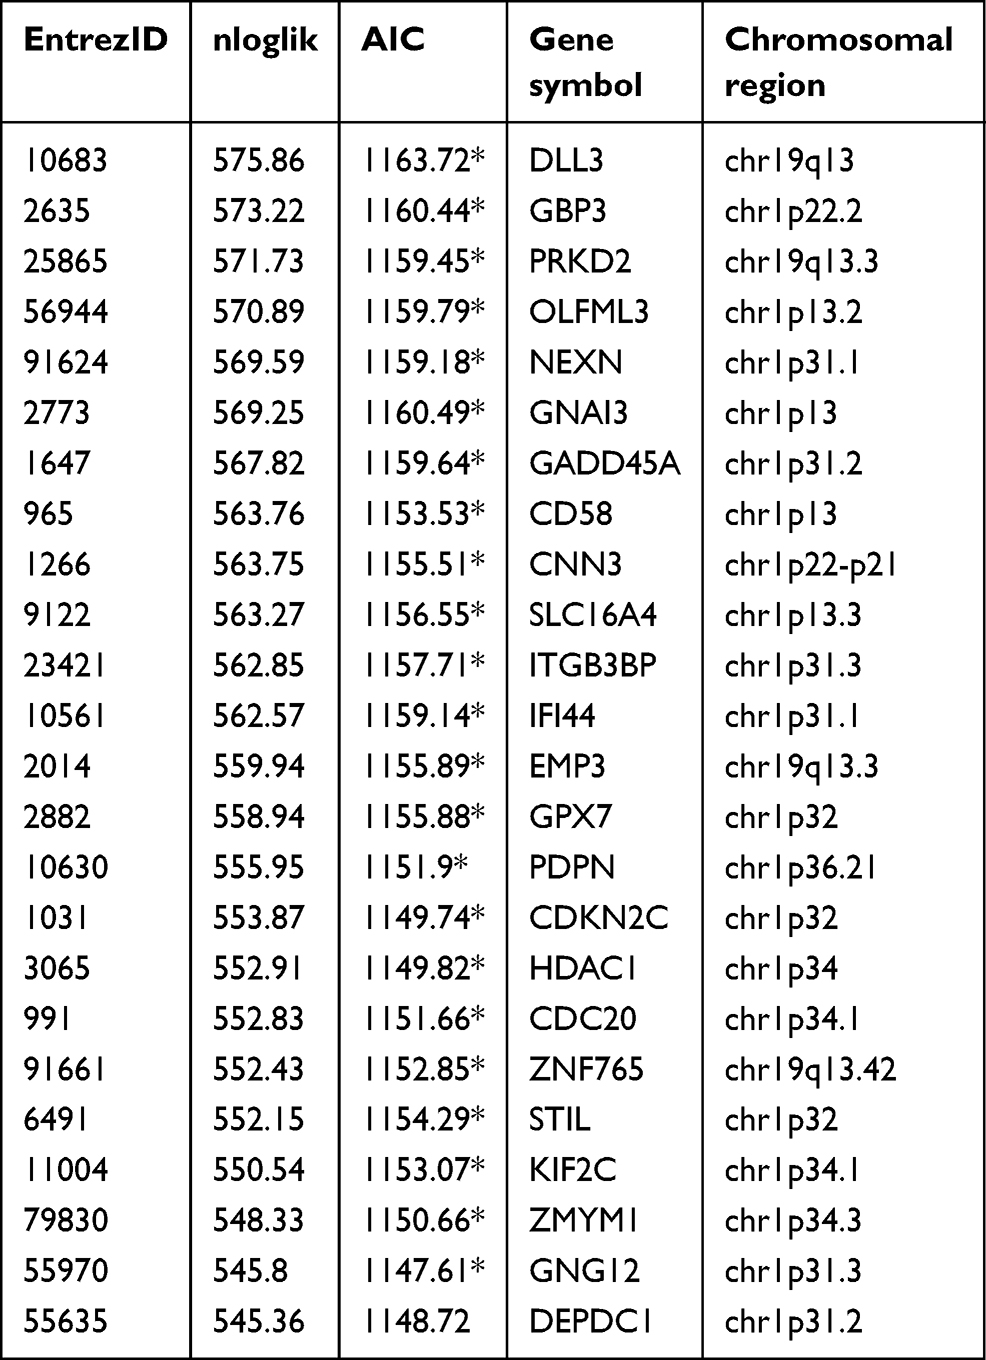 | Table 2 Survival-associated gene signature screening using forward selection |
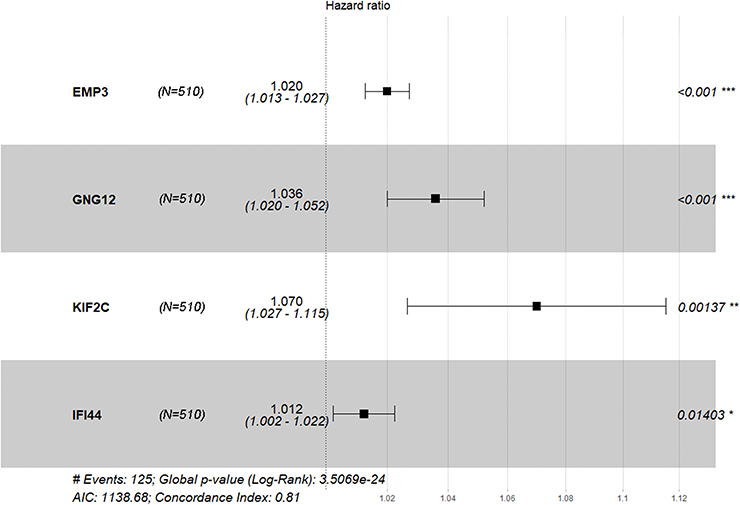 | Figure 3 Forest plot of Cox PH ratios of the 4-gene-signature, with a 95% CI indicated around the values. n=510. |
The 4-gene-signature can stratify the prognosis of lower grade glioma
Based on the multivariate Cox model, the prognostic risk score for each patient was calculated based on the coefficient value and the expression level. We divided patients into high-risk and low-risk groups by the median risk score. Patients in the TCGA had a risk score ranging from 0 to 5 and the median risk score of 0.528 (Figure 4A, top panel). More patients survived in the low-risk group than in the high-risk group (Figure 4A, middle panel). The expression levels of the four genes in the high-risk group were significantly higher than those in the low risk group, thus suggesting that they may be the biomarkers of poor prognosis (Figure 4A, bottom panel). These conclusions were further confirmed in the CGGA dataset including 181 patients with lower grade glioma (Figure 4B). The Log-rank text and Kaplan-Meier curves showed that lower grade glioma patients were significantly stratified in two groups by using the median risk score in TCGA as the cut-off value (Figure 4C and D). Since our signature was obtained from the gene on chr1p/19q, we further examined the stratification ability of this signature in patients without chr1p/19q co-deletion. The results showed that in patients with chr1p/19q non-co-deletion, the stratification ability of this signature was still prominent (Figure 4E).
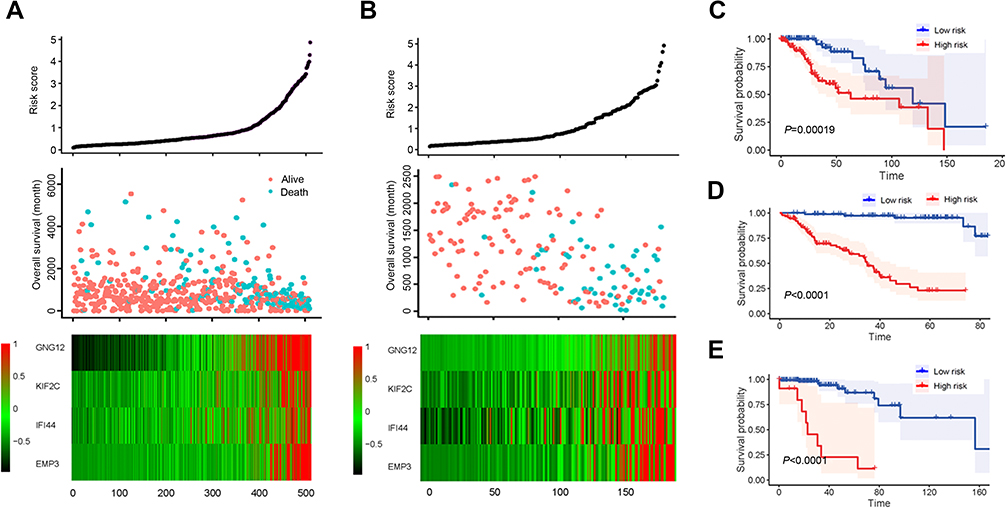 | Figure 4 Survival analysis based on 4-gene-signature. (A) The 4-gene-signature-based risk score in TCGA cohort. Upper panel: the risk score plot based on 4-gene-signature. Middle panel: the live/dead state corresponding to the risk score in the upper panel. The X axis represents the patient; the Y axis represents the number of days of survival. Bottom panel: The z-score transformed expression value of each gene in the 4-gene-signature. (B) The 4-gene-signature-based risk score in CGGA cohort. (C-E) Kaplan–Meier plot for overall survival based on the 4-gene-signature in TCGA (C), CGGA (D) and non-chr1p/19q patients in TCGA (E). |
Four-gene-signature risk score is an independent predictor of overall survival
Since IDH1 mutation status, histological type, and WHO classification are important for the prognosis of lower grade glioma, it was necessary to determine whether our risk score was an independent prognostic factor for OS. Our 4-gene-signature can separate patients into high-risk group and low risk groups according to different gender (Figure 5A) and age (Figure 5B). Similarly, in the subgroups of different IDH1 status (Figure 5C), histological type (Figure 5D) and WHO level (Figure 5E), the overall survival of the high-risk group was significantly shortened. The above results indicated that the 4-gene-signature was an independent prognostic predictor for OS.
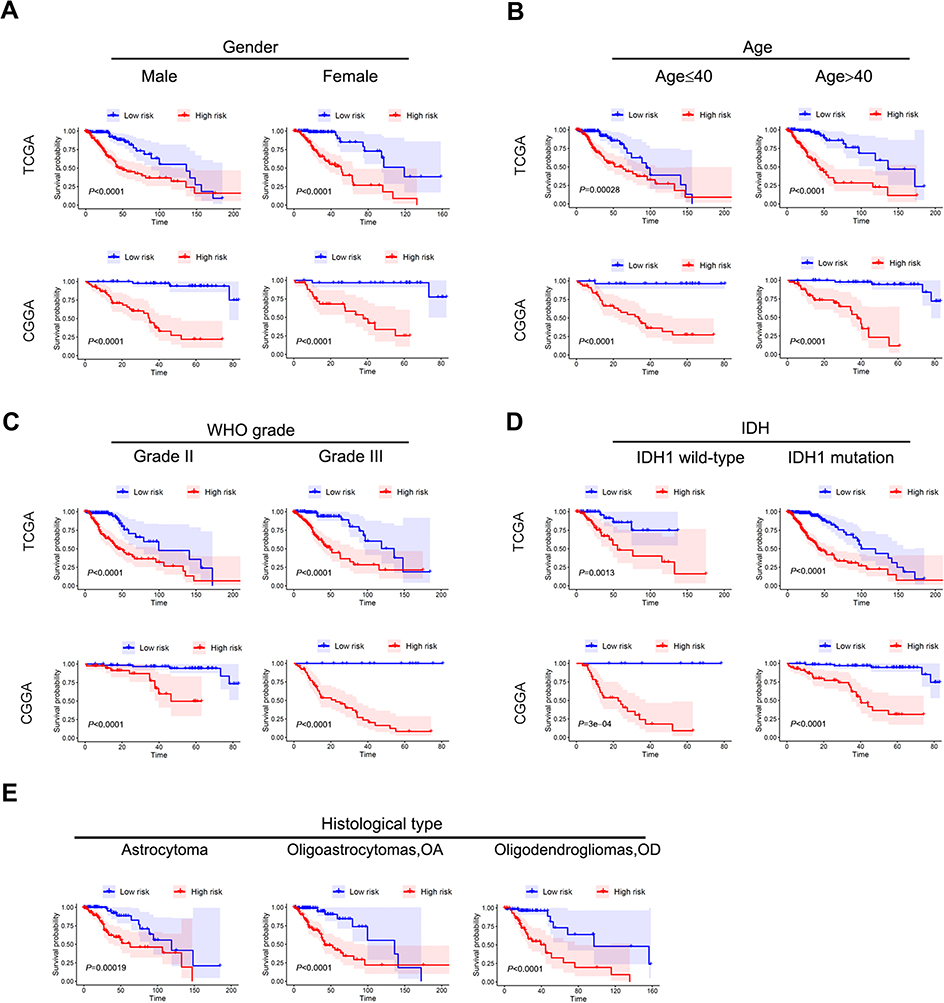 | Figure 5 Stratification analysis by different clinical pathological parameters. The Kaplan-Meier curve showed significant statistical differences in overall survival between the high-risk group and the low-risk group in different gender (A), age (B), WHO grade (C), IDH status (D), and histological type (E). |
Comparison of the predictive accuracy for OS between the 4-gene-signature and current staging or prognostic factor
Receiver operating characteristic (ROC) curves were used to assess the prognostic ability of our 4-gene signature. The area under the receiver operating characteristic (ROC) curve (AUC) of 1-year, 3-year and 5-year survival rate were 0.858, 0.853 and 0.837 in TCGA, respectively, which was significantly higher compared to other clinical pathological parameters such as chr1p/19q deletion, histology type, WHO classification and IDH mutations (Figure 6A–C). The same conclusion was reached for the CGGA where the AUC of 4-gene-signature in 1-year, 3-year and 5-year survival rate were 0.834, 0.879 and 0.876, respectively. The AUC values of other clinical parameters were below 0.8 (Figure 6D–F). In the chr1p/19q non-co-deletion cohort of TCGA, the existing parameters had limited predictive power for prognosis in this population (Figure 6G–I). However, our 4-gene-signature showed an accurate predictive ability with an AUC value of 0.860, 0.884 and 0.850 in 1-year, 3-year and 5-year survival rate. These results suggested that the signature is a more accurate and useful tool for the prediction of OS in lower grade glioma patients, especially for chr1p/19q non-co-deletion patients.
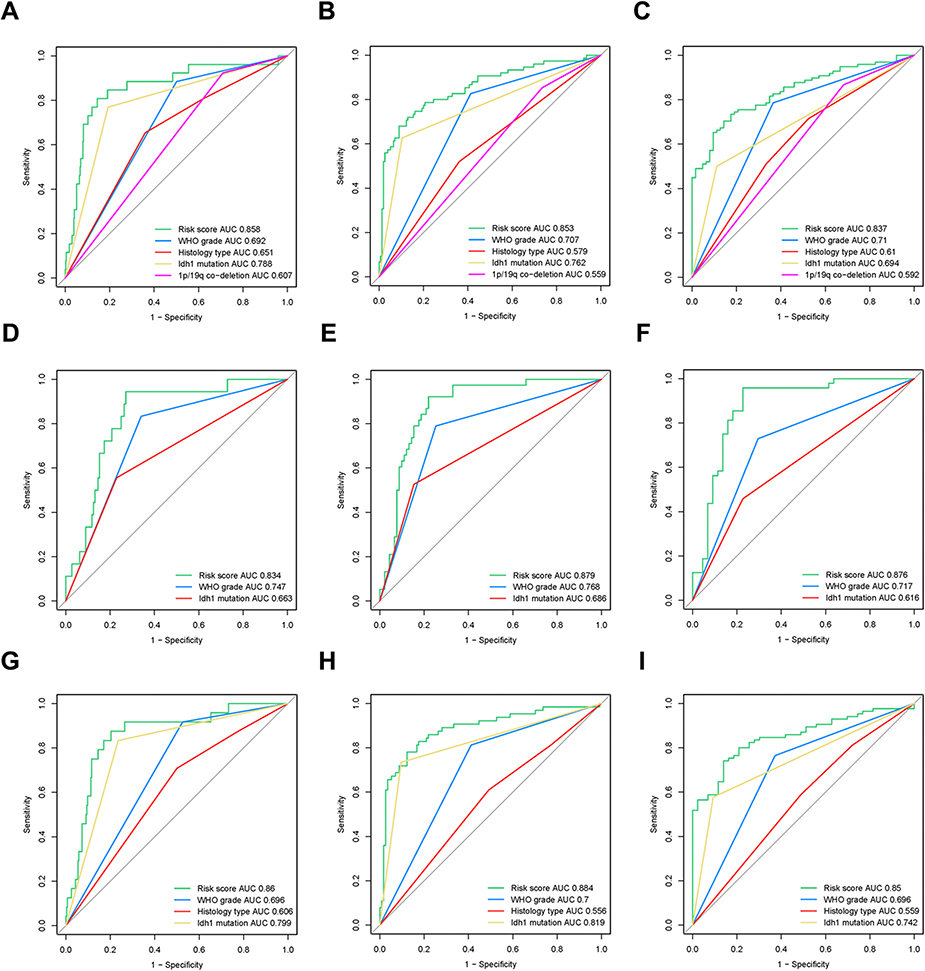 | Figure 6 Receiver Operator Characteristic (ROC) curve for the 4-gene-signature. (A–C) The ROC curve of the 1-year (A), 3-year (B), and 5-year (C) survival rates of 4-gene-signature in TCGA (training set). (D–F) The ROC curve of the 1-year (D), 3-year (E), and 5-year (F) survival rates of 4-gene-signature in CGGA (validation set). (G–I) The ROC curve of the 1-year (G), 3-year (H), and 5-year (I) survival rates of 4-gene-signature in chr1p/19q non-co-deletion patients in TCGA. |
Comparing the prediction accuracy of OS between 4-gene-signature and other published models
Next, we compared the predictive power of this 4-gene-signature and other published models in the TCGA and CGGA datasets. The time-dependent ROC curve showed that our 4-gene signature had significantly superior predictive capability compared to previously published models14–16 (Figure 7A and B). Whether in the TCGA or CGGA dataset, our 4-gene-signature C-index was greater than 0.8, thus indicating a high consistency of the model with patient survival. For patients with a patient survival over 5 years, this model has the strongest predictive power.
 | Figure 7 Concordance index showing measure of concordance of 4-gene-signature with overall survival of lower grade glioma patients. (A) TCGA-LGG; (B) CGGA. |
GSEA
To investigate the possible functions of the 4-gene signature, we did a GSEA in TCGA-LGG based on the risk group calculated by the signature. In TCGA-LGG and CGGA datasets, six pathways, namely, “KEGG_JNK_STAT_SIGNALING_PATHWAY,” “KEGG_MISMATCH_REPAIR,” “KEGG_APOPTOSIS,” “KEGG_CELL_CYCLE,” “KEGG_P53_SIGNALING_PATHWAY,” and “KEGG_DNA_REPLICATION” were significantly enriched in the high risk group (Figure 8A and B). These results suggest that the difference in prognosis between the high-risk group and the low-risk group may be due to the different proliferation and apoptosis of tumor cells, and this different biological behavior may be mediated by the p53 pathway and the JNK-STAT pathway.
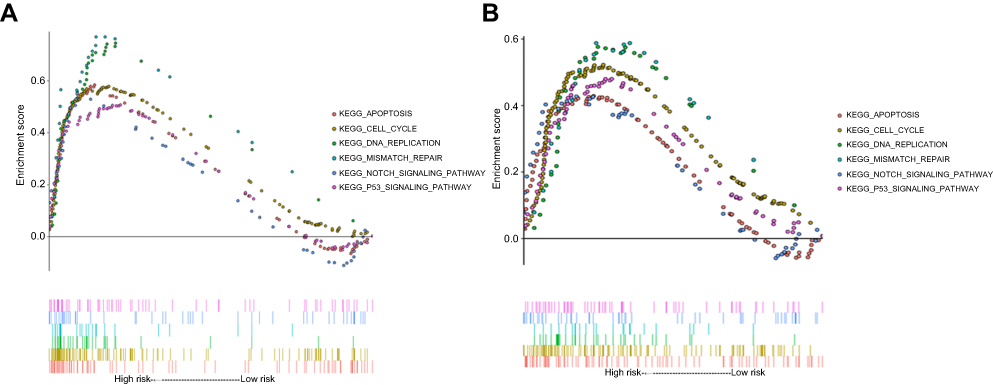 | Figure 8 Gene Set Enrichment Analysis (GSEA) of risk score results. KEGG pathway, named “KEGG_CELL_CYCLE,” “KEGG_APOPTOSIS,” “KEGG_DNA_REPLICATION,” “KEGG_MISMATCH_REPAIR,” “KEGG_NOTCH_SIGNALING_PATHWAY,” and “KEGG_P53_SIGNALING_PATHWAY” was significantly enriched in TCGA (A) and CGGA (B). |
Discussion
The prognosis of lower grade gliomas has traditionally been determined by histologic type and histologic grade, while over recent years the molecular markers have gained increasing attention3 According to Brat et al,3 patients with IDH mutations and 1p/19q co-deficiency have the best prognosis, while patients with only IDH mutations have the second highest prognosis, and IDH wild-type and 1p/19q wild type patients have the worst prognosis. Other prognostic factors include ATRX mutation,3,17 TERT promoter mutations,18 CIC loss,19,20 FUBP1 loss19,20 and PTEN loss21 The 1p/19q co-deletion is a well-recognized prognostic factor in glioma that often leads to high sensitivity to chemotherapy.22–25 Yet, the specific mechanisms still remain unclear. The TCGA and CGGA datasets have large sample size, detailed clinical pathological information and good data quality, which facilitates the study of the molecular characteristics of chr1p/19q co-deletion in lower grade glioma at the genomic and transcriptome levels.
In this study, we obtained a total of 1,346 DEGs by comparing the cancer with normal brain tissue in GSE16011. We further screened the genes encoded by chromosome 1p/19q, resulting in 76 DEGs. Chromosome 1 is gene-dense, and it contains 3,141 genes and 991 pseudogenes, and many overlapping coding sequences. Chromosomal 1p contains genes associated with DNA damage repairing, spindle checkpoint function, apoptosis, Wnt signaling pathways, and tumor suppression5 Chromosome 19 has approximately 64 million base pairs, accounting for more than 2% of the human genome26 Chromosome 1p deletion is generally associated with the initiation of carcinogenesis7 Abnormal chromosome 19 may cause tumorigenesis through tumor suppressor gene deletion,27 DNA repair dysfunction,28 abnormal regulation of TGF-β pathway6 and NF-κB pathway29 However, in lower grade glioma, chr1p/19q co-deletion is a beneficial prognosis marker, which is not consistent with existing research. We hypothesized that during the tumorigenesis, certain “driver genes” on the chr1p/19q become activated, and their high expression leads to a worse phenotype of tumor cells, thus negatively affecting the patient’s prognosis. Because chr1p/19q contains a large number of genes, a part of these genes may lead to tumorigenesis, while another part may be related to the prognosis of patients.
In lower grade glioma, the genes on chr1p/19q have strong collinearity. In order to obtain stable prognosis-related genes, we performed a robustness test on the genes obtained from univariate COX analysis with P<0.05. We performed 100 iterations with R package rbsurv and finally obtained 23 genes with stable prognosis in the TCGA-LGG cohort. After further incorporating these 23 genes into the multivariate COX proportional hazard regression model, only four genes remained. Regardless of the training set or the validation set, the AUC value of 1 year, 3 years or 5 years was 0.8 or more. Therefore, we hypothesize that these four genes are the “driver genes” in chr1p/19q. Kinesin family member 2C (KIF2C/MCAK, chr1p34) is the member of the motor proteins family30 that has been identified as a novel marker for prognosis in human gliomas31 Interferon induced protein 44 (IFI44, chr1p31.1) is part of the type I IFN-inducible gene family that was previously thought to be an inflammation-related gene.32,33 Currently, the role of IFI44 in cancer remains unclear. Epithelial membrane protein 3 (EMP3, chr19q13.13) that is often inactivated by hypermethylation-mediated transcriptional repression in many types of cancer, was previously thought to be a tumor suppressor gene.34–36 Recent studies have also reported that EMP3 may promote the development of glioblastoma by activating the transforming growth factor (TGF)-β/Smad2/3 signaling pathway and is associated with poor prognosis of GBM35 G protein subunit gamma 12(GNG12, chr1p31.3) is a member of the G protein family that belongs to the G protein g subunit37 Previous studies have shown that it may be involved in processes such as cytoskeletal function38 and cell growth39
The reasons why the loss of chr1p/19q lead to an increase in overall survival in lower grade glioma patients still appear to be unclear. In the current study, we aimed to reveal the molecular mechanism underlying chr1p/19q co-deletion leading to prolonged survival in patients with lower grade glioma from the bioinformatics perspective. We first performed KEGG analysis and visualization on 76 DEGs encoded by chr1p/19q. The cell cycle pathway was the most significantly enriched pathway, which can explain the prognosis of patients with chr1p/19q co-deletion to a certain extent. Furthermore, based on the risk scores obtained from the 4-gene-signature, we divided the patients into two groups and performed GSEA analysis. Similar to the results of KEGG, the cell cycle was also significantly enriched in GSEA. In addition, the p53 pathway, the DNA damage repair pathway, and the apoptotic pathway were also significantly enriched. Liu et al40 have found that the expression of Ki-67 protein (an indicator of cell proliferation) in 1p/19q co-deficient oligodendroglioma is down-regulated Palfi et al41 have found that glioma cell apoptosis is more pronounced in ch1p/19q co-deletion patients compared with non-co-deletion patients41 This is consistent with our functional analysis results.
There are some limitations in this study. First, the prognostic risk score established was based on the Illumina RNA-seq platform. If the data comes from other platforms, it needs to be standardized before it can be included in the formula. Therefore, the application of this model is limited. Second, the genes in this model are in general less studied in lower grade glioma, which is why the specific mechanisms remain unclear, and should be further investigated and verified using the experimental approach. Third, the prognostic model only considers genes that are highly expressed in lower grade glioma relative to adjacent cancer, but does not consider the prognostic role of non-differentiated genes. Some molecules may not be highly expressed in cancer, but still affect the prognosis of patients via other means. These molecules were not considered in this study. Fourth, since the number of normal samples is small (eight cases), the differential gene screening may lead to an increase in the number of final DEGs and affect the accuracy of the results.
Conclusions
In this study, we established a 4-gene-signature based on the chr1p/19q co-deletion by employing integrated bioinformatics analysis. We demonstrated that this model has stronger predictive power than traditional grade, molecular biomarkers and published models. In addition, we found that the prolongation of survival in patients with chr1p/19q co-deletion might be related to the changes in pathways such as cell cycle and DNA mismatch repair. The four genes in this signature are promising molecular targets, especially for chr1p/19q non-co deletion patients.
Acknowledgments
This study was funded by the National Science and Technology Major Project of the Ministry of Science and Technology of China (No. 2017ZX09304025), Science and Technology Plan Project of Liaoning Province (NO. 2016007010), and the General Projects of Liaoning Province Colleges and Universities (LFWK201706).
Disclosure
The authors report no conflicts of interest in this work.
References
1. Ostrom QT, Gittleman H, Farah P, et al. CBTRUS statistical report: primary brain and central nervous system tumors diagnosed in the United States in 2006-2010. Neuro-Oncology. 2013;15(Suppl 2):ii1–ii56. doi:10.1093/neuonc/not151
2. Claus EB, Walsh KM, Wiencke JK, et al. Survival and low-grade glioma: the emergence of genetic information. Neurosurg Focus. 2015;38(1):E6. doi:10.3171/2014.10.FOCUS12367
3.
4. Vogelbaum MA, Hu C, Peereboom DM, et al. Phase II trial of pre-irradiation and concurrent temozolomide in patients with newly diagnosed anaplastic oligodendrogliomas and mixed anaplastic oligoastrocytomas: long term results of RTOG BR0131. J Neurooncol. 2015;124(3):413–420. doi:10.1007/s11060-015-1845-7
5. Payne CM, Crowley-Skillicorn C, Bernstein C, Holubec H, Bernstein H. Molecular and cellular pathways associated with chromosome 1p deletions during colon carcinogenesis. Clin Exp Gastroenterol. 2011;4:75–119. doi:10.2147/CEG.S17114
6. Li H, Da LJ, Fan WD, Long XH, Zhang XQ. Transcription factor glioma-associated oncogene homolog 1 is required for transforming growth factor-beta1-induced epithelial-mesenchymal transition of non-small cell lung cancer cells. Mol Med Rep. 2015;11(5):3259–3268. doi:10.3892/mmr.2015.3150
7. Gregory SG, Barlow KF, McLay KE, et al. The DNA sequence and biological annotation of human chromosome 1. Nature. 2006;441(7091):315–321. doi:10.1038/nature04727
8. Eckel-Passow JE, Lachance DH, Molinaro AM, et al. Glioma groups based on 1p/19q, IDH, and TERT promoter mutations in tumors. N Engl J Med. 2015;372(26):2499–2508. doi:10.1056/NEJMoa1407279
9. Subramanian A, Tamayo P, Mootha VK, et al. Gene set enrichment analysis: a knowledge-based approach for interpreting genome-wide expression profiles. Proc Natl Acad Sci U S A. 2005;102(43):15545–15550. doi:10.1073/pnas.0506580102
10. Liberzon A, Subramanian A, Pinchback R, Thorvaldsdottir H, Tamayo P, Mesirov JP. Molecular signatures database (MSigDB) 3.0. Bioinformatics. 2011;27(12):1739–1740. doi:10.1093/bioinformatics/btr260
11. Smyth GK. Linear models and empirical bayes methods for assessing differential expression in microarray experiments. Stat Appl Genet Mol Biol. 2004;3. Article3. doi:10.2202/1544-6115.1018
12. Robin X, Turck N, Hainard A, et al. pROC: an open-source package for R and S+ to analyze and compare ROC curves. BMC Bioinformatics. 2011;12:77. doi:10.1186/1471-2105-12-77
13. Gerds TA, Kattan MW, Schumacher M, Yu C. Estimating a time-dependent concordance index for survival prediction models with covariate dependent censoring. Stat Med. 2013;32(13):2173–2184. doi:10.1002/sim.5681
14. Chen B, Liang T, Yang P, et al. Classifying lower grade glioma cases according to whole genome gene expression. Oncotarget. 2016;7(45):74031–74042. doi:10.18632/oncotarget.12188
15. Zhang C, Li J, Wang H, Song SW. Identification of a five B cell-associated gene prognostic and predictive signature for advanced glioma patients harboring immunosuppressive subtype preference. Oncotarget. 2016;7(45):73971–73983. doi:10.18632/oncotarget.12605
16. Bao ZS, Li MY, Wang JY, et al. Prognostic value of a nine-gene signature in glioma patients based on mRNA expression profiling. CNS Neurosci Ther. 2014;20(2):112–118. doi:10.1111/cns.12171
17. Kannan K, Inagaki A, Silber J, et al. Whole-exome sequencing identifies ATRX mutation as a key molecular determinant in lower-grade glioma. Oncotarget. 2012;3(10):1194–1203. doi:10.18632/oncotarget.689
18. Chan AK, Yao Y, Zhang Z, et al. TERT promoter mutations contribute to subset prognostication of lower-grade gliomas. Mod Pathol. 2015;28(2):177–186. doi:10.1038/modpathol.2014.94
19. Sahm F, Koelsche C, Meyer J, et al. CIC and FUBP1 mutations in oligodendrogliomas, oligoastrocytomas and astrocytomas. Acta Neuropathol. 2012;123(6):853–860. doi:10.1007/s00401-012-0993-5
20. Chan AK, Pang JC, Chung NY, et al. Loss of CIC and FUBP1 expressions are potential markers of shorter time to recurrence in oligodendroglial tumors. Mod Pathol. 2014;27(3):332–342. doi:10.1038/modpathol.2013.165
21. Sabha N, Knobbe CB, Maganti M, et al. Analysis of IDH mutation, 1p/19q deletion, and PTEN loss delineates prognosis in clinical low-grade diffuse gliomas. Neuro-Oncology. 2014;16(7):914–923. doi:10.1093/neuonc/not299
22. Jiang H, Ren X, Cui X, et al. 1p/19q codeletion and IDH1/2 mutation identified a subtype of anaplastic oligoastrocytomas with prognosis as favorable as anaplastic oligodendrogliomas. Neuro-Oncology. 2013;15(6):775–782. doi:10.1093/neuonc/not027
23. Kouwenhoven MC, Gorlia T, Kros JM, et al. Molecular analysis of anaplastic oligodendroglial tumors in a prospective randomized study: a report from EORTC study 26951. Neuro-Oncology. 2009;11(6):737–746. doi:10.1215/15228517-2009-011
24. Minniti G, Arcella A, Scaringi C, et al. Chemoradiation for anaplastic oligodendrogliomas: clinical outcomes and prognostic value of molecular markers. J Neurooncol. 2014;116(2):275–282. doi:10.1007/s11060-013-1288-y
25. Frenel JS, Leux C, Loussouarn D, et al. Combining two biomarkers, IDH1/2 mutations and 1p/19q codeletion, to stratify anaplastic oligodendroglioma in three groups: a single-center experience. J Neurooncol. 2013;114(1):85–91. doi:10.1007/s11060-013-1152-0
26. Grimwood J, Gordon LA, Olsen A, et al. The DNA sequence and biology of human chromosome 19. Nature. 2004;428(6982):529–535. doi:10.1038/nature02399
27. Gill RK, Yang SH, Meerzaman D, et al. Frequent homozygous deletion of the LKB1/STK11 gene in non-small cell lung cancer. Oncogene. 2011;30(35):3784–3791. doi:10.1038/onc.2011.98
28. Xiao M, Xiao S, Straaten TV, et al. Genetic polymorphisms in 19q13.3 genes associated with alteration of repair capacity to BPDE-DNA adducts in primary cultured lymphocytes. Mutat Res. 2016;812:39–47. doi:10.1016/j.mrgentox.2016.10.004
29. Mantovani F, Tocco F, Girardini J, et al. The prolyl isomerase Pin1 orchestrates p53 acetylation and dissociation from the apoptosis inhibitor iASPP. Nat Struct Mol Biol. 2007;14(10):912–920. doi:10.1038/nsmb1306
30. Manning AL, Ganem NJ, Bakhoum SF, Wagenbach M, Wordeman L, Compton DA. The kinesin-13 proteins Kif2a, Kif2b, and Kif2c/MCAK have distinct roles during mitosis in human cells. Mol Biol Cell. 2007;18(8):2970–2979. doi:10.1091/mbc.e07-02-0110
31. Bie L, Zhao G, Wang YP, Zhang B. Kinesin family member 2C (KIF2C/MCAK) is a novel marker for prognosis in human gliomas. Clin Neurol Neurosurg. 2012;114(4):356–360. doi:10.1016/j.clineuro.2011.11.005
32. Hallen LC, Burki Y, Ebeling M, et al. Antiproliferative activity of the human IFN-alpha-inducible protein IFI44. J Interferon Cytokine Res. 2007;27(8):675–680. doi:10.1089/jir.2007.0021
33. Power D, Santoso N, Dieringer M, et al. IFI44 suppresses HIV-1 LTR promoter activity and facilitates its latency. Virology. 2015;481:142–150. doi:10.1016/j.virol.2015.02.046
34. Alaminos M, Davalos V, Ropero S, et al. EMP3, a myelin-related gene located in the critical 19q13.3 region, is epigenetically silenced and exhibits features of a candidate tumor suppressor in glioma and neuroblastoma. Cancer Res. 2005;65(7):2565–2571. doi:10.1158/0008-5472.CAN-04-4283
35. Fumoto S, Hiyama K, Tanimoto K, et al. EMP3 as a tumor suppressor gene for esophageal squamous cell carcinoma. Cancer Lett. 2009;274(1):25–32. doi:10.1016/j.canlet.2008.08.021
36. Yue H, Xu Q, Xie S. High EMP3 expression might independently predict poor overall survival in glioblastoma and its expression is related to DNA methylation. Medicine. 2018;97(1):e9538. doi:10.1097/MD.0000000000009538
37. Yasuda H, Lindorfer MA, Myung CS, Garrison JC. Phosphorylation of the G protein gamma12 subunit regulates effector specificity. J Biol Chem. 1998;273(34):21958–21965.
38. Asano T, Morishita R, Matsuda T, Fukada Y, Yoshizawa T, Kato K. Purification of four forms of the beta gamma subunit complex of G proteins containing different gamma subunits. J Biol Chem. 1993;268(27):20512–20519.
39. Luo C, Zhao S, Dai W, Zheng N, Wang J. Proteomic analyses reveal GNG12 regulates cell growth and casein synthesis by activating the Leu-mediated mTORC1 signaling pathway. Biochim Biophys Acta Proteins Proteom. 2018;1866(11):1092–1101. doi:10.1016/j.bbapap.2018.08.013
40. Liu Y, Hu H, Zhang C, Wang Z, Li M, Jiang T. Integrated analysis identified genes associated with a favorable prognosis in oligodendrogliomas. Genes Chromosomes Cancer. 2016;55(2):169–176. doi:10.1002/gcc.22323
41. Palfi S, Swanson KR, De Bouard S, et al. Correlation of in vitro infiltration with glioma histological type in organotypic brain slices. Br J Cancer. 2004;91(4):745–752. doi:10.1038/sj.bjc.6602048
Supplementary material
 © 2019 The Author(s). This work is published and licensed by Dove Medical Press Limited. The full terms of this license are available at https://www.dovepress.com/terms.php and incorporate the Creative Commons Attribution - Non Commercial (unported, v3.0) License.
By accessing the work you hereby accept the Terms. Non-commercial uses of the work are permitted without any further permission from Dove Medical Press Limited, provided the work is properly attributed. For permission for commercial use of this work, please see paragraphs 4.2 and 5 of our Terms.
© 2019 The Author(s). This work is published and licensed by Dove Medical Press Limited. The full terms of this license are available at https://www.dovepress.com/terms.php and incorporate the Creative Commons Attribution - Non Commercial (unported, v3.0) License.
By accessing the work you hereby accept the Terms. Non-commercial uses of the work are permitted without any further permission from Dove Medical Press Limited, provided the work is properly attributed. For permission for commercial use of this work, please see paragraphs 4.2 and 5 of our Terms.