")
Back to Journals » International Journal of Chronic Obstructive Pulmonary Disease » Volume 10 » Issue 1
Comprehensive analysis of gene-expression profile in chronic obstructive pulmonary disease
Authors Wei L, Xu D, Qian Y, Huang G, Ma W, Liu F, Shen Y, Wang Z, Li L, Zhang S, Chen Y
Received 29 May 2014
Accepted for publication 31 July 2014
Published 10 June 2015 Volume 2015:10(1) Pages 1103—1109
DOI https://doi.org/10.2147/COPD.S68570
Checked for plagiarism Yes
Review by Single anonymous peer review
Peer reviewer comments 4
Editor who approved publication: Dr Richard Russell
Lei Wei,1,* Dong Xu,2,* Yechang Qian,1 Guoyi Huang,1 Wei Ma,1 Fangying Liu,1 Yanhua Shen,1 Zhongfu Wang,1 Li Li,1 Shanfang Zhang,1 Yafang Chen1
1Department of Respiratory Disease, Baoshan District Hospital of Integrated Traditional Chinese and Western Medicine, Shanghai, 2Medical College of Soochow University, Suzhou, People's Republic of China
*These authors contributed equally to this work
Objective: To investigate the gene-expression profile of chronic obstructive pulmonary disease (COPD) patients and explore the possible therapeutic targets.
Methods: The microarray raw dataset GSE29133, including three COPD samples and three normal samples, was obtained from Gene Expression Omnibus. After data preprocessing with the Affy package, Student’s t-test was employed to identify the differentially expressed genes (DEGs). The up- and downregulated DEGs were then pooled for gene-ontology and pathway-enrichment analyses using the Database for Annotation, Visualization and Integrated Discovery (DAVID). The upstream regulatory elements of these DEGs were also explored by using Whole-Genome rVISTA. Furthermore, we constructed a protein–protein interaction (PPI) network for DEGs. The surfactant protein D (SP-D) serum level and HLA-A gene frequency in COPD patients and healthy controls were also measured by enzyme-linked immunosorbent assay (ELISA) and real-time polymerase chain reaction, respectively.
Results: A total of 39 up- and 15 downregulated DEGs were screened. Most of the upregulated genes were involved in the immune response process, while the downregulated genes were involved in the steroid metabolic process. Moreover, we also found that HLA-A has the highest degree in the PPI network. The SP-D serum level and HLA-A gene frequency in COPD patients were significantly higher than those in healthy controls (13.62±2.09 ng/mL vs 10.28±2.86 ng/mL; 62.5% vs 12.5%; P<0.05).
Conclusion: Our results may help further the understanding of the mechanisms of COPD. The identified DEGs, especially HLA-A, may serve as diagnosis markers for COPD.
Keywords: chronic obstructive pulmonary disease, differentially expressed genes, gene-ontology analysis, protein–protein interaction
Introduction
Chronic obstructive pulmonary disease (COPD) is an inflammatory disease distinguished by progressive airflow limitation and parenchyma destruction.1 It is a major and increasing global health problem, which is predicted to become the fourth leading cause of death and the fifth commonest cause of disability in the world by 2030.2
Tobacco smoking is by far the most important risk factor involved in the development of COPD. Patients with COPD often experience abnormal pulmonary inflammation. This is characterized by increased number of inflammatory cells (neutrophils, macrophages, and T-lymphocytes) and the release of multiple inflammatory mediators (lipids, chemokines, cytokines, and growth factors).3,4 The increase in the inflammatory response cells and subsequently released mediators further amplify the normal inflammatory response to tobacco smoking in COPD disease.5
In addition, the involvement of genetic factors in the pathogenesis of COPD has also been proven through the observation that individuals with severe deficiency for alpha-1-antitrypsin, a major inhibitor of serine proteases, have an increased risk of developing COPD. Individuals with a severe deficiency for alpha-1-antitrypsin tend to develop more severe COPD at an earlier age.6 However, it is proving difficult to identify specific biomarkers to aid diagnosis of the disease. Better understanding the pathogenesis of COPD will help us explore novel treatments for COPD.
Gene-expression profiling of human diseased tissues may provide new insights into the molecular mechanisms of human disease and eventually lead to the identification of novel therapeutic targets.7 A high-throughput microarray experiment was designed to analyze genetic expression patterns and identify potential target genes for COPD. The identification of potential differentially expressed genes (DEGs) may assist in improved COPD diagnosis.8
In this study, we analyzed the gene-expression profiles of lung-tissue samples collected from COPD patients and healthy controls to identify DEGs. Then, gene-ontology functional and pathway-enrichment analyses were conducted for the DEGs. Furthermore, transcription-factor analysis of the constructed protein–protein interaction (PPI) network was performed. The surfactant protein D (SP-D) serum level and HLA-A gene frequency in COPD patients and healthy controls were also measured.
Materials and methods
Affymetrix® microarray data
One transcription profile of GSE291339 that included six samples of alveolar epithelial type II cells from the lung tissues of three COPD and three non-COPD patients was obtained from a public functional genomics data repository, the Gene Expression Omnibus (http://www.ncbi.nlm.nih.gov/geo/). The transcriptome of the samples was determined using Affymetrix HG U133A GeneChips (Affymetrix, Cleveland, OH, USA).
Identification of DEGs
Background correction and quantile normalization were performed for the raw array data using the Affy10 package (http://www.bioconductor.org/) and robust multi-array average (RMA).11 The probes without corresponding gene symbols were filtered. The average value of a gene symbol with multiple probes was calculated. Then the gene-expression signal intensities were recalculated using custom chip description files (Brainarray lab, http://brainarray.mbni.med.umich.edu/) by the median polish method. Student’s t-test was employed to obtain the P-values. DEGs were selected with P-values less than 0.05 and fold-change values larger than two.
Gene-ontology and pathway-enrichment analyses
Gene-ontology (GO) terms and Kyoto Encyclopedia of Genes and Genomes (KEGG) pathways were enriched for DEGs by the Functional Annotation Clustering Tool in the Database for Annotation, Visualization and Integrated Discovery (DAVID; v 6.7, http://david.abcc.ncifcrf.gov).12 The major GO terms associated with biological processes and cellular components were manually summarized based on gene-term enrichment buttons provided for each functional group at a P-value of <0.1.
Regulatory elements analysis
DEGs were divided into up- and downregulated genes. The promoter region was defined as the 1 kb regions upstream of transcription start site of the gene. The Whole-Genome rVISTA (WGRV)13 was used to perform the motif finding on the promoter regions. The P-value of motif-finding results should be less than 0.05.
Construction of protein–protein interaction network
DEGs were submitted to Search Tool for the Retrieval of Interacting Genes (STRING; v 9.0)14 and PPIs of COPD signature genes were retained. In our analysis, only interactions with higher probabilistic confidence scores from the text mining, databases, or experiments were retained. Then, the obtained DEG interactions were used to construct a PPI network that was visualized by Cytoscape software (version 2.8).15
Measurement of surfactant protein D serum level
Eight COPD patients were randomly selected from patients without other respiratory disorders (such as asthma or bronchiectasis) or undertaking chemotherapy treatment in our department. Meanwhile, eight healthy controls were enrolled from the health examination center of our hospital. The demographics of these eight patients and eight healthy controls are listed in Table 1. The age, sex, and smoking history of the COPD patients and healthy controls were matched. This study was approved by the Ethics Committee at Baoshan District Hospital of Integrated Traditional Chinese and Western Medicine.
 | Table 1 The demographics of the eight COPD patients and eight healthy controls (mean ± standard deviation) |
Whole blood (5 mL) samples were collected from the eight COPD patients and eight healthy controls. The serum samples obtained by centrifugation were used for detection of SP-D with an enzyme-linked immunosorbent assay (ELISA) kit (Shanghai Biovol Technologies Co, Shanghai, People’s Republic of China) according to the manufacturer’s instructions. Briefly, microtiter wells coated with SP-D antibodies were incubated with 100 μL diluted serum and calibrator samples at 4°C for 24 hours after blocking nonspecific binding. The wells were then washed with phosphate-buffered saline (PBS) and incubated at 37°C for 1 hour with 100 μL horseradish peroxidase-conjugated anti-SP-D antibody. To the washed wells was then added 100 μL tetramethylbenzene and the wells were incubated at room temperature for 15 minutes. Finally, 50 μL of NaN3 (2 mM) was added to terminate the peroxidase reaction and the absorbance was measured at 450 nm. All assays were performed in triplicate.
Detection of HLA-A by real-time polymerase chain reaction
The total RNA was extracted from whole blood samples of the eight COPD patients and eight healthy controls using a blood extraction kit (Tiangen Biotech Co, Beijing, People’s Republic of China) according to the manufacturer’s protocol. The RNA concentration was determined by ultraviolet spectrophotometry, and the purity was assessed by the ratio of A260/A280. Then, RNA (50 ng) was reverse transcribed into complementary DNA (cDNA) using the TIAN Script Kit (Tiangen Biotech Co). The following primers (Sangon Biotech Co, Shanghai, People’s Republic of China) were used: 5′-CAC TCC ATG AGG TAT TTC TT-3′ (forward) and 5′-CTC CAG GTA GGC TCT CAA-3′ (reverse) for HLA-A; and 5′-AAG GTC GGA GTC AAC GG-3′ (forward) and 5′- ATC TCG GGC GGG AAT AG-3′ (reverse) for the internal control glyceraldehyde-3-phosphate dehydrogenase (GAPDH). The polymerase chain reaction (PCR) was undertaken in a 25 μL mixture system containing 5.5 μL 10× Ex Taq™ buffer, 1 μL of primers (10 μM), 2 μL deoxyribonucleotide (dNTP), 2.5 μL cDNA, and 0.5 μL Ex Taq polymerase (TaKaRa). The amplification was performed under the following conditions: 2 minutes at 95°C; five cycles of 35 seconds at 95°C, 40 seconds at 65°C, 75 seconds at 72°C; ten cycles of 35 seconds at 95°C, 40 seconds at 55°C, 90 seconds at 72°C; 5 minutes of extension at 72°C. Finally, agarose gel electrophoresis and imaging were conducted for PCR products.
Statistical analysis
Data were expressed as mean ± standard deviation. Changes in the values between the COPD and control samples were analyzed by paired t-test using SPSS software (v17.0; IBM, Armonk, NY, USA). A P-value <0.05 was considered to be statistically significant.
Results
Differentially expressed genes of COPD
A total of 39 upregulated and 15 downregulated DEGs in COPD samples were identified (Figure 1). The dysregulated genes may play a major role in COPD. The top ten up- and downregulated DEGs are listed in Table 2.
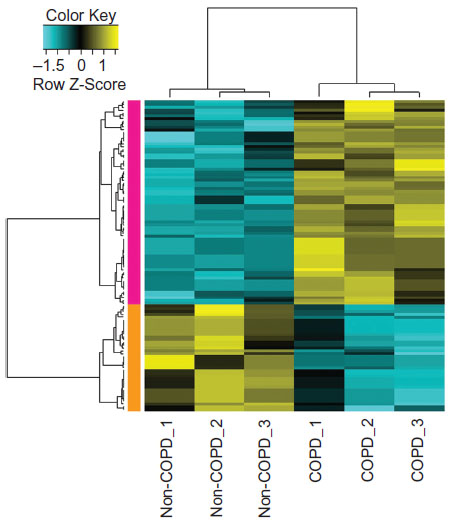 | Figure 1 Heat-map results of the differentially expressed genes between samples of alveolar epithelial type II cells from lung tissues of COPD patients and normal controls. The left column with orange color represents the downregulated genes in COPD patients and the left column with pink color represents the upregulated genes in COPD. The colors in the microarray results represent fold change in each sample, with yellow indicating upregulated genes, blue indicating downregulated genes, and black indicating median-expressed genes. |
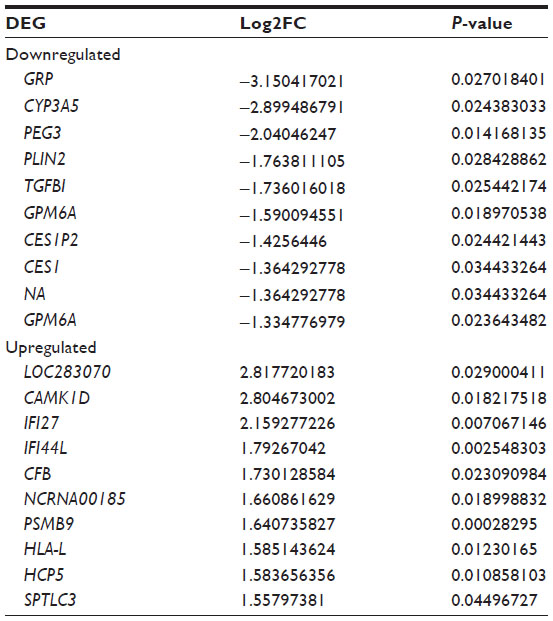 | Table 2 The top ten up- and downregulated differentially expressed genes (DEGs) |
Gene-ontology functional and pathway-enrichment analyses of the DEGs
The upregulated genes were involved in the immune response, antigen processing and presentation, positive regulation of immune response, and negative regulation of caspase activity, while the downregulated genes were significantly related to the functions of response to drugs, regulation of transcription, and especially steroid metabolic process (Table 3).
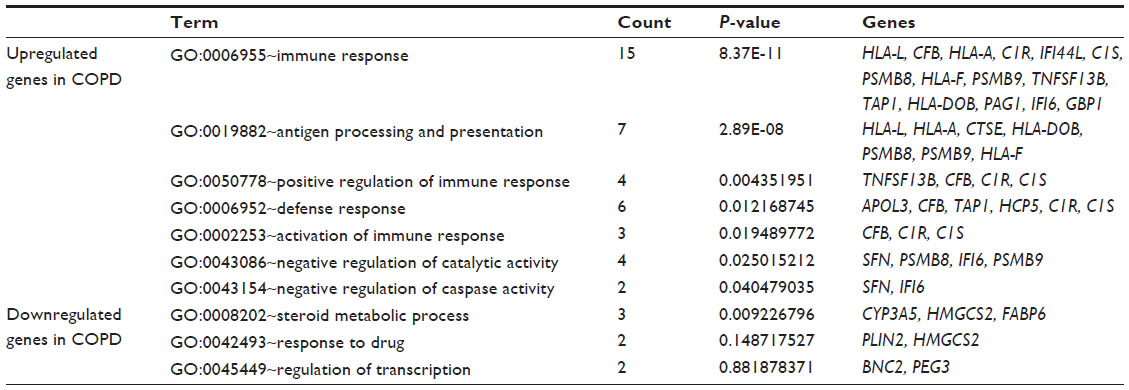 | Table 3 Gene-ontology functional enrichment analysis of the differentially expressed genes |
Furthermore, KEGG pathway analysis revealed that upregulated genes, including TAP1, HLA-A, HLA-DOB, and HLA-F, were strongly associated with the antigen processing and presentation pathway (P=0.001065854). The downregulated genes such as HMGCS2 and FABP6 were associated with the peroxisome proliferator-activated receptor (PPAR) signaling pathway (P=0.05319786220472053).
Moreover, we also found that the upregulated genes APOL3, TNFSF13B, CFB, C1R, C1S, and SFN were located in the extracellular region (Table 4) and that all of these except for SFN were found to be involved in the immune-response process. In addition, the downregulated genes INHBB, GRP, PLIN2, and TGFBI also belonged to the extracellular protein genes (Table 4).
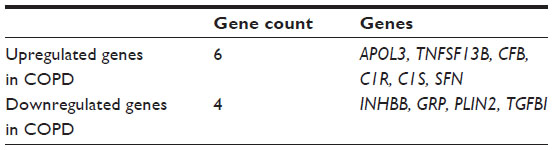 | Table 4 The differentially expressed genes involved in extracellular region |
Protein–protein interaction network of the DEGs
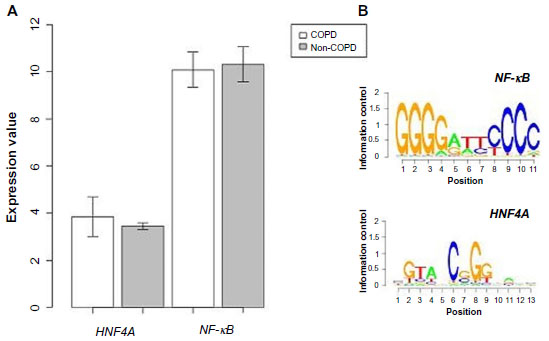
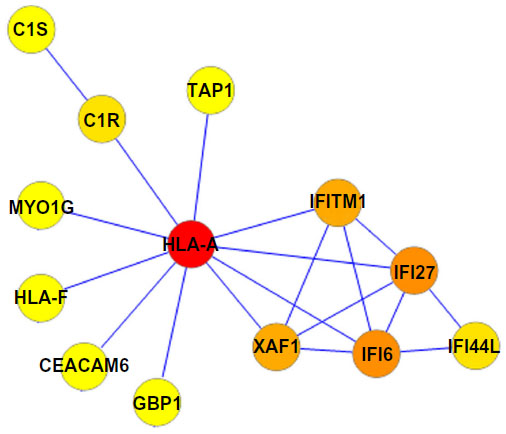
A PPI network consisting of up- and downregulated genes/proteins was identified by STRING. In our network (Figure 2), human class I histocompatibility antigen (HLA-A) had the highest degree (=10), suggesting that this gene may play an important role in COPD. A total of 13 other genes were also involved in this network. We also performed transcription-factor analysis on these 13 genes by WRVG and found that the hepatocyte nuclear factor 4 alpha (HNF4A) motif was presented in the genes of NTM, C1R, IFI6, C1S, and TAP1, with a P-value of <0.05. Nuclear factor kappa-light-chain-enhancer of activated B-cells (NF-κB) motif was found in HLA-A gene with a P-value of <0.005. However, there was no significant difference in the expression levels of these two genes between the COPD and control samples (Figure 3).
 | Figure 2 Protein–protein interaction network in COPD patients. Nodes with colors from yellow to red represent different degrees. The lowest degree, 1, is represented by yellow and the highest degree, 10, by red. |
 | Figure 3 (A) The expression level of nuclear factor kappa-light-chain-enhancer of activated B-cells (NF-κB) and hepatocyte nuclear factor 4 alpha (HNF4A) in COPD and non-COPD. (B) Motif finding results of NF-κB and HNF4A. |
Surfactant protein D serum level and the HLA-A gene in COPD patients and healthy controls
The ELISA measurement results for SP-D serum level showed that the SP-D serum level in the eight COPD patients was significantly higher than that in the eight healthy controls (13.62±2.09 ng/mL vs 10.28±2.86 ng/mL, P<0.05, Figure 4A). What’s more, the HLA-A gene was detected in the blood samples of one healthy control and five COPD patients (Figure 4B). The HLA-A gene frequency in the eight healthy controls (1/8, 12.5%) was obviously lower than that in the eight COPD patients (5/8, 62.5%) (P<0.05).
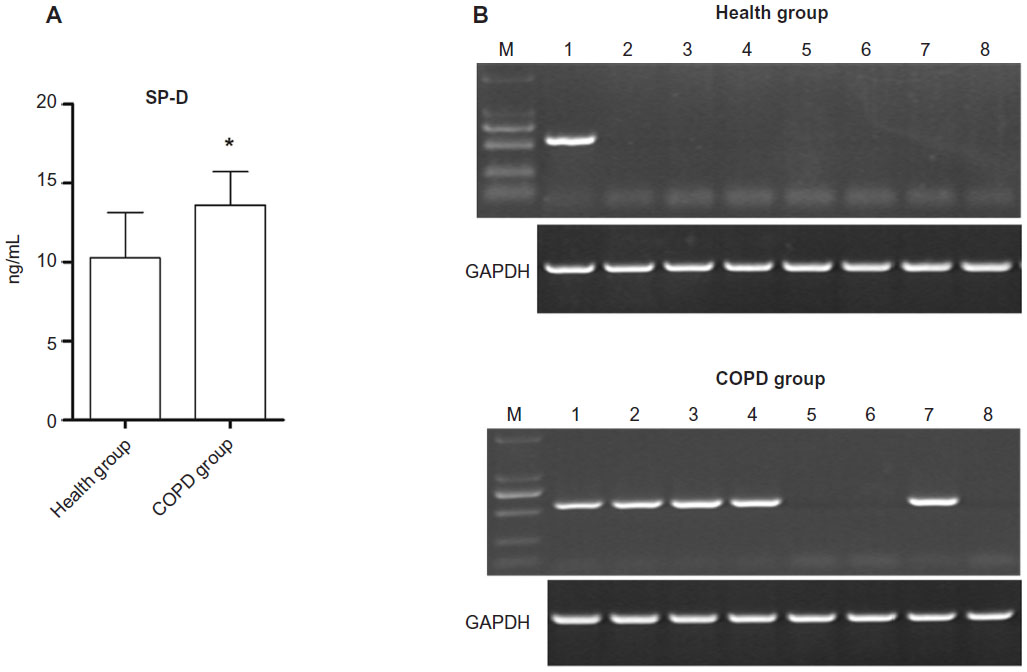 | Figure 4 (A) The surfactant protein D (SP-D) serum levels of COPD patients and healthy control (*P<0.05, compared with the healthy group). (B) The HLA-A gene frequency in the blood samples of eight healthy controls (1/8, 12.5%) and eight COPD patients (5/8, 62.5%). |
Discussion
In our study, nine upregulated and 15 downregulated DEGs were identified. Fujino et al found that 156 and 82 were up- and downregulated, respectively, in COPD alveolar epithelial type II cells which might be due to the methods for DEG identification being different.9 In particular, the probe with the maximum value of genes corresponding to more than one probe was adopted in their study, while we calculated the average value of gene symbols using multiple probes for further analysis. Of the screened DEGs, four genes (TAP1, HLA-A, HLA-DOB, and HLA-F) related to immune response and the antigen processing and presentation pathway were upregulated significantly in the COPD compared with in the control samples, while HMGCS2 and FABP6, which participate in the PPAR inflammatory pathway, were downregulated. In the study of Fujino et al, functional annotation revealed that upregulated genes, such as TAP1, TAP2, PSMB8, PSMB9, PSMB10, HLA-B, and HLA-C, were associated with antigen processing and presentation.9 Therefore, the results of our study are similar to those of the study of Fujino et al to some extent. Moreover, in our study, HLA-A with the highest degree in the PPI network was indicated as playing an important role in COPD.
According to a previous study, the genes TAP1, HLA-A, HLA-DOB, and HLA-F are involved in the major histocompatibility complex (MHC) class I pathway.16 Once a cytotoxic cluster of differentiation (CD)8 T-cells recognizes specific antigens loaded on the MHC class I molecule, the CD8 T-cells will kill the somatic cells using proteolytic enzymes, including granzyme A or B and perforin.17 The numbers of CD8 T-cells in the airways17,18 and alveoli19 of patients with COPD are correlated with airflow limitation. Furthermore, the CD8 T-cells in the lungs of patients with COPD20 exhibit oligoclonal expansion, suggesting that the infiltrated CD8 T-cells are antigen specific. Moreover, Park et al revealed an association of the HLA-A gene with diffuse panbronchiolitis in Korean patients.21 Their finding was further proved by Maruyama et al, who suggested that anti-HLA class I antibodies alone could induce obliterative airway disease in heterotopic murine tracheal allografts by inducing growth-factor production, apoptosis, and the chemotaxis of inflammatory cells.22
Faner et al investigated the distribution of HLA class II alleles (DR and DQ) in the blood samples of COPD patients and found that the frequency of HLA class II allele DRB1*14 was significantly higher in COPD patients.23 However, as far as we are aware, few studies have investigated differences in the frequency of HLA-A between COPD patients and healthy controls. Therefore, the HLA-A gene frequency in the blood samples of COPD patients and healthy controls was measured in our study. We also found that the HLA-A gene frequency in the blood samples of COPD patients (62.5%) was significantly higher than in the healthy controls (12.5%). Therefore, the pathological processes involved in COPD might be mediated by HLA-A.
“SP-D” is a lung-derived protein that has been suggested as a potential biomarker for inflammatory lung disease, and many studies have revealed that the level of serum SP-D in COPD patients is significantly elevated.24–26 The level of serum SP-D detected in our study confirms the reliability of the blood samples collected from COPD patients.
Conclusion
Our results may help to further understanding of the mechanism of COPD. The identified multiple pathways will also provide novel avenues in the treatment of COPD. HLA-A may serve as a diagnosis marker for COPD. However, the sample size in our study was relative small, and the DEGs among different stages of COPD were not identified due to the sample size. In our further studies, the results will be confirmed using a larger sample size, and samples will be collected from COPD patients with different stages to study the development of the COPD.
Acknowledgment
This study was supported by the Shanghai Construction Project of Integrated Traditional Chinese and Western Medicine (zxbz2012–06).
Disclosure
The authors declare no conflicts of interest in this work.
References
Celli BR, MacNee W; ATS/ERS Task Force. Standards for the diagnosis and treatment of patients with COPD: a summary of the ATS/ERS position paper. Eur Respir J. 2004;23(6):932–946. | |
Mathers CD, Loncar D. Projections of global mortality and burden of disease from 2002 to 2030. PLoS Med. 2006;3(11):e442. | |
Barnes PJ. Mechanisms in COPD: differences from asthma. Chest. 2000;117(Suppl 2):10S–14S. | |
Chung KF. Cytokines as targets in chronic obstructive pulmonary disease. Curr Drug Targets. 2006;7(6):675–681. | |
MacNee W. Pathogenesis of chronic obstructive pulmonary disease. Proc Am Thorac Soc. 2005;2(4):258–266; discussion 290–291. | |
Pauwels RA, Rabe KF. Burden and clinical features of chronic obstructive pulmonary disease (COPD). Lancet. 2004;364(9434):613–620. | |
Chen ZH, Kim HP, Ryter SW, Choi AM. Identifying targets for COPD treatment through gene expression analyses. Int J Chron Obstruct Pulmon Dis. 2008;3(3):359–370. | |
Bhattacharya S, Srisuma S, Demeo DL, et al. Molecular biomarkers for quantitative and discrete COPD phenotypes. Am J Respir Cell Mol Biol. 2009;40(3):359–367. | |
Fujino N, Ota C, Takahashi T, et al. Gene expression profiles of alveolar type II cells of chronic obstructive pulmonary disease: a case-control study. BMJ Open. 2012;2(6). Pii: e001553. | |
Gautier L, Cope L, Bolstad BM, Irizarry RA. Affy – analysis of Affymetrix GeneChip data at the probe level. Bioinformatics. 2004; 20(3):307–315. | |
Irizarry RA, Hobbs B, Collin F, et al. Exploration, normalization, and summaries of high density oligonucleotide array probe level data. Biostatistics. 2003;4(2):249–264. | |
Huang da W, Sherman BT, Lempicki RA. Systematic and integrative analysis of large gene lists using DAVID bioinformatics resources. Nat Protoc. 2009;4(1):44–57. | |
Dubchak I, Munoz M, Poliakov A, et al. Whole-Genome Rvista: a tool to determine enrichment of transcription factor binding sites in gene promoters from transcriptomic data. Bioinformatics. 2013;29(16):2059–2061. | |
Franceschini A, Szklarczyk D, Frankild S, et al. STRING v9.1: protein-protein interaction networks, with increased coverage and integration. Nucleic Acids Res. 2013;41(Database issue): D808–D815. | |
Smoot ME, Ono K, Ruscheinski J, Wang PL, Ideker T. Cytoscape 2.8: new features for data integration and network visualization. Bioinformatics. 2011;27(3):431–432. | |
Jensen PE. Recent advances in antigen processing and presentation. Nat Immunol. 2007;8(10):1041–1048. | |
O’Shaughnessy TC, Ansari TW, Barnes NC, Jeffery PK. Inflammation in bronchial biopsies of subjects with chronic bronchitis: inverse relationship of CD8+ T lymphocytes with FEV1. Am J Respir Crit Care Med. 1997;155(3):852–857. | |
Saetta M, Di Stefano A, Turato G, et al. CD8+ T-lymphocytes in peripheral airways of smokers with chronic obstructive pulmonary disease. Am J Respir Crit Care Med. 1998;157(3 Pt 1):822–826. | |
Saetta M, Baraldo S, Corbino L, et al. CD8+ve cells in the lungs of smokers with chronic obstructive pulmonary disease. Am J Respir Crit Care Med. 1999;160(2):711–717. | |
Korn S, Wiewrodt R, Walz YC, et al. Characterization of the interstitial lung and peripheral blood T cell receptor repertoire in cigarette smokers. Am J Respir Cell Mol Biol. 2005;32(2):142–148. | |
Park MH, Kim YW, Yoon HI, et al. Association of HLA class I antigens with diffuse panbronchiolitis in Korean patients. Am J Respir Crit Care Med. 1999;159(2):526–529. | |
Maruyama T, Jaramillo A, Narayanan K, Higuchi T, Mohanakumar T. Induction of obliterative airway disease by anti-HLA class I antibodies. Am J Transplant. 2005;5(9):2126–2134. | |
Faner R, Nuñez B, Sauleda J, et al; PAC-COPD Study Group. HLA distribution in COPD patients. COPD. 2013;10(2):138–146. | |
Lomas DA, Silverman EK, Edwards LD, et al; Evaluation of COPD Longitudinally to Identify Predictive Surrogate Endpoints study investigators. Serum surfactant protein D is steroid sensitive and associated with exacerbations of COPD. Eur Respir J. 2009;34(1):95–102. | |
Duvoix A, Miranda E, Perez J, et al. Evaluation of full-length, cleaved and nitrosylated serum surfactant protein D as biomarkers for COPD. COPD. 2011;8(2):79–95. | |
Winkler C, Atochina-Vasserman EN, Holz O, et al. Comprehensive haracterization of pulmonary and serum surfactant protein D in COPD. Respir Res. 2011;12(29):9921–9912. |
 © 2015 The Author(s). This work is published and licensed by Dove Medical Press Limited. The full terms of this license are available at https://www.dovepress.com/terms.php and incorporate the Creative Commons Attribution - Non Commercial (unported, v3.0) License.
By accessing the work you hereby accept the Terms. Non-commercial uses of the work are permitted without any further permission from Dove Medical Press Limited, provided the work is properly attributed. For permission for commercial use of this work, please see paragraphs 4.2 and 5 of our Terms.
© 2015 The Author(s). This work is published and licensed by Dove Medical Press Limited. The full terms of this license are available at https://www.dovepress.com/terms.php and incorporate the Creative Commons Attribution - Non Commercial (unported, v3.0) License.
By accessing the work you hereby accept the Terms. Non-commercial uses of the work are permitted without any further permission from Dove Medical Press Limited, provided the work is properly attributed. For permission for commercial use of this work, please see paragraphs 4.2 and 5 of our Terms.