")
Back to Journals » Cancer Management and Research » Volume 13
Comprehensive Analysis of 5-Methylcytosine Profiles of Messenger RNA in Human High-Grade Serous Ovarian Cancer by MeRIP Sequencing
Authors Meng L, Zhang Q, Huang X
Received 11 May 2021
Accepted for publication 10 July 2021
Published 3 August 2021 Volume 2021:13 Pages 6005—6018
DOI https://doi.org/10.2147/CMAR.S319312
Checked for plagiarism Yes
Review by Single anonymous peer review
Peer reviewer comments 3
Editor who approved publication: Professor Harikrishna Nakshatri
Li Meng, Qianqian Zhang, Xianghua Huang
Department of Gynecology, Hebei Medical University Second Affiliated Hospital, Shijiazhuang, Hebei, 050000, People’s Republic of China
Correspondence: Xianghua Huang
Department of Gynecology, Hebei Medical University Second Affiliated Hospital, 215 Heping Road, Shijiazhuang, Hebei, 050000, People’s Republic of China
Email [email protected]
Background: Accumulating evidence has indicated that methylation status is closely related to tumourigenesis and a few aggressive features of diverse cancers. However, as an important methylation regulation modification, the distribution of 5-methylcytosine (m5C) in high-grade serous ovarian cancer (HGSOC) remains unclear.
Materials and Methods: We collected three pairs of human HGSOC tissues and adjacent non-tumour tissues to analyse the transcriptome-wide m5C methylation of messenger RNAs (mRNAs) by methylated RNA immunoprecipitation sequencing. Gene ontology (GO) enrichment analysis and Kyoto Encyclopaedia of Genes and Genomes (KEGG) pathway analysis were performed to eExplore the potential biological functions of these genes and important cancer pathways. We used immunohistochemistry to analyse the expression of the m5C modification regulatory gene MAP2K3 in 80 HGSOC tissue samples, and their associations with clinical parameters were analyzed using the Spearman-rho test. Univariate and multivariate Cox regression analyses were performed to identify potential prognostic factors. Kaplan–Meier analysis was performed to analyze overall survival.
Results: We identified 2050 dysregulated m5C peaks, 1767 of which were significantly upregulated, while 283 were significantly downregulated. GO enrichment analysis showed that genes altered by the m5C peak played a key role in system development, transporter complex, and transporter activity. KEGG pathway analysis revealed that these genes were enriched in some important pathways in cancer regulation, such as inflammatory mediator regulation of the TRP channels pathway, Wnt signalling pathway, and focal adhesion pathways. In addition, through joint analysis of MeRIP-seq and RNA-seq data, we identified 125 differentially methylated m5C peaks and synchronous differentially expressed genes. These genes play key roles in cell growth, maintenance, plasma membranes, and cell adhesion molecule activity. Immunohistochemical staining results showed that high expression of MAP2K3 was significantly correlated with CA125 level (p < 0.001), tumour size (p = 0.001), lymph node metastasis (p = 0.008), depth of myometrial invasion (p < 0.001), and FIGO stage (p < 0.001), indicating a poor prognosis.
Conclusion: Our results reveal the different distribution patterns of m5C in HGSOC and adjacent tissues and the possible involvement of m5C in HGSOC cell functions. Our study provides new insights into the epi-transcriptomic dysregulation of m5C in the tumourigenesis of HGSOC.
Keywords: 5-methylcytosine, mRNA, high-grade serous ovarian cancer, RNA methylation, tumourigenesis
Introduction
As the second most common gynaecological malignancy, more than 80% of patients with ovarian cancer are diagnosed at an advanced stage of extensive peritoneal metastasis.1,2 High-grade serous ovarian cancer (HGSOC) is the most prevalent histotype of ovarian cancer, constituting more than 70% of ovarian cancer-related deaths.3 Despite the improvement in treatment for patients with HGSOC, the 5-year survival rate of patients diagnosed at the FIGO III or IV stage is less than 40%, making this disease the second most lethal gynaecological malignancy.4 Therefore, exploring novel and effective diagnostic and prognostic markers is urgently needed.
Increasing evidence has shown that post-transcriptional RNA modifications may serve as novel gene expression regulators, the disruption of which may lead to life-threatening diseases, including cancer.5,6 RNA epigenetic markers mainly include N6-methyladenosine (m6A), 5-methylcytosine (m5C), and pseudouridine (Ψ). RNA m5C, characterised by the addition of a methyl group at the carbon-5 position of the cytosine base, has been detected not only in rRNA and tRNA but also in mRNA by high-throughput sequencing-based transcriptome-wide mapping approaches.7 m5C is well-conserved and dynamically regulated in cellular mRNAs, and it localises to the untranslated regions (UTRs) of mRNA transcripts. It may influence a wide variety of biological functions by regulating RNA metabolism.8 Moreover, and RNA m5C modification and its regulators have been confirmed to play crucial roles in the pathogenesis of bladder cancer,9 hepatocellular carcinoma,10 glioblastoma multiforme,11 and leukaemia,12 indicating the promising prospect of m5C modification in cancer treatment. However, the quantity, distribution, and functions of m5C modification in mRNA in HGSOC remain unclear.
As an emerging mechanism in gene regulation, reversible m5C modification is regulated by “writers” (methyltransferases), “readers,” and “erasers” (demethylase) and affects various biological functions, such as cell function, development, immune system, and homeostasis.13 Huang et al discovered 11 m5C regulatory genes related to TNBC neoplasia in triple negative breast cancer (TNBC), which are related to the poor prognosis of NSUN2 and NSUN6 and TNBC.14 Xue et al study in head and neck squamous cell carcinoma (HNSCC) showed that the m5C regulatory genes MAPK1, HRAS, RAC1, HIST1H4K and HIST1H3C are potential driving genes of HNSCC and are potentially related to the occurrence of HNSCC.15 In addition, the demethylation of MAP2K3 is related to inflammation and immune regulation in HNSCC patients.16 However, the gene signatures and prognostic values of m5C-related regulators in HGSOC remain unknown.
In the present study, we performed m5C-seq, RNA-seq, and in-depth bioinformatics analyses to clarify the role of m5C in the pathogenesis of HGSOC. Through comprehensive analysis of MeRIP-seq and RNA-seq data, significant differences in the number and distribution of m5C peaks were noted in human HGSOC and matched adjacent normal tissues. Bioinformatics analysis showed that genes altered by the m5C peak played a key role in cell function and were involved in important cancer pathways. Furthermore, we used immunohistochemical methods to confirm that the m5C mRNA-regulated gene MAP2K3 was significantly associated with poor prognosis in HGSOC. Our findings provide a novel viewpoint that the m5C pathway is crucial for the pathogenesis of HGSOC.
Materials and Methods
Ethical Approval
The study has been approved by the Ethics Committee of the Institutional Review Board of The Second Hospital of Hebei Medical University, and the patient’s written informed consent was obtained before the study began. And the study was conducted in accordance with the Declaration of Helsinki.
Sample Collection and RNA Preparation
Each pair of HGSOC and corresponding adjacent tissues was obtained from the same patient with HGSOC. In total, three pairs of HCC and adjacent non-tumor tissue samples were obtained. Total RNA from each sample was isolated using TRIzol reagent (Invitrogen Corporation, Carlsbad, CA). The Ribo-Zero rRNA Removal Kit (Illumina, Inc., CA, USA) was then used to reduce the content of rRNA in the total RNA. A NanoDrop ND-1000 spectrophotometer (NanoDrop Technologies, Wilmington, DE, USA) was used to measure the RNA concentration of each sample, and RNA with OD260/OD280 between 1.8 and 2.1 was marked as qualified.
RNA MeRIP-Seq Construction and Sequencing
RNA MeRIP-seq was performed based on previously reported procedures with some modifications.17 In brief, the GenSeqTM m5C RNA IP kit (China GenSeq Inc.) was used for m5C RNA immunoprecipitation according to the manufacturer’s instructions. The cDNA library was constructed using the NEBNext Ultra II RNA Library Prep Kit for Illumina (New England Biolabs, Inc.). The Agilent Bioanalyzer 2100 system (Agilent Technologies, Inc., USA) was used to evaluate the quality and purity of the cDNA library. The cDNA libraries were sequenced on a HiSeq 6000 platform (Illumina, San Diego, CA, USA) with 100 bp paired-end reads.
Sequencing Data Analysis
Briefly, quality control of the paired-end reads was performed with Q30 and reads higher than 30 were considered reliable mapping and retained. Cutadapt software (v1.9.3) was used to trim the 3′ adaptors and remove low-quality reads to harvest high-quality clean reads.18 Then, clean reads of input libraries were aligned to the reference genome (GRCh38.gencode. v32) with STAR software19 and mRNA peaks were identified using DCC software.20 Following this, clean reads of all libraries were aligned to the reference genome (MM10) using hisat2 software (v2.0.4),21 followed by identifying methylated m5C peaks on mRNAs with Model-based Analysis of ChIP-Seq (MACS) software.22 Differentially methylated m5C peaks were identified with a fold change of >2 or <0.5 (p < 0.00001) using DiffReps software.23 The MeRIP-enriched regions (peaks) identified using both software and the section of m5C that overlapped with the exon of the protein-coding genes were further annotated by scripts developed in-house.
Statistical Analysis of the Distribution Characteristics of m5C Peaks
The m5C peaks on the mRNA of the three samples in the HGSOC group were combined to obtain the total m5C peaks, and the adjacent tissue group was treated in the same way. The sequences of the vertices of methylated peaks, which were 50 bp on each side of the apex, were scanned using Dreme software24 to find reliable motif sequences. Subsequently, we counted the mRNA region where the m5C peak was located in each sample according to published methods25 and plotted the results as a Pie chart. MetaPlotR software26 was used to draw the distribution map of the methylation peaks on the metagene for comparison between the two groups. In addition, heatmap.2 software package was used to perform clustering based on the fold enrichment (FE) of each mRNA in six samples. The color represents the size of the logFE value. The closer the color in the figure is to red, the larger the logFE value. And volcano plots were used to visualise different m5C peaks based on the logFE value of each gene in the six samples. Red and blue represent mRNA that is up-regulated and down-regulated, respectively.
Transcriptome Sequencing Analysis and Conjoint Analysis
High-quality reads were mapped onto the genome (human GENCODE v32) with hisat2 software (v2.0.4).21 Subsequently, HTSeq software (v0.9.1) was used to obtain gene level raw counts as mRNA expression profiles.27 Edge R software (v3.16.5) was used to normalise the data and screen differentially expressed mRNAs (RNA-seq data).28 Venn diagrams were performed to screen differentially regulated methylation-regulated annotation genes and genes that overlap with RNA-seq data. FunRich software (v3.1.3) was used to perform enrichment analysis of the overlapping genes.29
Bioinformatics Analysis
Gene ontology (GO) and Kyoto Encyclopaedia of Genes and Genomes (KEGG) pathway enrichment analyses were performed for annotation, visualisation, and integrated discovery using the DAVID database to reveal the functions of these differentially methylated genes.30 The ontology covers three parts: cellular molecular function (MF), biological process (BP), and component (CC). KEGG pathway analyses were used to predict the functions of differentially methylated and expressed genes. A p-value <0.05 was used as the cut-off criterion.
Immunofluorescence Staining
For immunohistochemical staining, 80 paraffin-embedded HGSOC tissue samples were collected from patients at the Second Hospital of Hebei Medical University (Shijiazhuang, China). Anti-rabbit MAP2K3 (1:500, Bioss Antibodies, USA) was used as the primary antibody. IHC staining was performed using a previously described protocol.31,32 The staining intensity was evaluated as follows: 0, no staining; 1, beige; 2, darker beige; and 3, tan. The staining extent was scored as follows: 0, 0% stained; 1, 1% to 25% stained; 2, 26% to 50% stained; and 3, 51% to 100% stained. The final scores were calculated by multiplying intensity score and extent score and judged as follows: 0 to 3, low staining (-/+) and 4 to 9, high staining (++/+++).
Statistical Analysis
The association between the expression of MAP2K3 and various clinicopathological parameters was analysed using the Spearman’s Rho test. The Kaplan-Meier method was used to generate survival curves. All statistical analyses were performed using SPSS 25.0, and significance was set at p < 0.05.
Results
General Features of m5C Methylation Map in HGSOC
In total, we found 20,802 m5C mRNA peaks in normal tissues and 13,856 m5C mRNA peaks in HGSOC. We mapped up to 9969 annotated genes in normal tissues and 7089 annotated genes in HGSOC tissues. Among them, 6291 m5C mRNA peaks appeared in both normal and HGSOC tissues, corresponding to 5514 annotated genes (Figure 1A and B). Circos software was used to further investigate the distribution of m5C peaks on chromosomes and found that the quantity and distribution of m5C peaks on each chromosome were different between HGSOC and adjacent normal tissues, with the most obvious difference on the first chromosome (Figure 1C).
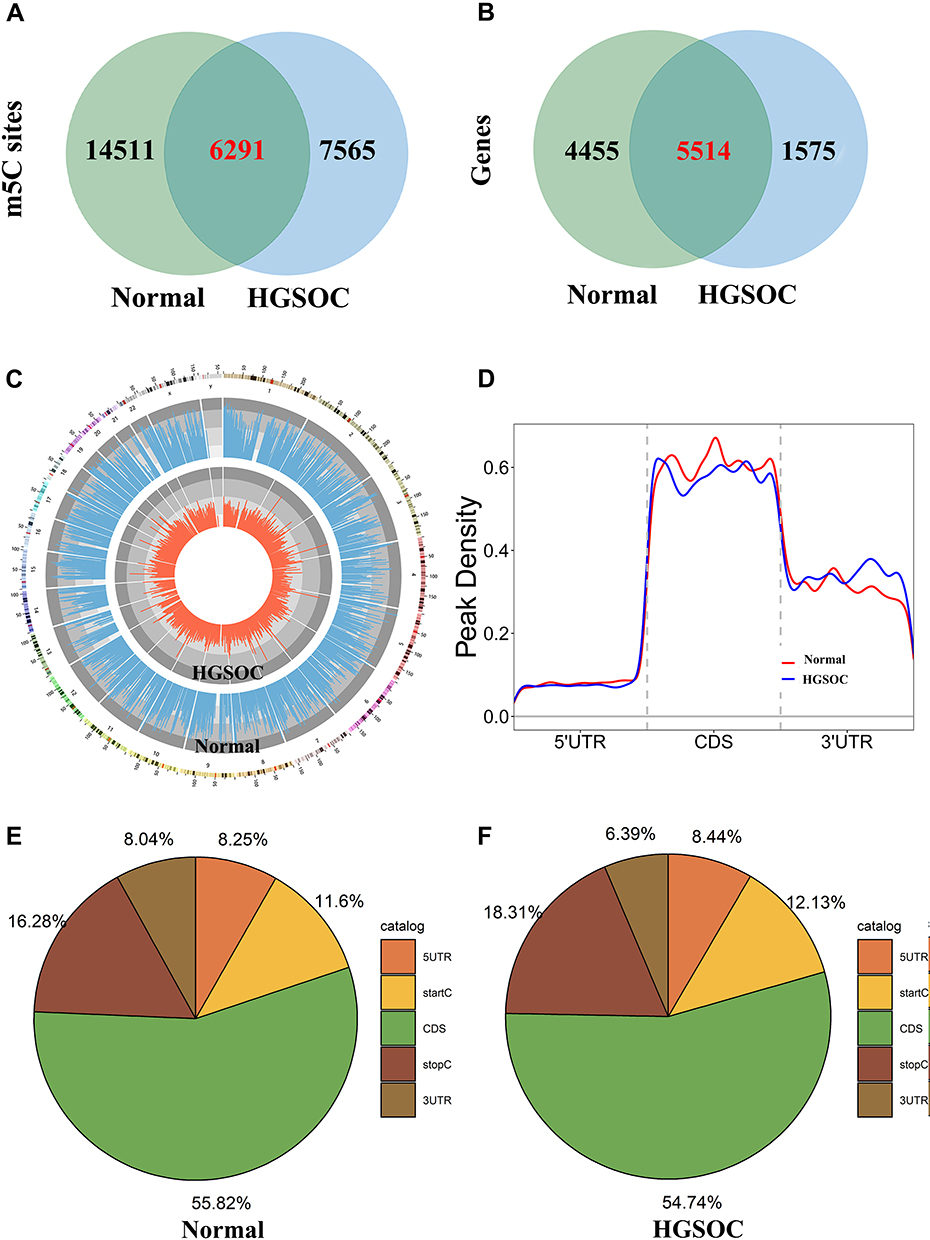 |
Figure 1 Characteristics of m5C peaks in normal and HGSOC tissues. Venn diagram of (A) m5C sites identified in mRNA and (B) m5C targeted genes from normal and HGSOC tissues. (C) Visualisation of m5C sites at the chromosome level in normal and HGSOC tissues. (D) Accumulation of the region of average m5C peaks along all transcripts in normal and HGSOC tissues. (E and F) Pie chart of the source of methylated mRNA in normal and HGSOC tissues. |
In addition, the analysis of the source of methylation peaks showed that m5C was distributed in all regions of mRNA and was mainly enriched in the coding sequence (Figure 1D–F). However, m5C peaks in HGSOC tissues showed a distinct pattern from peaks in normal tissues with a relative decrease in the number of m5C peaks in the coding sequence (CDS) (HGSOC: 54.74%, adjacent tissues: 55.82%) and 3′ untranslated region (3′UTR) (HGSOC: 6.39%, adjacent tissues: 8.04%), and a relative increase in the 5′ untranslated region (5′UTR) (HGSOC: 8.44%, adjacent tissues: 8.25%), start codon (startC; HGSOC: 12.13%, adjacent tissues: 11.6%), and stop codon (stopC) (HGSOC: 18.31%, adjacent tissues: 16.28%).
Motif Analysis and Differential m5C Methylation Analysis
We used the Dreme software to identify meaningful motif sequences. The results showed that CCAGSCUR (G = FFB300) was the most reliable methylation site motif (p = 7.1e-130) in normal tissues, whereas CAGSCUGG was the most reliable methylation site motif (p = 4.6e-067) in HGSOC (Figure 2A). In addition, we performed a methylation heatmap analysis and cluster analysis of the total data. The results of the cluster analysis showed the apparent expression difference between the groups and relatively consistent within group. And these differences may be closely related to the occurrence and development of HGSOC (Figure 2B). Furthermore, we used DiffReps software to identify 1474 upregulated m5C methylation peaks and 336 downregulated m5C methylation peaks (Figure 2C). We have listed the 20 mRNAs with the largest FC in Tables 1 and 2. These dysregulated m5C methylation peaks were distributed on all chromosomes and were mainly enriched on chromosome one (Figure 2D). Moreover, to determine the number of m5C peaks on each mRNA, we performed a statistical analysis of the methylation peaks and the corresponding mRNA. The results showed that most of the mRNAs with methylation sites in HGSOC tissues had only one methylation peak (65.65%), and this ratio was lower in adjacent tissues (68.98%). And the difference between the two groups has statistically significant (p < 0.05). At the same time, the number of mRNAs with three or more methylation peaks on one mRNA was higher in HGSOC tissues than that in adjacent normal tissues (p < 0.05) (Figure 2E).
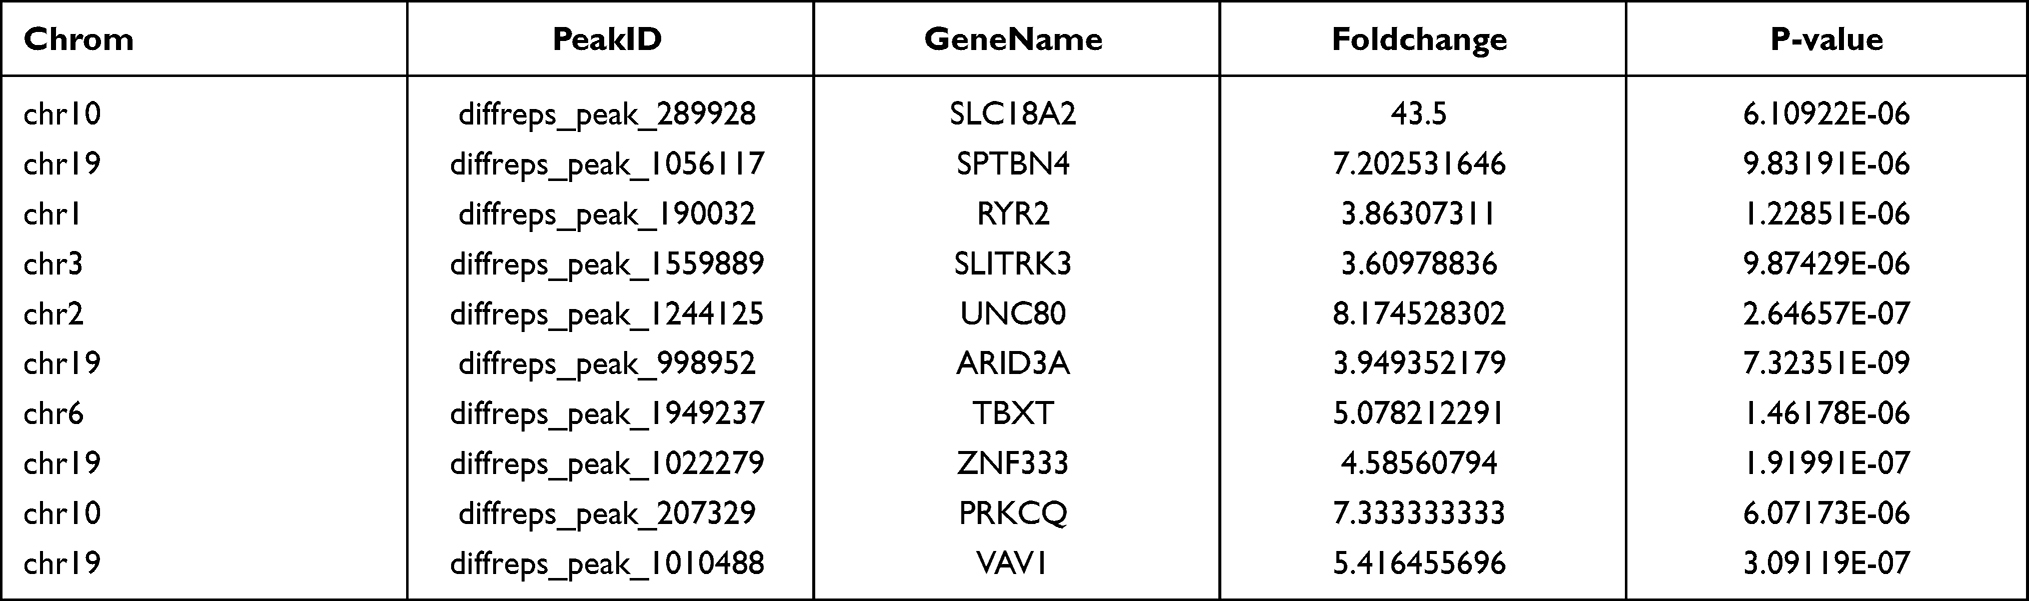 |
Table 1 Top Ten Upregulated m5C Methylation Peaks |
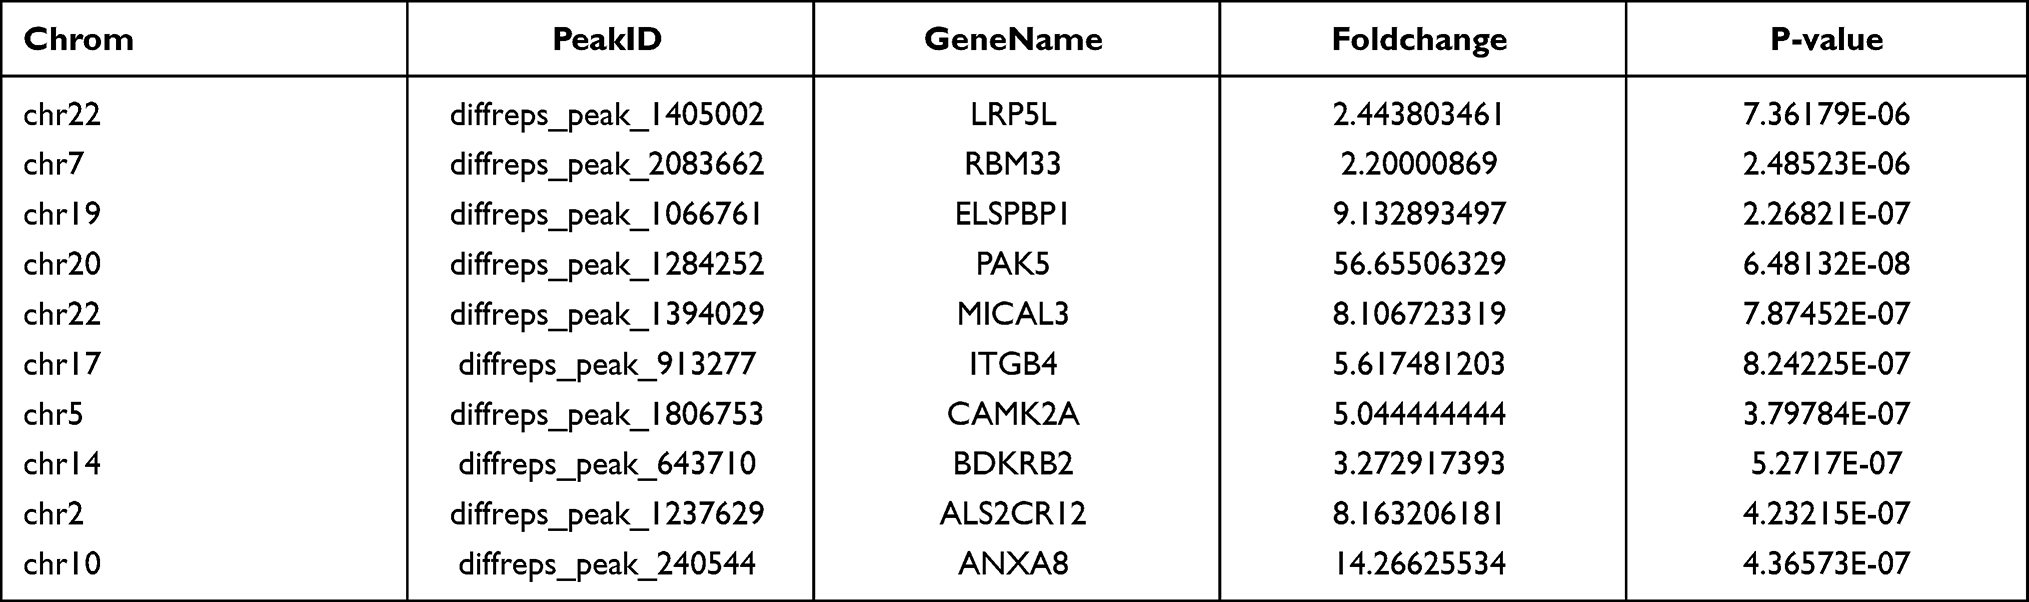 |
Table 2 Top Ten Downregulated m5C Methylation Peaks |
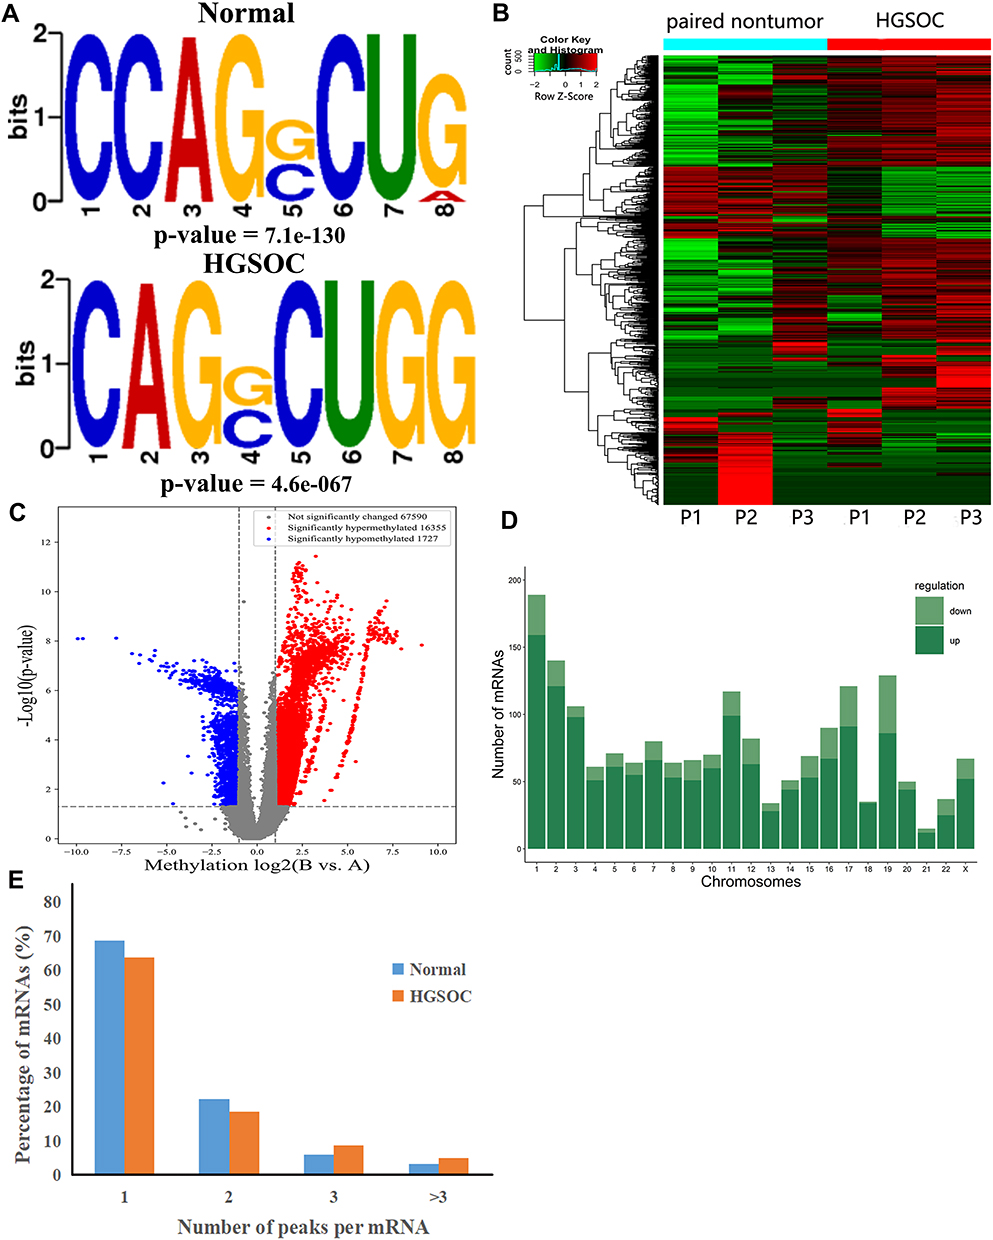 |
Figure 2 Characteristics of altered m5C peaks in normal and HGSOC tissues. (A) The sequence motif of m5C sites in normal and HGSOC tissues. (B) Cluster analysis of methylation in normal and HGSOC tissues. (C) Volcano plots showing the significantly differential m5C peaks. (D) The distributions of altered m5C peaks in human chromosomes. (E) The number of m5C peaks in normal and HGSOC tissues on each mRNA. Most mRNAs have only one methylation peak. |
GO and KEGG Pathway Analysis
To examine the biological function of differentially methylated mRNAs in HGSOC, we performed GO and KEGG pathway analyses. For up-methylated m5C sites in HGSOC tissues, GO analysis indicated that these genes were mainly enriched in system development (GO term: BP), transporter complex (GO term: CC), and transporter activity (GO term: MF) (Figure 3A–C). For down-methylated m5C sites in HGSOC tissues, GO analysis indicated that these genes were mainly enriched in the regulation of signalling (GO term: BP), synapse (GO term: CC), and protein serine/threonine kinase activity (GO term: MF) (Figure 3D–F).
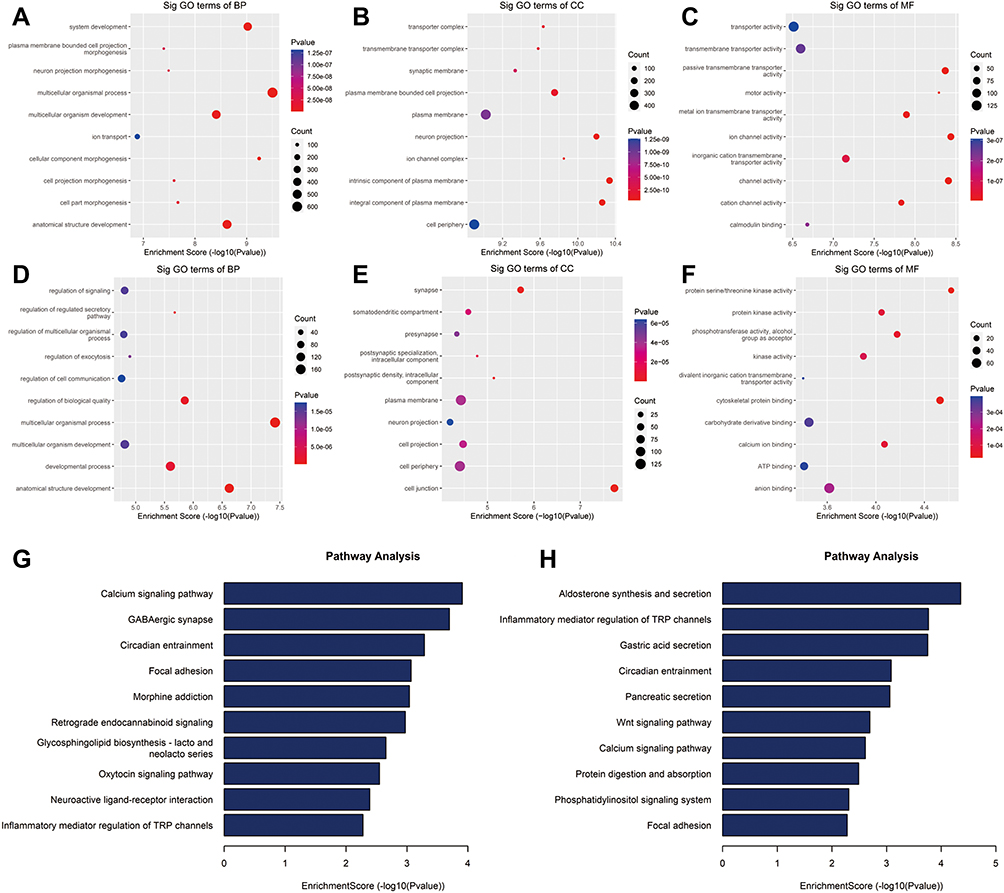 |
Figure 3 GO and KEGG enrichment analyses of HGSOC and adjacent tissues. (A) Biological processes, (B) cellular components, and (C) molecular functions of genes annotated by upregulated m5C peaks. (D) Biological processes, (E) cellular components, and (F) molecular functions of genes annotated by down-methylated m5C peaks. KEGG pathways of genes annotated by (G) up-methylated and (H) down-methylated m5C peaks. The top ten most significant terms are shown for each analysis. |
Pathway analysis showed that the upregulation of mRNA in HGSOC tissues was mainly involved in the calcium signalling pathway, GABAergic synapse, and circadian entrainment pathway (Figure 3G). Down-methylated mRNAs were significantly enriched in aldosterone synthesis and secretion, inflammatory mediator regulation of TRP channels, and the gastric acid secretion pathway (Figure 3H).
Conjoint Analysis of MeRIP-Seq and RNA-Seq Data
We detected the transcriptome profiles of HGSOC tissues versus adjacent normal tissues using hisat2 software (v2.0.4). Differentially expressed genes were detected using edgeR software (v3.16.5). Compared with normal tissues, HGSOC tissues had 541 significantly upregulated genes and 319 significantly downregulated genes. The top 20 differentially expressed genes are listed in Tables 3 and 4. Subsequently, all differentially methylated m5C peaks with differential mRNA levels (125) were divided into four groups by conjoint analysis of the MeRIP-seq and RNA-seq data. We identified 101 hypermethylated m5C peaks in mRNAs that were significantly upregulated (65; hyper-up) or downregulated (36; hyper-down), while 27 hypomethylated m5C peaks in mRNAs were significantly upregulated (15; hypo-up) or downregulated (12; hypo-down) (Figure 4A) (Supplementary File, Table S1 for details).
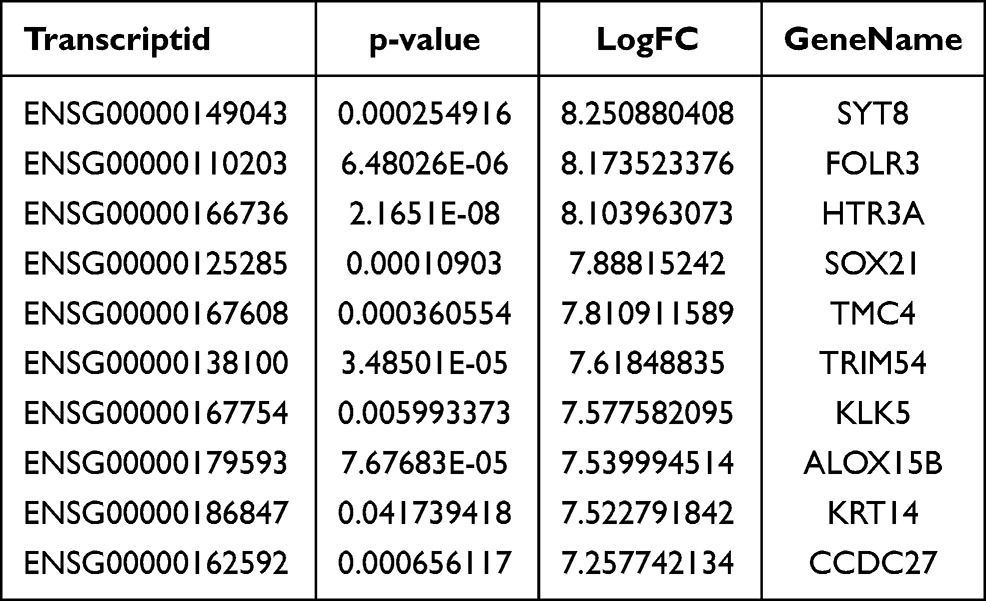 |
Table 3 Top Ten Upregulated Differentially Expressed mRNAs |
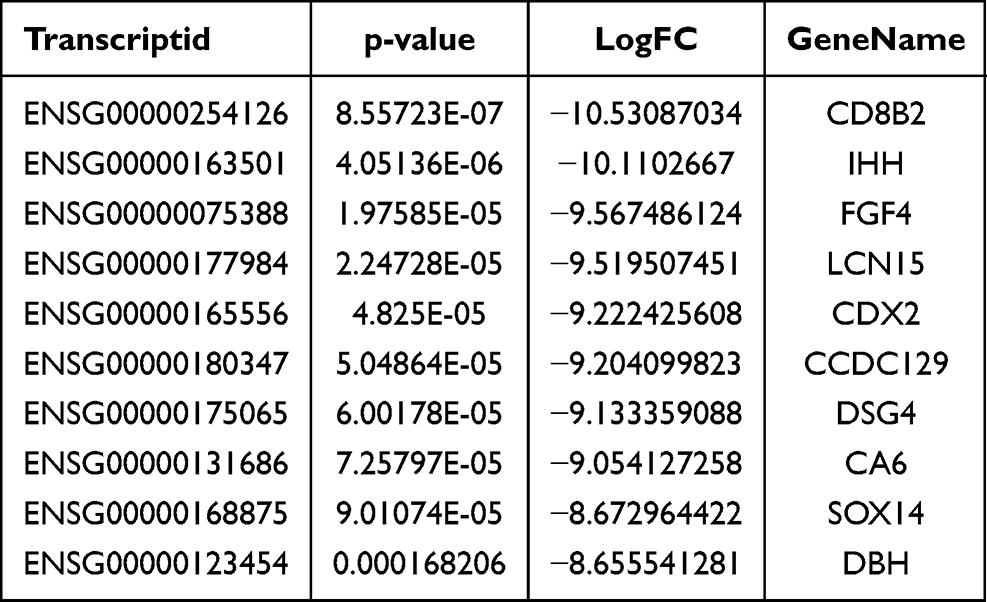 |
Table 4 Top Ten Downregulated Differentially Expressed mRNAs |
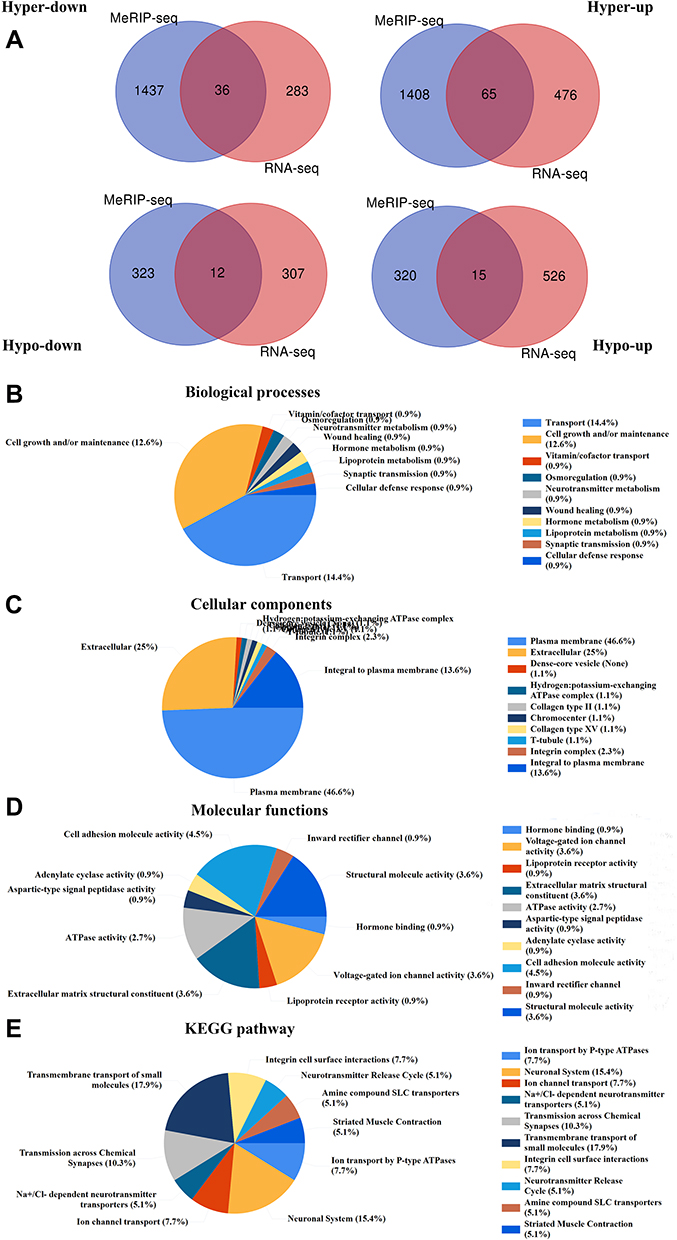 |
Figure 4 Joint analysis of MeRIP-seq and RNA-seq data. (A) Venn diagram displaying differentially expressed mRNAs with significant changes in both the m5C modification and mRNA levels. The top 10 GO terms of (B) biological processes, (C) cellular components, and (D) molecular functions were significantly enriched for mRNA-annotated genes with significant changes in both the m5C modification and mRNA levels. (E) The top ten KEGG pathways of mRNA-annotated genes with significant changes in both the m5C modification and mRNA levels. |
GO and KEGG pathway analyses were performed to investigate the biological significance of these genes (125). GO analysis indicated that these genes were mainly enriched in cell growth and maintenance (12.6%) (GO term: BP), plasma membrane (46.6%) (GO term: CC), and cell adhesion molecule activity (4.5%) (GO term: MF) (Figure 4B–D). KEGG pathway analysis revealed that these genes were primarily enriched in transmission across chemical synapses (10.3%), transmembrane transport of small molecules (17.9%), and integrin cell surface interactions (7.7%) (Figure 4E).
Gene Expression Regulated by m5C Modification Correlates with Clinical Parameters of Patients with HGSOC
Finally, we found there are 15 hypomethylated m5C peaks with upregulated in mRNAs, of which MAP2K3 is an oncogene, we observed that the m5C regulatory gene MAP2K3 was enriched in several important pathways, such as the “inflammatory mediator regulation of TRP channels”, “GnRH signalling pathway”, “rap1 signalling pathway” and “MAPK signalling pathway”. Therefore, we first verified the expression of MAP2K3 in 3 pairs of samples. As expected, MAP2K3 has low expression in the paired normal tissues, and the expression in HGSOC tissues ranges from weakly positive to strong positive expression (Figure 5A). Then, we obtained 80 clinical samples to investigate the potential relationship between the abnormal m5C regulatory gene MAP2K3 and the prognosis of patients with HGSOC. Figure 5B shows representative images of MAP2K3 staining in HGSOC tissue. MAP2K3 staining was primarily in the nucleus, but the staining scores varied from low to high among HGSOC tissues. Table 5 summarises the association between the expression of MAP2K3 and the clinicopathological characteristics of patients with HGSOC. There were 28/80 cases with low MAP2K3 expression and of 52/80 cases with high MAP2K3 expression. MAP2K3 expression was correlated with CA125 levels (p < 0.001), tumour size (p = 0.001), lymph node metastasis (p = 0.008), depth of myometrial invasion (p < 0.001), and FIGO stage (p < 0.001). Cox regression analysis revealed that high expression of MAP2K3 indicated a poor prognosis (p = 0.005, Figure 5A).
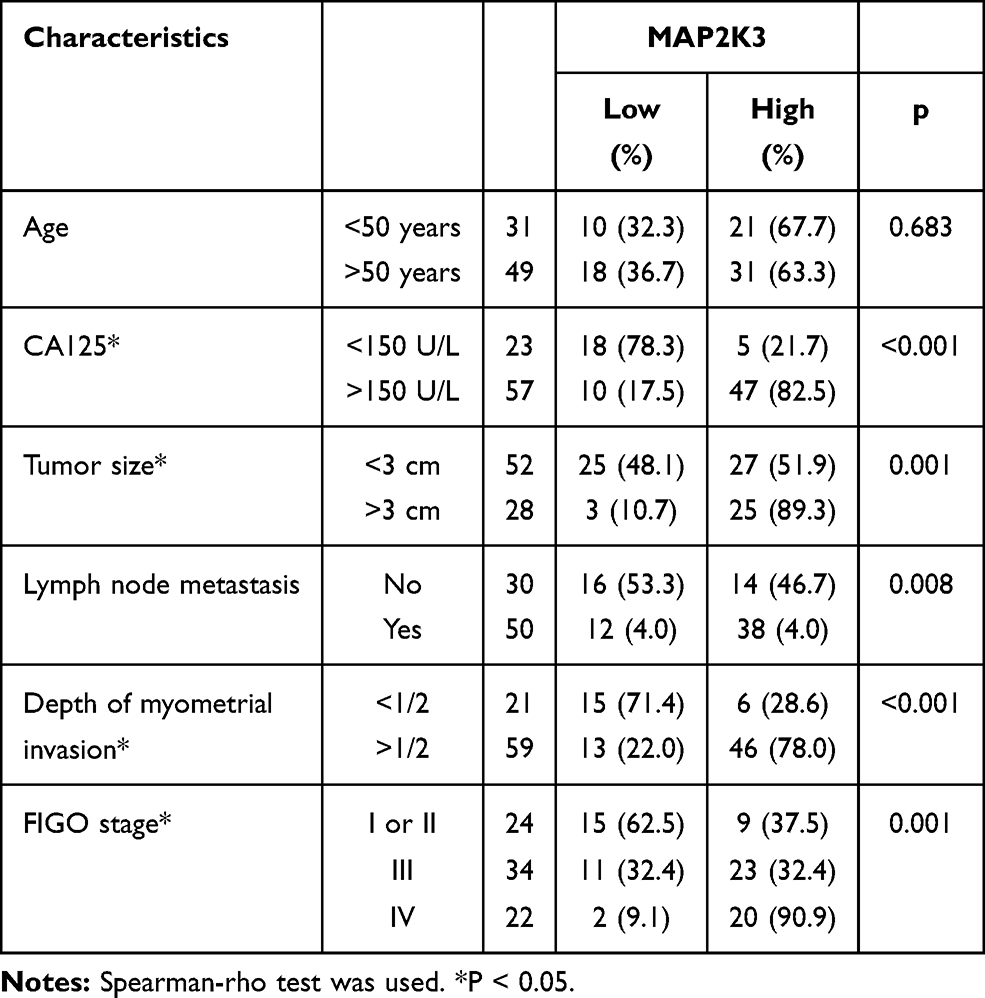 |
Table 5 Clinicopathological Variables and the Expression Status of MAP2K3 in HGSOC Patients |
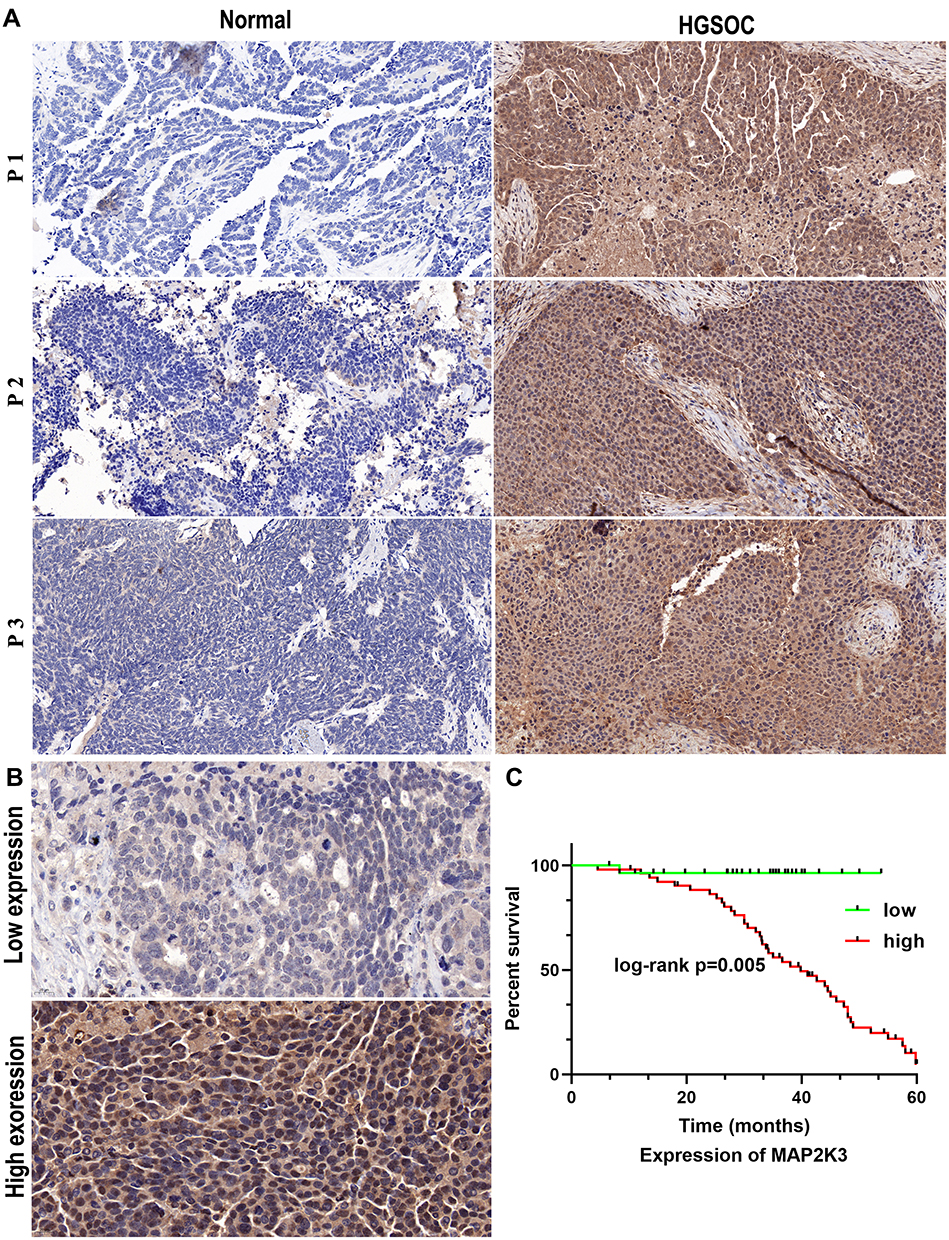 |
Figure 5 Relationship between MAP2K3 and HGSOC clinical prognosis. (A) The expression of MAP2K3 in three pairs of HGSOC tissue specimens (×200). (B) Low and high expression of MAP2K3 was detected by IHC in 80 clinical HGSOC samples (×200). (C) Association of overall survival with MAP2K3 expression. |
Discussion
Previous studies on m5C and ovarian cancer were at the level of DNA methylation, and the focus was more on the production of 5-hydroxymethylcytosine (5-hmC) after m5C was oxidized by TET family enzymes.33 In this study, we first utilised the MeRIP-seq approach to characterise m5C methylomes in human HGSOC transcriptomes. We discovered 2050 aberrant m5C peaks in HGSOC tissues, of which 1767 m5C peaks were significantly upregulated, while 283 m5C peaks were significantly downregulated. In addition, we further revealed that the differentially methylated transcripts were enriched in various important cellular biological processes and cancer-related pathways. Moreover, we discovered genes with differentially methylated m5C peaks and synchronous differential expression by combining MeRIP-seq and RNA-seq data and explored the potential functions by GO and KEGG pathway analyses. Finally, the differentially expressed m5C modified regulatory gene MAP2K3 was further proven to be associated with the prognosis of patients with HGSOC. Taken together, our data provide a comprehensive description of m5C methylation in HGSOC and provide novel insights into the biological processes and important pathways of m5C methylation in the pathogenesis of HGSOC.
Considering that m5C modification is involved in various aspects of the mRNA life cycle, including mRNA export, translation, mRNA stability, and mRNA pre-splicing,34 increasing evidence has shown that m5C methylation modification plays an important role in the pathogenesis of many diseases including tumours.35 Mei et al showed that the RNA methyltransferase NSUN2 inhibits the expression of p57Kip2 in an m5C-dependent manner to promote the proliferation of gastric cancer cells, providing a new target for the treatment of gastric cancer.36 Previous studies have revealed that m5C modification maintains the stability of its target mRNA by recruiting ELAVL1 through the recognition protein YBX1. In addition, YBX1 drove the pathogenesis of human urothelial carcinoma by targeting the m5C methylation site in the 3′-untranslated region of HDGF.9 Recent studies have shown a wide range of abnormal m5C modifications in hepatocellular carcinoma.37 Our research identified that m5C sites were distributed in all regions of mRNA and occurred on all chromosomes, especially CD regions (HGSOC: 54.74%, adjacent tissues: 55.82%) and chromosome one, which was consistent with the results of Bohnsack et al.38 In addition, we found thousands of methylation peaks in mRNA, and found significant differences in the number and distribution of methylation peaks between the two samples. The results indicate that the methylation frequency and methylation genes of HGSOC are far less than the frequency of adjacent tissues proves that there is a clear connection between m5C and HGSOC. This may be caused by demethylation of normal tissues.39,40 The cluster analysis results showed that the degree of methylation can clearly distinguish HGSOC from adjacent tissues, which further confirms the potential relationship between m5C and HGSOC. Since previous studies on m5C and 5-hmc in ovarian cancer are more based on DNA methylation level, Zhang et al in 170 tissue samples also confirmed that compared with normal ovarian tissue, the expression of m5C in epithelial ovarian cancer tissue was significantly increased and was related to pathological stage, tumor grade, lymph node metastasis and vascular thrombosis.33 As the function of mRNA m5C in HGSOC is not completely clear, we can only make some suggestions on clinical relevance or application: compared with DNA methylation, mRNA m5C methylation has a higher degree of methylation modification. In the clinic, the combination of CA125 and other tumor markers has better sensitivity and specificity in the early diagnosis of HGSOC. These hypothesis could better guide the clinical.
It is well known that dynamic modification of m5C methylation is involved in many biological processes, such as cell proliferation,41 mitosis,42 senescence,43 migration,44 and differentiation,45 and these phenotypes are all signs of cancer. In our study, we found that the differentially expressed m5C mRNA-annotated genes were involved in system development, cell metabolic stress, and cell signal transduction by GO functional enrichment analysis. In animal models, m5C RNA modification promotes murine leukaemia virus replication in an ALYREF reader protein-dependent manner,46 and the mutations in the NSUN7 reader protein can cause sperm motility defects, leading to infertility or complete infertility in male mice.47 Notably, we found that m5C mRNA-regulated genes were enriched in some important cancer pathways, such as inflammatory mediator regulation of TRP channels pathway, the Wnt signalling pathway, and focal adhesion pathways. The regulation of inflammatory mediators in the TRP channel pathway makes an important contribution to cell proliferation, migration, inflammatory reactions, pain, and vascular muscle tension.48,49 The wnt signalling pathway and focal adhesion pathways, as classic carcinogenic pathways, have been extensively studied in ovarian cancer.50,51 In summary, these results indicate that differentially expressed m5C mRNA modification exerts precise functions in regulating the occurrence of HGSOC.
By combining the MeRIP sequence and RNA sequence data, we identified 125 genes with different m5C methylation peaks and synchronous expression in HGSOC. Similarly, these genes were enriched in some important functional processes, such as cell growth or maintenance, as well as in plasma membrane and cell adhesion molecule activity. These results indicate that differentially expressed mRNAs also contribute significantly to HGSOC. Messenger RNA as a coding RNA and mRNA modification may affect most of the post-transcriptional steps in gene expression.52 Therefore, research on the mechanism of m5C mRNA regulation has become a hot topic. Fukumoto et al showed that methylation modification of FZD10 mRNA contributes to PARPi resistance by up-regulating the Wnt/β-catenin pathway in BRCA-mutated ovarian cancer cells.53 In ovarian cancer cell models, overexpression of the mRNA methyltransferase METL3 significantly increased cell proliferation, focal formation, invasion, and tumour formation. The high expression of METL3 was significantly related to tumour grade, FIGO stage, and overall survival rate,54 which was consistent with our study results. We further detected the expression of the differentially expressed m5C mRNA regulatory gene MAP2K3 in 80 human HGSOC tissues and found that MAP2K3 was highly expressed in HGSOC tissues and was correlated with poor prognosis in patients with HGSOC. Research by Park et al showed that abnormal methylation of MAP2K3 is related to the occurrence of lung cancer.55 However, the specific mechanism by which the m5C modified gene MAP2K3 leads to the poor prognosis of HGSOC needs further study. Taken together, our research shows that the regulation of m5C mRNA modification is a promising therapeutic strategy for HGSOC in the future.
In conclusion, our study revealed, for the first time, the difference in the number and distribution of RNA m5C peaks between HGSOC tissue and adjacent tissues. We further conducted a bioinformatics analysis showing the potential function of m5C modification in the pathogenesis of HGSOC at the level of epitranscription. Targeting the regulation of m5C mRNA represents a new therapeutic approach to guide personalised treatment for patients with HGSOC, but the specific mechanisms involved need to be further explored.
Data Sharing Statement
The datasets used and/or analyzed during the present study are available from the corresponding author on reasonable request.
Acknowledgments
We thank Professor Helin Feng (Department of Orthopaedics, The Fourth Hospital of Hebei Medical University) for his experimental support. We thank Cloud-Seq Biotech Ltd. Co. (Shanghai, China) for the MeRIP-Seq service, and subsequent bioinformatics analysis.
Li Meng and Qianqian Zhang are co-first authors for this study.
Funding
This work was supported by the improved innovation ability of the Hebei Obstetrics and Gynaecology Clinical Medicine Research Centre (20577705D).
Disclosure
The authors declare that they have no conflicts of interest for this work.
References
1. Bast RC
2. Bowtell DD, Böhm S, Ahmed AA, et al. Rethinking ovarian cancer II: reducing mortality from high-grade serous ovarian cancer. Nat Rev Cancer. 2015;15(11):668–679. doi:10.1038/nrc4019
3. Kim O, Park EY, Klinkebiel DL, et al. In vivo modeling of metastatic human high-grade serous ovarian cancer in mice. PLoS Genet. 2020;16(6):e1008808. doi:10.1371/journal.pgen.1008808
4. Charkhchi P, Cybulski C, Gronwald J, Wong FO, Narod SA, Akbari MR. CA125 and ovarian cancer: a comprehensive review. Cancers (Basel). 2020;12(12):3730. doi:10.3390/cancers12123730
5. Chi KR. The RNA code comes into focus. Nature. 2017;542(7642):503–506. doi:10.1038/542503a
6. Frye M, Jaffrey SR, Pan T, Rechavi G, Suzuki T. RNA modifications: what have we learned and where are we headed. Nat Rev Genet. 2016;17(6):365–372. doi:10.1038/nrg.2016.47
7. Xiang S, Ma Y, Shen J, et al. m(5)C RNA methylation primarily affects the ErbB and PI3K-Akt signaling pathways in gastrointestinal cancer. Front Mol Biosci. 2020;7:599340. doi:10.3389/fmolb.2020.599340
8. Yang X, Yang Y, Sun BF, et al. 5-methylcytosine promotes mRNA export - NSUN2 as the methyltransferase and ALYREF as an m(5)C reader. Cell Res. 2017;27(5):606–625. doi:10.1038/cr.2017.55
9. Chen X, Li A, Sun BF, et al. 5-methylcytosine promotes pathogenesis of bladder cancer through stabilizing mRNAs. Nat Cell Biol. 2019;21(8):978–990. doi:10.1038/s41556-019-0361-y
10. He Y, Yu X, Li J, Zhang Q, Zheng Q, Guo W. Role of m(5) C-relatedregulatory genes in the diagnosis and prognosis of hepatocellular carcinoma. Am J Transl Res. 2020;12(3):912–922.
11. Cheray M, Etcheverry A, Jacques C, et al. Cytosine methylation of mature microRNAs inhibits their functions and is associated with poor prognosis in glioblastoma multiforme. Mol Cancer. 2020;19(1):36. doi:10.1186/s12943-020-01155-z
12. Cheng JX, Chen L, Li Y, et al. RNA cytosine methylation and methyltransferases mediate chromatin organization and 5-azacytidine response and resistance in leukaemia. Nat Commun. 2018;9(1):1163. doi:10.1038/s41467-018-03513-4
13. Anreiter I, Mir Q, Simpson JT, et al. New twists in detecting mRNA modification dynamics. Trends Biotechnol. 2021;39(1):72–89. doi:10.1016/j.tibtech.2020.06.002
14. Huang Z, Pan J, Wang H, et al. Prognostic significance and tumor immune microenvironment heterogenicity of m5C RNA methylation regulators in triple-negative breast cancer. Front Cell Dev Biol. 2021;9:657547. doi:10.3389/fcell.2021.657547
15. Xue M, Shi Q, Zheng L, Li Q, Yang L, Zhang Y. Gene signatures of m5C regulators may predict prognoses of patients with head and neck squamous cell carcinoma. Am J Transl Res. 2020;12(10):6841–6852.
16. Moody L, Crowder SL, Fruge AD, et al. Epigenetic stratification of head and neck cancer survivors reveals differences in lycopene levels, alcohol consumption, and methylation of immune regulatory genes. Clin Epigenetics. 2020;12(1):138. doi:10.1186/s13148-020-00930-5
17. Meyer KD, Saletore Y, Zumbo P, Elemento O, Mason CE, Jaffrey SR. Comprehensive analysis of mRNA methylation reveals enrichment in 3ʹ UTRs and near stop codons. Cell. 2012;149(7):1635–1646. doi:10.1016/j.cell.2012.05.003
18. Kechin A, Boyarskikh U, Kel A, Filipenko M. cutPrimers: a new tool for accurate cutting of primers from reads of targeted next generation sequencing. J Comput Biol. 2017;24(11):1138–1143. doi:10.1089/cmb.2017.0096
19. Dobin A, Davis CA, Schlesinger F, et al. STAR: ultrafast universal RNA-seq aligner. Bioinformatics. 2013;29(1):15–21. doi:10.1093/bioinformatics/bts635
20. Cheng J, Metge F, Dieterich C. Specific identification and quantification of circular RNAs from sequencing data. Bioinformatics. 2016;32(7):1094–1096. doi:10.1093/bioinformatics/btv656
21. Kim D, Langmead B, Salzberg SL. HISAT: a fast spliced aligner with low memory requirements. Nat Methods. 2015;12(4):357–360. doi:10.1038/nmeth.3317
22. Feng J, Liu T, Qin B, Zhang Y, Liu XS. Identifying ChIP-seq enrichment using MACS. Nat Protoc. 2012;7(9):1728–1740. doi:10.1038/nprot.2012.101
23. Shen L, Shao NY, Liu X, Maze I, Feng J, Nestler EJ. diffReps: detecting differential chromatin modification sites from ChIP-seq data with biological replicates. PLoS One. 2013;8(6):e65598. doi:10.1371/journal.pone.0065598
24. Bailey TL. DREME: motif discovery in transcription factor ChIP-seq data. Bioinformatics. 2011;27(12):1653–1659. doi:10.1093/bioinformatics/btr261
25. Luo GZ, MacQueen A, Zheng G, et al. Unique features of the m6A methylome in arabidopsis thaliana. Nat Commun. 2014;5(1):5630. doi:10.1038/ncomms6630
26. Olarerin-George AO, Jaffrey SR, Hancock J. MetaPlotR: a Perl/R pipeline for plotting metagenes of nucleotide modifications and other transcriptomic sites. Bioinformatics. 2017;33(10):1563–1564. doi:10.1093/bioinformatics/btx002
27. Anders S, Pyl PT, Huber W. HTSeq–a Python framework to work with high-throughput sequencing data. Bioinformatics. 2015;31(2):166–169. doi:10.1093/bioinformatics/btu638
28. Robinson MD, McCarthy DJ, Smyth GK. edgeR: a bioconductor package for differential expression analysis of digital gene expression data. Bioinformatics. 2010;26(1):139–140. doi:10.1093/bioinformatics/btp616
29. Pathan M, Keerthikumar S, Ang CS, et al. FunRich: an open access standalone functional enrichment and interaction network analysis tool. Proteomics. 2015;15(15):2597–2601. doi:10.1002/pmic.201400515
30. Huang da W, Sherman BT, Lempicki RA. Systematic and integrative analysis of large gene lists using DAVID bioinformatics resources. Nat Protoc. 2009;4(1):44–57. doi:10.1038/nprot.2008.211
31. Liu X, Zhang Q, Zhao Y, Xun J, Wu H, Feng H. Association of JMJD2B and hypoxia-inducible factor 1 expressions with poor prognosis in osteosarcoma. Anal Cell Pathol (Amst). 2020;2020:2563208.
32. Wu H, Zhang Q, Zhao Y, et al. Association of sirtuin-1 and vascular endothelial growth factor expression with tumor progression and poor prognosis in liposarcoma. J Int Med Res. 2020;48(6):300060520926355. doi:10.1177/0300060520926355
33. Zhang LY, Li PL, Wang TZ, Zhang XC. Prognostic values of 5-hmC, 5-mC and TET2 in epithelial ovarian cancer. Arch Gynecol Obstet. 2015;292(4):891–897. doi:10.1007/s00404-015-3704-3
34. Dubin DT, Taylor RH. The methylation state of poly A-containing messenger RNA from cultured hamster cells. Nucleic Acids Res. 1975;2(10):1653–1668. doi:10.1093/nar/2.10.1653
35. Schumann U, Zhang HN, Sibbritt T, et al. Multiple links between 5-methylcytosine content of mRNA and translation. BMC Biol. 2020;18(1):40. doi:10.1186/s12915-020-00769-5
36. Mei L, Shen C, Miao R, et al. RNA methyltransferase NSUN2 promotes gastric cancer cell proliferation by repressing p57(Kip2) by an m(5) C-dependentmanner. Cell Death Dis. 2020;11(4):270. doi:10.1038/s41419-020-2487-z
37. Zhang Q, Zheng Q, Yu X, He Y, Guo W. Overview of distinct 5-methylcytosine profiles of messenger RNA in human hepatocellular carcinoma and paired adjacent non-tumor tissues. J Transl Med. 2020;18(1):245. doi:10.1186/s12967-020-02417-6
38. Bohnsack KE, Höbartner C, Bohnsack MT. Eukaryotic 5-methylcytosine (m5C) RNA methyltransferases: mechanisms, cellular functions, and links to disease. Genes (Basel). 2019;10(2):102. doi:10.3390/genes10020102
39. Lu DH, Yang J, Gao LK, et al. Lysine demethylase 2A promotes the progression of ovarian cancer by regulating the PI3K pathway and reversing epithelial‑mesenchymal transition. Oncol Rep. 2019;41(2):917–927. doi:10.3892/or.2018.6888
40. Jiang Y, Wan Y, Gong M, Zhou S, Qiu J, Cheng W. RNA demethylase ALKBH5 promotes ovarian carcinogenesis in a simulated tumour microenvironment through stimulating NF-κB pathway. J Cell Mol Med. 2020;24(11):6137–6148. doi:10.1111/jcmm.15228
41. Zhang X, Liu Z, Yi J, et al. The tRNA methyltransferase NSun2 stabilizes p16INK4 mRNA by methylating the 3′-untranslated region of p16. Nat Commun. 2012;3(1):712. doi:10.1038/ncomms1692
42. Hussain S, Benavente SB, Nascimento E, et al. The nucleolar RNA methyltransferase Misu (NSun2) is required for mitotic spindle stability. J Cell Biol. 2009;186(1):27–40. doi:10.1083/jcb.200810180
43. Tang H, Fan X, Xing J, et al. NSun2 delays replicative senescence by repressing p27 (KIP1) translation and elevating CDK1 translation. Aging (Albany NY). 2015;7(12):1143–1158. doi:10.18632/aging.100860
44. Yang L, Ma Y, Han W, et al. Proteinase-activated receptor 2 promotes cancer cell migration through RNA methylation-mediated repression of miR-125b. J Biol Chem. 2015;290(44):26627–26637. doi:10.1074/jbc.M115.667717
45. Sajini AA, Choudhury NR, Wagner RE, et al. Loss of 5-methylcytosine alters the biogenesis of vault-derived small RNAs to coordinate epidermal differentiation. Nat Commun. 2019;10(1):2550. doi:10.1038/s41467-019-10020-7
46. Eckwahl M, Xu R, Michalkiewicz J, et al. 5-Methylcytosine RNA modifications promote retrovirus replication in an ALYREF reader protein-dependent manner. J Virol. 2020;94(13):e00544–20. doi:10.1128/JVI.00544-20
47. Harris T, Marquez B, Suarez S, Schimenti J. Sperm motility defects and infertility in male mice with a mutation in Nsun7, a member of the Sun domain-containing family of putative RNA methyltransferases. Biol Reprod. 2007;77(2):376–382. doi:10.1095/biolreprod.106.058669
48. Lanser L, Kink P, Egger EM, et al. Inflammation-induced tryptophan breakdown is related with anemia, fatigue, and depression in cancer. Front Immunol. 2020;11:249. doi:10.3389/fimmu.2020.00249
49. Liu Y, Mikrani R, He Y, et al. TRPM8 channels: a review of distribution and clinical role. Eur J Pharmacol. 2020;882:173312. doi:10.1016/j.ejphar.2020.173312
50. Leung CS, Yeung TL, Yip KP, et al. Cancer-associated fibroblasts regulate endothelial adhesion protein LPP to promote ovarian cancer chemoresistance. J Clin Invest. 2018;128(2):589–606. doi:10.1172/JCI95200
51. Teeuwssen M, Fodde R. Wnt signaling in ovarian cancer stemness, EMT, and therapy resistance. J Clin Med. 2019;8(10):1658. doi:10.3390/jcm8101658
52. Gilbert WV, Bell TA, Schaening C. Messenger RNA modifications: form, distribution, and function. Science. 2016;352(6292):1408–1412. doi:10.1126/science.aad8711
53. Fukumoto T, Zhu H, Nacarelli T, et al. N(6)-methylation of adenosine of FZD10 mRNA contributes to PARP inhibitor resistance. Cancer Res. 2019;79(11):2812–2820. doi:10.1158/0008-5472.CAN-18-3592
54. Hua W, Zhao Y, Jin X, et al. METTL3 promotes ovarian carcinoma growth and invasion through the regulation of AXL translation and epithelial to mesenchymal transition. Gynecol Oncol. 2018;151(2):356–365. doi:10.1016/j.ygyno.2018.09.015
55. Park JC, Chae YK, Son CH, et al. Epigenetic silencing of human T (brachyury homologue) gene in non-small-cell lung cancer. Biochem Biophys Res Commun. 2008;365(2):221–226. doi:10.1016/j.bbrc.2007.10.144
 © 2021 The Author(s). This work is published and licensed by Dove Medical Press Limited. The full terms of this license are available at https://www.dovepress.com/terms.php and incorporate the Creative Commons Attribution - Non Commercial (unported, v3.0) License.
By accessing the work you hereby accept the Terms. Non-commercial uses of the work are permitted without any further permission from Dove Medical Press Limited, provided the work is properly attributed. For permission for commercial use of this work, please see paragraphs 4.2 and 5 of our Terms.
© 2021 The Author(s). This work is published and licensed by Dove Medical Press Limited. The full terms of this license are available at https://www.dovepress.com/terms.php and incorporate the Creative Commons Attribution - Non Commercial (unported, v3.0) License.
By accessing the work you hereby accept the Terms. Non-commercial uses of the work are permitted without any further permission from Dove Medical Press Limited, provided the work is properly attributed. For permission for commercial use of this work, please see paragraphs 4.2 and 5 of our Terms.