")
Back to Journals » Diabetes, Metabolic Syndrome and Obesity » Volume 14
Complement C7 is Specifically Expressed in Mesangial Cells and is a Potential Diagnostic Biomarker for Diabetic Nephropathy and is Regulated by miR-494-3p and miR-574-5p
Authors Guo H, Yan Z, Hu Y, Huang X, Pan C
Received 18 March 2021
Accepted for publication 15 June 2021
Published 5 July 2021 Volume 2021:14 Pages 3077—3088
DOI https://doi.org/10.2147/DMSO.S311725
Checked for plagiarism Yes
Review by Single anonymous peer review
Peer reviewer comments 2
Editor who approved publication: Dr Konstantinos Tziomalos
Hang Guo,1 Zhiyue Yan,1 Yonghui Hu,1 Xitong Huang,2 Congqing Pan1
1NHC Key Laboratory of Hormones and Development, Tianjin Key Laboratory of Metabolic Diseases, Chu Hsien-I Memorial Hospital & Tianjin Institute of Endocrinology, Tianjin Medical University, Tianjin, 300134, People’s Republic of China; 2Department of TCM, China Pharmaceutical University, Nanjing, Jiangsu, 211100, People’s Republic of China
Correspondence: Congqing Pan Email [email protected]
Background: Diabetic nephropathy (DN) is the leading cause of end-stage renal disease, but it remains relatively underdiagnosed.
Objective: In this study, we aimed to explore the key regulatory pathways and potential biomarkers related to DN using integrated bioinformatics analysis and validation.
Methods: First, the microarray data of the GSE30528 and GSE96804 datasets were downloaded from the Gene Expression Omnibus (GEO) database, and differentially expressed genes (DEGs) were screened. Then, weighted gene coexpression network analysis (WGCNA), gene ontology (GO) annotation, gene set enrichment analysis (GSEA) and Kyoto Encyclopedia of Genes and Genomes (KEGG) pathway analyses were performed to identify key pathways and genes. qRT-PCR and receiver operating characteristic (ROC) curves were used to validate our results. Furthermore, single-cell RNA sequencing (scRNA-seq) data were reanalyzed to investigate the expression specificity of C7 in DN cells. An online database search and luciferase reporter assay identified the target relationship between miRNAs and C7.
Results: The “complement and coagulation cascades” were significantly enriched, and complement C3 and C7 were candidate markers. The receiver operating characteristic (ROC) curve revealed that C7 had significant diagnostic value (AUC=0.865) in DN. Through scRNA-seq reanalysis, we found that C7 was specifically elevated in mesangial (MES) cells of DN. Moreover, we found that the expression of C7 was regulated by miR-494-3p and miR-574-5p.
Conclusion: This is the first study to reveal that C7 is specifically expressed in mesangial cells, is a potential diagnostic biomarker for diabetic nephropathy, and is regulated by miR-494-3p and miR-574-5p.
Keywords: diabetic nephropathy, mesangial (MES) cells, complement and coagulation cascades, complement C7, miR-494-3p, miR-574-5p, biomarker
Introduction
Diabetic nephropathy (DN) is a common microvascular complication that is both the most serious complication of diabetes (DM) and the most common cause of end-stage renal disease.1 The major pathological features of DN include glomerular vascular injury, glomerular sclerosis, the formation of nodular lesions and the deterioration of renal function, which ultimately leads to end-stage renal disease.1,2 It has been reported that 30–40% of diabetes cases develop into diabetic nephropathy worldwide.3,4 Due the complexity of metabolic disorders, once diabetes has developed into end-stage renal disease, it is often more difficult to treat than other kidney diseases; thus, timely prevention and treatment is of great significance to delay diabetic nephropathy.
Weighted gene coexpression network analysis (WGCNA) was used to construct a free-scale gene coexpression network and is widely used to analyze large-scale data sets and identify highly associated gene modules.5,6 Related modules have been used to identify candidate biomarkers or therapeutic targets in many diseases, such as depressive order7 and chronic kidney disease.8 Single-cell RNA sequencing (scRNA-seq) has emerged as an indispensable tool to dissect cellular heterogeneity and offers enormous potential for de novo discovery. Single-cell transcriptomic atlases provide unprecedented resolution to reveal complex cellular events and deepen our understanding of biological systems.9 Although RNA sequencing (RNA-seq) has been used in several studies of DN, scRNA-seq can pinpoint the cell types in which specific genes are differentially expressed. A recent scRNA-seq study performed on the patient’s kidney cortex revealed strong angiogenic signature changes in glomerular cell types, proximal convoluted tubules, distal convoluted tubules, and principal cells.10
The complement system is a mainstay of systemic innate immunity comprising several interacting components.11 C3a-mediated proinflammatory and prefibrotic responses in rats with type 2 diabetes mellitus (T2DM) aggravate renal damage,12 while inhibition of complement C5 could attenuate glomerular mesangial proliferation and urinary protein excretion in rats,13 suggesting that complement system activation is associated with the pathogenesis of DN. MicroRNAs (miRNAs) are an abundant class of noncoding RNAs that are reported to be important for many biological processes through the regulation of gene expression, including in DN.14 Studies have revealed that some miRNAs could be regulators of immune and inflammatory responses and are potential therapeutic targets in DN.15,16 However, there have been few studies on genetic variation in miRNA and complement levels in diabetic nephropathy.
In the present study, we selected the GSE30528, GSE96804, GSE9006, GSE131882 and GSE161884 datasets from the GEO database to identify a potential biomarker gene for the early diagnosis of DN and to pinpoint the cell types that specifically express the biomarker. First, we performed WGCNA, GO analysis, KEGG analysis and GSEA to identify several candidate genes. Then, qRT-PCR and single-cell RNA sequencing reanalysis were used to confirm and explore the results. The miRNA targets of C7 were predicted by online databases and further validated by qRT-PCR and luciferase reporter gene assays.
Materials and Methods
Collection of Clinical Samples
Serum from total of 31 DN patients and 30 healthy donors was collected at Chu Hsien-I Memorial Hospital (Tianjin, China). All the samples were stored at −80°C until RNA extraction was performed. The research protocol for this study was approved by the Ethics Committee of Chu Hsien-I Memorial Hospital. Informed consent was obtained from all the participants. We adhered to the principles of the 1983 Declaration of Helsinki for all experiments.
We selected 31 patients (16 males and 15 females) with diabetic nephropathy who were hospitalized at the Chu Hsien-I Memorial Hospital (Tianjin, China) from January 2020 to December 2020. The patients had an average disease course of 10.4±5.5 years and an average body mass index (BMI) of 25.6±3.8. Patients with acute cardiovascular and cerebrovascular events, infections, stress states, other endocrine and metabolic diseases, recent ketoacidosis, or hyperosmolar nonketotic coma were excluded. The 2012 K-DOQI standard of the American Kidney Disease Foundation was adopted to diabetic nephropathy disease. Patients with extensive albuminuria or microalbuminuria with diabetic retinopathy or type 1 diabetes with a disease course of more than 10 years with microalbuminuria can be diagnosed with DK. According to UACR staging, there were 14 patients with microalbuminuria (UACR 30~300 mg/g) and 17 patients with massive albuminuria (UACR>300 mg/g). In addition, 30 healthy people who received a physical examination at the center during the same period served as a healthy control (HC) group.
Cell Line
Human mesangial cells were purchased from American Type Culture Collection (ATCC) and cultured in Dulbecco’s modified Eagle’s medium (DMEM) media supplemented with 10% fetal bovine serum (Invitrogen), penicillin (100 U/mL), and streptomycin (100 μg/mL). For the experiments, cells were serum starved for 24 h before supplementing the media with 0,5,10 mM glucose.
Data Collection
The expression profiles of RNAs were screened from the National Center of Biotechnology Information Gene Expression Omnibus (http://www.ncbi.nlm.nih.gov/gds/). The GSE3052817 dataset is composed of 22 mRNA expression data of human kidney samples, including 9 DN patients and 13 healthy controls. For dataset GSE96804,18 there are 61mRNA expression data from human kidney samples including 41 DN patients and 20 healthy controls. The R software package was used to process the downloaded files and to convert and reject the unqualified data. The data were calibrated, standardized, and log2 transformed. For dataset GSE131882,10 there are three controls and three DNs’ single-cell sequencing data from human kidney samples.
Differential Expression Analysis
The differently expressed mRNAs between Diabetic Human Kidney and Control Human Kidney groups were screened using Limma package, with the criterion of |log 2(fold change [FC]| > 1.5 and p-value < 0.05).
Weighted Gene Co-Expression Network Analysis
The expression profile of 22 samples was obtained from the GSE30528 dataset. After validation, these data were used to construct a co-expression network using the WGCNA package in R (version 3.6.0). The WGCNA methodology analysis was performed as a previous report.19
Gene Ontology and Pathway Enrichment Analysis
To assess the function of DEGs in DN, Gene Ontology annotation and Kyoto Encyclopedia of Genes and Genomes pathway analyses were performed by using the cluster profiler package of R software.20 P-value < 0.05 was set as the cut-off criterion.
Gene Set Enrichment Analysis
GSEA was performed to examine critical pathways represented under different conditions.21 The estimated expression levels of all identified genes were applied to GSEA and then ES values were calculated according to the ranked-ordered gene list. As the predefined gene sets, the Kyoto Encyclopedia of Genes and Genomes (KEGG) information deposited in NCBI database was analyzed using an in-house script.
Validation with qRT- PCR
QRT-PCR was used to confirm mRNA expression. Total RNA obtained from participants’ serum with Trizol (Invitrogen, Carlsbad, CA, USA). RNA purity was measured using the NanoDrop Spectrophotometer (Nanodrop™ Thermo Fisher Scientific, Vantaa, Finland). Then Power SYBR Green (Takara) was used to perform qRT-PCR. β-actin was applied as an internal reference. Primer sequences are summarized as follow, β-actin (F: 5′-CTCCATCCTGGCCTCGCTGT-3′, R: 5′-GCTGTCACCTTCACCGTTCC-3′), C3 (F: 5′-GGGGAGTCCCATGTACTCTATC-3′, R: 5′-GGAAGTCGTGGACAGTAACAG-3′), C7 (F: 5′-TGTAAAACGACGGCCAGT-3′, R: 5′-CAGGAAACAGCTATGACC-3′). All PCR reactions were conducted in triplicate. Relative expression was calculated using the 2−ΔΔCt method. miRNAs were synthesized by Genepharm Technologies (Shanghai, China). Sequences of the miRNAs used in the study are as follows: miR-494-3p (5′-UGAAACAUACACGGGAAACCUC-3′), miR-574-5p (5′-UGAGUGUGUGUGUGUGAGUGUGU-3′), miR-6769b-5p (5′- UGGUGGGUGGGGAGGAGAAGUGC-3′) and miR-18a-5p (5′- UAAGGUGCAUCUAGUGCAGAUAG −3′). miRNAs were transfected using Lipofectamine 2000 reagent.
Single-Cell RNA Sequencing Reanalysis
The Single-nucleus sequencing data from GSE131882 dataset was downloaded from GEO database. Single nucleus RNA sequencing of three early human diabetic kidney samples and three controls were included.10 The single-cell data was visualized by Kidney Integrative Transcriptomics (K.I.T.) database (http://humphreyslab.com/SingleCell/), which was created by Ben Humphrey’s lab of Washington University. The database consists of RNA-seq and snATAC-seq to mouse and human kidney and lung.
Regulatory Predictive Analysis
The miRwalk tool22 and TargetScan 7.2 (http://www.targetscan.org)23 were used to predict the candidate regulatory target miRNAs of C7.
Luciferase Reporter Gene Assay
The Mutant (MUT) 3ʹUTR and wild-type (WT) 3ʹUTR sequences of C7 were amplified and cloned into a pGL3-Basic reporter vector (Promega). MES cells from miR-NC, miR-494-3p and miR-574-5p groups were placed in 24-well plates and transfected with pGL3-MUT and pGL3-WT plasmids (Promega). After cultured for 48 h at 37°C, cells were collected. Firefly and Renilla luciferase activities were measured using Luciferase Assay System (Promega). Firefly luciferase activity was normalized to Renilla luciferase activity.
Statistical Analysis
Data analysis was performed using GraphPad prism 6.0 (GraphPad software, San Diego, CA, USA). The data are expressed as means ± SEMs. Unpaired t-test was used to distinguish the differences between two groups. P< 0.05 was considered as a statistically significant difference with 2-tailed tests. Receiver operating characteristic (ROC) curve was used to analyze the diagnosis value, including the area under the curve (AUC), sensitivity, and specificity.
Results
Weighted Coexpression Network Construction and Key Module Identification
To determine the co-expression network most highly associated with diabetic nephropathy progression, WGCNA was performed on the GSE30528 dataset. A total of 22 samples with clinical data were included in the coexpression analysis (Figure 1A). In this study, a power of β =17 (scale-free R2 = 0.85) was selected as the soft-thresholding parameter to ensure a scale-free network (Figure 1B and C). Then, Pearson correlation coefficients were calculated for pairwise genes to yield a similarity matrix, which was transformed into an adjacency matrix using the threshold and power values listed above. A total of 10 modules were identified via average linkage hierarchical clustering (Figure 1D). The green module was found to have the highest association with DN development (green, r=0.71, p=2e−4) (Figure 1E), and this module was selected as the significant module for further analysis. The correlations of these 10 modules are shown in Figure 1F.
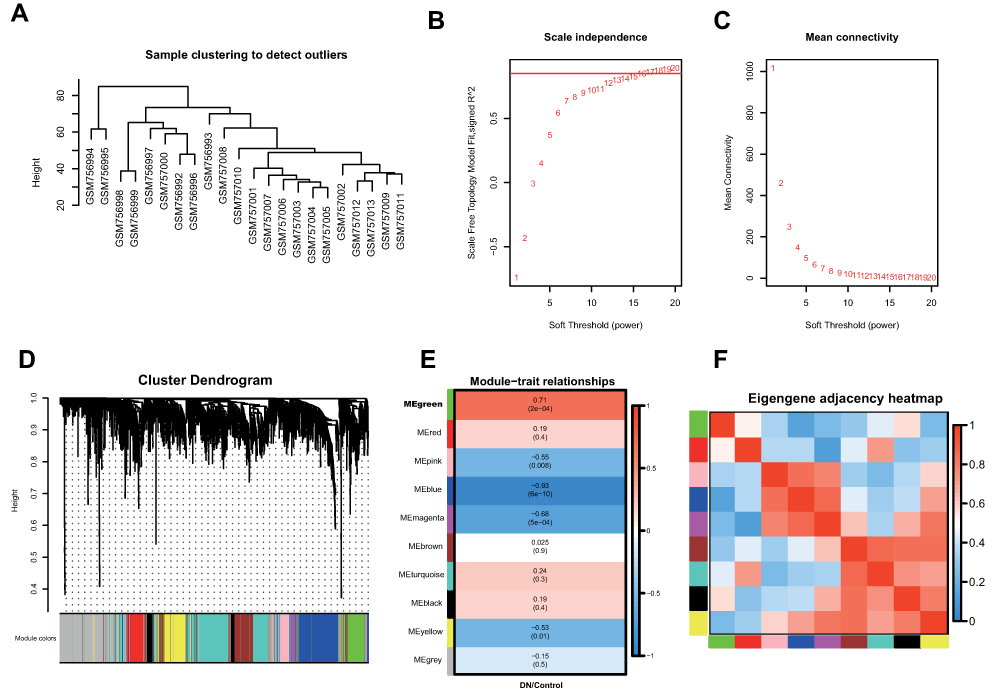 |
Figure 1 Co-expression network construction of 22 diabetic nephropathy samples of GSE30528 dataset via WGCNA. (A) The clustering was based on the expression data of differentially expressed genes between tumor samples and normal samples in DN. (B) Relationship between scale-free topology model and soft-thresholds (powers). (C) Relationship between the mean connectivity and various soft-thresholds (powers). (D) Dendrogram of all differentially expressed genes clustered based on a dissimilarity measure (1-TOM). (E) Heatmap of the correlation between module eigengenes and clinical traits. (F) The eigengene adjacency heatmap of the modules. |
Functional Enrichment Analysis
There were 35 DEGs in the green module (Table S1). The relative expression of these genes in normal and DN samples is shown in Figure 2A. To identify the biological function and network of the 35 DEGs, the protein–protein interaction was assessed by the STRING database (Figure 2B). We found that the expression of 34 genes were upregulated and only 1 gene had downregulated expression. Then, KEGG pathway enrichment analysis was used to explore the functions of the DEGs. The top 10 most significantly enriched pathways are shown in Figure 2C, in which C3, C1qrs and C6, 7, 8, and 9 were all upregulated. This may suggest that the “complement and coagulation cascades” pathway is activated in DN (Figure 2D).
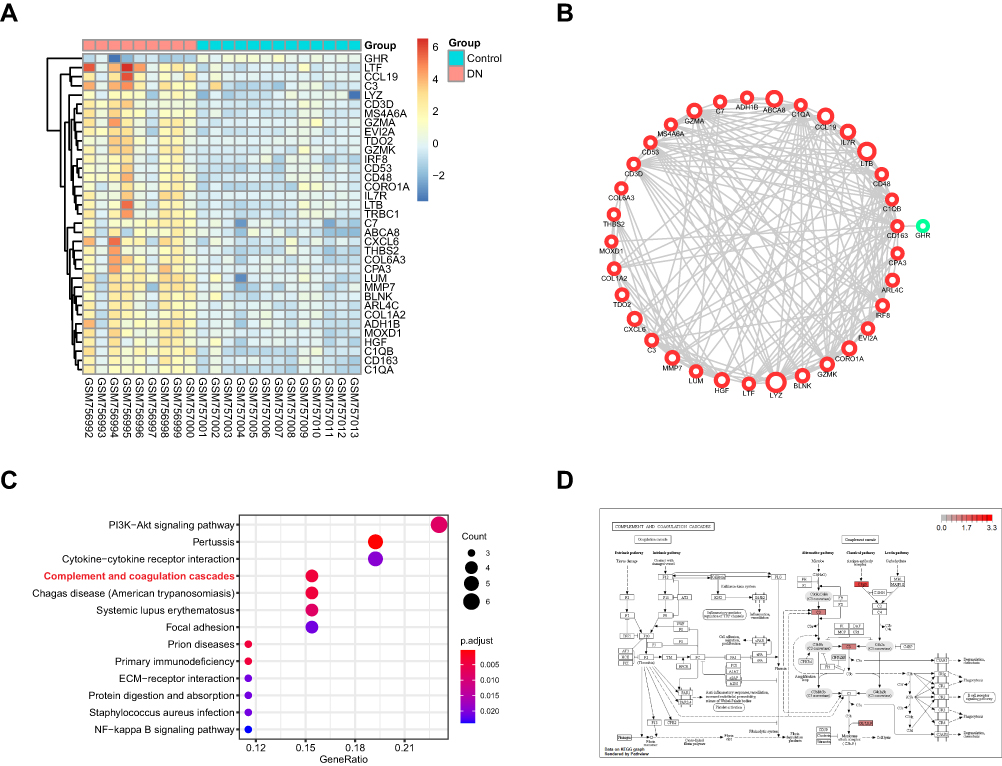 |
Figure 2 The functional analysis of DEGs in GSE30528 dataset. (A) Heatmap of the DEGs in green module by WGCNA of GSE30528 dataset. (B) The protein-protein interaction network of the DEGs in green module. (C) The top 10 significant KEGG pathways. (D) The pathway map of Complement and coagulation cascades. The red squares represent upregulated genes. |
Validation by Another GEO Dataset
To confirm that the “complement and coagulation cascades” pathway is significantly changed and may play a key role in DN development, another GEO dataset (GSE96804) was used. First, 126 DEGs (|log2FC|>1.5, p <0.05) were identified. We annotated the DEG functions using gene ontology (GO) analysis (Figure S1A–D). Then, KEGG pathway analysis based on the DEGs was performed (Figure 3A). As a result, we found that the “complement and coagulation cascades” pathway was significantly enriched. In addition, GSEA of the whole genes also found that this pathway was promoted in DN (p = 0.0039) (Figure 3B and C). All DEGs identified in the pathway were upregulated, including KNG, C3, CR1, Clqrs and C6, 7, 8, and 9. These results were consistent with our previous analysis of the GSE30528 dataset. Moreover, we compared the common DEGs between the GSE30528 green module and the overall GSE96804 dataset. There were nine common DEGs, including C3 and C7 (Figure 3D). Furthermore, the expression of these two genes was upregulated (Figure S2A–F) in both the GSE30528 and GSE96804 datasets, which agreed with the KEGG analysis.
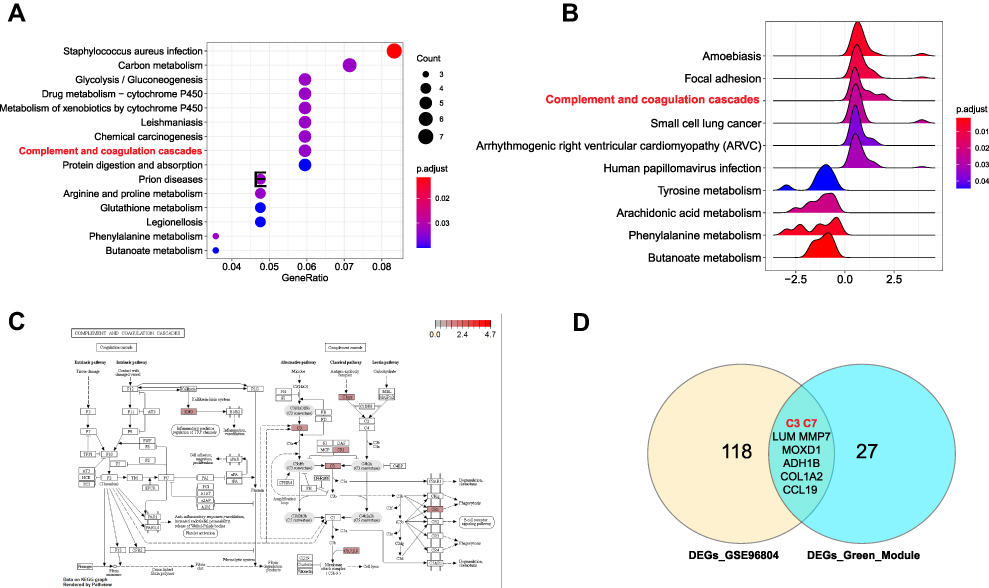 |
Figure 3 Complement and coagulation cascades was significantly activated in DN. (A) The top 10 significant KEGG pathways in GSE96804 dataset. (B) GSEA analysis of GSE96804 dataset. (C) The pathway map of Complement and coagulation cascades. The red squares represent upregulated genes. (D) The Venn map of common DEGs between GSE30528 green module and GSE96804 dataset. |
Validation of C3 and C7 Expression with qRT-PCR and ROC Curve Analysis
To further assess the expression of C3 and C7, a total of 31 DN patients and 30 healthy controls were enrolled as a validation cohort. qRT-PCR technology was used to confirm the differential expression levels from participant serum samples. Consistent with the microarray data, C7 expression was significantly upregulated (Figure 4A) between DN and HC patients. However, there was no difference in the levels of C3 (Figure 4B). To assess the potential value of increased C7 expression for DN diagnosis, we further performed ROC curve analysis. We found that the ROC curve of C7 expression showed a significant distinguishing efficiency with an AUC value of 0.865 (95% CI: 0.774–0.957, ***p <0.001) (Figure 4C), with the best cutoff value of 3.4, a sensitivity of 90.3% and a specificity of 73.3%, which indicated that C7 could be a candidate biomarker for DN diagnosis.
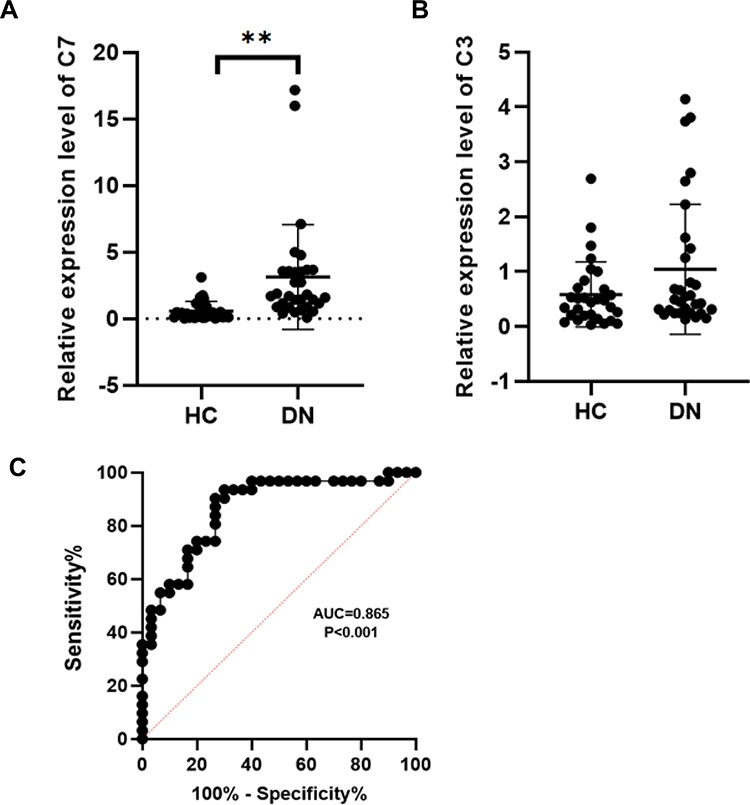 |
Figure 4 RT-qPCR analysis of C7 and C3. (A) Validation the expression level of C7 (**p< 0.01). (B) Validation the expression level of C3 (p>0.05). (C) The receiver operating characteristic curve of C7 in distinguishing DN. Abbreviations: DN, diabetic nephropathy; HC, healthy control. |
Validation of Increased C7 Levels in a Single-Cell RNA Sequencing Reanalysis
To explore complex cellular events and deepen our understanding of biological systems, we reanalyzed the expression of common DEGs between the GSE30528 and GSE96804 datasets in different cell groups in DN. The kidney cortex was sampled from three nondiabetic controls and 3 DN patients following nephrectomy in the GSE131882 dataset. As shown in Figure 5A, a total of 20 DEGs were differentially expressed in 9 cell groups. Notably, the upregulated DEGs C7, TNC, CDH6, and FN1 were specifically expressed in renal cells. We found that C7 expression was mainly significantly upregulated in mesangial (MES) cells. In addition, a total of 23,980 nuclei passed filters with an average of 2541 genes and 6894 unique molecular identifiers per nucleus. By using the Kidney Interactive Transcriptomics database (http://humphreyslab.com/SingleCell/), eleven kidney cell types were identified by unsupervised clustering and expression analysis of lineage-specific markers following batch correction (Figure 5B). We also found that C7 expression was mainly significantly upregulated in the MES cells (Figure 5C–E). This suggested that C7 was mainly secreted by MES cells. In addition, the expression proportion of C7 in the MES cells of DN samples was much higher than that of the MES cells of the control samples. Similarly, we performed the same analysis of C3; however, C3 was not significantly enriched in any cell type (Figure S3A–D). Thus, the single-cell RNA sequencing reanalysis indicates that C3 may not be a biomarker of DN. Furthermore, we reanalyzed the GSE9006 dataset and found that C7 was not significantly expressed in type 1 and 2 diabetic samples (Figure S4A–B). These results revealed that C7 is a potential MES cell-specific biomarker of DN.
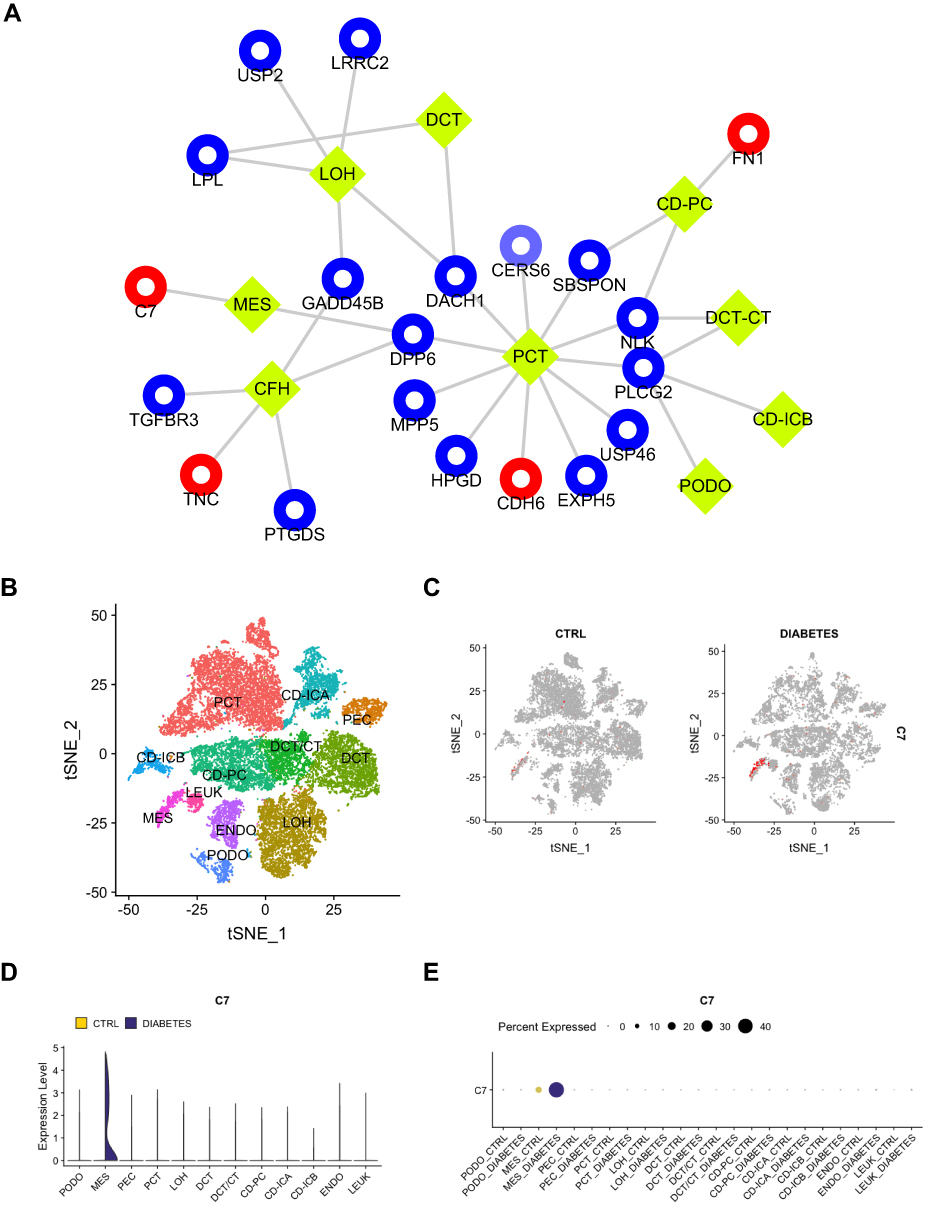 |
Figure 5 The scRNA-seq analysis validation of C7. (A) The expression of common DEGs between GSE30528 and GSE96804 datasets in different types of cell groups in DN were predicted. PCT, proximal convoluted tubule; CFH, complement factor H; LOH, loop of Henle; DCT, distal convoluted tubule; CT, connecting tubule; CD, collecting duct; PC, principal cell; IC, intercalated cell; PODO, podocyte; ENDO, endothelium; MES, mesangial cell; LEUK, leukocyte. The yellow diamond represents the cell type, red represents up-regulation, blue represents down-regulation, and the circle size is based on Degree. (B) DN and control samples were integrated into a single dataset. (C) The distribution of C7 in different cells between healthy controls and DN. (D) The relative expression level of C7 in identified cell types between healthy controls and DN. (E) The percent expression of C7 in identified cell types between healthy controls and DN. |
MiR-494-3p and miR-574-5p are Regulators of C7
To investigate the underlying regulatory mechanism of C7, we identified the differentially expressed miRNAs in DN based on the GSE161884 dataset (Figure 6A and B). Then, we predicted the target miRNA that regulates C7 using TargetScan (http://www.targetscan.org/) and miRwalk (http://mirwalk.umm.uni-heidelberg.de/) software. The common differentially expressed miRNAs and predicted target miRNAs were identified, including miR-494-3p, miR-574-5p, miR-6769b-5p and miR-18a-5p (Figure 6C). In the next step, we verified the expression of these four miRNAs in MES cells. As shown in Figure 6D, the relative expression of C7 mRNA in MES cells was dependent on glucose concentration. In addition, the expression of miR-494-3p and miR-574-5p significantly decreased as glucose concentration increased. Hence, we focused on these two miRNAs to determine their regulatory relationship with the relative expression of C7 in MES cells. The results suggest that miR-494-3p and miR-574-5p mimic can downregulate the expression of C7 (Figure 6E). A luciferase reporter assay confirmed that C7 could bind to miR-494-3p and miR-574-5p (Figure 6F).
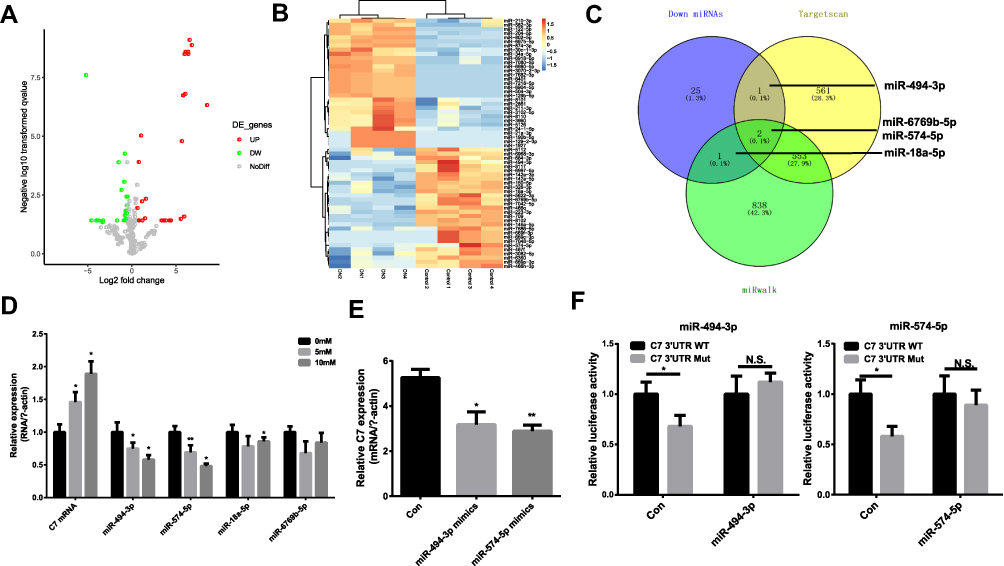 |
Figure 6 MiR-494-3p and miR-574-5p are regulators of C7. (A) and (B) The heatmap and volcano plot of differentially expressed miRNAs. (C) The common miRNAs compared with miRNAs predicted by Targetscan and miRwalk. (D) The relative expression of C7 and different miRNAs in MES cell treated with different glucose. (E) The relative C7 expression in DN cell treated with miR-494-3p mimics and miR-574-5p mimics. (F) Detection of the binding of miR-494-3p and miR-574-5p with C7 by luciferase reporter gene assay. *p < 0.05, **p< 0.001. Abbreviation: N.S., no significant. |
Discussion
To date, several factors, including urinary albumin levels, have been considered for assessing DN. However, the diagnosis of DN greatly depends on assumptions, and newer specific markers for DN, especially for early-stage disease, are urgently needed.24 To date, several studies have revealed that C7 can be used as a potential biomarker of DN,17,25 but there is a lack of comprehensive analysis based on multiple data sets and a lack of further exploration at the cellular level. WGCNA is a commonly used bioinformatics analysis tool used to identify the key modules and genes associated with specific clinical traits.26 Single-cell RNA sequencing is a precise way to detect molecular changes in diseases, provides deep insights into cell-to-cell variation in the tumor and microenvironment, allows high-resolution dissection of the pathogenic mechanisms of diseases, and affords potential clinical utilities.27 This approach has been increasingly used in disease research.9
In this study, we performed a WGCNA, a single-cell sequencing analysis and other analyses to detect a new potential biomarker for DN diagnosis. To further verify C7 as a novel biomarker of DN with the ability to distinguish it from other nephropathies, four datasets (GSE30528, GSE96804, GSE9006, and GSE131882 datasets) with different control samples were selected. Through a series of bioinformatics analyses, we found that complement and coagulation cascades were significantly enriched in DN. This may suggest that the complement cascade plays an important role in DN development. The complement system is a proteolytic cascade in the blood plasma and a mediator of innate immunity, a nonspecific defense mechanism against pathogens.28 There are three pathways of complement activation: the classical pathway, the lectin pathway, and the alternative pathway.29 All these pathways generate crucial enzymatic activity that, in turn, drives the activation of effector complement molecules. The main consequences of complement activation are the opsonization of pathogens, the recruitment of inflammatory and immunocompetent cells, and the direct killing of pathogens.30 In cancer, the complement system plays a major and complex role in killing antibody-coated tumor cells, supporting local chronic inflammation, or hampering antitumor T cell responses favoring tumor progression.31 The complement system is also involved in various autoimmune diseases, such as primary biliary cholangitis (PBC), primary sclerosing cholangitis (PSC) and autoimmune hepatitis (AIH).32 While the complement cascade is an important component of the innate immune system, uncontrolled activation can cause severe disease. In a recent review, excessive complement activation in atypical hemolytic uremic syndrome caused renal failure if untreated.33
C7 encodes a serum glycoprotein that forms a membrane attack complex (MAC) together with complement components C5b, C6, C8, and C9 as part of the terminal complement pathway of the innate immune system.34 This protein initiates membrane attack complex formation by binding the C5b-C6 subcomplex and inserts into the phospholipid bilayer, serving as a membrane anchor.35 A previous study showed that C7 might be a potential tumor suppressor.36 C7 is also a critical component of the terminal pathway of complement activation.35 C7 is expressed in endothelial cells as a trap for assembling MACs. MAC deposition has been reported in smooth muscle,37 dermatomyositis microvasculature38,39 and in the mechanism of advanced diabetic kidney disease.40 Thus, MAC formation will increase the expression level of C7. In our study, qRT-PCR validation and ROC curve analysis were applied to evaluate the diagnostic value of C7. ScRNA-seq analysis revealed that C7 was specifically highly expressed in the MES cells in DN. These findings showed that in the early stages of diabetes, there is increased expression of C7 in DN. C7 is released into circulation and is reflected as high levels of C7 in the blood. These findings are supported by those of other studies, in which vascular deposition of complement proteins has been reported.17,25 For example, Falk41 reported complement deposition in the kidneys of diabetic patients. Sircar et al25 reported that C7 expression was upregulated in DN, but did not describe a specific mechanism. Although the upregulation of C7 expression in DN has been reported, the specific cell type that expresses C7 is unknown. Single-cell sequencing has paved the way for further research on C7. C7 is released into circulation and is reflected as high levels of C7 in the blood. Our results showed that as a biomarker, C7 was not significantly expressed in type 1 and 2 diabetic samples, which was in accordance with a previous study.41 This is the first study to reveal that elevated C7 gene and gene products in MES cells is a potential biomarker for early diabetic nephropathy.
MiRNAs are noncoding RNAs that can inhibit the expression of RNA through translation inhibition or messenger RNA degradation.42,43 In recent years, studies have revealed that some miRNAs could be regulators of immune and inflammatory responses and are potential therapeutic targets in DN.15,16 Single nucleotide polymorphisms of miRNA-related genes can affect the production, expression, and function of mature miRNAs, thus affecting disease susceptibility and the immune response. We identified the differentially expressed miRNAs in DN using the GSE161884 dataset. Bioinformatics retrieval and luciferase reporter assays confirmed that miR-494-3p and miR-574-5p could be regulators of C7 in DN. C7 is the direct target of miR-494-3p and miR-574-5p, and these miRNAs can negatively regulate its expression level. This is the first study to reveal that the elevated C7 gene expression level in MES is regulated by miR-494-3p and miR-574-5p in early diabetic nephropathy.
Taken together, our findings indicate that C7 might represent a novel biomarker that is specifically expressed in MES cells in diabetic nephropathy that can be used for diagnosis and that C7 expression levels are regulated by miR-494-3p and miR-574-5p. However, several questions need to be addressed in future studies, such as determining the functions of C7 at the cellular level and in animal models and investigating and why C7 expression is upregulated in MES cells in DN.
Author Contributions
All authors made a significant contribution to the work reported, whether that is in the conception, study design, execution, acquisition of data, analysis, and interpretation, or in all these areas; took part in drafting, revising or critically reviewing the article; gave final approval of the version to be published; have agreed on the journal to which the article has been submitted; and agree to be accountable for all aspects of the work.
Funding
This work was supported by the National Natural Science Foundation of China (81873304) and Tianjin Health Commission Science and Technology Talent Cultivation Project (KJ20022).
Disclosure
The authors declare that they have no conflicts of interest.
References
1. Singh DK, Winocour P, Farrington K. Oxidative stress in early diabetic nephropathy: fueling the fire. Nat Rev Endocrinol. 2011;7(3):176–184. doi:10.1038/nrendo.2010.212
2. Qi C, Mao X, Zhang Z, et al. Classification and differential diagnosis of diabetic nephropathy. J Diabetes Res. 2017;2017:8637138. doi:10.1155/2017/8637138
3. Ruiz-Ortega M, Rodrigues-Diez RR, Lavoz C, et al. Special issue “diabetic nephropathy: diagnosis, prevention and treatment”. J Clin Med. 2020;9(3):813. doi:10.3390/jcm9030813
4. Nakagawa T, Tanabe K, Croker BP, et al. Endothelial dysfunction as a potential contributor in diabetic nephropathy. Nat Rev Nephrol. 2011;7(1):36–44. doi:10.1038/nrneph.2010.152
5. Huang K, Maruyama T, Fan G. The naive state of human pluripotent stem cells: a synthesis of stem cell and preimplantation embryo transcriptome analyses. Cell Stem Cell. 2014;15(4):410–415. doi:10.1016/j.stem.2014.09.014
6. Bao L, Guo T, Wang J, Zhang K, Bao M. Prognostic genes of triple-negative breast cancer identified by weighted gene co-expression network analysis. Oncol Lett. 2020;19(1):127–138. doi:10.3892/ol.2019.11079
7. Malki K, Tosto MG, Jumabhoy I, et al. Integrative mouse and human mRNA studies using WGCNA nominates novel candidate genes involved in the pathogenesis of major depressive disorder. Pharmacogenomics. 2013;14(16):1979–1990. doi:10.2217/pgs.13.154
8. Zuo Z, Shen J-X, Pan Y, et al. Weighted Gene Correlation Network Analysis (WGCNA) detected loss of MAGI2 promotes Chronic Kidney Disease (CKD) by podocyte damage. Cell Physiol Biochem. 2018;51(1):244–261. doi:10.1159/000495205
9. Hedlund E, Deng Q. Single-cell RNA sequencing: technical advancements and biological applications. Mol Aspects Med. 2018;59:36–46. doi:10.1016/j.mam.2017.07.003
10. Wilson PC, Wu H, Kirita Y, et al. The single-cell transcriptomic landscape of early human diabetic nephropathy. Proc Natl Acad Sci U S A. 2019;116(39):19619–19625. doi:10.1073/pnas.1908706116
11. Ricklin D, Hajishengallis G, Yang K, et al. Complement: a key system for immune surveillance and homeostasis. Nat Immunol. 2010;11(9):785–797. doi:10.1038/ni.1923
12. Li L, Yin Q, Tang X, et al. C3a receptor antagonist ameliorates inflammatory and fibrotic signals in type 2 diabetic nephropathy by suppressing the activation of TGF-beta/smad3 and IKBalpha pathway. PLoS One. 2014;9(11).
13. Lee CS, Mauer SM, Brown DM, et al. Renal transplantation in diabetes mellitus in rats. J Exp Med. 1974;139(4):793–800. doi:10.1084/jem.139.4.793
14. Krützfeldt J, Rajewsky N, Braich R, et al. Silencing of microRNAs in vivo with ‘antagomirs’. Nature. 2005;438(7068):685. doi:10.1038/nature04303
15. Zhou H, Ni W-J, Meng X-M, et al. MicroRNAs as regulators of immune and inflammatory responses: potential therapeutic targets in diabetic nephropathy. Front Cell Dev Biol. 2021;8:618536. doi:10.3389/fcell.2020.618536
16. Kato M, Natarajan R. MicroRNAs in diabetic nephropathy: functions, biomarkers, and therapeutic targets. Ann N Y Acad Sci. 2015;1353:72–88. doi:10.1111/nyas.12758
17. Woroniecka KI, Park ASD, Mohtat D, et al. Transcriptome analysis of human diabetic kidney disease. Diabetes. 2011;60(9):2354–2369. doi:10.2337/db10-1181
18. Pan Y, Jiang S, Hou Q, et al. Dissection of glomerular transcriptional profile in patients with diabetic nephropathy: SRGAP2a protects podocyte structure and function. Diabetes. 2018;67(4):717–730. doi:10.2337/db17-0755
19. Langfelder P, Horvath S. WGCNA: an R package for weighted correlation network analysis. BMC Bioinform. 2008;9:559. doi:10.1186/1471-2105-9-559
20. Yu G, Wang L-G, Han Y, et al. clusterProfiler: an R package for comparing biological themes among gene clusters. OMICS. 2012;16(5):284–287. doi:10.1089/omi.2011.0118
21. Subramanian A, Tamayo P, Mootha VK, et al. Gene set enrichment analysis: a knowledge-based approach for interpreting genome-wide expression profiles. Proc Natl Acad Sci U S A. 2005;102(43):15545–15550. doi:10.1073/pnas.0506580102
22. Dweep H, Gretz N. miRWalk2.0: a comprehensive atlas of microRNA-target interactions. Nat Methods. 2015;12(8):697. doi:10.1038/nmeth.3485
23. Agarwal V, Bell GW, Nam J-W, et al. Predicting effective microRNA target sites in mammalian mRNAs. eLife. 2015;4. doi:10.7554/eLife.05005
24. Ioannou K. Diabetic nephropathy: is it always there? Assumptions, weaknesses and pitfalls in the diagnosis. Hormones (Athens). 2017;16(4):351–361. doi:10.14310/horm.2002.1755
25. Sircar M, Rosales IA, Selig MK, et al. Complement 7 is up-regulated in human early diabetic kidney disease. Am J Pathol. 2018;188(10):2147–2154. doi:10.1016/j.ajpath.2018.06.018
26. Li XX, Wang LJ, Hou J, et al. Identification of long noncoding rnas as predictors of survival in triple-negative breast cancer based on network analysis. Biomed Res Int. 2020;2020:8970340.
27. Zhu Y, Huang Y, Tan Y, et al. Single-cell RNA sequencing in hematological diseases. Proteomics. 2020;20:e1900228. doi:10.1002/pmic.201900228
28. Daugan M, Noe R, Herman Fridman W, et al. [The complement system: a double edge sword in tumor progression]. Med Sci (Paris). 2017;33(10):871–877. doi:10.1051/medsci/20173310019. French.
29. Gialeli C, Gungor B, Blom AM. Novel potential inhibitors of complement system and their roles in complement regulation and beyond. Mol Immunol. 2018;102:73–83. doi:10.1016/j.molimm.2018.05.023
30. Lo MW, Woodruff TM. Complement: bridging the innate and adaptive immune systems in sterile inflammation. J Leukoc Biol. 2020;108(1):339–351. doi:10.1002/JLB.3MIR0220-270R
31. Roumenina LT, Daugan MV, Petitprez F, et al. Context-dependent roles of complement in cancer. Nat Rev Cancer. 2019;19(12):698–715. doi:10.1038/s41568-019-0210-0
32. Biewenga M, Farina Sarasqueta A, Tushuizen ME, et al. The role of complement activation in autoimmune liver disease. Autoimmun Rev. 2020;19(6):102534. doi:10.1016/j.autrev.2020.102534
33. Willows J, Brown M, Sheerin NS. The role of complement in kidney disease. Clin Med (Lond). 2020;20(2):156–160. doi:10.7861/clinmed.2019-0452
34. Hobart MJ, Fernie BA, DiScipio RG. Structure of the human C7 gene and comparison with the C6, C8A, C8B, and C9 genes. J Immunol. 1995;154(10):5188–5194.
35. DiScipio RG, Chakravarti DN, Muller-Eberhard HJ, et al. The structure of human complement component C7 and the C5b-7 complex. J Biol Chem. 1988;263(1):549–560. doi:10.1016/S0021-9258(19)57427-0
36. Ying L, Zhang F, Pan X, et al. Complement component 7 (C7), a potential tumor suppressor, is correlated with tumor progression and prognosis. Oncotarget. 2016;7(52):86536–86546. doi:10.18632/oncotarget.13294
37. Uesugi N, Sakata N, Nangaku M, et al. Possible mechanism for medial smooth muscle cell injury in diabetic nephropathy: glycoxidation-mediated local complement activation. Am J Kidney Dis. 2004;44(2):224–238. doi:10.1053/j.ajkd.2004.04.027
38. Lahoria R, Selcen D, Engel AG. Microvascular alterations and the role of complement in dermatomyositis. Brain. 2016;139(Pt 7):1891–1903. doi:10.1093/brain/aww122
39. Kissel JT, Mendell JR, Rammohan KW. Microvascular deposition of complement membrane attack complex in dermatomyositis. N Engl J Med. 1986;314(6):329–334. doi:10.1056/NEJM198602063140601
40. Fearn A, Sheerin NS. Complement activation in progressive renal disease. World J Nephrol. 2015;4(1):31–40. doi:10.5527/wjn.v4.i1.31
41. Falk RJ, Sisson SP, Dalmasso AP, et al. Ultrastructural localization of the membrane attack complex of complement in human renal tissues. Am J Kidney Dis. 1987;9(2):121–128. doi:10.1016/S0272-6386(87)80089-6
42. Mongroo PS, Rustgi AK. The role of the miR-200 family in epithelial-mesenchymal transition. Cancer Biol Ther. 2014;10(3):219–222. doi:10.4161/cbt.10.3.12548
43. Zhou DD, Li HL, Liu W, et al. miR-193a-3p promotes the invasion, migration, and mesenchymal transition in glioma through regulating BTRC. Biomed Res Int. 2021;2021(80):1–22.
 © 2021 The Author(s). This work is published and licensed by Dove Medical Press Limited. The full terms of this license are available at https://www.dovepress.com/terms.php and incorporate the Creative Commons Attribution - Non Commercial (unported, v3.0) License.
By accessing the work you hereby accept the Terms. Non-commercial uses of the work are permitted without any further permission from Dove Medical Press Limited, provided the work is properly attributed. For permission for commercial use of this work, please see paragraphs 4.2 and 5 of our Terms.
© 2021 The Author(s). This work is published and licensed by Dove Medical Press Limited. The full terms of this license are available at https://www.dovepress.com/terms.php and incorporate the Creative Commons Attribution - Non Commercial (unported, v3.0) License.
By accessing the work you hereby accept the Terms. Non-commercial uses of the work are permitted without any further permission from Dove Medical Press Limited, provided the work is properly attributed. For permission for commercial use of this work, please see paragraphs 4.2 and 5 of our Terms.