")
Back to Journals » International Journal of General Medicine » Volume 14
Comparison of Visual Transient Elastography and Shear Wave Elastography in Evaluating Liver Fibrosis in Patients with Chronic Liver Disease
Authors Yang J , Li J, Ye G, Luo Y
Received 7 May 2021
Accepted for publication 30 June 2021
Published 15 July 2021 Volume 2021:14 Pages 3553—3561
DOI https://doi.org/10.2147/IJGM.S319101
Checked for plagiarism Yes
Review by Single anonymous peer review
Peer reviewer comments 2
Editor who approved publication: Dr Scott Fraser
Jiali Yang, Jiawu Li, Guilin Ye, Yan Luo
Department of Ultrasound, West China Hospital, Sichuan University, Chengdu, Sichuan, 610041, People’s Republic of China
Correspondence: Yan Luo
Department of Ultrasound, West China Hospital, Sichuan University, Chengdu, Sichuan, 610041, People’s Republic of China
Tel +8613060073719
Email [email protected]
Purpose: This study investigated the effectiveness and feasibility of shear wave elastography ((sound touch elastography) STE and (shear wave elastography) SWE) and visual transient elastography (ViTE) in the noninvasive quantitative diagnosis of liver fibrosis in chronic liver disease (CLD).
Patients and Methods: A total of 106 patients with CLD underwent STE, SWE and ViTE elastography evaluation. The Young’s modulus of the three elastography was valuated and the diagnostic performances of the three techniques for liver fibrosis staging were compared. The area under the receiver operating curve (ROC) for the diagnosis of liver fibrosis was compared. The final diagnosis was based on the histological findings on the liver biopsy.
Results: 1) The correlation between ViTE and SWE, ViTE and STE, SWE and STE stiffness values were 0.72, 0.75, 0.75 (P< 0.001). 2) The relationship between the results of each elastography technique and the stage of pathological liver fibrosis showed that the more severe the liver fibrosis was, the higher the stiffness value was (all P < 0.001). 3) When the three elastography techniques were used to detect the degree of liver fibrosis in different pathological stages, there was no statistical difference in the stabilities of the boxplots. 4) The ROCs of the three elastography techniques (ViTE, SWE and STE) were 0.88, 0.91, 0.92, F0 vs F1-3; 0.84, 0.84, 0.84, F0-1 vs F2-4; 0.80, 0.79, 0.77, F0-2 vs F3-4; 0.80, 0.76, 0.71, F0-3 vs 4; the AUC of ViTE was higher than the AUC of STE in the identification of F4, but there were no statistical differences in the AUCs of other groups.
Conclusion: ViTE has good stability for the liver stiffness measurement (LSM) and a high consistency with shear-wave elastography (SWE and STE). It is an effective tool for evaluating CLD, and its performance is comparable to SWE and STE. The combination of ViTE and STE can improve the specificity of disease diagnosis and do not add extra cost and may improve cost performance.
Keywords: chronic liver disease, liver fibrosis, shear wave elastography, visual transient elastography, liver stiffness measurement
Introduction
Each year, approximately 2 million people worldwide die from CLD, of which 1 million die from viral hepatitis and hepatocellular carcinoma and 1 million die from complications of cirrhosis.1 The causes of CLD include viruses (mainly hepatitis B or C viruses), excessive alcohol consumption, etc. Poor nutritional habits may lead to nonalcoholic fatty liver disease (NAFLD) and steatohepatitis.2 The “gold standard” for the diagnosis of liver fibrosis and cirrhosis is via the pathological examination.3 However, due to the invasiveness and expensive costs of pathology, approximately 30% of patients will experience side effects such as pain, bleeding, infection and pneumothorax after needle puncture. In addition, due to the maldistribution of liver fibrosis and cirrhosis, the liver tissue obtained by fine needle aspiration is very small, so variation in the obtained specimens often occurs.4 Shear wave-based ultrasound elastography techniques including transient elastography (TE), two-dimensional shear wave elastography (SWE) and point shear wave elastography (pSWE) are used for the assessment of the liver fibrosis stage in clinical practice widely.4 It is helpful for the diagnosis of CLD by detecting the propagation speed of the shear wave velocity in the liver and then converting it into the Young’s modulus value, which links the stiffness of liver tissue with fibrosis. TE was the earliest and it is the relatively recognized elastography technique in clinical practice and has been included in many guidelines.5,6 However, the TE techniques (Fibroscan and Fibrotouch) currently used in clinical practice still has various problems. For example, due to the lack of two-dimensional real-time ultrasonographic guidance (Fibroscan);7 the probe operation can be too complicated (Fibrotouch) because the image guidance and elastic detection are successively independent, leading to problems such as an insufficient positioning guidance and a low detection efficiency. Since the current elastography techniques lack the ability to identify the intermediate stages of liver fibrosis, new devices and elastography techniques are constantly emerging in clinical practice, and more clinical studies are needed to verify these new techniques.8
ViTE is the latest transient elastography technology. The integrated all-around probe class covers all patients. There is no need to replace the probe during the inspection. A single probe can simultaneously reveal the two-dimensional ultrasound guidance and the quantitative detection throughout the entire process, ensuring that blood vessels and lesions are avoided and that the difficulty of operation is reduced. The double-loop quality control function in the examination, the pressure of the probe and the stability of the subject’s breathing will directly affect the accuracy of the results. The Q-Scan takes only about 7 seconds to collect 10 sets of valid data, which greatly improves the efficiency of the examination and enables more patients to be screened for liver disease.
Patients and Methods
Patients
One hundred and seventy-three patients had undergone three elastography (ViTE, SWE and STE) examination between July 1, 2020 and January 15, 2021. The exclusion criteria were as follows: ① patients who did not want to participate in the study (n =0); ② BMI≥30 kg/m2 (n =8); ③ Patients without pathologic puncture results.(n =56); ④ The results of the ViTE, SWE and STE stiffness measurements did not conform to the effective measurement standard (n=3). Therefore, the final studied population consisted of 106 patients who underwent liver stiffness measurement (LSM) and liver biopsy (LB) at the Department of Ultrasound, West China Hospital of Sichuan University were prospectively and continuously enrolled.
ViTE and STE were performed on the same machine by an experienced operator (the operator had already used the machine to practice elastography on more than 500 patients before conducting the study). SWE was completed by another doctor who also had practiced SWE on more than 500 patients before the study. This study was approved by the Ethical Review Committee of the West China Hospital of Sichuan University, and written informed consent was obtained from the study subjects. Patient information was kept confidential and was not used for any purpose other than research. This study was conducted in accordance with the Declaration of Helsinki.
Image Acquisition
Equipment
ViTE (Figure 1A) and STE (Figure 1B) were determined using a Mindray colour Doppler ultrasound (China, Resona7). SWE (Figure 1C) was determined using an Aixplorer Ultrasound system (France Supersonic). SWE and STE used an SC1-6U convex array probe with a frequency 1–6 MHz; ViTE used a LFP5-1U probe with a probe frequency of 1–5 MHz. Figure 1.
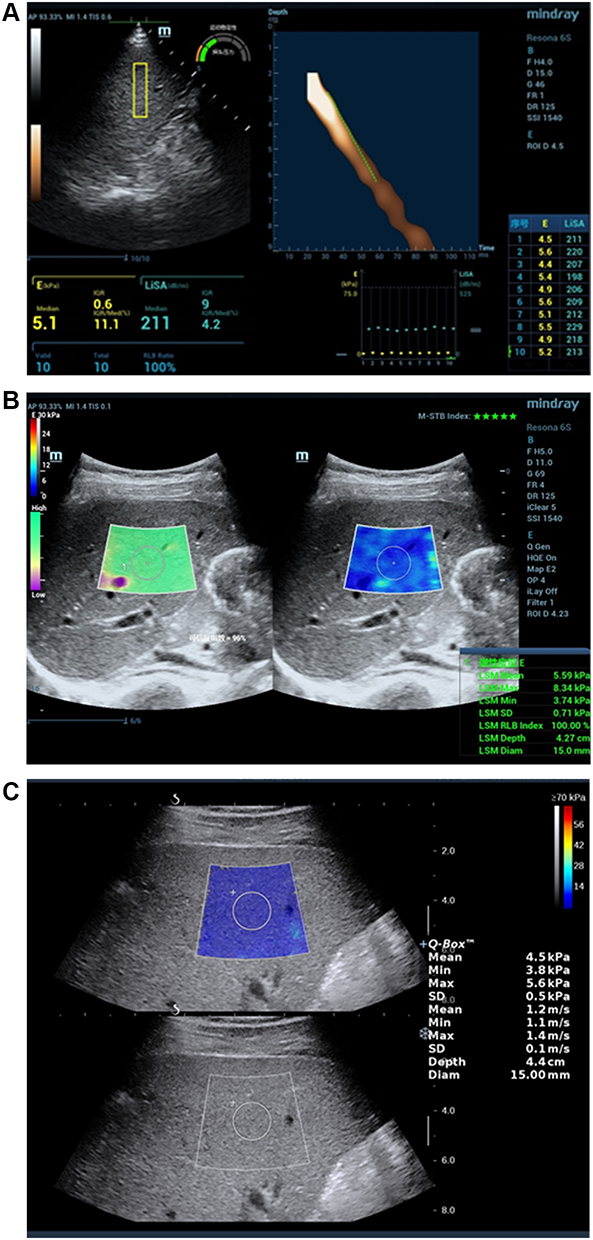 |
Figure 1 Elasticity maps of three different elastography (A) ViTE; (B) STE; (C) SWE. |
Elastography Examination
After fasting for more than 8 hours, the patients were placed in the supine position, with their hands behind their head, and their right upper limb in the fully abducted position to increase the width of the intercostal space to visualized the right lobe of the liver. All patients underwent a routine ultrasound examination before the elasticity measurements. All patients were examined using ViTE, SWE and STE. The examination method was based on the imaging guidelines of the European Federation of Societies for Ultrasound in Medicine and Biology (EFSUMB)5 and the previous literature.9–11 The probe was placed sections of S5 and S6 of the right intercostal space in the right lobe, avoiding the long axis of blood vessels, and the liver parenchyma was clearly displayed on the two-dimensional image. The upper edge of the elastic sampling frame was placed 1–2 cm below the liver capsule, and the probe was placed with an appropriate pressure. The patient was instructed to hold his or her breath using calm breathing state and to avoid deep inhalation or deep exhalation during the examination. The size of the STE and SWE sampling boxes is 4 cm x 3 cm, the colour filling was more than 90%, the diameter of the region of interest (ROI) is 15 mm, and the colour was relatively uniform. The STE and SWE were measured more than 3 times, and the ViTE for more than 10 times. The median values of both detection methods were calculated during the statistical analysis.5
STE uses the motion stability (M-STB) index, ranging from 1 to 5 stars, to monitor the severity of the motion interference between the sensor and the patient’s skin in real time. The Resona7 system also provides a quality control mode for an additional reliability (RLB) chart. LSMs are considered valid when the M-STB index shows at least four stars, the RLB map is uniformly green, and the index is > 95%. In the SWE inspection, the Q-box was placed at the target location, and the signal filled more than half of the ROI. SWE was considered to have failed when there was no or only a small amount of signal in the acquisition box for all trials.
ViTE is a novel noninvasive quantitative transient elastography. Single probe can simultaneously manifest the two-dimensional ultrasound guidance and quantitative detection throughout the entire process, ensuring that blood vessels and diseased parts are avoided, and the difficulty of operation is reduced. The double-loop quality control function during inspection, the pressure of the probe and the stability of the respiration will directly affect the accuracy of the results. ViTE is equipped with probe pressure ring P and motion stability ring (M-STB) command indicators, and guides the standard operation and quality control through intuitively clear yellow and green light indicators. The patients were asked to hold their breath and the M-STB was observed to reach a stable state to trigger the detection.
Effective Measurement Criteria
The ViTE was successfully measured at the same position for more than 10 times; the STE and SWE were successfully measured at the same location for more than 3 times. The three elastography techniques are all represented by the median (interquartile interval) [M/IQR], and a ratio of the IQR/M <30% and a detection success rate of > 60% are regarded as a valid detection.12
Pathological Examination
The pathological results of the included patients were obtained during surgery or with a liver biopsy. The pathological results were histologically examined by histopathologists with an extensive experience in liver histology. They were not aware of the liver elasticity results of the ViTE, SWE and STE. Based on the Metavir grading system,13,14 the liver fibrosis stages and inflammatory activities were evaluated.
Statistical Methods
SPSS 25.0 and MedCalc 19.3 statistical software were used for data processing. Measurement data conforming to a normal distribution are represented by the mean ± standard deviation (x ± s); a one way analysis of variance was used to compare the different elastography techniques in each liver fibrosis period. The Pearson correlation test was used to analyse the correlation between the elastography and liver fibrosis staging. ROC curves and areas under curve (AUCs) were used to compare the diagnostic efficiencies of ViTE, SWE and STE. The DeLong test was used to determine the significance of the AUCs.15 For the identification of different fibrosis stages by SWE, ViTE and STE, the sensitivity and specificity were calculated according to the optimal cut-off points that maximized the Youden index. The P-value was two-tailed and a P < 0.05 was considered statistically significant. The stabilities of the measured values were evaluated using a boxplot.
Results
Patient Characteristic
A total of 106 patients with valid and reliable LSMs determined by ViTE, SWE and STE were included in the study, and there were 51 male and 55 female patients with a mean age of 51.22± 12.91 years. According to the METAVIR G/S scoring system, 37 patients were categorized as F1≤, 19 were as F2≤, 22 were as F3≤ and 28 were as F4. All baseline characteristics of the patients enrolled in the study are shown in Table 1.
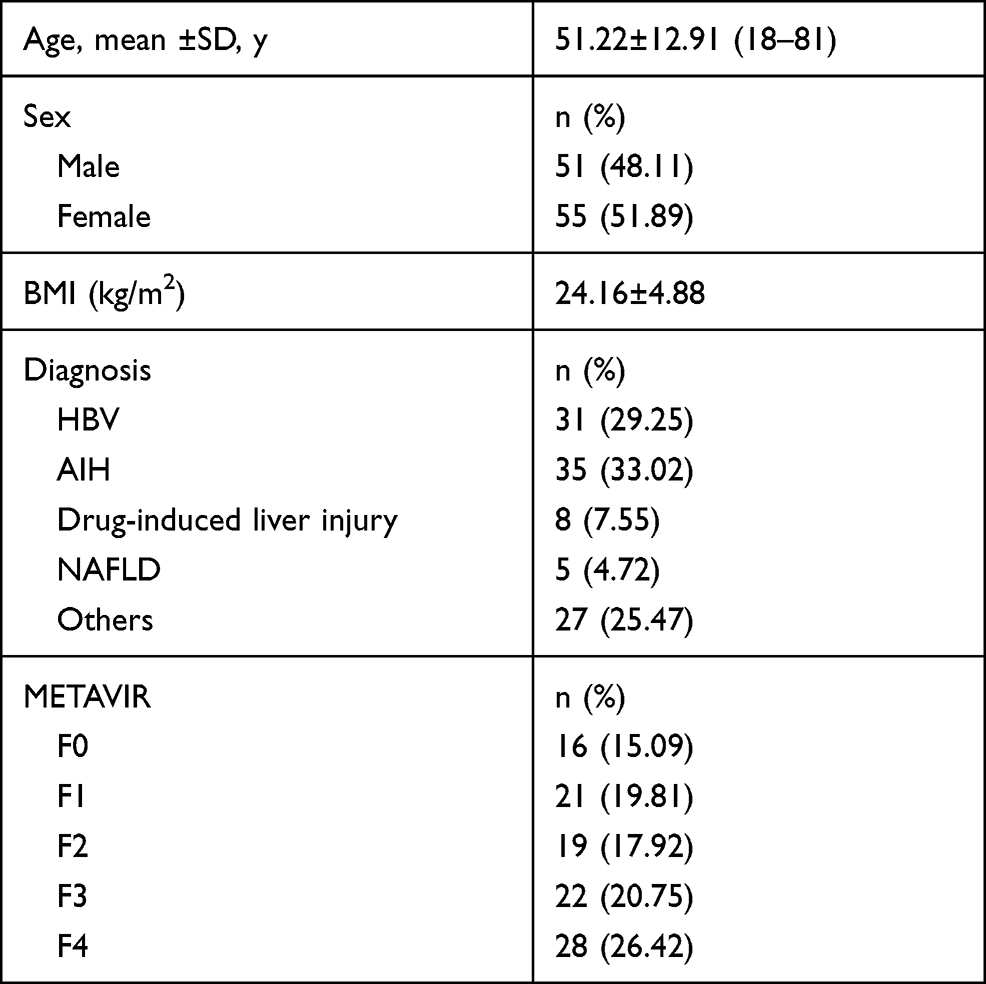 |
Table 1 Shows the Characteristics of Patients |
Results of ViTE, SWE and STE of LSMs
The correlation coefficients of ViTE and SWE, ViTE and STE, SWE and STE were 0.72, 0.75, 0.75 (P values of<0.01). The results show that there is a strong correlation between the stiffness values measured by the three elastography techniques.
The distributions of the ViTE, SWE and STE test results in each pathological stage of liver fibrosis are shown in Table 2. There were 16 patients with F0, 21 patients with F1, 19 patients with F2, 22 patients with F3, and 28 patients with F4. A one-way analysis of variance was used for the comparison of each liver fibrosis stage, and the comparison of stiffness values of pathological stages of liver fibrosis in each group was statistically significant (P<0.001). The LSMs of the three different elastography techniques all increased with the degree of liver fibrosis.
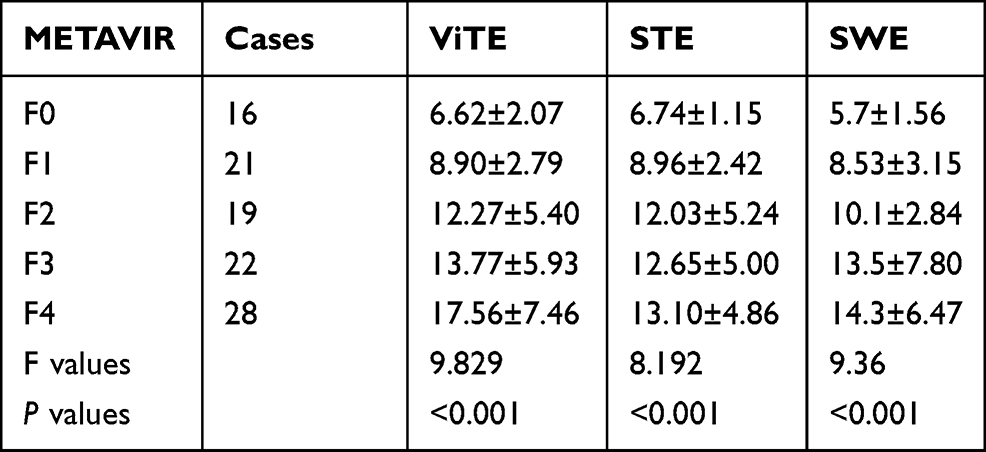 |
Table 2 LSMs of the ViTE, SWE and STE in Pathological Analysis of Liver Fibrosis in Each Group |
The stabilities of the ViTE, SWE and STE liver stiffness measurements in each stage of liver fibrosis are shown in Figure 2. The boxes represent IQR (second and third quartiles), the horizontal lines in the boxes represent the median, the horizontal lines below and above the boxes represent the first and fourth quartiles, respectively, and the points beyond the highest and lowest quartiles represent outliers.
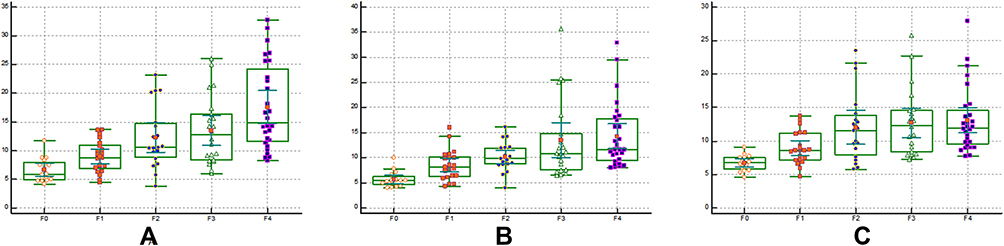 |
Figure 2 Box-plot of three elastography techniques in the stage of liver fibrosis (A) ViTE; (B) SWE; (C) STE. |
The ROC curves of ViTE, SWE and STE for the diagnosis of F1≤, F2≤, F3≤ and =F4 liver fibrosis are shown in Figure 3. The AUCs of ViTE, SWE and STE were 0.88, 0.92 and 0.91 for F1≤stage; 0.84, 0.84 and 0.84 for F2≤ stage; 0.80, 0.79 and 0.77 for F3≤ stage; 0.80, 0.76 and 0.71 for F=4 stage, respectively. Except for F=4 AUCs, the difference between ViTE and STE was statistically significant and the AUCs of the other pathological stages were not statistically significant.
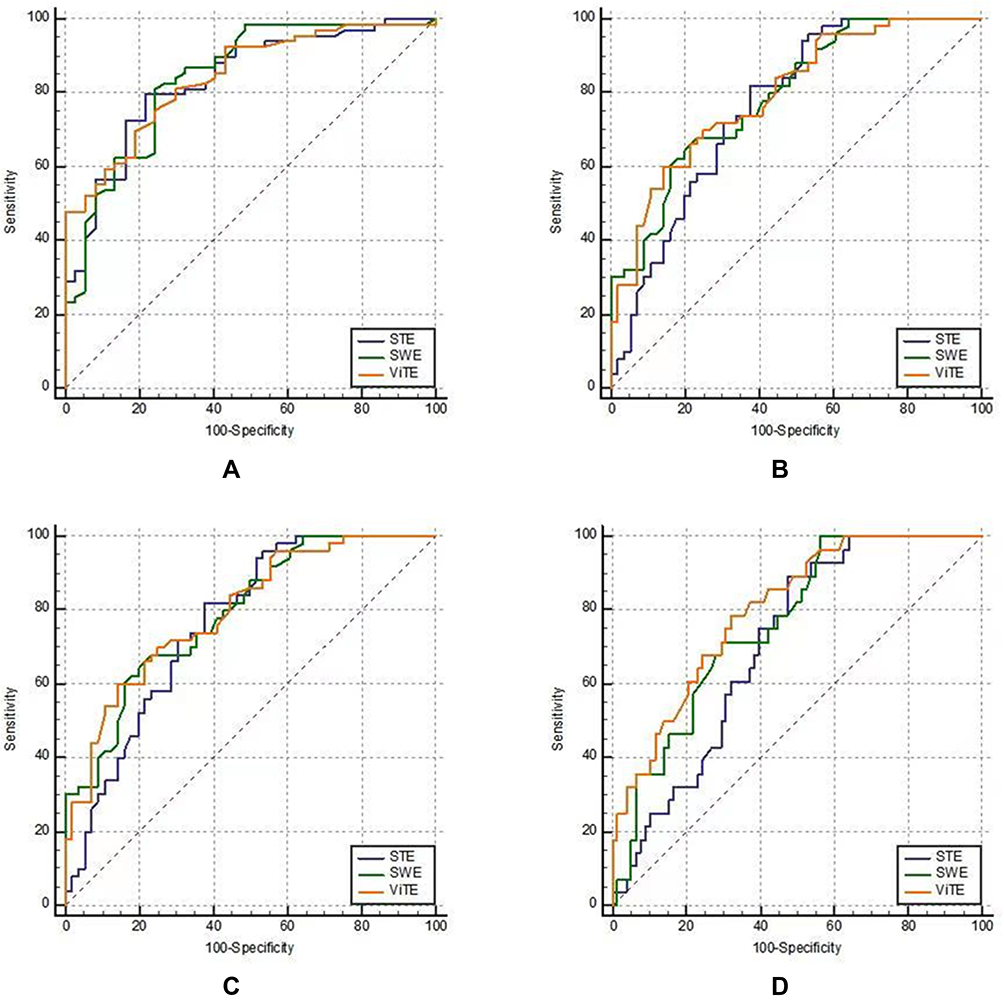 |
Figure 3 Comparison of the area under the curve (AUC) of ViTE, SWE and STE at different stages of fibrosis (A) comparison of ROC curves in the identification of F0 vs F1–4; (B) F0-1 vs F2-3; (C) F0-2 vs F3-4; (D) F0-3 vs F4. |
The diagnostic accuracies (AUCs, cut-off value, sensitivity, specificity) of ViTE, SWE and STE in different liver fibrosis stages are shown in Table 3.
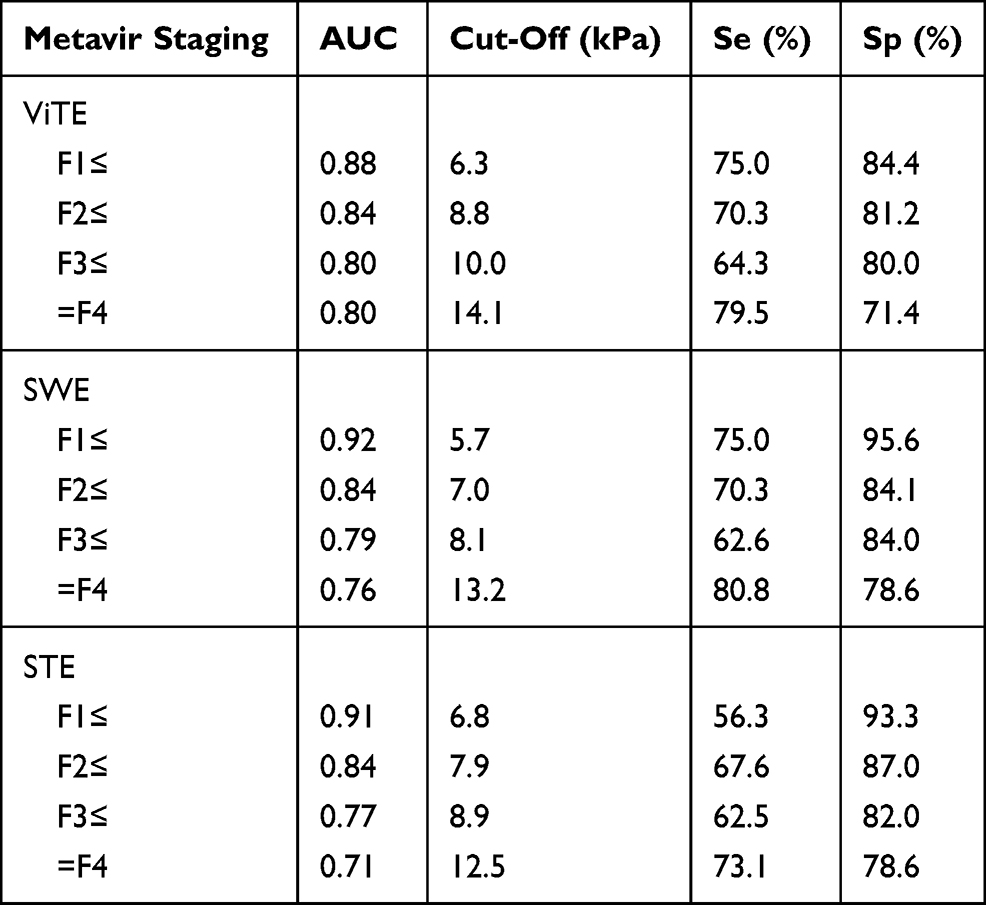 |
Table 3 Diagnostic Accuracy of ViTE, SWE and STE for Different Stages of Liver Fibrosis in CLD Patients |
The combined diagnostic accuracy of ViTE and STE is shown in Table 4. The combined use of ViTE and STE increased the diagnostic accuracy, decreased the sensitivity and increased the specificity.
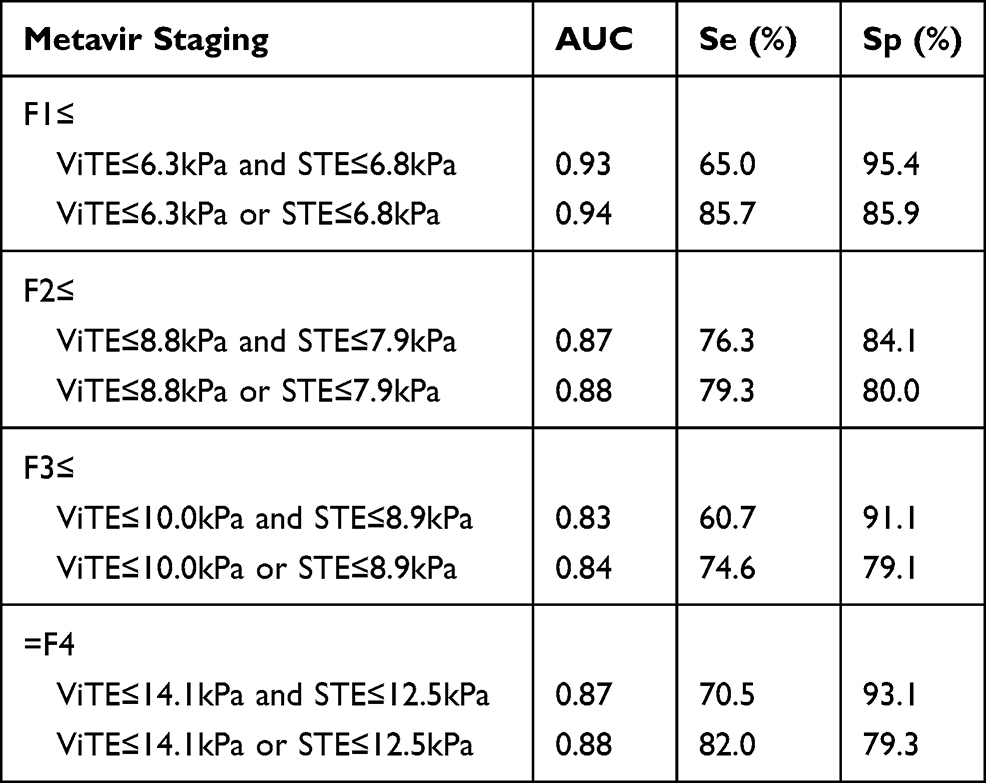 |
Table 4 Diagnostic Accuracy of ViTE and STE by Combining or Using Either Technique |
Discussion
CLD causes continuous damage and inflammation of liver tissue, leading to liver fibrosis, and eventually cirrhosis.16 Cirrhosis can lead to liver failure and, in many cases, hepatocellular carcinoma and death.17 Some studies have shown18,19 that an early diagnosis and treatment of CLD may play a positive role in the prognosis and outcome of the disease. Therefore, the progression and regression of liver fibrosis and early cirrhosis were detected and followed up to verify the effectiveness of different treatment options. Ultrasound elastography has been widely accepted in recent years as a noninvasive and quantitative method to assess the stiffness of liver tissue. Changes in stiffness are usually the result of structural deformation caused by chronic liver injury.20 After years of application and development, transient elastography (TE) and shear-wave elastography are now relatively accepted in clinical practice.21,22 However, TE still needs to improve due to the problem of a lack of image guidance. ViTE is the latest elastography technology, which can combine 2D images and transient elastography simultaneously on a single probe. It also has a double-loop quality control for the probe pressure, which improves the breathing stability of the subject. However, since ViTE has not been used on a large scale in clinical practice, more studies are needed for a reference in clinical applications. In this study, ViTE, SWE and STE were used to evaluate the LSM of patients with CLD for comparison and to determine the effectiveness and feasibility of these elastography techniques for a noninvasive quantitative determination of the degree of liver fibrosis.
To the best of our knowledge, this is the first study to compare ViTE performance with that of known and established Ultrasound elastographic techniques such as SWE from Supersonic Imagine and STE from Mindray in CLD assessment. In this study, ViTE, SWE and STE were compared with respect to their performance in CLD assessment. One hundred and six consecutive liver biopsy validated patients were examined with all three methods.
In this study, the correlation coefficients between VITE and SWE, VITE and STE, SWE and STE were 0.72, 0.75, 0.75 (P < 0.001 in the inter-device variability study). There is a strong correlation between the LSM values measured by the three elastography techniques, indicating that the pairs of devices have good inter-device consistency. The results of this study are similar to those of previous studies.11 The relationship between the LSM values of ViTE, SWE and STE and the stage of liver fibrosis was evaluated and with an increase in the degree of liver fibrosis, the Young’s modulus measured by ViTE, SWE and STE also increased, which may be related to the pathological progression of liver fibrosis. The results of this study are consistent with those of previous studies.20,23 The LSM values in the same stage of liver fibrosis were different in different devices. This may be because different elastography techniques detect the propagation speed of shear wave velocity in the liver, and then convert it into Young’s modulus; however, due to the difference in the center frequency of shear waves and the difference in the transformation process of the three technologies, the measured values cannot be equal.20
Comparisons of the diagnostic efficacy of ViTE, SWE and STE in stages of liver fibrosis were evaluated and the AUCs of ViTE, SWE and STE were 0.92, 0.91 and 0.88 in F0 vs 1–4 stage; 0.84, 0.84 and 0.84 in F≤0-1 vs F2-4; 0.77, 0.79 and 0.80 in F≤0-2 vs F3-4; 0.71, 0.76 and 0.80 in F≤0-3 vs F=4, respectively. There were no statistical significance in the AUCs of other pathological stages except that the AUCs of ViTE and STE at F=4 were statistically significant. These results indicated that ViTE and SWE, SWE and STE showed good consistency in the diagnostic efficacy of liver fibrosis in different groups. The three elastography systems performed similarly in the diagnosis of CLD at each stage and were more effective in the diagnosis of F0 ≤stage. The results of this study are similar to those of Gatos et al.11 However, TE and SWE have higher accuracies in the diagnosis of advanced hepatic fibrosis (F3 ≤and =F4) in some studies.24–27 Leung et al28 showed that SWE was superior to TE in the evaluation of F2≤ liver fibrosis, while in this study, the AUC sensitivities of ViTE, SWE and STE for F2≤ liver fibrosis were comparable (0.84 vs 0.84 vs 0.84). Previous studies have shown that SWE and STE are equivalent in predicting liver fibrosis, similar to the results of this study.11
The combined use of ViTE and STE in predicting liver fibrosis reduced the sensitivity but increased the specificity for all liver fibrosis stages. It is feasible to use both types of elastography in a single patient because both probes can be implemented on a single ultrasound device and do not add extra cost and may improve cost performance. Because SWE is not in the same imaging system as ViTE and STE, it is not clinically feasible to use these two technologies simultaneously. This research result is the same as that of Paul.23 Since the Resona 7 ultrasound system equipped with STE and ViTE is consistent with SWE, sonographers have more options to use ViTE and STE alone or in combination.
Different cut-off values and AUC values to distinguish different stages of liver fibrosis by elastography have been published. Different studies come from different countries and the types of diseases are also different; and age, sex, BMI,29 serum transaminases30 and postprandial status can also affect the liver stiffness.31 Therefore, the cut-off values of liver stiffness cannot be generalized. Even the European Federation of Ultrasound Societies for Medicine and Biology (FUSMB)5 and the World Federation of Ultrasound Societies for Medicine and Biology (WFUSMB)32 only give the guidelines for the use of elastography without any of the specific thresholds for the diagnosis of fibrosis at different stages. The diagnostic cut-off values and AUC values of ultrasonography elastography for liver disease is different with different technology, different equipment and different etiology. We have preliminarily studied a new elastic ultrasound method (ViTE) and the results are also preliminarily feasible and it can be used in combination with another method (STE) in the same device, which can provide more clinical options.
There are some limitations to our study. This study did not consider the height and weight of patients, the subcutaneous adipose tissue thickness. Whether these factors will affect our quantitative measurement needs to be explored in future studies. In addition, the sample size can be further expanded. We observed cases where both SWE and TE had high LSM values, but the Metavir staging was low. Liver biopsies are prone to sampling errors because of the heterogeneity of the effects of fibrosis on the liver. In this case, a liver biopsy performed under the guidance of SWE (from the harder area depicted) may help to obtain a better tissue sample. Patients with CLD were included in this paper, including different disease types. However, studies26 have shown that there is no significant difference in the diagnostic manifestations of the liver fibrosis stage between NAFLD viral hepatitis and other chronic liver diseases.
Conclusion
The ability of ViTE to predict liver fibrosis in CLD is similar to that of SWE and STE, and the consistencies of the three are adequate. The combination of ViTE and STE can improve the specificity of disease diagnosis and do not add extra cost and may improve cost performance.
Acknowledgment
This project was funded by the West China Hospital of Sichuan University. We appreciate to Supersonic Corporation in France and Mindray Corporation in China for their technical assistance. We would also like to thank all participants for their contributions to this project.
Disclosure
The authors report no conflicts of interest in this work.
References
1. Asrani SK, Devarbhavi H, Eaton J, Kamath PS. Burden of liver diseases in the world. J Hepatol. 2019;70(1):151–171. doi:10.1016/j.jhep.2018.09.014
2. Scaglione S, Kliethermes S, Cao G, et al. The epidemiology of cirrhosis in the United States: a Population-based Study. J Clin Gastroenterol. 2015;49(8):690–696. doi:10.1097/MCG.0000000000000208
3. Chapman T, Dubinsky T, Barr RG. Ultrasound elastography of the liver: what the clinician needs to know. J Ultrasound Med. 2017;36(7):1293–1304. doi:10.7863/ultra.16.08001
4. Yang L, Li J, Ma L, et al. Noninvasive assessment of liver fibrosis in chronic hepatitis B carriers with sound touch elastography: study of surgical pathology specimens. Expert Rev Med Devices. 2020;17(8):845–853. doi:10.1080/17434440.2020.1798226
5. Dietrich CF, Bamber J, Berzigotti A, et al. EFSUMB guidelines and recommendations on the clinical use of liver ultrasound elastography, update 2017 (Long Version). Ultraschall Med. 2017;38(4):e16–e47. doi:10.1055/s-0043-103952
6. Hu P, Ren H. [Interpretations of EASL 2017 clinical practice guidelines on the management of hepatitis B virus infection]. Zhonghua Ganzangbing Zazhi. 2017;25(6):415–418. (Chinese).
7. Wong GL, Chan HL, Choi PC, et al. Association between anthropometric parameters and measurements of liver stiffness by transient elastography. Clin Gastroenterol Hepatol. 2013;11(3):
8. Giuffrè M, Colecchia A, Crocè LS. Elastography: where are we now? Minerva Gastroenterol. 2021;67(2):109–111. doi:10.23736/S2724-5985.20.02773-7
9. Dong Y, Sirli R, Ferraioli G, et al. Shear wave elastography of the liver – review on normal values. Z Gastroenterol. 2017;55(02):153–166. doi:10.1055/s-0042-117226
10. Serra JT, Mueller J, Teng H, Elshaarawy O, Mueller S. Prospective comparison of transient elastography using two different devices: performance of FibroScan and FibroTouch. Hepat Med. 2020;12:41–48. doi:10.2147/HMER.S245455
11. Gatos I, Drazinos P, Yarmenitis S, Theotokas I, Zoumpoulis PS. Comparison of sound touch elastography, shear wave elastography and vibration-controlled transient elastography in chronic liver disease assessment using liver biopsy as the “Reference standard”. Ultrasound Med Biol. 2020;46(4):959–971. doi:10.1016/j.ultrasmedbio.2019.12.016
12. Bamber J, Cosgrove D, Dietrich CF, et al. EFSUMB guidelines and recommendations on the clinical use of ultrasound elastography. Part 1: basic principles and technology. Ultraschall Med. 2013;34(2):169–184. doi:10.1055/s-0033-1335205
13. Theise ND. Liver biopsy assessment in chronic viral hepatitis: a personal, practical approach. Mod Pathol. 2007;20(Suppl 1):S3–14. doi:10.1038/modpathol.3800693
14. Bedossa P, Poynard T. An algorithm for the grading of activity in chronic hepatitis C. The METAVIR Cooperative Study Group. Hepatology (Baltimore, Md). 1996;24(2):289–293. doi:10.1002/hep.510240201
15. DeLong ER, DeLong DM, Clarke-Pearson DL. Comparing the areas under two or more correlated receiver operating characteristic curves: a nonparametric approach. Biometrics. 1988;44(3):837–845. doi:10.2307/2531595
16. Yoon JH, Lee JM, Han JK, Choi BI. Shear wave elastography for liver stiffness measurement in clinical sonographic examinations: evaluation of intraobserver reproducibility, technical failure, and unreliable stiffness measurements. J Ultrasound Med. 2014;33(3):437–447. doi:10.7863/ultra.33.3.437
17. Barr RG. Shear wave liver elastography. Abdom Radiol. 2018;43(4):800–807. doi:10.1007/s00261-017-1375-1
18. Parola M, Pinzani M. Liver fibrosis: pathophysiology, pathogenetic targets and clinical issues. Mol Aspects Med. 2019;65:37–55.
19. Loomba R, Schork N, Chen CH, et al. Heritability of hepatic fibrosis and steatosis based on a Prospective Twin Study. Gastroenterology. 2015;149(7):1784–1793.
20. Xia S, Ren X, Ni Z, Zhan W. A noninvasive method-shear-wave elastography compared with transient elastography in evaluation of liver fibrosis in patients with chronic hepatitis B. Ultrasound Q. 2019;35(2):147–152. doi:10.1097/RUQ.0000000000000399
21. Zhu Q, Wang W, Zhao J, et al. Transient elastography identifies the risk of esophageal varices and bleeding in patients with hepatitis B virus-related liver cirrhosis. Ultrasound Q. 2018;34(3):141–147. doi:10.1097/RUQ.0000000000000373
22. Zeng J, Liu GJ, Huang ZP, et al. Diagnostic accuracy of two-dimensional shear wave elastography for the non-invasive staging of hepatic fibrosis in chronic hepatitis B: a cohort study with internal validation. Eur Radiol. 2014;24(10):2572–2581. doi:10.1007/s00330-014-3292-9
23. Paul SB, Das P, Mahanta M, et al. Assessment of liver fibrosis in chronic hepatitis: comparison of shear wave elastography and transient elastography. Abdom Radiol. 2017;42(12):2864–2873. doi:10.1007/s00261-017-1213-5
24. Wang XK, Wang P, Zhang Y, Qi SL, Chi K, Wang GC. A study on spleen transient elastography in predicting the degree of esophageal varices and bleeding. Medicine (Baltimore). 2019;98(9):e14615. doi:10.1097/MD.0000000000014615
25. Yu JH, Lee JI. Current role of transient elastography in the management of chronic hepatitis B patients. Ultrasonography. 2017;36(2):86–94. doi:10.14366/usg.16023
26. Jiang W, Huang S, Teng H, et al. Diagnostic accuracy of point shear wave elastography and transient elastography for staging hepatic fibrosis in patients with non-alcoholic fatty liver disease: a meta-analysis. BMJ Open. 2018;8(8):e021787. doi:10.1136/bmjopen-2018-021787
27. Feng JC, Li J, Wu XW, Peng XY. Diagnostic accuracy of supersonic shear imaging for staging of liver fibrosis: a Meta-analysis. J Ultrasound Med. 2016;35(2):329–339. doi:10.7863/ultra.15.03032
28. Leung VY, Shen J, Wong VW, et al. Quantitative elastography of liver fibrosis and spleen stiffness in chronic hepatitis B carriers: comparison of shear-wave elastography and transient elastography with liver biopsy correlation. Radiology. 2013;269(3):910–918. doi:10.1148/radiol.13130128
29. Giuffrè M, Giuricin M, Bonazza D, et al. Optimization of point-shear wave elastography by skin-to-liver distance to assess liver fibrosis in patients undergoing bariatric surgery. Diagnostics (Basel, Switzerland). 2020;10(10).
30. Giuffrè M, Fouraki S, Comar M, Masutti F, Crocè LS. The importance of transaminases flare in liver elastography: characterization of the probability of liver fibrosis overestimation by hepatitis C virus-induced cytolysis. Microorganisms. 2020;8(3):348. doi:10.3390/microorganisms8030348
31. Barr RG, Ferraioli G, Palmeri ML, et al. Elastography assessment of liver fibrosis: society of radiologists in ultrasound consensus conference statement. Radiology. 2015;276(3):845–861. doi:10.1148/radiol.2015150619
32. Ferraioli G, Filice C, Castera L, et al. WFUMB guidelines and recommendations for clinical use of ultrasound elastography: part 3: liver. Ultrasound Med Biol. 2015;41(5):1161–1179. doi:10.1016/j.ultrasmedbio.2015.03.007
 © 2021 The Author(s). This work is published and licensed by Dove Medical Press Limited. The full terms of this license are available at https://www.dovepress.com/terms.php and incorporate the Creative Commons Attribution - Non Commercial (unported, v3.0) License.
By accessing the work you hereby accept the Terms. Non-commercial uses of the work are permitted without any further permission from Dove Medical Press Limited, provided the work is properly attributed. For permission for commercial use of this work, please see paragraphs 4.2 and 5 of our Terms.
© 2021 The Author(s). This work is published and licensed by Dove Medical Press Limited. The full terms of this license are available at https://www.dovepress.com/terms.php and incorporate the Creative Commons Attribution - Non Commercial (unported, v3.0) License.
By accessing the work you hereby accept the Terms. Non-commercial uses of the work are permitted without any further permission from Dove Medical Press Limited, provided the work is properly attributed. For permission for commercial use of this work, please see paragraphs 4.2 and 5 of our Terms.