")
Back to Journals » Clinical Ophthalmology » Volume 12
Comparison of two laboratory-based systems for evaluation of halos in intraocular lenses
Authors Carson D, Lee S, Alexander E, Wei X, Lee S
Received 21 September 2017
Accepted for publication 4 November 2017
Published 21 February 2018 Volume 2018:12 Pages 385—393
DOI https://doi.org/10.2147/OPTH.S152201
Checked for plagiarism Yes
Review by Single anonymous peer review
Peer reviewer comments 2
Editor who approved publication: Dr Scott Fraser
Daniel Carson,* Sangyeol Lee,* Elsinore Alexander, Xin Wei, Shinwook Lee
Alcon Research, Ltd., Fort Worth, TX, USA
*These authors contributed equally to this work
Purpose: Multifocal intraocular lenses (IOLs) can be associated with unwanted visual phenomena, including halos. Predicting potential for halos is desirable when designing new multifocal IOLs. Halo images from 6 IOL models were compared using the Optikos modulation transfer function bench system and a new high dynamic range (HDR) system.
Materials and methods: One monofocal, 1 extended depth of focus, and 4 multifocal IOLs were evaluated. An off-the-shelf optical bench was used to simulate a distant (>50 m) car headlight and record images. A custom HDR system was constructed using an imaging photometer to simulate headlight images and to measure quantitative halo luminance data. A metric was developed to characterize halo luminance properties. Clinical relevance was investigated by correlating halo measurements to visual outcomes questionnaire data.
Results: The Optikos system produced halo images useful for visual comparisons; however, measurements were relative and not quantitative. The HDR halo system provided objective and quantitative measurements used to create a metric from the area under the curve (AUC) of the logarithmic normalized halo profile. This proposed metric differentiated between IOL models, and linear regression analysis found strong correlations between AUC and subjective clinical ratings of halos.
Conclusion: The HDR system produced quantitative, preclinical metrics that correlated to patients’ subjective perception of halos.
Keywords: visual disturbance, high dynamic range, quantitative metric, multifocal IOL
Introduction
Implantation of an intraocular lens (IOL) after surgical cataract removal is the standard of care for treatment of cataract.1 The preferred approach comprises phacoemulsification for removal of the cataract, small incision surgery, and posterior implantation in the capsular bag using a foldable IOL.2 Favorable outcomes have been demonstrated consistently following cataract surgery.2 One large study from the UK found that 95% of eyes with no ocular copathology (N=29,083) achieved a visual acuity of 20/40 or better postoperatively, with 51% achieving 20/20 vision.3
Compared with standard monofocal IOLs, multifocal IOLs improve near and distance vision, and can reduce the need for eyeglasses after surgery.4,5 A recent meta-analysis that compared the effects of these 2 types of IOLs noted the benefits of multifocal IOLs; although distance visual acuity was similar with monofocal and multifocal IOLs, individuals who received multifocal IOLs had significantly better near vision and were less dependent on eyeglasses.4 However, multifocal IOLs are commonly associated with unwanted visual phenomena, most notably halos, which were reported in 97 of 334 cases (29%) with multifocal IOLs versus only 26 of 328 cases (8%) with monofocal IOLs across 7 studies.4 Such phenomena are associated with patient dissatisfaction6,7 and are frequent reasons for multifocal IOL explantation.8
Disconcerting halos around nighttime light sources can be simulated and tested in patients with IOLs. Approaches to such testing, however, have not been uniform, and they cannot be used to compare different IOL models quantitatively.9,10 Objective laboratory methods are needed for in vitro halo assessments that are reliable, reproducible, and clinically relevant. Here, we evaluate halo measurement in the laboratory using a previously described Optikos modulation transfer function (MTF) bench system (Optikos Corp, Wakefield, MA, USA)11,12 and a newly devised high dynamic range (HDR) system.
The Optikos MTF system has been used for halo simulation to compare halos from different IOL models. However, due to a limited dynamic range, the central image must be saturated to visualize halos, and the measurement is only relative. The new HDR system was designed to model the function of the human eye during nighttime driving conditions. In human vision, the range of illumination is divided into 3 regions that reflect photoreceptor functioning. The scotopic region is processed by rods, beginning at extremely low levels of illumination and ending at the rod saturation point.13 The photopic region is processed by cones, and it extends from the point of rod saturation to the highest level of illumination.13 The mesopic region is intermediary, wherein both rods and cones are active, and reflects the levels of illumination at which nighttime driving takes place. To generate meaningful data on relatively faint halos encountered during nighttime driving, HDR detection is essential. Drivers see a range of projected luminance from more than 20K candela per square meter (cd/m2) from an oncoming car to about 1–2 cd/m2 from road surfaces, for a range of approximately 4.5 log units.
Three visual performance-based mesopic models were referenced in the development of the HDR system, the Mesopic Optimization of Visual Efficiency (MOVE) model, the modified MOVE model, and the X-model.14 These models have mesopic luminous efficiency that are a blend of the photopic and scotopic functions.14 The result is a blended spectrum that is close to photopic, which was used in this study.
Materials and methods
Visualization techniques
Optikos MTF bench system
Simulated headlight imaging using the Optikos MTF bench system has been described previously.11 Pinhole images of various IOL models were measured using a model eye conforming to International Standards Organization (ISO) 11979-2, providing corneal convergence and spherical aberration (SA).11 The IOL was positioned within a fixture immersed in a cell with deionized water at room temperature.
A pinhole target was used to simulate car headlights at a distance of more than 50 m. A Dolan-Jenner DC-950 fiber light (Dolan-Jenner Industries, Boxborough, MA, USA) was used to illuminate the pinhole, providing a broadband spectrum similar to the photopic function of the retina. Images were taken with a 5-mm external pupil at the IOL surface, using white light. For the multifocal IOL models, the distance focus was used. The size of the center spot region was maintained equally for all models; this was accomplished by verifying the width of the saturated area using external software (Microsoft Paint; Microsoft Corporation, Redmond, WA, USA).
Because the intent of the study was to simulate halos seen around bright light sources, such as car headlights and streetlights at night, measurements were made only for the distance focus of the IOLs using large pupils. Near vision and other aspects of visual quality over a range of conditions were not addressed.
HDR system
The HDR system used a model WP-103 16-bit photometric camera (Westboro Photonics, Ottawa, ON, Canada), with a cooled 2.76 megapixel imager. Image acquisition and analyses were performed with Photometrica version 6.5 software (Westboro Photonics). A schematic diagram and image of the system are shown in Figure 1. As in the Optikos system, headlight viewing was simulated using a pinhole target illuminated by a broad-spectrum Dolan-Jenner DC-950H fiber light source (Dolan-Jenner Industries). An external pupil was used, with a diameter scaled to give a 4.5-mm diameter pupil at the IOL plane. IOLs in the Optikos and the HDR systems were tested in model eyes based on similar ISO standards; therefore, distance and near images were in the same relative positions for both systems.
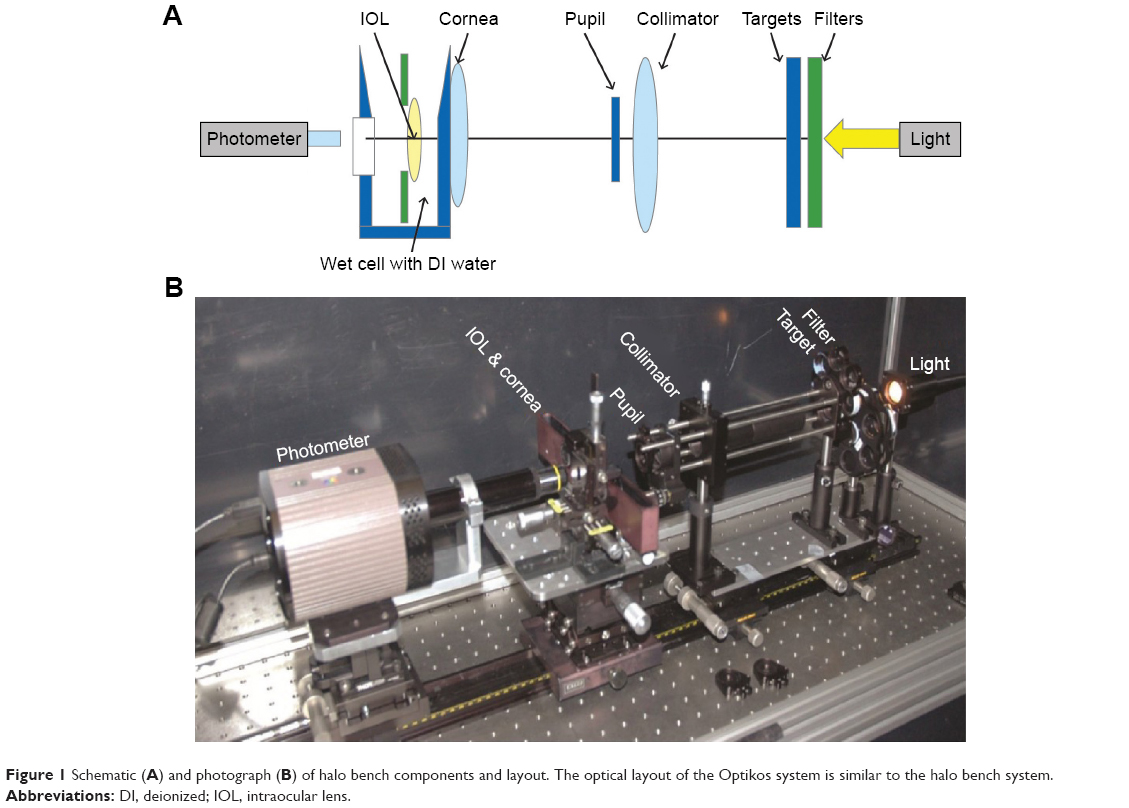 | Figure 1 Schematic (A) and photograph (B) of halo bench components and layout. The optical layout of the Optikos system is similar to the halo bench system. |
The full-range output of the HDR system contrasts with the more limited 8-bit data of the Optikos bench system. Figure 2 shows the cross-sections through pinhole images from both systems. The Optikos system data show the saturation of the center of the Optikos pinhole image necessary to make the fainter halo visible (Figure 2A), so that the relative intensity of the halo compared with the central image could not be objectively measured. This was not an issue for the HDR system because of its full dynamic range, which allows quantitative measurement of halo intensity (Figure 2B).
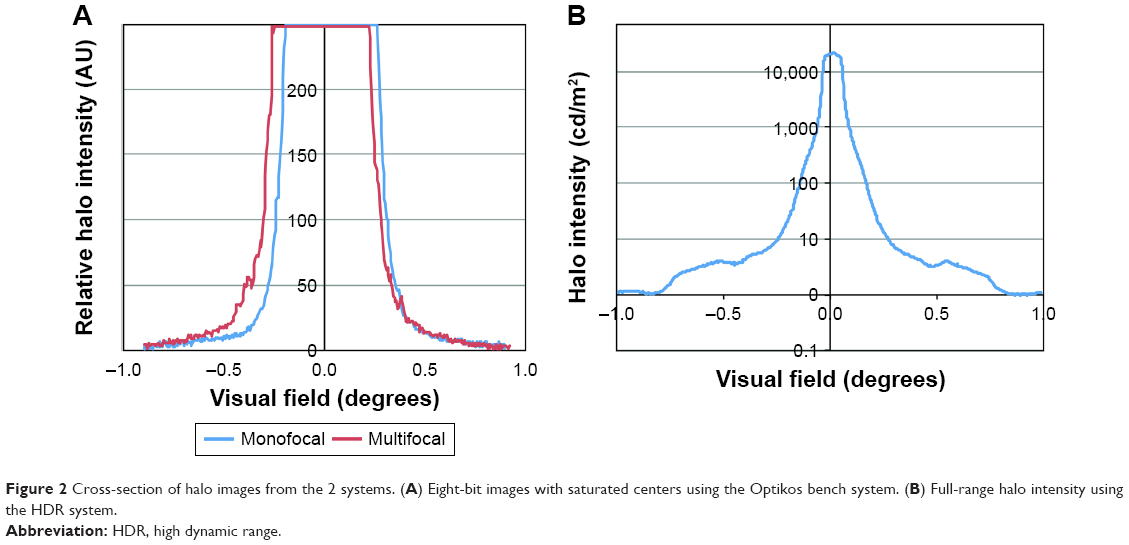 | Figure 2 Cross-section of halo images from the 2 systems. (A) Eight-bit images with saturated centers using the Optikos bench system. (B) Full-range halo intensity using the HDR system. |
Intraocular lenses
The Optikos MTF bench system compared halo images from 4 IOL models, all with a dioptric power of 21.0 D. The tested IOLs were AcrySof models from Alcon Laboratories, Inc. (Fort Worth, TX, USA): the IQ monofocal IOL (model SN60WF),15 the IQ ReSTOR multifocal +3.0 D IOL (model SN6AD1),16 the IQ ReSTOR +2.5 D multifocal IOL (model SV25T0),17 and the IQ ReSTOR +4.0 D IOL (model SN6AD3).16
Six IOLs were tested using the HDR system: 4 AcrySof models from Alcon Laboratories, Inc. and 2 models from Abbott Medical Optics (Santa Anna, CA, USA). The Alcon IOLs included the IQ monofocal IOL with 21.0 D base power (model SN60WF)15 and 3 IQ ReSTOR multifocal models, the +2.5 D IOL with 21.0 D base power (model SV25T0),17 the +3.0 D IOL with 21.0 D base power (model SN6AD1),16 and the +4.0 D IOL with 24.0 D base power (model SN60D3).
The availability of samples of the SA60D3 +4.0 D IOL was limited because the model is obsolete; however, it was desired to include this model because it was studied clinically. The SN60D3 sample that was used in this study had two characteristics that needed to be accounted for. First, the power of the sample in this study is 24.0 D, rather than 21.0 D as the other samples were. The focal length of the model eye with a 24.0 D IOL is about 5% less than with a 21.0 D IOL resulting in a small change in system magnification. To make halo images from the 24.0 D IOL comparable in size to images from the 21.0 D IOLs, the diameter of the 24.0 D IOL images was scaled by the ratio of the focal lengths of the model eye with the 2 powers. Second, the clinically studied ReSTOR +4.0 D add power model SA60D3 was made from colorless AcrySof material, whereas the SN60D3 model was made of AcrySof material containing yellow chromophore. Accounting for the spectrum of the light used, the only difference in transmission between the 2 models occurred for wavelengths from 400 to 500 nm, where the SA60D3 transmitted an average of 2% more light than the SN60D3, which was expected to have a minimal effect on halo intensity.
The Abbott models included the Symfony extended depth of focus IOL (model ZXR00) and the Tecnis Multifocal with +2.75 D add power (ZKB00), both with 21.0 D base powers. The Abbott IOLs were not tested on the Optikos system because of the differences between apodized and non-apodized multifocal designs. The fainter halos of the apodized multifocal IOLs were difficult to visualize under the same test conditions as the non-apodized models using only 8 bits of image depth.
Halo metrics for the HDR system images
The area under the curve (AUC) of the halo profile was used for quantitative comparison of the halo from the tested IOL models. Profile curves were created from the average of 8 radii for each halo image. The luminance profile data (L) were first normalized, followed by log-conversion (LogNorm), described as
|

for all n data points (Li) in each curve. The LogNorm representation normalizes the central peak luminance values for each image to 1, so that the differences in peak luminance are eliminated and the differences in the peripheral halo region, where objectionable photic phenomena are reported, are emphasized. Normalization also accounts for the higher intensity of the 24.0 D SA60D3 IOL compared to the 21.0 D IOLs.
The AUC was calculated by integrating under the logarithmic normalized halo profile, mathematically represented by
|
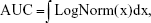
where x was the angular field of view (degrees). Lower AUC values indicated less halo effects. Statistical system verification was successfully performed by means of a gage reliability and reproducibility (r&R) study, in which operators performed a series of measurements on multiple samples of the 4 Alcon IOL models.
Subjective clinical assessment of halo severity
Severity of halos associated with the 4 Alcon IOLs tested using the HDR system was correlated with subjective patient assessments collected via a proprietary questionnaire used in 3 Alcon-sponsored clinical studies conducted over an 18-month period.18 The number of patients taking the assessment ranged from 139 to 188 for each IOL type, with mean patient age ranging from 67.0 to 69.4 years. Reference photographs of halos were provided in the patient-administered, 21-item questionnaire that evaluated the severity of 10 visual phenomena associated with IOLs. Respondents completed the questionnaire based on a 1-week recall period. Halo severity was rated on a 4-item scale, ranging from “none” to “severe.” The bench-measured AUC of each IOL model was compared with the subjective halo severity using a statistical regression analysis.
Results
Optikos MTF bench system images
Optikos comparative images are shown in Figure 3. For each IOL, the halo intensity is proportional to the amount of light energy in the out-of-focus near image. The monofocal IOL (model SN60WF) had the least amount of halo (Figure 3A). This is because all of the light energy, by design, goes to distance focus. The diffractive multifocal ReSTOR +2.5 D had less halo than the ReSTOR +3.0 D or ReSTOR +4.0 D IOL because it is designed with more energy directed to the distance focus (Figure 3B–D). The method allowed for a relative comparison of halo performance between models, but saturation of the center ruled out an objective analysis of halo intensity.
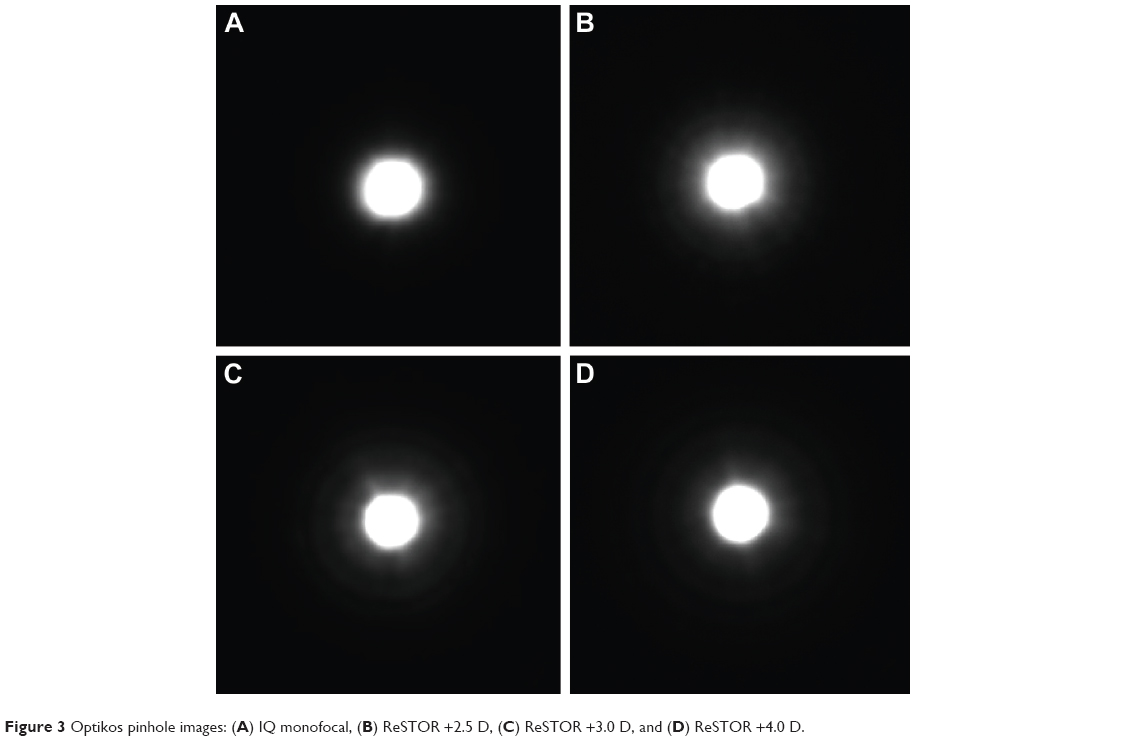 | Figure 3 Optikos pinhole images: (A) IQ monofocal, (B) ReSTOR +2.5 D, (C) ReSTOR +3.0 D, and (D) ReSTOR +4.0 D. |
HDR system images
The measured AUC values for the tested IOL models are provided in Table 1. The monofocal IQ IOL had the lowest AUC of the models measured, followed by ReSTOR +2.5 D and ReSTOR +3.0 D, ReSTOR +4.0 D, Symfony, and Tecnis Multifocal +2.75 D (Figures 4 and 5). As in the Optikos image data, the halo was greater for IOL models with more energy in the out-of-focus near image, as expected. Images in Figure 5 are shown in logarithmic scale, which is similar to human perception.19 These halo images consist of a central focused image of the pinhole and surrounding halo. The focused spot images for all IOL models were similar, which supports the method of making the saturated areas the same diameter on the Optikos bench. Halo size increased with increasing add power, due to increased defocus of the near images.
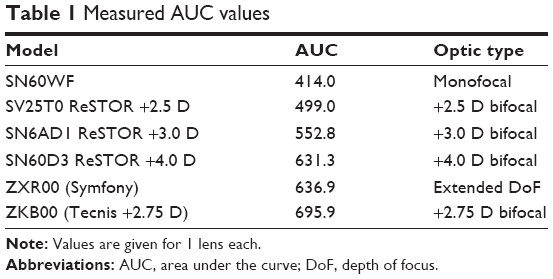 | Table 1 Measured AUC values |
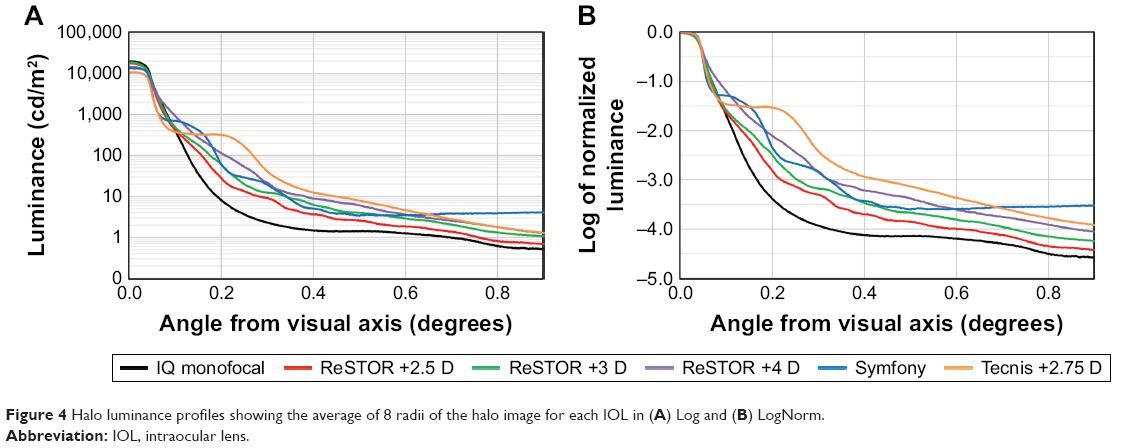 | Figure 4 Halo luminance profiles showing the average of 8 radii of the halo image for each IOL in (A) Log and (B) LogNorm. |
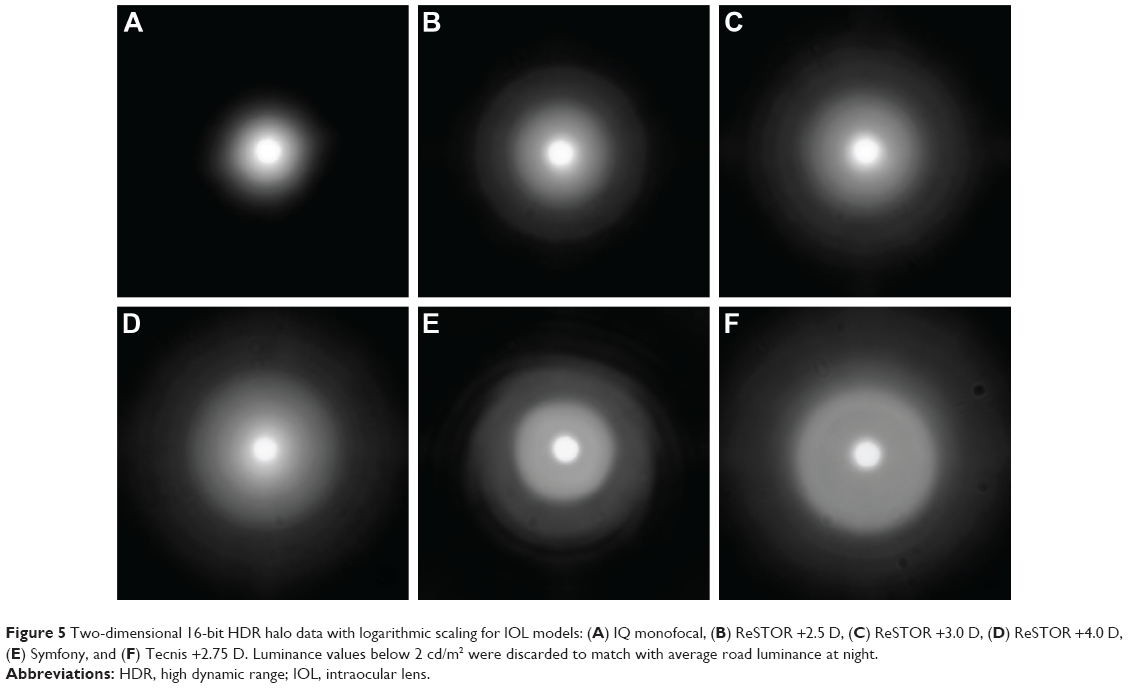 | Figure 5 Two-dimensional 16-bit HDR halo data with logarithmic scaling for IOL models: (A) IQ monofocal, (B) ReSTOR +2.5 D, (C) ReSTOR +3.0 D, (D) ReSTOR +4.0 D, (E) Symfony, and (F) Tecnis +2.75 D. Luminance values below 2 cd/m2 were discarded to match with average road luminance at night. |
Figure 4A shows the average radial luminance curve of each halo image, with the vertical axis in cd/m2. The dynamic range of the measurement was more than 4 log units, and the field of view was more than 0.9° from the visual axis. The peak luminance of measurements was more than 20,000 cd/m2, which is near the maximum of luminous intensities encountered in night driving.20 The minimum measured luminance was below 2 cd/m2, which is the background average nighttime road surface luminance.21 Therefore, the data from the HDR system had enough dynamic range for a realistic simulation of night driving conditions.
Figure 4B shows the same data with the LogNorm representation. Area under the LogNorm curve was used as the metric in the r&R analysis. In the expanded r&R analyses,22 intra-observer variations became smaller relative to model-to-model variations. Therefore, the precision of measurements was sufficient for differentiating the AUC from different IOL models.
Correlation of HDR images to subjective clinical data
In Figure 6, 1 value of laboratory-measured AUC (from Table 1) was plotted against 4 levels of halo severity reported clinically (Table 2) for each IOL type. Halo severity was subjectively rated by patients as none, mild, moderate, or severe. Linear regression analysis demonstrated strong correlations between increasing AUC values and increasing reports of halo (or decreasing reports of no halos) at each level of severity (Figure 6). The absolute values of r (Pearson’s correlation coefficient) were high for all regression lines, ranging from 0.93 for “severe” halos to 0.98 for “mild” halos. Note that the category “none” in Table 2 corresponds to the amount of 100% minus the fully accumulated halo response of “mild + moderate + severe” for each IOL type. The linear regression model, therefore, has the potential to serve as a reference formula, so that the AUC of any IOL determined with the HDR system could be used to predict the clinical response.
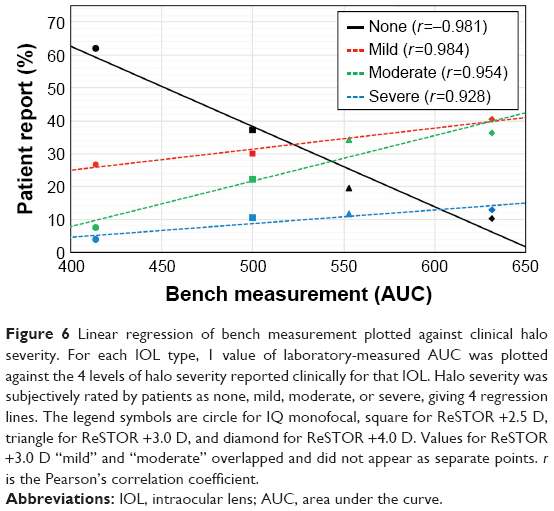 | Figure 6 Linear regression of bench measurement plotted against clinical halo severity. For each IOL type, 1 value of laboratory-measured AUC was plotted against the 4 levels of halo severity reported clinically for that IOL. Halo severity was subjectively rated by patients as none, mild, moderate, or severe, giving 4 regression lines. The legend symbols are circle for IQ monofocal, square for ReSTOR +2.5 D, triangle for ReSTOR +3.0 D, and diamond for ReSTOR +4.0 D. Values for ReSTOR +3.0 D “mild” and “moderate” overlapped and did not appear as separate points. r is the Pearson’s correlation coefficient. |
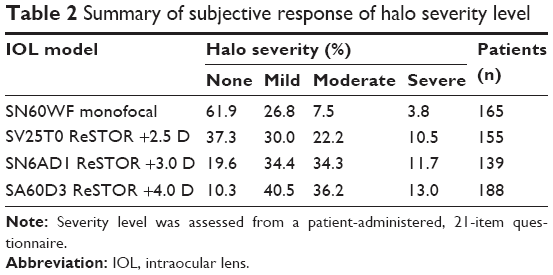 | Table 2 Summary of subjective response of halo severity level |
Discussion
Halo images
Two laboratory-based halo measurement systems have been proposed; one is an MTF bench-based system, and the other is an HDR image photometer-based system. The halo images from the Optikos MTF bench system are good for illustrative purposes, and the images showed rings similar to those that have previously been published.11,12 Although this system is relatively easy to set up, being based on an off-the-shelf system, only 8-bit images can be captured. Therefore, the central-focused spot in the image must be saturated to bring the halo to a measurable level, and the luminous intensity of the halo relative to the focused image cannot be quantified. However, 1 monofocal and 3 multifocal IOLs demonstrated a good relative comparison of halo intensity, reflecting the differences in their designs.
The HDR system was constructed to simulate the dynamic range of human photoreceptors. The measurement represents night driving conditions in terms of peak luminance and background luminance. Unlike the Optikos MTF bench system, the HDR system can image halos without saturating the center of a pinhole image while maintaining measurable halo intensity. The HDR system was able to readily differentiate between IOL models and provided reasonable measurements of halos that agree with expectations from the different IOL designs and with other laboratory studies.23,24 The system enables quantitative measurements of detailed halo signatures with respect to the full range of luminance and field of view. The HDR images, however, did not show rings in the halo images as clearly as the Optikos system (Figures 3 and 5).25
Relative measured halo size and intensity for the different IOL models were in accordance with their designs. Alcon ReSTOR IOLs are designed with more energy in the distance focus than the near, especially at large pupils. Therefore at distance focus with a large pupil, the ReSTOR halos would be fainter and smaller than other multifocal IOLs.
Correlation of measured halo intensity to clinically reported halos
Clinical subjective questionnaire data indicated that halo severity was rated by patients as being lowest with the monofocal IOL, followed by the multifocal IOLs ReSTOR +2.5 D, ReSTOR +3.0 D, and ReSTOR +4.0 D (Table 2). The halo metric, comprising LogNorm conversion of the radial luminance profile followed by AUC calculation, was correlated with subjective clinical reports of halo severity in a linear model, with high goodness-of-fit for the measured samples. This result suggests that laboratory-based measurements could be used to estimate clinical assessment of halo severity.
Clinical reports for halos are available for Tecnis Multifocal and Symfony,26 but these are not plotted in Figure 6 because of differences in test methodology. However, in the Abbott clinical studies the incidence of halos for monofocal IOLs and the increase in halos for multifocal IOLs were similar to the findings of the Alcon studies.
Study limitations
This study was limited in only simulating the size and intensity of halos around intense point sources with large pupils at the distance foci of the IOLs. Image quality in other visual situations was not addressed. The clinical reports of halo severity did not include reports of visual impairment, and halo frequency was not compared to bench measurements. Simulation of glare sources and their effects on visual function is a possible subject for further research.
Conclusion
This study presents 2 different halo measurement systems. The MTF bench-based system was easy to set up and was useful for comparing relative halo images. To make halos visible with this system, saturation of the pinhole images was required. The new HDR system provided a robust system for quantitatively measuring halos associated with various IOL models and their intensity relative to a bright, focused image. Our results suggest that the estimated values are clinically relevant, and therefore provide a means to estimate patients’ response to halo severity. Such information is valuable for IOL development before the clinical testing phase.
Acknowledgments
This study was sponsored by Alcon Research, Ltd. (Fort Worth, TX, USA). Medical writing assistance was provided by Natalia Zhukovskaya, PhD, of Complete Healthcare Communications, LLC, West Chester, PA, and was funded by Alcon.
Disclosure
Daniel Carson, Sangyeol Lee, Xin Wei, and Shinwook Lee are employees of Alcon. Elsinore Alexander was an employee of Alcon at the time of the study. The authors report no other conflicts of interest in this work.
References
Lundstrom M, Barry P, Henry Y, Rosen P, Stenevi U. Evidence-based guidelines for cataract surgery: guidelines based on data in the European Registry of Quality Outcomes for Cataract and Refractive Surgery database. J Cataract Refract Surg. 2012;38(6):1086–1093. | ||
Olson RJ, Braga-Mele R, Chen SH, et al. Cataract in the adult eye preferred practice pattern®. Ophthalmology. 2017;124(2):P1–P119. | ||
Jaycock P, Johnston RL, Taylor H, et al; UK EPR User Group. The Cataract National Dataset electronic multi-centre audit of 55,567 operations: updating benchmark standards of care in the United Kingdom and internationally. Eye (Lond). 2009;23(1):38–49. | ||
de Silva SR, Evans JR, Kirthi V, Ziaei M, Leyland M. Multifocal versus monofocal intraocular lenses after cataract extraction. Cochrane Database Syst Rev. 2016;(12):CD003169. | ||
Calladine D, Evans JR, Shah S, Leyland M. Multifocal versus monofocal intraocular lenses after cataract extraction. Cochrane Database Syst Rev. 2012;(9):CD003169. | ||
Woodward MA, Randleman JB, Stulting RD. Dissatisfaction after multifocal intraocular lens implantation. J Cataract Refract Surg. 2009;35(6):992–997. | ||
Javitt JC, Steinert RF. Cataract extraction with multifocal intraocular lens implantation: a multinational clinical trial evaluating clinical, functional, and quality-of-life outcomes. Ophthalmology. 2000;107(11):2040–2048. | ||
Kamiya K, Hayashi K, Shimizu K, Negishi K, Sato M, Bissen-Miyajima H; Survey Working Group of the Japanese Society of Cataract and Refractive Surgery. Multifocal intraocular lens explantation: a case series of 50 eyes. Am J Ophthalmol. 2014;158(2):215–220.e1. | ||
Hunkeler JD, Coffman TM, Paugh J, Lang A, Smith P, Tarantino N. Characterization of visual phenomena with the Array multifocal intraocular lens. J Cataract Refract Surg. 2002;28(7):1195–1204. | ||
Pieh S, Lackner B, Hanselmayer G, et al. Halo size under distance and near conditions in refractive multifocal intraocular lenses. Br J Ophthalmol. 2001;85(7):816–821. | ||
Carson D, Hill WE, Hong X, Karakelle M. Optical bench performance of AcrySof® IQ ReSTOR®, AT LISA® tri, and FineVision® intraocular lenses. Clin Ophthalmol. 2014;8:2105–2113. | ||
Carson D, Xu Z, Alexander E, Choi M, Zhao Z, Hong X. Optical bench performance of 3 trifocal intraocular lenses. J Cataract Refract Surg. 2016;42(9):1361–1367. | ||
Stockman A, Sharpe LT. Into the twilight zone: the complexities of mesopic vision and luminous efficiency. Ophthalmic Physiol Opt. 2006;26(3):225–239. | ||
Viikari M, Ekrias A, Eloholma M, Halonen L. Modeling spectral sensitivity at low light levels based on mesopic visual performance. Clin Ophthalmol. 2008;2(1):173–185. | ||
Alcon Research, Inc. AcrySof IQ product information. Available from: https://www.myalcon.com/products/surgical/acrysof-iq-iol/monofocal-iol-specifications.shtml. Accessed March 17, 2017. | ||
Alcon Research, Inc. AcrySof IQ ReSTOR product information. Available from: www.alconsurgical.jp/pdfs/RES928.pdf. Accessed November 21, 2016. | ||
Alcon Research, Inc. AcrySof IQ ReSTOR. Available from: http://www.accessdata.fda.gov/cdrh_docs/pdf4/P040020S050d.pdf. Accessed March 22, 2017. | ||
Maxwell A, Holland E, Cibik L, et al. Clinical and patient-reported outcomes of bilateral implantation of a +2.5 diopter multifocal intraocular lens. J Cataract Refract Surg. 2017;43(1):29–41. | ||
Kimpe T, Tuytschaever T. Increasing the number of gray shades in medical display systems – how much is enough? J Digit Imaging. 2007;20(4):422–432. | ||
Hwang AD, Peli E. Development of a headlight glare simulator for a driving simulator. Transp Res C Emerg Technol. 2013;32:129–143. | ||
Eloholma M, Ketomaki J, Halonen L, et al. New model for mesopic photometry applicable for night-time driving conditions. Presented at: Proceedings of the International Symposium of Automotive Lighting ISAL2005; September 27–28, 2005; Darmstadt, Germany. | ||
Durivage MA. Practical Attribute and Variable Measurement Systems Analysis (MSA): A Guide for Conducting Gage R&R Studies and Test Method Validations. Milwaukee, WI: ASQ Quality Press; 2015. | ||
Choi J, Schwiegerling J. Optical performance measurement and night driving simulation of ReSTOR, ReZoom, and Tecnis multifocal intraocular lenses in a model eye. J Refract Surg. 2008;24(3):218–222. | ||
Gatinel D, Loicq J. Clinically relevant optical properties of bifocal, trifocal, and extended depth of focus intraocular lenses. J Refract Surg. 2016;32(4):273–280. | ||
Chang DF, editor. Matering Refractive IOLs: The Art and Science. Thorofare, NJ: SLACK Inc.; 2008. | ||
P980040/S065 FDA summary of safety and effectivness data: Tecnis® Symfony extended range of vision IOLs. Available from: https://www.accessdata.fda.gov/scripts/cdrh/cfdocs/cfPMA/pma.cfm?id=P980040S065. Accessed October 18, 2017. |
 © 2018 The Author(s). This work is published and licensed by Dove Medical Press Limited. The full terms of this license are available at https://www.dovepress.com/terms.php and incorporate the Creative Commons Attribution - Non Commercial (unported, v3.0) License.
By accessing the work you hereby accept the Terms. Non-commercial uses of the work are permitted without any further permission from Dove Medical Press Limited, provided the work is properly attributed. For permission for commercial use of this work, please see paragraphs 4.2 and 5 of our Terms.
© 2018 The Author(s). This work is published and licensed by Dove Medical Press Limited. The full terms of this license are available at https://www.dovepress.com/terms.php and incorporate the Creative Commons Attribution - Non Commercial (unported, v3.0) License.
By accessing the work you hereby accept the Terms. Non-commercial uses of the work are permitted without any further permission from Dove Medical Press Limited, provided the work is properly attributed. For permission for commercial use of this work, please see paragraphs 4.2 and 5 of our Terms.