")
Back to Journals » Journal of Pain Research » Volume 14
Comparison of the Psychometric Properties of the FLACC Scale, the MBPS and the Observer Applied Visual Analogue Scale Used to Assess Procedural Pain
Authors Crellin DJ , Harrison D , Santamaria N , Babl FE
Received 13 October 2020
Accepted for publication 4 February 2021
Published 31 March 2021 Volume 2021:14 Pages 881—892
DOI https://doi.org/10.2147/JPR.S267839
Checked for plagiarism Yes
Review by Single anonymous peer review
Peer reviewer comments 2
Editor who approved publication: Dr Michael A Ueberall
Dianne Crellin,1– 3 Denise Harrison,1,2,4 Nick Santamaria,1 Franz E Babl2,3,5
1Department of Nursing, The University of Melbourne, Melbourne, VIC, Australia; 2Murdoch Children’s Research Institute, Melbourne, VIC, Australia; 3Royal Children’s Hospital, Melbourne, VIC, Australia; 4Children’s Hospital of Eastern Ontario and University of Ottawa, Ottawa, ON, Canada; 5Department of Paediatrics, The University of Melbourne, Melbourne, VIC, Australia
Correspondence: Dianne Crellin
c/o Emergency Department, Royal Children’s Hospital, Flemington Road Parkville, Melbourne, VIC, 3052, Australia
Tel +61 39345 5331
Fax +61 9345 5983
Email [email protected]
Purpose: The purpose of this study was to compare the psychometric data and feasibility and clinical utility of the Face Legs, Activity, Cry and Consolability scale (FLACC), the Modified Behavioral Pain Scale (MBPS) and the Visual Analogue Scale for observers (VASobs) used to assess procedural pain in infants and young children.
Patients and Methods: Twenty-six clinicians assessed videorecorded segments of 100 infants and young children who underwent a painful and/or distressing procedure in the emergency department using the FLACC scale, the MBPS and the VASobs pain and VASobs distress.
Results: VASobs pain scores were lowest across all procedures and phases of procedures (p < 0.001). Inter-rater reliability was lowest for VASobs pain scores (ICC 0.55). Sensitivity and specificity were highest for FLACC scores (94.9% and 72.5%, respectively) at the lowest cut-off score (pain score two). Observers changed their MBPS scores more often than they changed FLACC or VASobs scores, but FLACC scores were more often incomplete. Reviewers did not consider any scale of use for procedural pain measurement.
Conclusion: The reliability and sensitivity of the FLACC and MBPS were supported by study data but concerns about the capacity of these scales to distinguish between pain- and non-pain-related distress were raised. The VASobs cannot be recommended. Despite its limitations, the FLACC scale may be better suited than other scales for procedural pain measurement.
Keywords: pain measurement, infants, validity, reliability
Introduction
Pain assessment informs decisions about treatment and measurement of pain intensity is a frequent outcome measure in trials evaluating methods designed to reduce pain. Pain assessment is ideally achieved using self-report and will include measurement of pain intensity using a numeric scale. For those unable to self-report pain intensity, such as infants and young children, the most widely used alternative is an observational pain scale. Over 60 tools designed for infants and children have been reported in the literature.1 However, despite how often infants and young children experience painful procedures associated with their healthcare few of the scales used are supported by sufficient data to support their use for procedural pain measurement and fewer still were designed for this purpose.2,3
The Modified Behavioral Pain Scale (MBPS) was developed to account for the variability in infant responses to procedural pain and at a time when few scales were available.4 Until recently, data have not been available to support the validity of MBPS scores in circumstances other than immunization of infants and young children.5 For this reason, the MBPS is rarely referenced in practice recommendations. In contrast, the Face, Legs, Activity Cry and Consolability scale (FLACC) scale, which was originally developed as a tool to assess postoperative pain in children aged two months to seven years,6 is one of the most well-known and widely recommended pain measurement scales.5,7–9 These recommendations support its use for procedural pain measurement despite limited data supporting the validity of the FLACC scale used to assess procedural pain.2 Finally, the Visual Analogue Scale applied by an observer (VASobs), a unidimensional scale based on the VAS used for self-report of pain, has been extensively used to assess procedural pain in infants and young children, particularly for research purposes. This is despite data that suggests that the scale may be unsuitable for this purpose.10
In our recent psychometric evaluation study, the FLACC scale and the MBPS were applied reliably by clinicians to assess pain associated with procedures frequently experienced by infants and young children aged between six months and three and half years during an emergency department presentation.11,12 The sensitivity of both scales was demonstrated but none were shown to be highly specific for procedural pain. Furthermore, there were circumstantial factors, such as restraint that interfered with the feasibility of applying the FLACC and the MBPS. These results have been previously published in detail elsewhere.11,12
The data reported here are derived from our psychometric evaluation study and the aim was to compare the performance of the FLACC scale, the MBPS and the VASobs pain and VASobs distress used to assess procedural pain in infants and young children. Specifically, we compare the reliability and validity of the score, the feasibility of application of these scales during a procedure and the extent to which these scores are likely to impact on clinical decision-making (clinical utility) of these scores. These scales were the focus of our original study following an extensive literature review to identify pain scales designed for procedural use, evaluated for this use and supported by data or scales widely recommended for procedural use by experts. As very few studies evaluate scales for procedural use and available data highlights various limitations to the scales tested, clinicians and researchers are likely to find a selection of the scale best suited for use difficult. We aim to provide recommendations regarding scale selection for procedural use.
Patients and Methods
We compared the psychometric performance and feasibility and clinical utility of the FLACC scale, the MBPS and the VASobs pain and VASobs distress using data from our earlier study where 26 clinicians assessed the procedural pain from video recordings of 100 infants and young children. A summary of the method is provided here but the protocol is published in full elsewhere.13 The principles of the Consensus-based Standards for the Selection of Health Measurement Instruments (COSMIN) Checklist14 informed the protocol. The original protocol complied with the Declaration of Helsinki, written informed consent was obtained from all participants (parent/guardian and clinicians) and the study was approved by the hospital ethics committee (Human Research Ethics Committee, Royal Children’s Hospital Melbourne HREC 35220B).
Children aged between six to 42 months who underwent a procedure during their presentation to the emergency department of a tertiary paediatric hospital were recruited for this study. The final sample was comprised of 100 videorecorded procedures of 60 children undergoing a painful procedure (30 intravenous catheter (IVC) and 30 nasogastric tube (NGT) insertions) and 40 children undergoing a non-painful procedure (20 inhaled medication administrations and 20 oxygen saturation (SpO2) measurements). Procedures presumed painful and non-painful were included to determine the sensitivity and specificity of the scales.
A requirement for immediate treatment, a history of cognitive delay, altered conscious state or significant co-morbid disease or a non-English speaking parent/caregiver excluded the child from this study. In addition, the child was excluded if the video-recording was not complete or the view of the child was inadequate for use of the scale, eg the child’s face could not be seen well enough to assess their expression.
Data were collected during the ED presentation which included demographics, clinical details, and a videorecording of the procedure, which was achieved using a hand-held video recorder. The videorecording was started prior to the clinician touching the child and ended once the procedure was over. The aim was to capture the child’s face and body to allow for pain measurement with the selected scales. The study protocol did not make any stipulations regarding clinical decisions which were all made by the treating team.
The video-recordings of the procedures were divided into phases that were considered likely to evoke varying levels of pain and/or distress; baseline (before handling), preparation (tactile but non-painful stimulus) and procedure (procedural stimulus) and saved in 15 second segments. Baseline and preparation phases were indistinguishable in non-painful procedures so only baseline and procedural phases were used. Each segment was 15 seconds long and the final set included 260 segments of video for review.
A unique set of video segments was created for each assessor (total 26) using a Stata Statistical Software15 script to automate allocation. Several rules were applied so that; all segments were reviewed by four reviewers, but different combinations of reviewers reviewed each segment, and reviewers assessed segments for all procedures and phases but not more than one segment for the same child. The order in which reviewers used the scales to assess the segment was randomly allocated with only one rule applied so that each scale was applied first on equal numbers of occasions. A random sequence generator was used to sequence the scales (https://www.random.org/sequences/).
The reviewers used a purposefully designed computer interface to view the video and record their scores. To replicate clinical assessment reviewers were required to enter a score after watching the video segment only once, during which they were unable to stop or review the recording. Reviewers were then asked to enter their final pain intensity score using the same scale. They were able to replay the video recording before recording their final score. The reviewer then entered pain scores for the segment using the other scales. Following the assessments, the reviewers were asked to complete a feasibility and utility questionnaire. Reviewers repeated pain measurements at least four weeks later for the same segments of the video. On this occasion, they only used the first scale originally used to assess this segment.
Instruments
FLACC Scale
The Face, Legs, Activity, Cry and Consolability (FLACC) scale is an observational scale comprised five behavioural indicators that are scored from zero to two. The pain score is the sum of the item scores and ranges from zero to 10.6 Reviewers were given the original instructions for the application of the scale to guide their assessment.
MBPS
The MBPS uses three behaviours (“face”, “movement”, and “cry”) each of which is scored to provide a pain score ranging from zero to 10. Approaches to the application of the MBPS vary so reviewers were provided with the original authors' recommendations.4
Visual Analogue Scale Observer (Pain) and (Distress)
The VASobs pain and the VASobs distress scales used were 10 cm unmarked lines labelled at one end with “no pain” for the VASobs pain scale or “no distress” for the VASobs distress scale and the number zero and at the other end “worst possible pain” for the VASobs pain scale or “worst possible distress” for the VASobs distress scale and the number 10.16 Reviewers were asked to place a mark on the line to represent their estimate of the pain or distress experienced by the child. The distance from the end labelled zero and the mark on the line is the pain score.
Feasibility and Utility Questionnaire
A previously developed questionnaire, comprised of nine statements, was used to assess the feasibility and utility of the scale (Table 2).17 Reviewers rated the extent of their agreement with these statements using a five-point Likert scale.
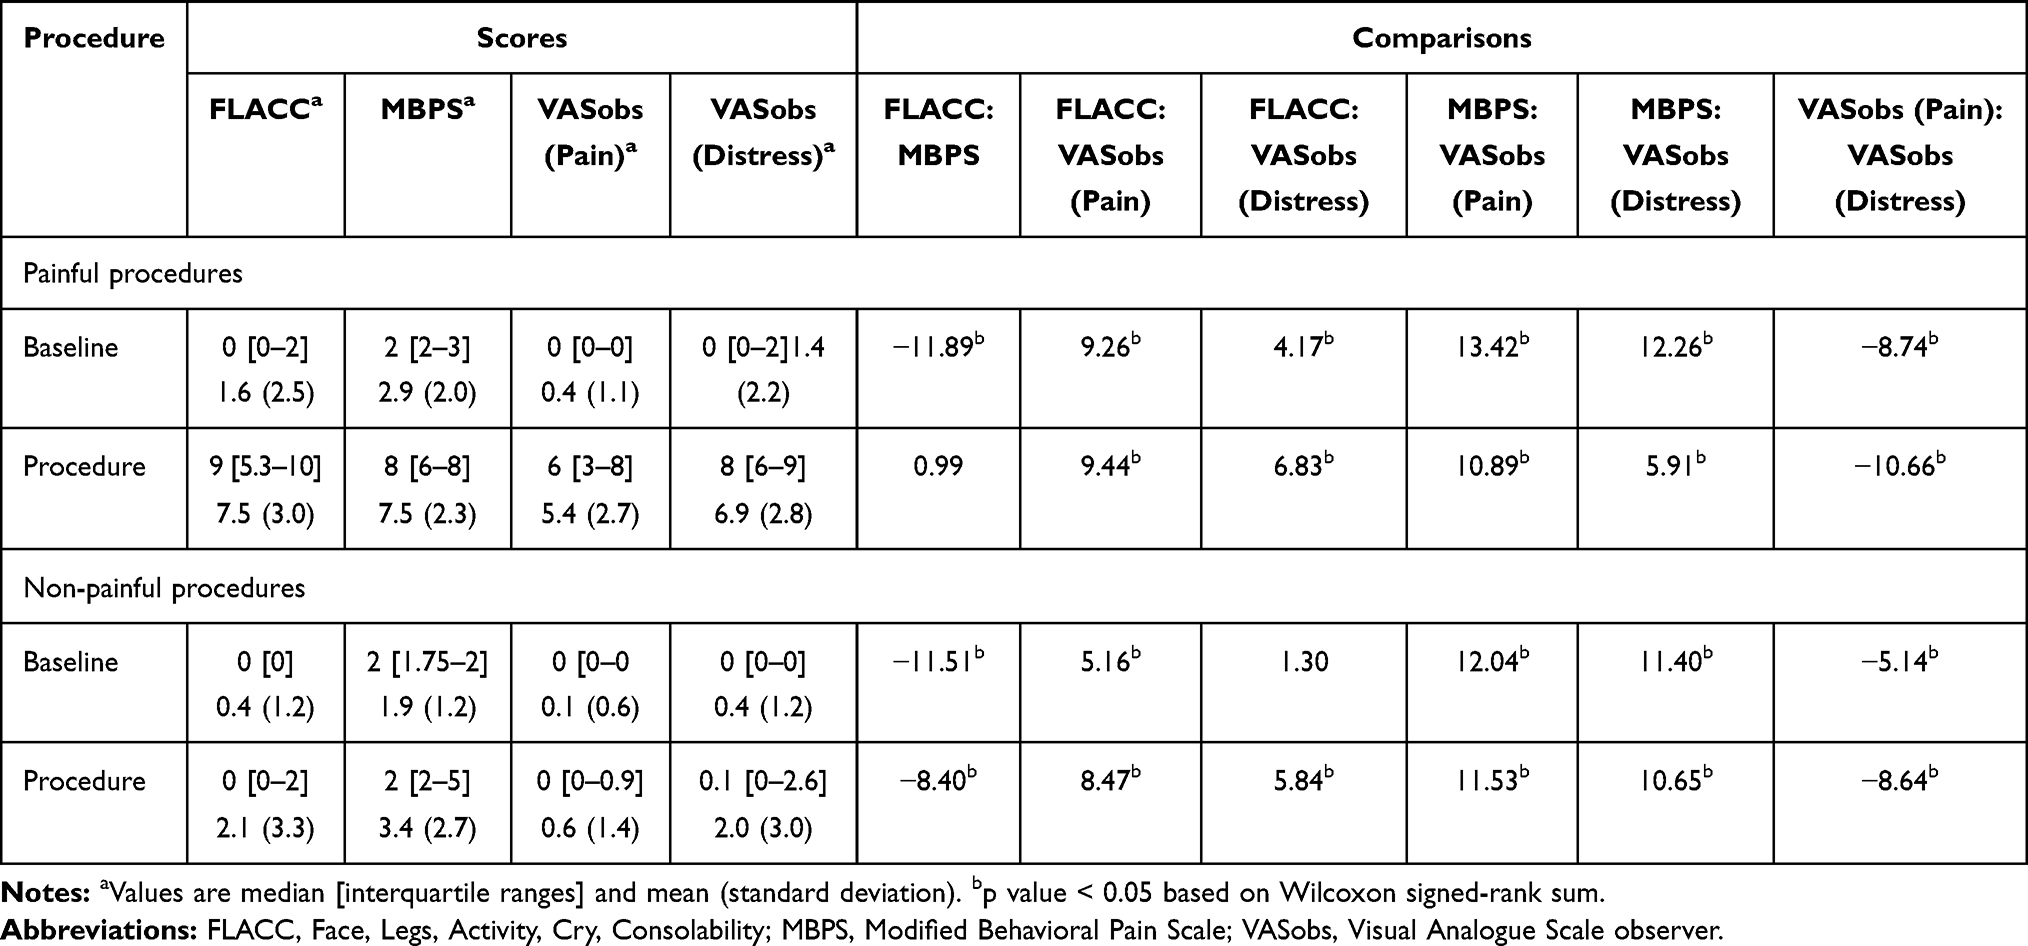 |
Table 1 Comparison of FLACC, MBPS Scores, VASobs Pain and VASobs Distress for Baseline and Procedural Phases of Painful and Non-Painful Procedures |
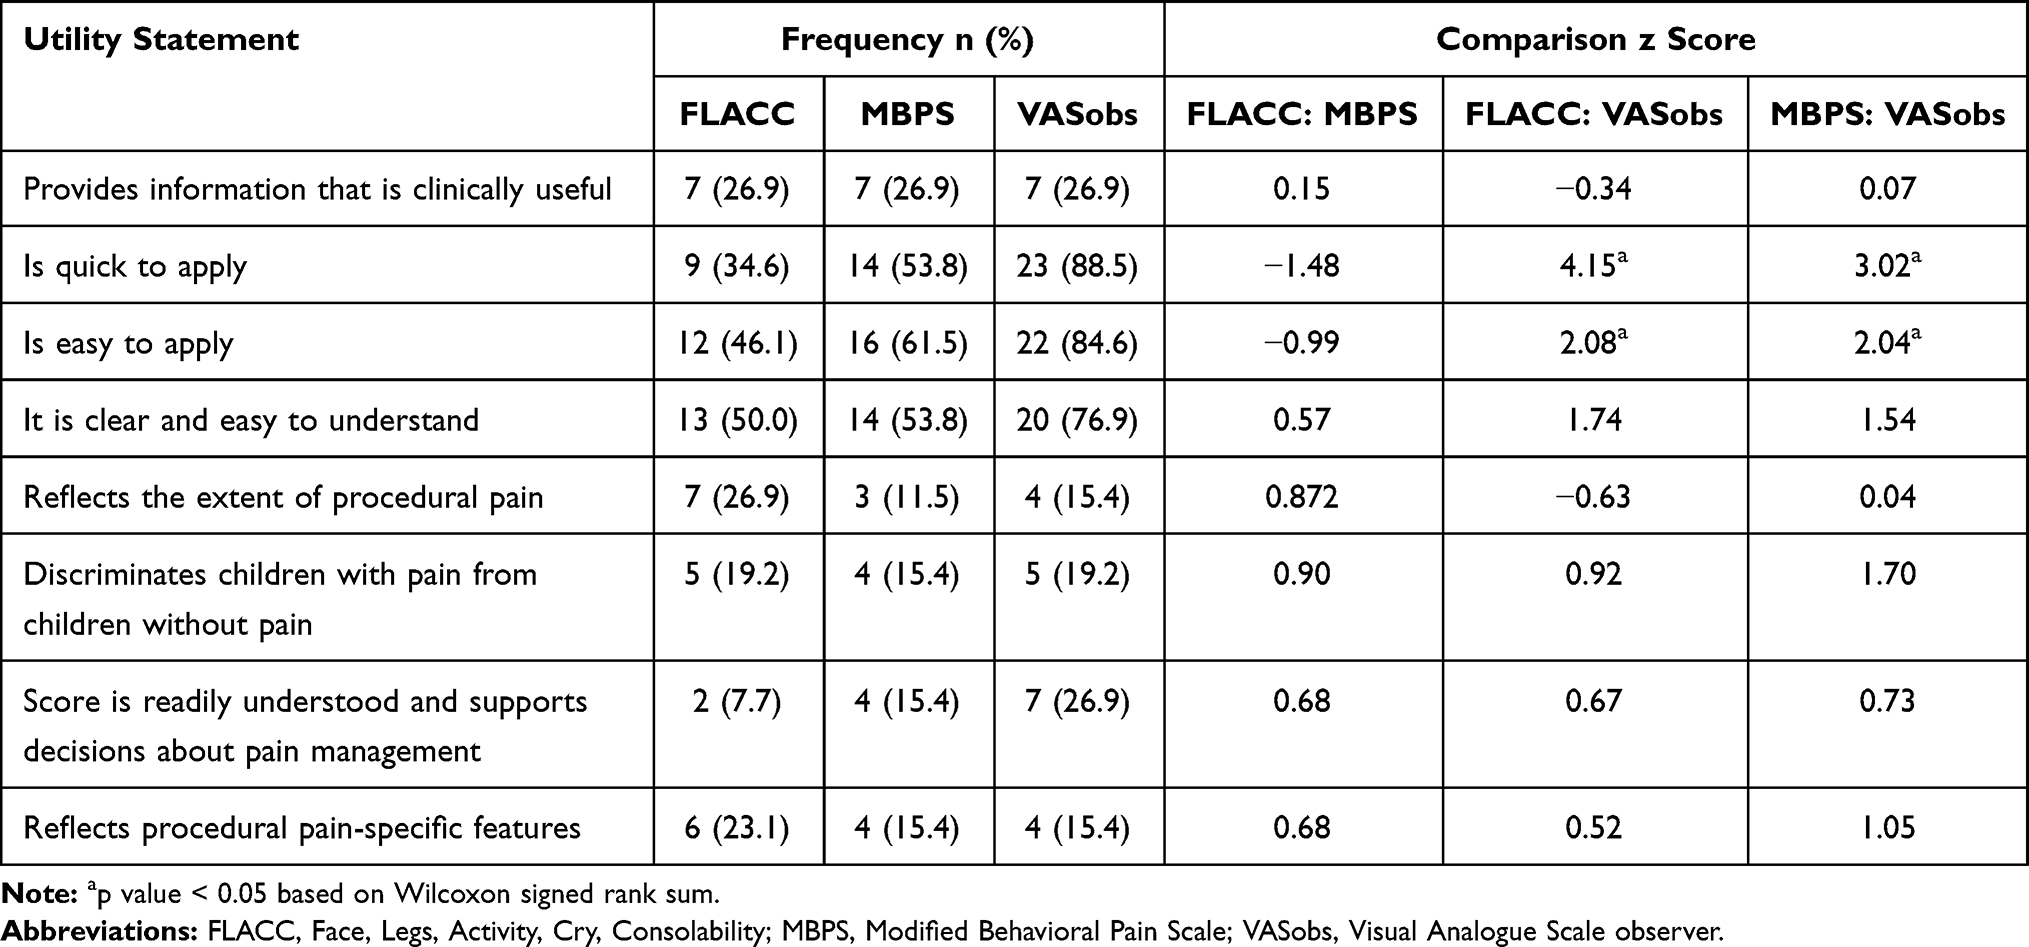 |
Table 2 Clinical Utility Questionnaire Responses (Responding “Agree” or “Strongly Agree”) and Comparison Across Scales (FLACC Scale, MBPS and VASobs (Pain)) |
Sample Size
The COSMIN Checklist rate a sample of 100 as “excellent” and this served as the basis for determining the sample size (number of procedures) for this study.14 The number of reviewers ensured that a range of reviewers applied the scale which is consistent with practice. Studies with similar objectives have used sample sizes as low as 30 participants and two reviewers.18
Statistical Analysis
The statistical software package R: A language and environment for statistical computing (https://www.R-project.org/) was used to analyze the data.19 Descriptive statistics were used to report demographic and clinical data and the pain scores. Chi-square was used to compare the proportion of incomplete scores for each scale, which were then treated as missing data. The Wilcoxon signed-rank test was used to compare scores at different phases of painful and non-painful procedures and clinical utility survey results. Spearman correlation coefficients were used to examine convergence between the scale scores. To establish statistical significance p-values were set for significance at 0.05.
The results for assessment of remaining psychometric properties; inter- and intra-rater reliability (intraclass correlation coefficient, one-way random effects), discrimination (independent t-test), responsiveness (linear mixed modelling), sensitivity and specificity at various cut-off scores, the extent to which first and final scores agreed (Wilcoxon signed-rank sum) are reported and compared descriptively. A full description of the analysis of the psychometric properties for each scale can be found elsewhere, which includes the values for intra-class correlation coefficients considered to define acceptable levels of reliability (0.75) and clinically significant changes in pain score to show responsiveness (change in score = 2).13
Results
The children in this study were 22.5 (±10.3) months old, mostly boys (58%) and the majority presented with respiratory disease (38%) or dehydration due to gastroenteritis (29%). Nineteen nurses and seven physicians participated with a mean of 10.1 years of experience (range <1 to 20 years). Twelve nurses (63%) had postgraduate specialty training and three physicians (43%) had completed specialty training.
Clinicians allocated scores that ranged across procedures and phases from zero to 9.5 and mean and median scores were highest for nasogastric tube (NGT) insertion (FLACC 9.5 ± 0.8, [10 IQR 9–10], MBPS 8.8 ±1.1, [9 IQR 8–9.5], VASobs pain 6.4 ±2.0 [6.7 IQR 5.3–8] and VASobs distress 8.1 ±1.8 [8.5 IQR 7.3–9.5]) and lowest for oxygen saturation measurement (SpO2) (FLACC 0.5 ± 0.9, [0 IQR 0–1], MBPS 2.0 ±0.9, [2 IQR 2–2], VASobs pain 0.7 ±3.2, [0 IR 0–0], VASobs distress 2.7 ±5.2, [0 IQR 0–0.3]). VASobs pain scores were lowest for all phases of all procedures except for the procedural phase of SpO2 measurement. MBPS scores were highest for all baseline and preparation phases and the procedural phase of intravenous cannula insertion compared to the other two scales. Mean and median scores of the three scales and all procedures and phases are reported in Table S1 which is available online.
Data were pooled by procedure type and analysed using Wilcoxon signed-rank sum, a non-parametric test to compare scale scores for painful and non-painful procedures. The results demonstrated a significant difference between scores for painful and non-painful procedures at baseline and during the procedure. The aggregated means and medians and the results of the comparison are reported in Table 1.
Psychometric Evaluation
Feasibility and Clinical Utility
Application of the FLACC scale resulted in a larger number of incomplete scores than for the MBPS (14.6% vs 8.5%, χ2 = 473.7, p < 0.000). VASobs pain and VASobs distress scores were relatively infrequently omitted by reviewers (0.9% and 0.2% of scoring occasions, respectively) so they were not considered further for this comparison. The most frequent obstacle to the allocation of items for the FLACC scale and MBPS was restraint. Uniquely, no attempts to console the child were made preventing the allocation of a score for the FLACC item “consolability” on 30 occasions.
Reviewers rated the utility of the scale similarly for several items: clinically useful, able to discriminate children with and without pain and reflective of procedural pain-specific features (Table 2). Comparison between FLACC and MBPS ratings using Wilcoxon signed-rank sum revealed no statistically significant differences in ratings between the FLACC scale and MBPS. However, larger numbers of reviewers agreed that the VASobs was “quick” and “easy” to apply when compared with their response for the FLACC scale (z = 4.15, p < 0.000 and z = 2.081, p = 0.037, respectively) and the MBPS (z = 3.023, p = 0.003 and z = 2.043, p = 0.041, respectively). When asked to rank the scales in order of preference, reviewers liked the VASobs the most (n = 14) and the MBPS the least (n = 11). The full rankings can be seen in the supporting material online (Table S2).
The first score and the final score allocated by the reviewers were compared and reviewers changed the MBPS scores more often than FLACC and VASobs pain scores (28.2% vs 23.0% vs 8.8%, respectively) (Table 3). Wilcoxon signed-rank sum test results show that there was a statistically significant difference between the first and final median FLACC scores (0 vs 2, p = 0.033) but not for the first and final scores for MBPS and VASobs scores. Correlations between the first and final scores were similarly high for all scales and all coefficients exceeded 0.90.
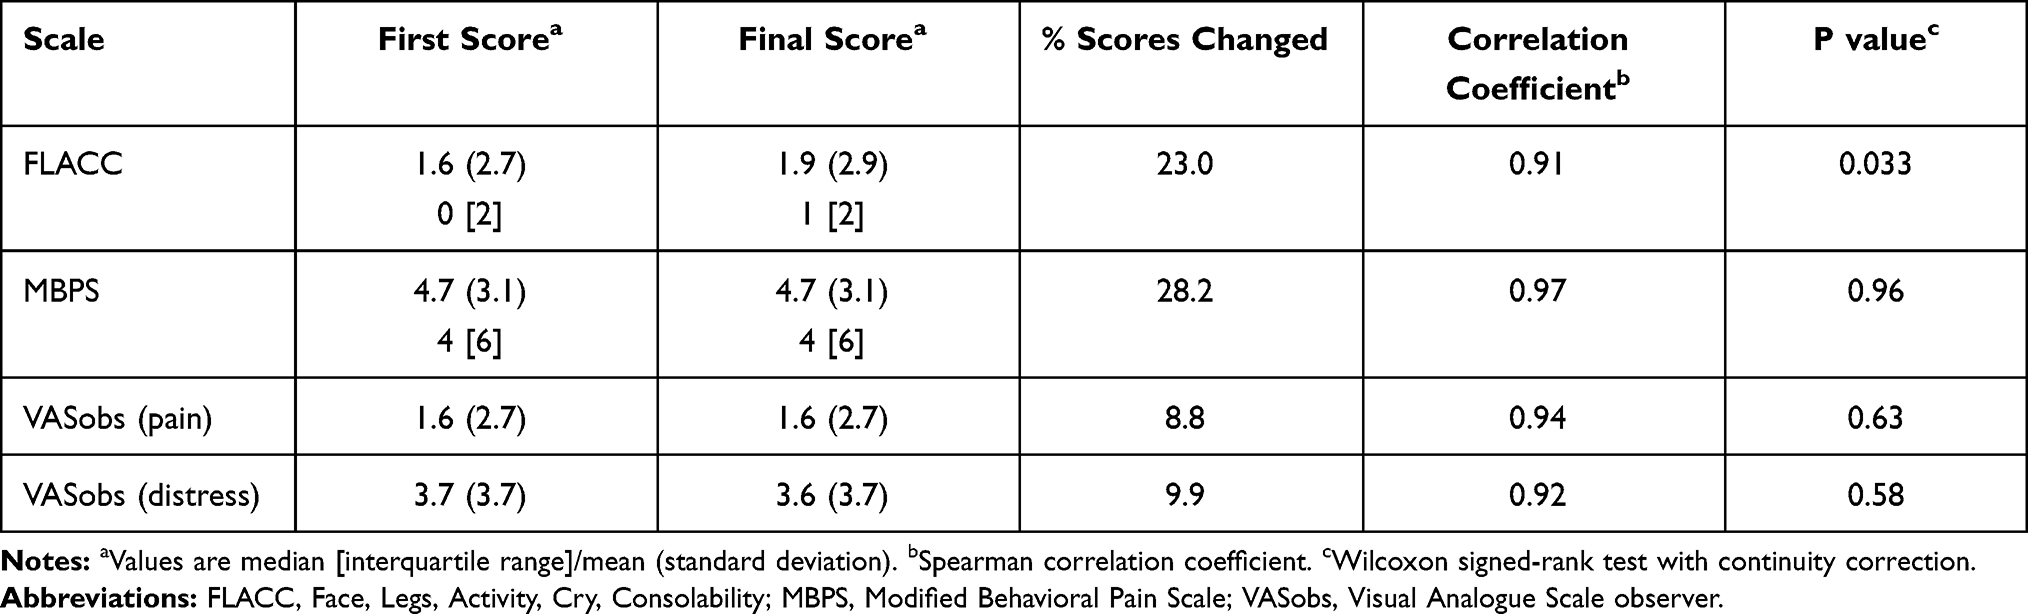 |
Table 3 Comparison Between First Score and Final Score |
Reliability
Intra-class correlations (ICC) calculated as a measure of inter-rater reliability for the FLACC scale and MBPS scores provided by the four reviewers were very high and ranged from 0.69 to 0.94 (Table 4). Correlations for VASobs pain and distress were lower, ranging from 0.27 to 0.77 and 0.60 to 0.89, respectively. The results of linear mixed modelling confirm that the effect of the reviewer on FLACC scores (variance = 0.004, SD ± 0.063) and MBPS scores (variance = 0.016, SD ± 0.125) was very low and only slightly higher for VASobs distress (variance = 0.146, SD ± 0.382) and VASobs pain (variance = 0.35, SD ± 0.592).
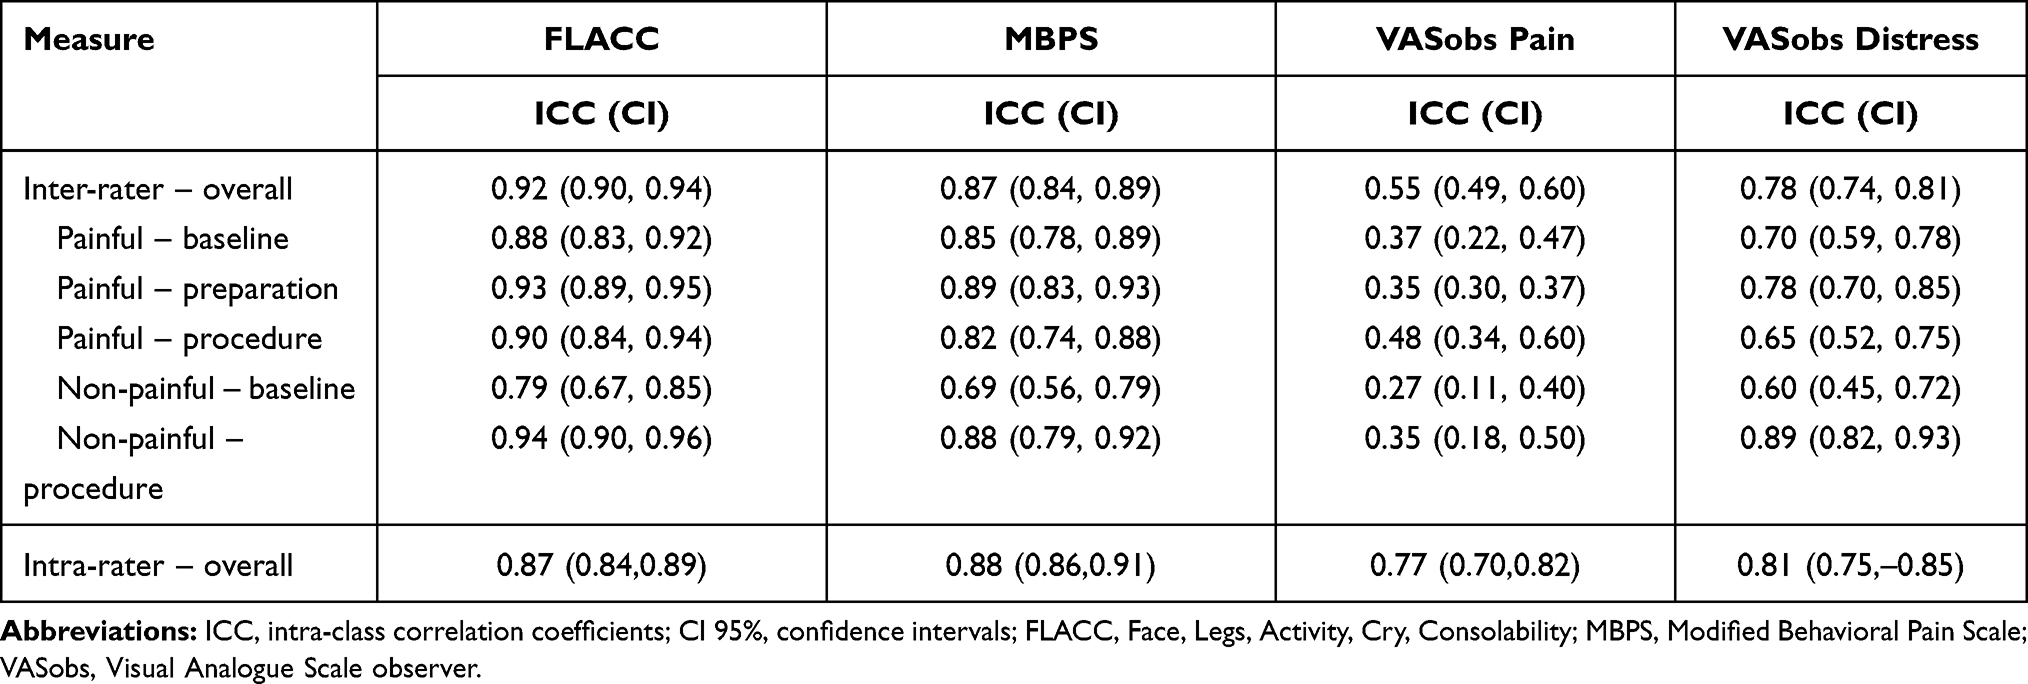 |
Table 4 The Reliability of the FLACC Scale, MBPS, VASobs Pain and VASobs Distress - Inter-Rater Overall and for Each Procedural Phase of Painful and Non-Painful Procedures and Intra-Rater Overall |
Validity
Sensitivity, specificity and AUC using receiver operating characteristics (ROC) at various cut-offs were calculated for the scores for each scale, the results of which are reported in Table 5. Known groups (painful and non-painful procedures) were differentiated by scores for all scales. The FLACC scores provided the highest levels of sensitivity (94.9%), specificity (72.5%) and AUC (0.83) for the lowest cut-off score (FLACC score of two). The MBPS scores were most sensitive (91.4%) and specific (77.5%) but at the highest cut-off pain score (MBPS score four).
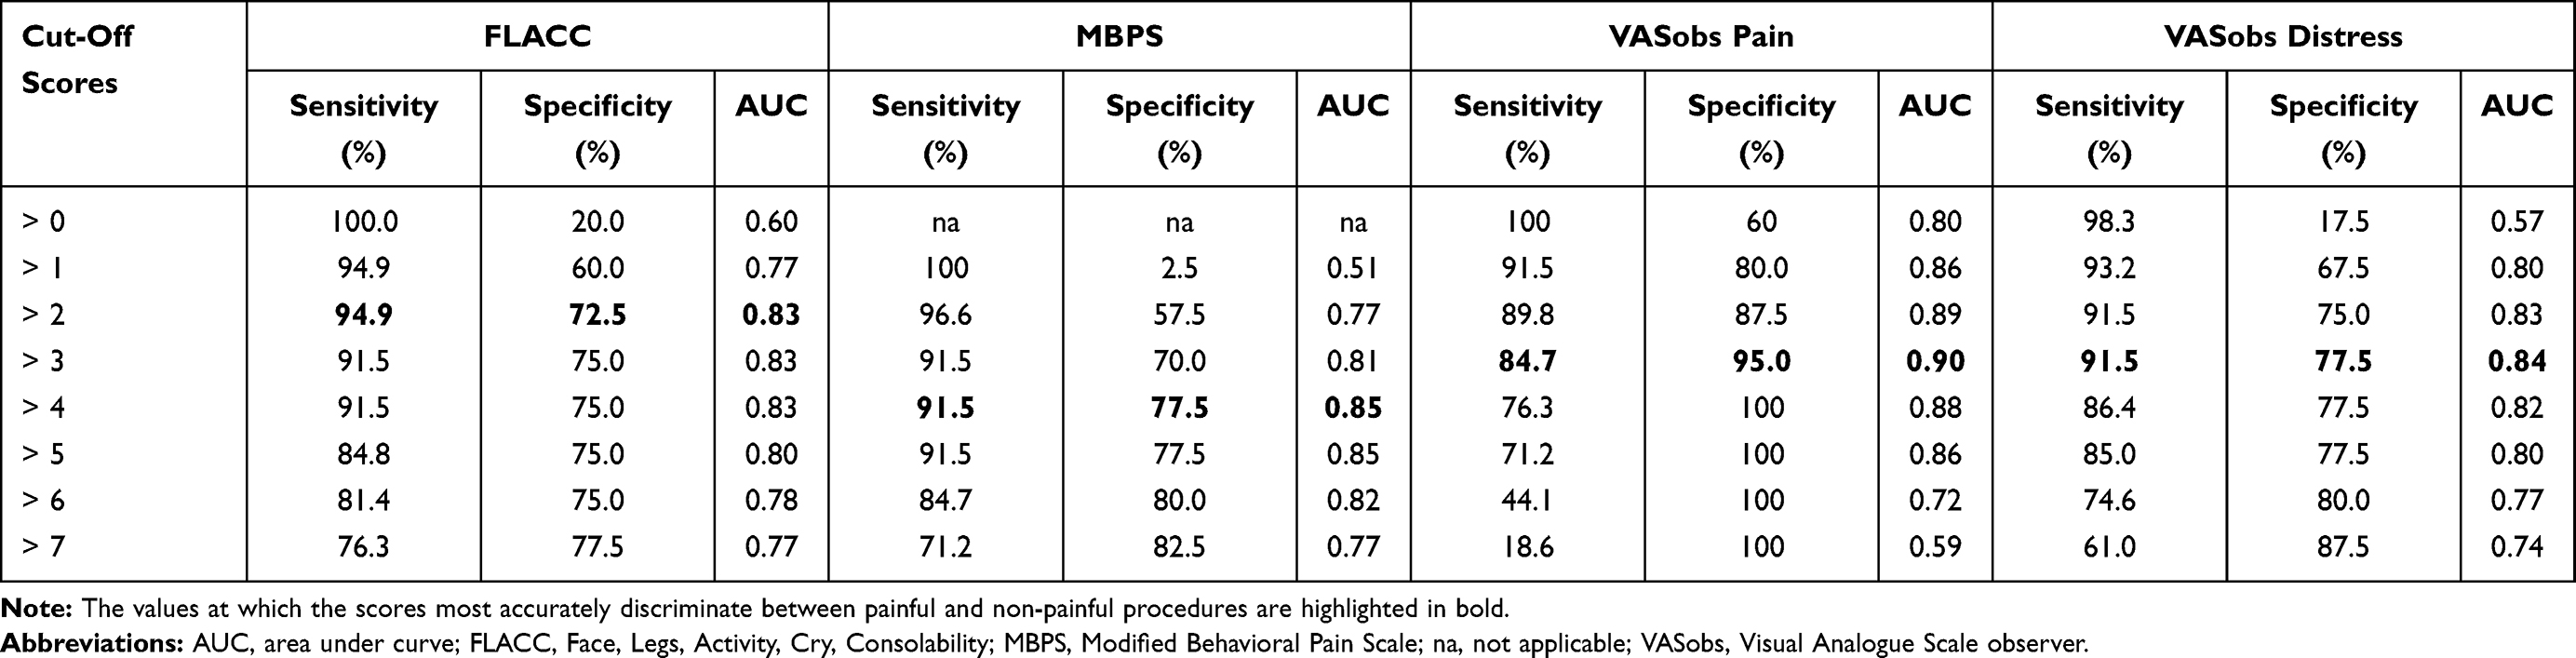 |
Table 5 Sensitivity, Specificity and Area Under the Curve Values (AUC) Calculated for Different Cut-Off for FLACC, MBPS, VASobs Pain and VASobs Distress Scores to Differentiate Procedure Type |
The scores for each scale across phases for painful and non-painful procedures can be seen in Figure 1 and visually demonstrates the responsiveness of all scales to pain. Independent t-tests results demonstrated that the responsiveness of the FLACC scale, MBPS and the VASobs to pain (mean difference from baseline to procedure) differed significantly for painful versus non-painful procedures (FLACC 6.09 ± 3.36 vs 1.99 ± 3.34, p < 0.000, MBPS 4.73 ± 2.63 vs 1.50 ± 2.73, p < 0.000 and VASobs pain 4.96 ± 2.16 vs 0.42 ± 0.99, p < 0.000).
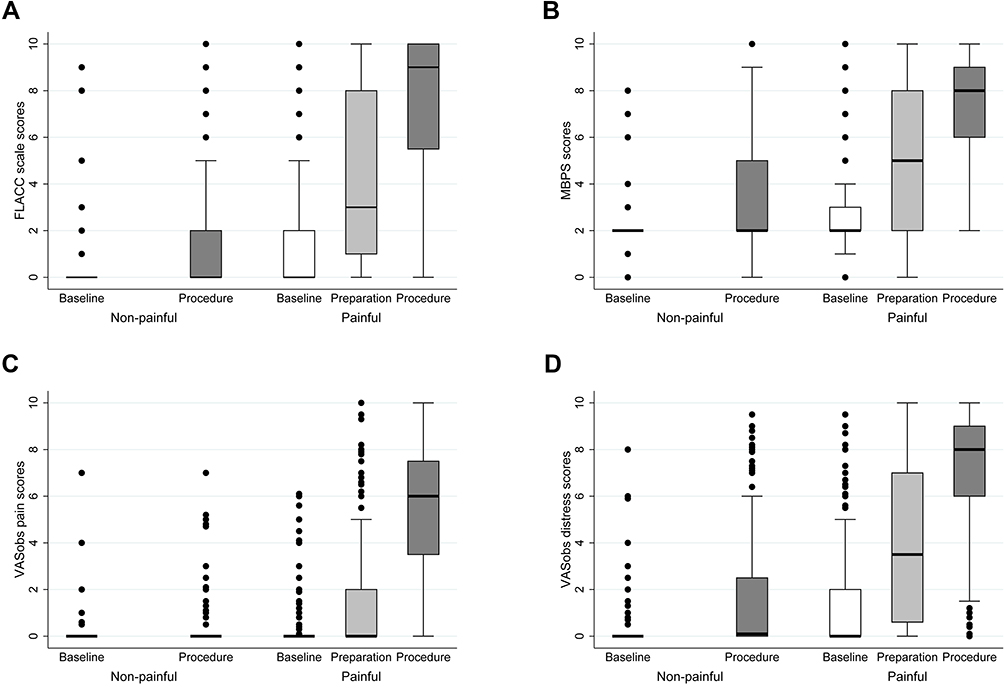 |
Figure 1 Boxplots representing change of scores over time (procedural phases) in the two procedure cohorts (painful and non-painful procedures) for the FLACC scale (A), the MBPS (B), the VASobs pain (C) and the VASobs distress (D). |
These observations were also tested using linear mixed modelling to account for the impact of procedure and phase (fixed effects) on scores where the children and reviewers were acknowledged as random effects. The model indicates that there was an average increase of 5.9 for FLACC scores, 4.2 for MBPS scores and 5.5 for VASobs pain scores across phases for children undergoing a painful procedure. Responsiveness was more modest for non-painful procedures with an average increase of 1.8 for FLACC scores and 1.5 for MBPS scores and markedly less so for VASobs pain scores (average increase = 0.4). VASobs distress scores showed a similar pattern with an average increase in scores of 5.5 for painful procedures and 1.5 for non-painful procedures.
For children undergoing a painful procedure, the mean difference in scores across phases for both scales was significantly different for children with baseline scores less than three (FLACC 7.01 ±2.90, MBPS 5.71 ±1.94) compared with children with baseline scores of three or more (FLACC 2.70 ± 2.72, MBPS 1.72 ± 2.16), p = 0.0001 and p = 0.0000, respectively. As there was only one child with a mean VASobs pain score at baseline over three, this analysis was not completed for VASobs pain.
The correlations between FLACC and VASobs distress scores and MBPS and VASobs distress scores (r = 0.89 and r = 0.87, respectively) were higher than they were for correlations between these scales and VASobs pain scores (r = 0.74 for both correlations) and the correlation between VASobs pain and VASobs distress scores (r = 0.77). The relationships between scores for the different scales are shown in the scatterplots provided in Figure 2, where scores allocated by the clinicians for one scale are plotted against scores allocated with an alternative. Except for VASobs pain and VASobs distress, where distress scores were generally higher than pain scores, there are no obvious patterns in the relationships between scores for different scales.
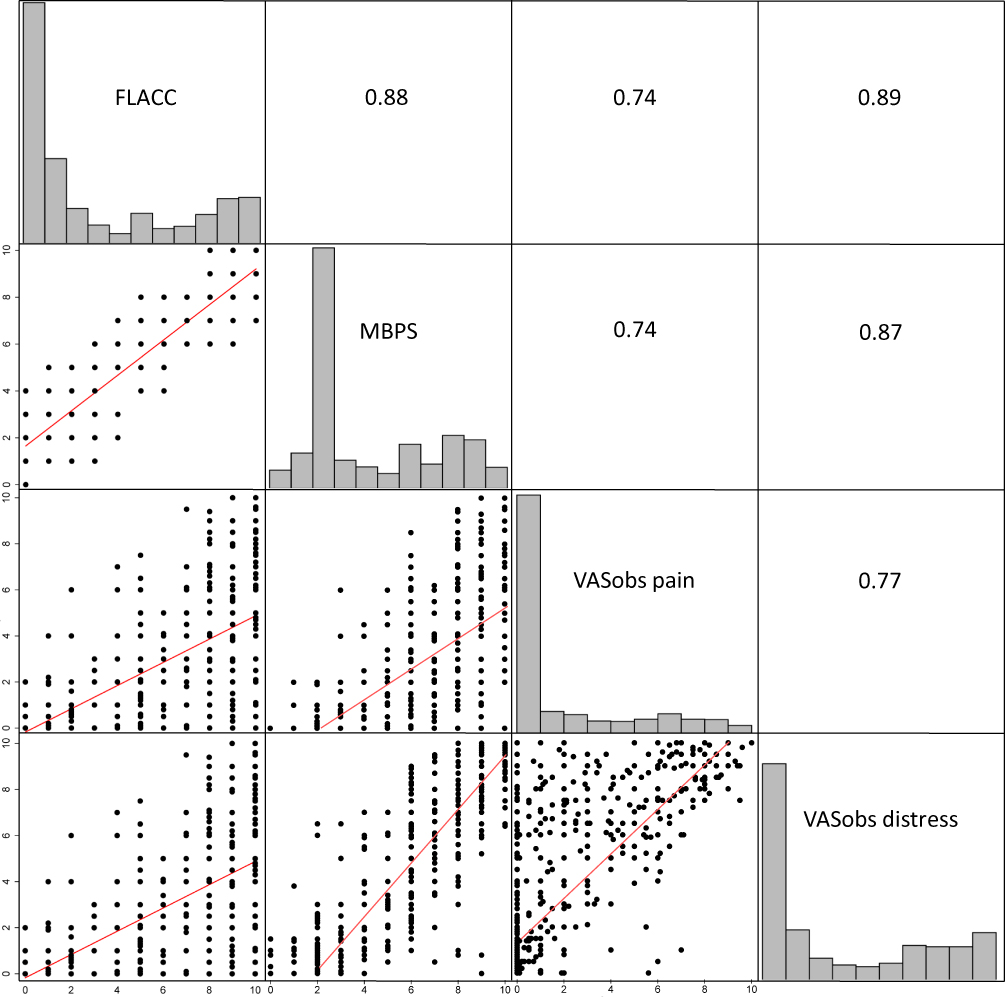 |
Figure 2 Scatter plots demonstrating relationships between scores for each scale.Abbreviations: FLACC, Face Legs Activity Cry Consolability; MBPS, Modified Behavioral Pain Scale; VASobs, Visual Analogue Scale observer. |
Discussion
We have previously shown that the FLACC scale and the MBPS are sensitive to pain but that they each have limitations to their capacity to distinguish between pain-related and non-pain-related distress.11,12 Our intention in this study was to determine which of the scales, FLACC scale, MBPS or VASobs pain, is better suited to assessing procedural pain in infants and young children.
A comparison of the scores across scales reveals an obvious trend for VASobs pain scores to be lower than the score allocated using the other scales, and correlations between VASobs pain and the FLACC scale (r = 0.74) and MBPS scores (0.74) reflect a consistent difference in these scores. In contrast, MBPS and FLACC scale scores were highly correlated (r = 0.88). It has been shown that VASobs scores for acute pain are generally lower than self-reported scores.20–23 Although it is not possible to replicate these results in a sample of children too young to self-report, it is possible that observers using the VASobs would also underestimate pain in this age group. If we accept this, we could assume that the FLACC scale and MBPS scores, which were higher than VASobs pain scores, more closely represent self-reported scores. Clinically underestimated and undertreated pain is likely a greater concern for infants and children receiving healthcare than overestimation or overtreatment supporting our concerns about a scale that consistently scores lower than others.24 In contrast, MBPS scores for eight of the ten phases were higher than the scores allocated using other scales and, in both cases, these were procedural phases (nasogastric tube insertion and oxygen saturation measurement). Very few observations resulted in an MBPS score of “zero” and averaged almost “two” even at baseline. This might be best explained by a possible flaw in the design of the scale. The descriptors for “face” and “cry” items require the infant to be “smiling” and “laughing or giggling”, respectively, to achieve a score of “zero”. The absence of these behaviours does not equate to the presence of pain. This is particularly relevant for children undergoing procedures other than immunisation where a hospital setting, more extensive preparation and parental concern are likely to heighten their pre-procedural fear and anxiety making smiling and giggling unlikely. Our concerns about the face descriptors echo the work of Chang and colleagues who note that the criteria for facial expression differ substantially across scales and have shown in their study that these descriptors are frequently not consistent with the expressions seen in infants and children experiencing pain.25
All scales were shown to be responsive to pain, demonstrated by a marked increase in scores across phases (baseline to procedural). Responsiveness of scores to the pain associated with painful procedures was highest for the FLACC scale with an average increase of 5.9, closely followed by the VASobs pain with average increases of 5.5. The responsiveness of MBPS scores was slightly lower with average increase of 4.2. To establish the capacity of these scales to distinguish between pain and non-pain-related distress the responsiveness to pain for infants and children demonstrating distress in the baseline phase (score ≥ 3) was compared with those who were more settled (score < 3). The responsiveness of the FLACC scale and the MBPS scores was blunted for infants and children distressed at baseline. Although this may reflect the natural tendency for the difference between two values randomly selected from within discrete limits to be smaller if the lower value in this pair is higher than in a second pair of values randomly selected from within the same discrete limits, it may reflect the limited capacity for these scales to differentiate between non-pain related and pain-related distress. This analysis could not be completed for the VASobs pain scores as there were so few observations scoring at least three in the baseline phase. This is likely to reflect the use of separate VASobs for pain and distress which allowed reviewers to allocate separate scores for pain and non-pain related distress in a way that the FLACC scale and MBPS did not. Finally, analysis of the scales’ responsiveness for non-pain related procedures was intended to support our understanding of the scales’ capacity to distinguish between pain and non-pain related distress. A highly specific pain scale should ideally show no response or increase in scores in circumstances where there is no increase in pain, ie a non-panful procedure. The average increase in scores across phases for non-painful procedures was more modest, although not zero, for the FLACC scale (1.8) and the MBPS (1.5) but almost zero for VASobs pain (0.4). This implies greater specificity for pain for the VASobs pain than the FLACC scale and the MBPS, which may be the result of the capacity for the observer to make allowances for the context when making their assessment of pain using the VASobs.
Receiver operative curve analysis was also used to demonstrate the capacity of the scores to differentiate infants and young children experiencing a painful procedure from those experiencing a non-painful procedure. At their highest levels of accuracy FLACC, VASobs distress and the MBPS were highly sensitive to procedure type (94.9%, 91.5% and 91.5%, respectively) but less specific (72.5%, 77.5% and 77.5%, respectively). However, notably, this occurred at three different pain scores with FLACC differentiating these procedures at a score of ‘two’and the MBPS at a score of ‘four’. Although the clinically meaningful difference in score for behaviour scales has not been extensively shown it is generally accepted that a difference in pain score of two should be considered clinically significant. Furthermore, many systems for classification use a score of three to distinguish mild from moderate pain. This adds weight to our concern about the capacity of MBPS scores to differentiate pain from non-pain-related distress.
These concerns about the capacity of the scales to distinguish between pain and non-pain related distress were shared by the reviewers who reported in the clinical utility survey that they did not consider these scales well suited to procedural pain measurement, or capable of differentiating children with pain from those without pain, but with distress, or supporting clinical decisions about pain management. However, our greatest concerns about the capacity for discrimination lie with the MBPS. Scores for segments of video featuring infants and children presumed not to be in pain (baseline, preparation and non-painful procedures) were significantly higher for MBPS than the FLACC scale and even at baseline averaged almost two. This impacted the degree of responsiveness demonstrated by the MBPS compared with the FLACC scale and the VASobs pain.
VASobs distress scores followed similar patterns to the FLACC scale and MBPS scores and an average increase of 5.5 was seen for painful procedures and 1.5 for non-painful procedures. Sensitivity and specificity results for the VASobs scores and FLACC scale and MBPS scores were also very similar. This similarity in the way the FLACC scale, the MBPS and the VASobs distress responded to pain was reinforced by strong correlations between the VASobs distress scores and FLACC scale scores (r = 0.89) and the MBPS scores (r = 0.87). The VASobs distress scale was included in this study to provide clinicians with an opportunity to distinguish between behavior that they considered indicative of pain from those likely to reflect distress which may be a composite of pain and non-pain related factors. This may provide further evidence that the FLACC scale and MBPS scores are a measure of distress and not solely pain.
The FLACC scale and MBPS were deemed reliable when applied by clinicians in this study and one scale cannot be considered more reliable than the other. This is perhaps not surprising given the similarities between the scales and that each reviewer applied both scales. However, despite the similarities between these scales, significant differences existed between the scores allocated using these two scales for most phases. Furthermore, the feasibility and clinical utility of the two scales was not consistent. Reviewers changed their score almost a quarter of the time when given an opportunity to review the video segment and more often when applying MBPS. However, changes in MBPS scores were not significant and the average change in FLACC scale scores (mean 0.3) although statistically significant was unlikely to be clinically significant. More importantly, reviewers were unable to score FLACC items more often than they were unable to score MBPS items resulting in fewer complete FLACC scores. These results suggest that the FLACC scale may have more limitations to feasibility than the MBPS. In contrast are the results for VASobs pain and VASobs distress where the results do not raise concerns regarding the feasibility of application of these scales. Reliability for both VASobs scales was markedly lower than for FLACC and MBPS yet the feasibility of the VASobs exceeded that of the FLACC scale and the MBPS; scores were more often complete and changed less frequently. Furthermore, reviewers rated the VASobs scales as much easier and quicker to apply and indicated a preference for the VASobs pain for pain measurement over the FLACC scale and the MBPS.
Strengths and Limitations
Comparison of the scores for these scales assumes that the 0 to 10 scale is consistent across this range of scales and that this is a ratio scale where a true zero exists and the difference between any two adjacent values (eg 1 and 3 and 6 and 7) is the same. As it is the practice of clinicians and researchers to use these scales interchangeably and there is no evidence to confirm or refute these assumptions, we elected to make these comparisons based on the premise that the scores can be compared in this way.
Although criteria to determine acceptable results for the measurement of the psychometric properties for scores for a specific scale were defined prior to conducting the original study, it was more difficult to set similar standards to define the degree of difference between these results was necessary to claim that one scale performed better than another. The absence of predetermined criteria for this is a limitation of this study. As an accepted hierarchy for psychometric properties, feasibility and clinical utility does not exist we have left it to the reader to determine which of these has the greatest bearing on their willingness to adopt the scale. We anticipate that context may play a significant role in this decision, eg researchers using the scale to measure a study outcome may place greater emphasis on reliability and validity while clinicians may consider the feasibility and clinical utility of greatest importance.
Reviewers in this study could not be blinded to the type of procedure, eg NGT insertion or the phase of the procedure. To overcome this, reviewers did not review more than one segment from each child to prevent them from establishing patterns that influenced scores. A large sample size was recruited for this study and multiple validation approaches were used to overcome the limitations of each approach. Application of the scale following one view of the video recording was an attempt to replicate real-time use of the scale. However, all the circumstances of clinical use of the scale could not be replicated and this is a limitation of this study. Finally, it was not possible to statistically compare all psychometric properties of the scales and our results and conclusions are to some extent based on a pragmatic comparison of the performance of the FLACC scale, the MBPS and the VASobs pain and VASobs distress scales.
Conclusion
Although the MBPS was developed for procedural pain intensity measurement, the evidence from this study suggested that it did not perform as well as the FLACC scale to distinguish between pain and non-pain-related distress. However, questions about the design and performance of the FLACC scale and the MBPS remain which prevent unreserved support for the use of either scale to assess procedural pain. The VASobs scale has consistently shown poor reliability when used to assess pain and cannot be recommended. Based on the results of this study we cautiously recommend the FLACC scale for procedural use but advocate for considering scores as an indication of the level of procedural distress experienced and not only procedural pain. We also recommend a review and potential revision of the scale for procedural use to improve the feasibility of application and to align item descriptors with empirical data. Improvement in feasibility and validity may in turn positively influence the clinical utility of the scores derived from these scales.
Acknowledgments
The authors would like to thank the infants, children, their parents and the clinicians who participated in this study. The authors would also like to acknowledge the technical assistance provided by Mr Adrian Hutchinson who developed the interface used to present the video recordings to the reviewers and record their responses. Dianne Crellin is a trainee member of Pain in Child Health, a research training initiative of the Canadian Institutes of Health Research.
Funding
Murdoch Children’s Research Institute clinical research grant.
Disclosure
The authors report no conflicts of interest in this work.
References
1. Andersen RD, Langius-Eklof A, Nakstad B, Bernklev T, Jylli L. The measurement properties of pediatric observational pain scales: a systematic review of reviews. Int J Nurs Stud. 2017;73:93–101. doi:10.1016/j.ijnurstu.2017.05.010
2. Crellin DJ, Harrison D, Santamaria N, Babl FE. Systematic review of the FLACC scale for assessing pain in infants and children: is it reliable, valid, and feasible for use? Pain. 2015;156(11):2132–2151. doi:10.1097/j.pain.0000000000000305
3. Crellin DJ, Babl FE, Santamaria N, Harrison D. The MBPS: a systematic review to determine its role in assessing pain in infants and young children.
4. Taddio A, Nulman I, Koren BS, Stevens B, Koren G. A revised measure of acute pain in infants. J Pain Symptom Manage. 1995;10(6):456–463. doi:10.1016/0885-3924(95)00058-7
5. Schug S, Palmer G, Scott D, Halliwell R, Trinca J. Working Group of the Australian and New Zealand College of Anaesthetists (ANZCA) and Faculty of Pain Medicine (FPM). In: Acute Pain Management: Scientific Evidence.
6. Merkel SI, Voepel-Lewis T, Shayevitz JR, Malviya S. The FLACC: a behavioral scale for scoring postoperative pain in young children. Pediatr Nurs. 1997;23(3):293–297.
7. von Baeyer CL, Spagrud LJ. Systematic review of observational (behavioral) measures of pain for children and adolescents aged 3 to 18 years. Pain. 2007;127(1–2):150. doi:10.1016/j.pain.2006.08.014
8. American Academy of Pediatrics. Committee on Psychosocial Aspects of Child and Family Health. Task Force on Pain in Infants Children and Adolescents. The assessment and management of acute pain in infants, children, and adolescents. Pediatrics. 2001;108(3):793–797. doi:10.1542/peds.108.3.793
9. Howard R, Carter B, Curry J, et al. Good practice in postoperative and procedural pain management. Background. Paediatr Anaesth. 2008;18(Suppl 1):1–3. doi:10.1111/j.1155-5645.2008.02423.x
10. van Dijk M, Koot HM, Saad HH, Tibboel D, Passchier J. Observational visual analog scale in pediatric pain assessment: useful tool or good riddance? Clin J Pain. 2002;18(5):310–316. doi:10.1097/00002508-200209000-00006
11. Crellin DJ, Babl FE, Santamaria N, Harrison D. The psychometric properties of the MBPS scale used to assess procedural pain. J Pain. 2018;19(6):660–670. doi:10.1016/j.jpain.2018.01.012
12. Crellin DJ, Harrison D, Santamaria N, Huque H, Babl FE. The psychometric properties of the FLACC scale used to assess procedural pain. J Pain. 2018;19(8):862–872. doi:10.1016/j.jpain.2018.02.013
13. Crellin DJ, Harrison D, Hutchinson A, Schuster T, Santamaria N, Babl FE. Procedural Pain Scale Evaluation (PROPoSE) study: protocol for an evaluation of the psychometric properties of behavioural pain scales for the assessment of procedural pain in infants and children aged 6–42 months. BMJ Open. 2017;7(9):e016225. doi:10.1136/bmjopen-2017-016225
14. Mokkink LB, Terwee CB, Patrick DL, et al. The COSMIN checklist for assessing the methodological quality of studies on measurement properties of health status measurement instruments: an international Delphi study. Qual Life Res. 2010;19(4):539–549. doi:10.1007/s11136-010-9606-8
15. Stata statistical software: release 14 [computer program]. College Station Texas: Stata Corp LP; 2015.
16. Aitken RC. A growing edge of measurement of feelings [Abridged]. Proc R Soc Med. 1969;62(10):989–993. doi:10.1177/003591576906201005
17. de Jong A, Baartmans M, Bremer M, et al. Reliability, validity and clinical utility of three types of pain behavioural observation scales for young children with burns aged 0–5 years. Pain. 2010;150(3):561–567. doi:10.1016/j.pain.2010.06.016
18. Gomez RJ, Barrowman N, Elia S, Manias E, Royle J, Harrison D. Establishing intra- and inter-rater agreement of the face, legs, activity, cry, consolability scale for evaluating pain in toddlers during immunization. Pain Res Manage. 2013;18(6):e124–e128. doi:10.1155/2013/897104
19. R Core Team. R: a language and environment for statistical computing. Vienna, Austria: R Foundation for Statistical Computing; 2016.
20. Breau LM, McGrath PJ, Craig KD, Santor D, Cassidy KL, Reid GJ. Facial expression of children receiving immunizations: a principal components analysis of the child facial coding system. Clin J Pain. 2001;17(2):178–186. doi:10.1097/00002508-200106000-00011
21. Kelly A-M, Powell CV, Williams A. Parent visual analogue scale ratings of children’s pain do not reliably reflect pain reported by child. Pediatr Emerg Care. 2002;18(3):159–162. doi:10.1097/00006565-200206000-00002
22. Schultz AA, Murphy E, Morton J, Stempel A, Messenger-Rioux C, Bennett K. Preverbal, Early Verbal Pediatric Pain Scale (PEPPS): development and early psychometric testing. J Pediatr Nurs. 1999;14(1):19–27. doi:10.1016/S0882-5963(99)80056-6
23. Singer AJ, Richman PB, Kowalska A, Thode HC
24. Krauss BS, Calligaris L, Green SM, Barbi E. Current concepts in management of pain in children in the emergency department. Lancet. 2016;387(10013):83–92. doi:10.1016/S0140-6736(14)61686-X
25. Chang J, Versloot J, Fashler SR, McCrystal KN, Craig KD. Pain assessment in children: validity of facial expression items in observational pain scales. Clin J Pain. 2015;31(3):189–197. doi:10.1097/AJP.0000000000000103
 © 2021 The Author(s). This work is published and licensed by Dove Medical Press Limited. The full terms of this license are available at https://www.dovepress.com/terms.php and incorporate the Creative Commons Attribution - Non Commercial (unported, v3.0) License.
By accessing the work you hereby accept the Terms. Non-commercial uses of the work are permitted without any further permission from Dove Medical Press Limited, provided the work is properly attributed. For permission for commercial use of this work, please see paragraphs 4.2 and 5 of our Terms.
© 2021 The Author(s). This work is published and licensed by Dove Medical Press Limited. The full terms of this license are available at https://www.dovepress.com/terms.php and incorporate the Creative Commons Attribution - Non Commercial (unported, v3.0) License.
By accessing the work you hereby accept the Terms. Non-commercial uses of the work are permitted without any further permission from Dove Medical Press Limited, provided the work is properly attributed. For permission for commercial use of this work, please see paragraphs 4.2 and 5 of our Terms.