")
Back to Journals » Drug Design, Development and Therapy » Volume 14
Comparison of the Pharmacokinetics of Highly Variable Drugs in Healthy Subjects Using a Partial Replicated Crossover Study: A Fixed-Dose Combination of Fimasartan 120 mg and Atorvastatin 40 mg versus Separate Tablets
Authors Hwang JG, Yu KS , Lee S
Received 7 October 2019
Accepted for publication 15 April 2020
Published 20 May 2020 Volume 2020:14 Pages 1953—1961
DOI https://doi.org/10.2147/DDDT.S233732
Checked for plagiarism Yes
Review by Single anonymous peer review
Peer reviewer comments 2
Editor who approved publication: Dr Georgios Panos
Jun Gi Hwang, Kyung-Sang Yu, SeungHwan Lee
Department of Clinical Pharmacology and Therapeutics, Seoul National University College of Medicine and Hospital, Seoul, Republic of Korea
Correspondence: SeungHwan Lee
Department of Clinical Pharmacology and Therapeutics, Seoul National University College of Medicine and Hospital, 101 Daehak-ro, Jongno-gu, Seoul 03080, Republic of Korea
Tel +82 2 2072 19200
Fax +82 2 742 9252
Email [email protected]
Purpose: A fixed-dose combination (FDC) of fimasartan and atorvastatin is used to treat hypertension and dyslipidemia. The peak plasma concentration (Cmax) of fimasartan and atorvastatin has a large intra-subject variability with a maximum coefficient of variation of 65% and 48%, respectively. Therefore, both drugs are classified as highly variable drugs. The purpose of this study was to compare the pharmacokinetics (PK) between a FDC of fimasartan 120 mg and atorvastatin 40 mg versus separate tablets in healthy male Korean subjects.
Subjects and Methods: A randomized, single-dose, two-treatment, three-sequence, three-period, partial replicated crossover study was conducted with a 7-day washout interval between periods. Blood samples for fimasartan and atorvastatin were collected until 48 hours after administration in each period. PK parameters were calculated using the non-compartmental method. Geometric mean ratios (GMRs) for PK parameters of FDC to loose combination and their 90% confidence intervals (90% CIs) were estimated.
Results: A total of 56 subjects completed the study. GMRs (90% CIs) of the Cmax for fimasartan and atorvastatin were 1.08 (0.93– 1.24) and 1.02 (0.92– 1.13), respectively. The expanded 90% CIs of both drugs using the intra-subject variability was calculated range of 0.70– 1.43 and 0.73– 1.38, respectively. The corresponding values of area under the concentration–time curve from zero to the last measurable time point were 1.02 (0.97– 1.08) and 1.02 (0.98– 1.07), respectively.
Conclusion: FDC of fimasartan 120 mg and atorvastatin 40 mg between their loose combination showed similar PK characteristics.
Keywords: fixed-dose combination, partial replicated design, fimasartan, atorvastatin, pharmacokinetics
Introduction
Hypertension is a cardiovascular disease associated with increasing morbidity and mortality. The population at risk of hypertension in Western Europe was reported as 78% of men and 82% of women.1 Dyslipidemia is also a cardiovascular disease with high morbidity and mortality. These two diseases commonly occur together, and the frequency of comorbidity is increasing.2 According to a previous study that investigated the relationship between dyslipidemia and other chronic metabolic diseases, dyslipidemia is associated with the increased secretion of vasoconstrictor molecules by processes such as the renin-angiotensin-aldosterone system (RAAS), which is closely related to the control of blood pressure.3 Therefore, concomitant medication is necessary for effective treatment of hypertension and dyslipidemia and it causes a lower risk of cardiovascular complications by more than 50%.1,2
Angiotensin II is one of the key substances of the RAAS system. It causes hypercontraction of the heart and leads to vascular hypertrophy. Therefore, angiotensin II receptor blockers are considered one of the first choice of treatment for essential hypertension.4 Statin, known as β-hydroxy β-methylglutaryl-CoA reductase inhibitor, prevents the conversion of β-hydroxy β-methylglutaryl-CoA to mevalonate during cholesterol synthesis, thereby lowering blood cholesterol levels.
As mentioned above, it is well known that chronic hypertension increases the risk of cardiovascular disease and hyperlipidemia also increases the risk of cardiovascular disease such as coronary heart disease. Therefore, hypertension and hyperlipidemia are mostly controlled together.5 Some studies reported that statin treatment decreased chronic arterial stiffness thereby resulting in a reduction of blood pressure.5,6 Concomitant medication of two drugs can reduce the risk of cardiovascular disease by the effective control of the RAAS.6
Fimasartan is one of several selective angiotensin II receptor blockers. Fimasartan was approved for use by the Korea Food and Drug Administration in 2010 and it is used at doses between 30 and 120 mg per day. Fimasartan has the pharmacokinetic characteristic of reaching its peak concentration within 0.5–3 hours. The elimination half-life of fimasartan is about 9–16 hours and it is metabolized in humans mainly by CYP3A4 and transported by organic anion transporters 1 and organic anion transporting polypeptide 1B1.7 Atorvastatin is a widely used statin agent worldwide. Atorvastatin lowers low-density lipoprotein cholesterol as efficiently as other statin agents. The approved dose of atorvastatin is 10 to 80 mg per day. Atorvastatin is also metabolized in humans mainly by CYP3A4 and transported by organic anion transporting polypeptides and P-glycoprotein.8
Fimasartan and atorvastatin are mainly metabolized by CYP3A4, but UDP-glucuronosyl transferase (UGT1A1, UGT1A3) and various transporters such as P-glycoprotein are involved in metabolism of both drugs. Individual polymorphism of these enzymes and transporters may contribute to high variability of drug concentration of both drugs.9,10 Also, fimasartan and atorvastatin have low oral bioavailability due to the high first-pass effect, which was considered to contribute high intra-subject variability.11
When fimasartan and atorvastatin were administered together, the exposure of atorvastatin was increased by fimasartan by 1.82-fold for maximum plasma concentration (Cmax) and 1.12-fold for area under the concentration curve after last dose (AUClast). Additionally, atorvastatin increased exposure of fimasartan by 2.18-fold and 1.35-fold for Cmax and AUClast, respectively.12 However, considering the wide therapeutic range of fimasartan and atorvastatin12,13 and that AUC is well correlated to the therapeutic effect rather than to the Cmax, the pharmacokinetic interaction between fimasartan and atorvastatin seems to be limited in terms of clinical outcome. Therefore, the combination of these two drugs is clinically common.
The objective of the present study was to compare the pharmacokinetics of fimasartan/atorvastatin (120/40 mg) when administered as an FDC tablet versus separate tablets in healthy Korean male subjects with a partial replicated crossover design based on the scaled bioequivalence (BE) criteria for highly variable drugs.
Subjects and Methods
This study was approved (H-1610-120-802) by the Institutional Review Board of Seoul National University Hospital, Seoul, Republic of Korea and the Korean Ministry of Food and Drug Safety. This study was conducted in accordance with the ethical principles of the Declaration of Helsinki and the rules of good clinical practice in Korea at the Seoul National University Hospital Clinical Trial Center. (ClinicalTrials.gov registry number: NCT02994745).
A randomized, single dose, 2-treatment, 3-sequence, 3-period and partial replicated crossover study enrolled healthy Korean male volunteers aged 19 to 50 years, with a weight >55 kg, and a body mass index of 18.0 to 27.0 kg/m2 (Figure 1). Their health status was determined based on medical history, physical examination including vital sign measurements, 12-lead electrocardiogram, serology (hepatitis B surface antigen, anti-hepatitis C virus antibody, and anti-HIV antibody), and clinical laboratory tests (including hematology, biochemistry, coagulation panel, and urinalysis) conducted within 4 weeks prior to the initiation of the study. The subjects who had a history of gastrointestinal disease, gastrointestinal resection, and other clinically significant diseases that could affect pharmacokinetics of the drug were excluded. The participants provided a written informed consent before any study procedure was performed.
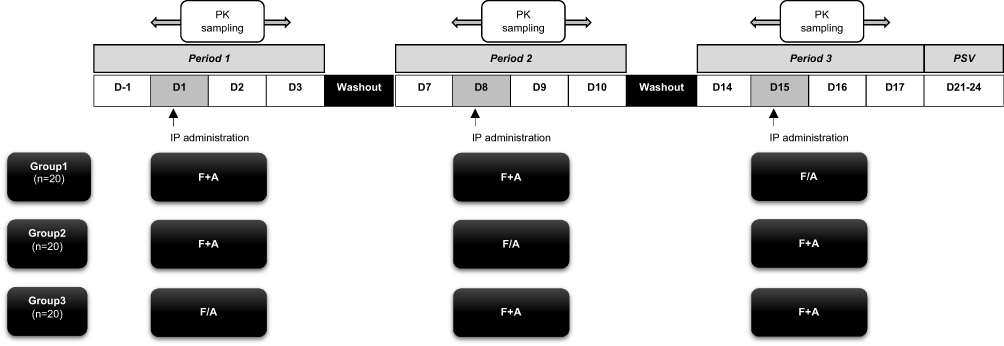 |
Figure 1 Design of the study (F/A: fimasartan 120 mg/atorvastatin 40 mg fixed-dose combination, F+A: fimasartan 120 mg + atorvastatin 40 mg). |
Eligible subjects were divided into one of three sequences. Each subject received the test drug (fixed-dose combination (FDC) of fimasartan and atorvastatin (120 mg/40 mg, respectively) Boryung Pharmaceutical Co., Ltd., South Korea) or reference drug (loose combination of fimasartan 120 mg (Kanarb®, Boryung Pharmaceutical Co., Ltd.) and atorvastatin 40 mg (Lipitor®, Pfizer)) in the first period and the same or the other treatment in the second and third period with a seven-day washout interval between periods. Subjects were administered the FDC in one period and the loose combination in the other two periods.
Determination of Plasma Concentration
For Pharmacokinetic (PK) evaluation, blood samples were collected at pre-dose and 0.25, 0.5, 0.75, 1, 1.5, 2, 2.5, 3, 4, 5, 6, 7, 8, 12, 24, and 48 h post-dose in each period. Eight mL of blood was collected at each blood sampling point by heparinized tubes. Every samples were centrifuged at 3000 rpm for 10 min. After centrifugation, plasma was separated and stored at −70°C until analysis.
The plasma concentrations of fimasartan were measured by high-performance liquid chromatography (HPLC, Agilent 1200 series; Agilent Technologies, Santa Clara, CA, USA) coupled with a tandem mass spectrometry (The Applied Biosystems MDS SCIEX API 4000 triple quadrupole mass spectrometer, Applied Biosystems, Canada). Fifty microliters of plasma were mixed with 20 µL of internal standard (IS; BR-A563 12.5 mg in 12.078 mL of 100% methanol), 1% formic acid 50 µL, and 1 mL of n-hexane and ethyl acetate mixture. The mixture was vortexed for 10 min and centrifuged at 3500 rpm for 10 min. Once the upper layer of the supernatant dried, it was dissolved by adding 2 mL of 90% acetonitrile solution and centrifuged at 3500 rpm for 10 min. Then, this mixture was injected into the LC-MS/MS. The LC column was Luna C18 (50 × 2.0 mm, 3 µm, Phenomenex, USA) and the ion mode of MS/MS was ESI (Electrospray Ionization, MRM mode). The MRM mode was monitored based on an m/z transition of 502.375 → 207.100 for fimasartan and 526.471 → 207.200 for BR-A563. Concentrations for sample quality control of fimasartan were 6, 400, 1600 ng/mL. Linear calibration curves for fimasartan were obtained from 2 to 2000 ng/mL. Precision (coefficient of variation, CV %) of within-batch and between-batch quality control samples of fimasartan were 0.381–9.162% and 2.287–5.770%, respectively. Accuracy of within-batch and between-batch of quality control samples of fimasartan were 91.342–104.502% and 99.466–101.208%, respectively.
The plasma concentrations of atorvastatin were measured by high-performance liquid chromatography (HPLC, Shimadzu Nexera X2, Shimadzu, Japan) coupled with a tandem mass spectrometry (The Applied Biosystems MDS SCIEX API 4000 triple quadrupole mass spectrometer, Applied Biosystems, Canada).
Two hundred µL of plasma were mixed with 20 µL of internal standard (IS; atorvastatin-d5 0.5 mg in 0.925 mL of 100% methanol), 50% methanol 20 μL, 10 mM sodium acetate (pH 5 adjusted acetic acid) 200 μL, and methyl tert-butyl ether 6 mL and centrifuged at 3500 rpm for 10 min. When the upper layer was dry, it was dissolved by adding 500 µL of 50% methanol and centrifuged at 3500 rpm for 10 min. Then, this mixture was injected onto the LC-MS/MS. The LC column was Luna C18 (50 × 2.0 mm, 3 µm, Phenomenex, USA) and the ion mode of MS/MS was ESI (Electrospray Ionization, MRM mode). The MRM mode was monitored based on an m/z transition of 559.357 → 440.200 for atorvastatin and 564.390 → 445.300 for atorvastatin-d5. Concentrations for sample quality control of atorvastatin were 1, 2, 40, 160 ng/mL. Linear calibration curves for atorvastatin were established from 1.2 to 160 ng/mL. Precision (CV %) of within-batch and between-batch quality control samples of atorvastatin were 0.115–7.073% and 2.617–3.574%, respectively. Accuracy of within-batch and between-batch of quality control samples of atorvastatin were 96.467–107.417% and 101.811–103.498%, respectively.
PK Evaluation
The PK parameters were calculated using a non-compartmental method obtained by Phoenix® WinNonlin® 6.4 (Certara, L.P., St. Louis, MO, USA). The peak plasma concentration (Cmax) and time to reach the peak plasma concentration (Tmax) were determined by observed values of individual plasma concentration–time profiles. The AUC from dosing to the last measurable concentration (AUClast) was calculated using the linear up log down method. AUC from dosing to infinity (AUCinf) was calculated as AUClast + last quantifiable concentration/terminal rate constant. Terminal elimination half-life (t1/2) was calculated as the natural logarithm of 2 divided by terminal elimination constant calculated in the linear part of the decline of natural logarithmic-transformed individual plasma concentrations, λz. Apparent clearance (CL/F) was derived as the administered dose divided by AUCinf.
Coefficient of variation of PK parameters for the same participants (intra-subject CV) of fimasartan and atorvastatin was calculated using PK parameters of the reference drug of two different periods. The intra-subject CV and expanded confidence interval (CI) limits were calculated using the following formulas.14


*SWR is the within-subject standard deviation of the log-transformed values of Cmax
Safety/Tolerability Evaluation
The safety and tolerability of the two treatments were assessed based on the occurrence of adverse events (AEs), vital signs, electrocardiogram, clinical laboratory evaluations, and physical examination throughout the study period. The severity of AEs was classified as mild, moderate, and severe. Causal relationship of AEs was evaluated as six categories: certain, probable/likely, possible, unlikely, definitely not and unassessable. Adverse drug reactions were defined as AEs in which causality with drugs could not be denied.
Statistical Analysis
The number of subjects was 48 subjects in this study design (assumed intra-subject variability = 65%, true GMR=1.10, ɑ = 0.05 and power = 80%). Additionally, considering dropout rate of 20%, the number of the subjects for this study was finally determined as a total of 60 subjects.
For PK and safety analysis, SAS 9.4 (SAS Institute, Cary, NC, USA) was used with a P-values ≤0.05 which was considered statistically meaningful results. The demographic characteristics were compared between the three sequences using ANOVA test, Fisher’s exact test, Chi-square tests. To compare the PK parameters between treatments, point estimates and 90% CIs of the geometric least squares mean ratio (GMR) of FDC to loose combinations for the Cmax and AUClast were also calculated by ANOVA test. BE was assessed if 90% CIs of GMR for Cmax and AUClast were within the range considered its conventional BE range and 90% CIs of GMR for Cmax were also considered the expanded BE range calculated by using intra-subject CV of each drug.
Results
A total of 62 subjects were randomized but 2 subjects dropped out before the first dosing, therefore 60 subjects were administered the test or reference drug at least one time. Four subjects dropped out during the study, therefore, 56 subjects successfully completed the whole study. The age, height, body weight, and BMI of the 62 randomized subjects were 27.34 ± 6.16 (mean ± standard deviation) years, 174.41 ± 6.18 cm, 71.21 ± 8.46 kg, and 23.37 ± 2.03 kg/m2, respectively. There were no clinically relevant differences in demographic characteristics among subjects administered the three sequences of drugs.
Both formulations were absorbed rapidly with a median Tmax of 0.75 h. The Cmax values for the FDC and loose combination were 410.58 ± 266.72 μg/L and 372.81 ± 226.57 μg/L, respectively, and the AUClast were 957.56 ± 354.11 h*μg/L and 929.63 ± 315.41 h*μg/L, respectively (Table 1). The GMR (90% CIs) values of the FDC to the loose combination for Cmax and AUClast were 1.08 (0.93–1.24) and 1.02 (0.97–1.08), respectively. The plasma concentration according to time profiles of fimasartan between the FDC and loose combination after a single oral dose were similar, including both absorption and elimination phases (Figure 2).
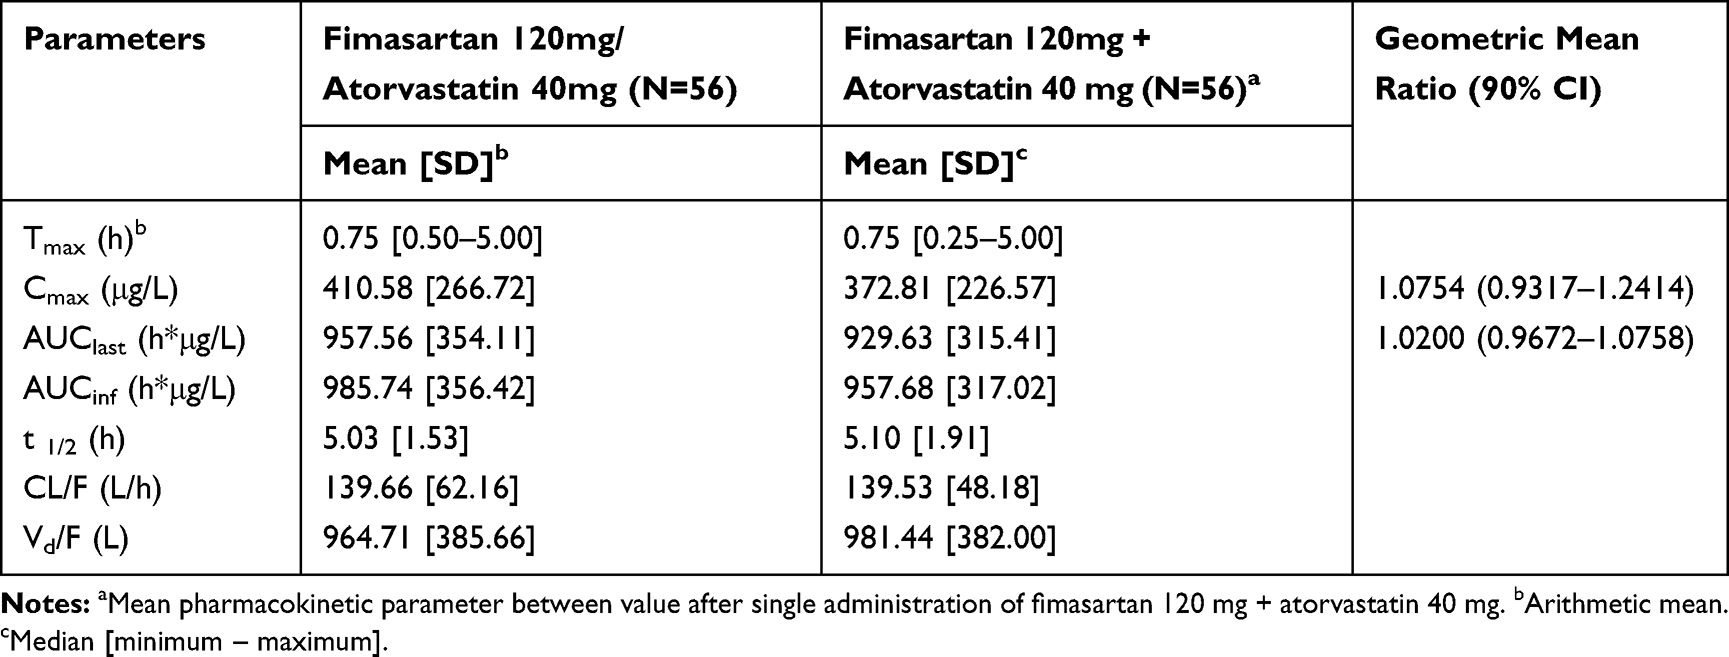 |
Table 1 Summary of Pharmacokinetic Parameters of Fimasartan After a Single Administration of FDC of Fimasartan 120mg/Atorvastatin 40mg or Loose Combination of Fimasartan 120mg+Atorvastatin 40mg |
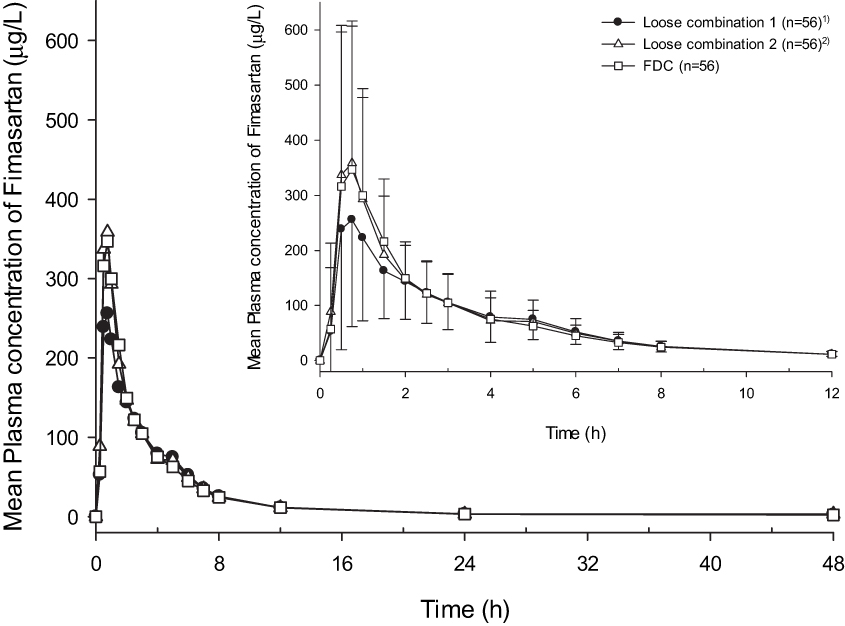 |
Figure 2 Mean plasma concentration–time profiles for fimasartan after a single administration of fimasartan 120mg/atorvastatin 40mg or fimasartan 120mg + atorvastatin 40mg (Inlet: 0–12h). Notes: 1) The first time a subject received fimasartan 120mg+atorvastatin 40 mg. 2) The second time a subject received fimasartan 120mg+atorvastatin 40 mg. |
The Cmax values for the FDC and loose combination were 42.04 ± 23.10 μg/L and 41.48 ± 23.07 μg/L, respectively, and the AUClast were 111.80 ± 57.17 h*μg/L and 109.93 ± 58.45 h*μg/L, respectively (Table 2). The GMR (90% CIs) values of the FDC to the loose combination of Cmax and AUClast were 1.02 (0.92–1.13) and 1.02 (0.97–1.07), respectively. The plasma concentration according to time profiles and the PK parameters of atorvastatin were comparable between both the drugs (Figure 3).
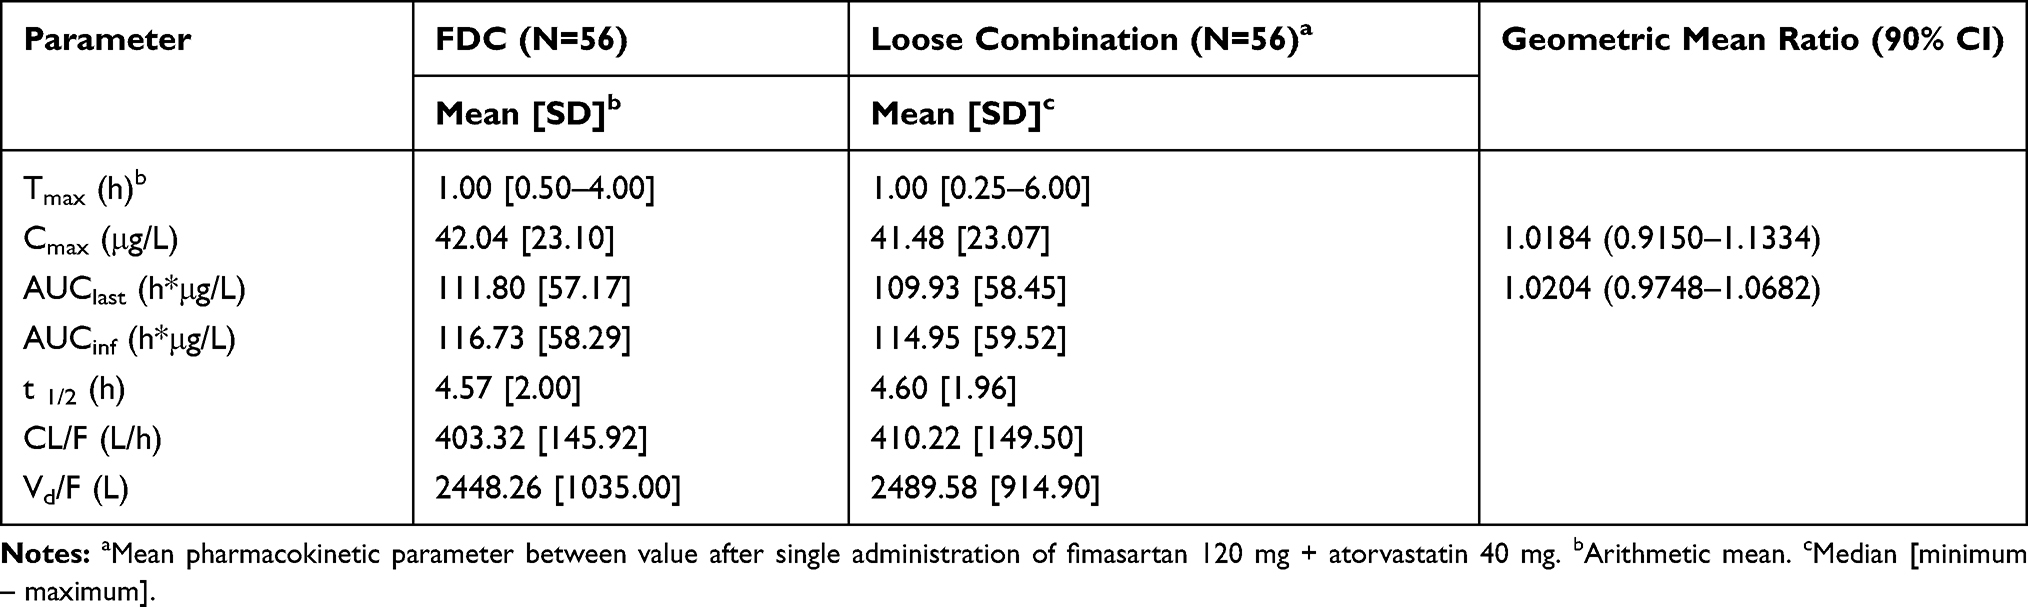 |
Table 2 Summary of Pharmacokinetic Parameters of Atorvastatin After a Single Administration of FDC of Fimasartan 120mg/Atorvastatin 40mg or Loose Combination of Fimasartan 120mg+Atorvastatin 40mg |
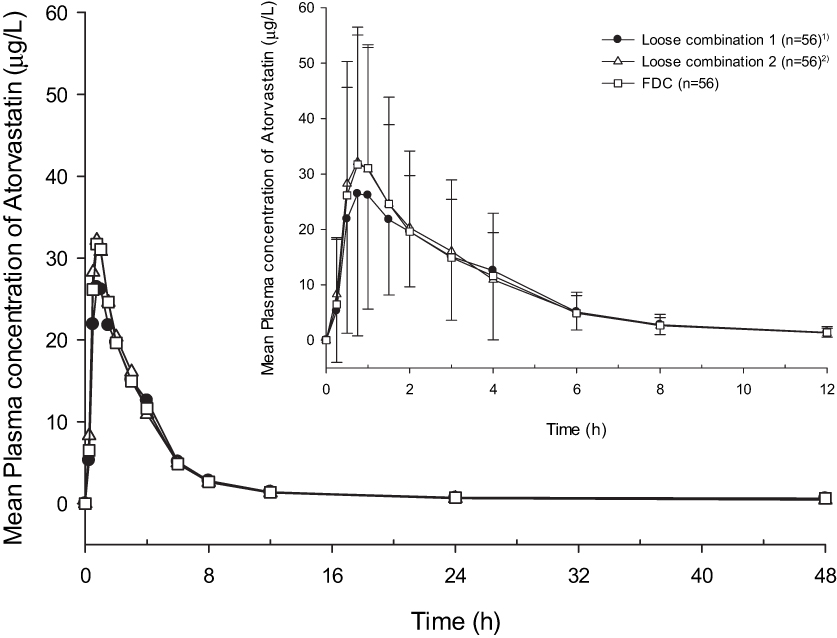 |
Figure 3 Mean plasma concentration–time profiles for atorvastatin after a single administration of fimasartan 120mg/atorvastatin 40mg or fimasartan 120mg + atorvastatin 40mg (Inlet: 0–12h). Notes: 1) The first time a subject received fimasartan 120mg+atorvastatin 40 mg. 2) The second time a subject received fimasartan 120mg+atorvastatin 40 mg. |
The calculated intra-subject CV of Cmax of fimasartan was 60.56% and the expanded 90% CI for scaled average BE was between 0.6539 and 1.5293. The corresponding values of atorvastatin were 44.14% and between 0.7257 and 1.3780, respectively (Table 3). The GMR with 90% CIs for Cmax of both fimasartan and atorvastatin were within the conventional acceptable range of 0.80–1.25 as well as the expanded range calculated by intra-subject CV. Corresponding values for AUClast of both fimasartan and atorvastatin were also within the conventional BE range.
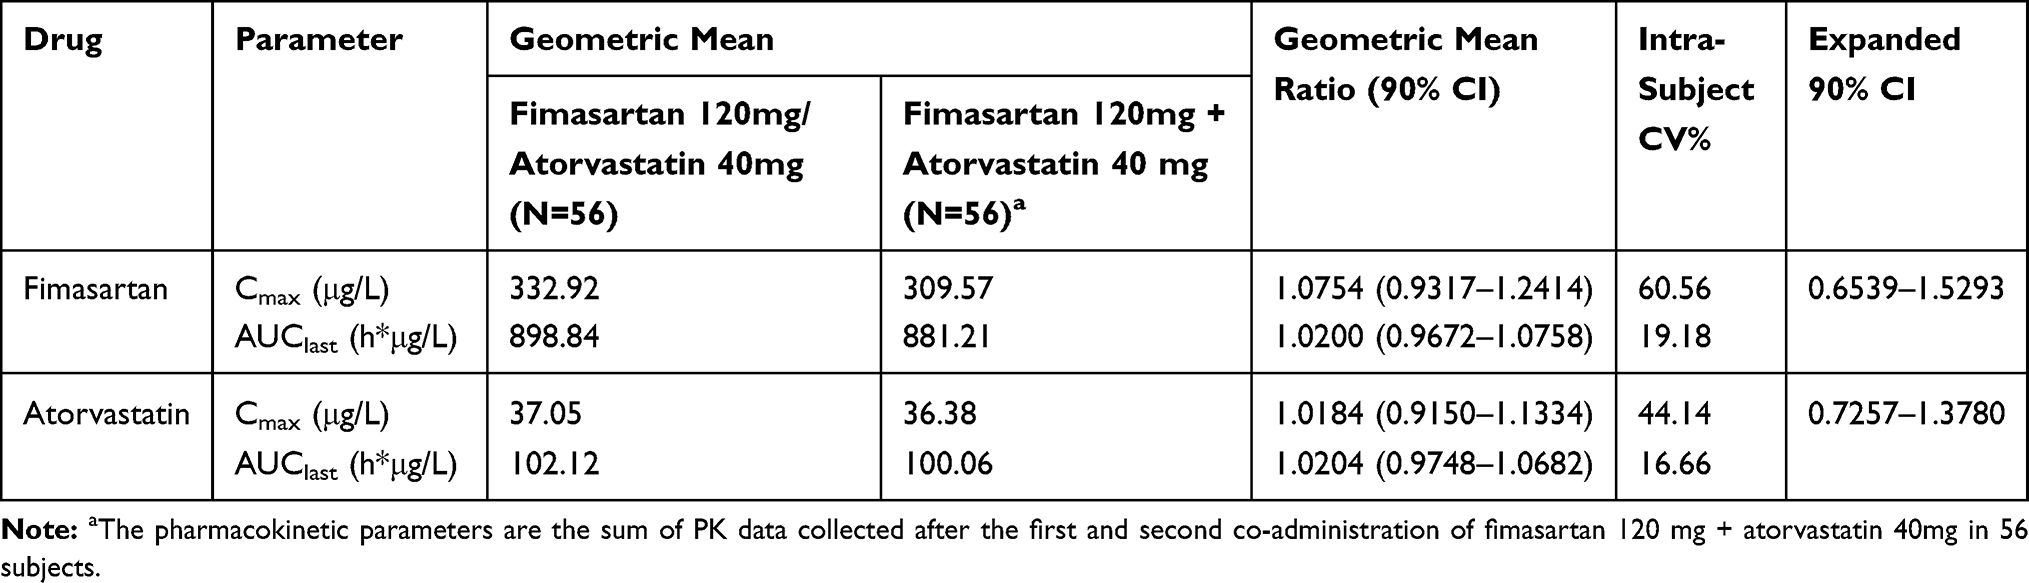 |
Table 3 Comparison of Pharmacokinetic Parameters of Fimasartan and Atorvastatin After a Single Administration of FDC of Fimasartan 120mg/Atorvastatin 40mg or Loose Combination of Fimasartan 120mg+Atorvastatin 40mg |
Safety and Tolerability
In the 60 subjects who were administrated the drug at least one time, a total of 54 adverse events were observed in 22 subjects. Among these, 15 adverse events in 9 subjects had a causal relationship with the investigational drug (adverse drug reactions). Two events occurred in two subjects (3.51%) who were administered fimasartan/atorvastatin FDC and 13 events occurred in 8 subjects (13.33%) who were administered loose combination. All the events were concluded mild in intensity and resolved without sequelae. There were no serious adverse events.
There were no clinically significant findings in physical examinations or electrocardiograms and routine laboratory parameters.
Discussion
Before the PK analysis, data visualization and the Kolmogorov–Smirnov test were used to confirm the data normality. As a result, p-values for Cmax and AUClast of Fimasartan were 0.099 and 0.066, respectively, and the corresponding values of atorvastatin were>0.15 and 0.042, respectively. Although the p-value of AUClast of atorvastatin showed lower than 0.05, it can be appropriate to use parametric method such as ANOVA considering the distribution of data and FDA’s Guideline for Statistical Analysis of Bioequivalence for the data with replicated crossover design trial.15
Fimasartan and atorvastatin are known as highly variable drugs; therefore, we chose the partial-replicated design of 2-treatment, 3-sequence, and 3-period for the scaled BE approach. Highly variable drugs are defined as drugs with intra-subject variability larger than 30% for a PK parameter. Trials aimed at proving conventional BE of PK parameters for highly variable drugs require many subjects. Considering these aspects, a scaled BE method that adjusts the BE criteria using intra-subject CV has been adopted for BE studies of highly variable drugs. The new criteria can be calculated from the studies with a partial-replicated design or full-replicated design. Thus, regulatory agencies including the Food and Drug Administration (FDA) and European Medicines Agency (EMA) have recommended the use of the expanded 90% CIs of GMR for BE assessment of highly variable drugs through BE studies with a full or partial replicated crossover design.14 (Table 4). The partial-replicated crossover design has the same advantage which can calculate intra-subject variability but requires fewer subjects and costs than a fully replicated crossover study.16
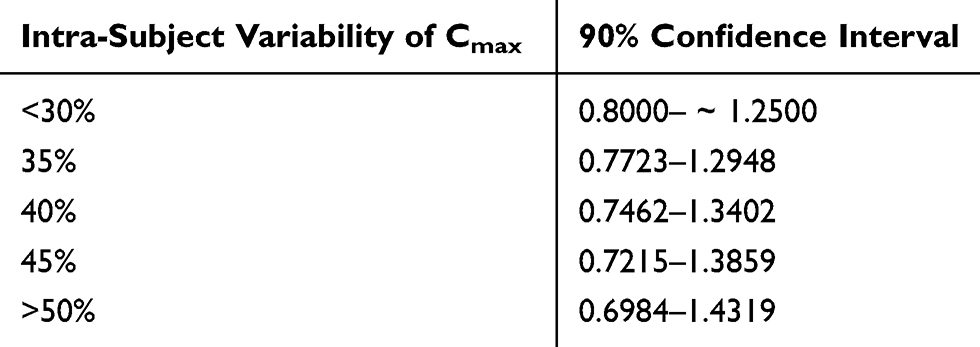 |
Table 4 Example of Expanded 90% Confidence Interval Using Intra-Subject Variability (EMA, MFDS) |
The data about PK parameter of fimasartan and atorvastatin were collected by published literatures and previous clinical trials. The intra-subject CV of Cmax of fimasartan ranged from 48% to 65%, and the range for atorvastatin was 39% to 45%.7,17-19 Based on these features, we set the number of subjects based on the CV of 65% which showed the largest variation among the PK parameters of fimasartan and atorvastatin. Approximately 124 subjects were needed to prove the PK equivalence with ɑ = 0.05 and power = 80% through a conventional 2 × 2 crossover study. In contrast, only 93 subjects could satisfy the same condition using a partial-replicated crossover design. Therefore, this study was performed using the scaled BE approach through a partial crossover design.
In this study, the intra-subject CV of Cmax of fimasartan (Figure 4) and atorvastatin were 60.56% and 44.14%, respectively. CV of AUClast of fimasartan and atorvastatin were 19.18% and 16.66% (Table 3). Mean Cmax was observed lower at the second dose of Fimasartan 120 mg + atorvastatin 40 mg than at the first dose, but this may be due to the high variability that described above. Additionally, there was no significant sequence effect in ANOVA analysis. The CV of Cmax is greater than AUClast because Cmax is measured using a pre-defined blood sampling time point (Tmax) but AUC is calculated through the entire distribution of the drug using all blood collection time points.
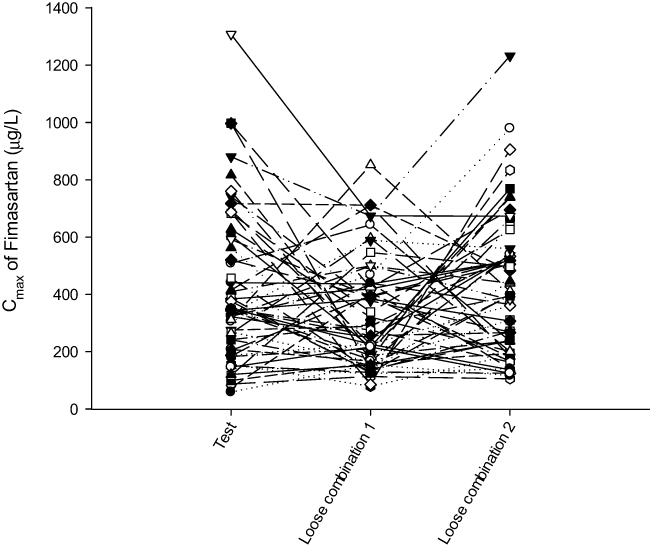 |
Figure 4 Spaghetti plot of Cmax of fimasartan. |
Using the highest value (60.56%) of the intra-subject CVs in this study, 109 and 84 subjects are statistically enough to meet the conventional BE criteria of 90% CIs (0.8–1.25) through a BE study with a 2 × 2 crossover design and 3 × 3 partial replicated design, respectively, with ɑ = 0.05 and power = 80%. However, 42 and 32 subjects are enough to fit the BE criteria through the corresponding designs when using the expanded 90% CIs. The results showed that the partial-replicated crossover design reduces the number of subjects for the BE study of highly variable drugs with ensured statistical stability. Furthermore, it is expected that the study result can be used for other clinical studies including BE studies of fimasartan and atorvastatin.
Conclusion
There were no significant PK differences between FDC of fimasartan/atorvastatin (120/40 mg) and their loose combination. Cmax and AUClast of fimasartan and atorvastatin were within the expanded BE and conventional criteria.
Acknowledgments
The abstract of this paper was presented was presented at the 2018 annual meeting of ASCPT (American Society for Clinical Pharmacology and Therapeutics) as a poster presentation with interim findings. The abstract of this paper was published in “Volume 103, Issue S1” in Clinical Pharmacology and Therapeutics.
Disclosure
Dr Jun Gi Hwang reports grants from Boryung Pharmaceutical CO., LTD, during the conduct of the study. The authors report no other conflicts of interest in this work.
References
1. Tunstall-Pedoe H, Chen R, Kramarz P. Prevalence of individuals with both raised blood pressure and raised cholesterol in WHO MONICA project population surveys 1989–97. Pharmacoepidemiol Drug Saf. 2004;13(Suppl 1):S307–S308.
2. Egan BM, Li J, Qanungo S, Wolfman TE. Blood pressure and cholesterol control in hypertensive hypercholesterolemic patients: national health and nutrition examination surveys 1988–2010. Circulation. 2013;128(1):29–41. doi:10.1161/CIRCULATIONAHA.112.000500
3. Ivanovic B, Tadic M. Hypercholesterolemia and hypertension: two sides of the same coin. Am J Cardiovasc Drugs. 2015;15(6):403–414. doi:10.1007/s40256-015-0128-1
4. Whelton PK, Carey RM, Aronow WS, et al. 2017 ACC/AHA/AAPA/ABC/ACPM/AGS/APhA/ASH/ASPC/NMA/PCNA guideline for the prevention, detection, evaluation, and management of high blood pressure in adults: a report of the American College of Cardiology/American Heart Association Task Force on Clinical Practice Guidelines. J Am Coll Cardiol. 2018;71(19):e127–e248. doi:10.1016/j.jacc.2017.11.006
5. Dahlöf B. Cardiovascular disease risk factors: epidemiology and risk assessment. Am J Cardiol. 2010;105(1):3A–9A. doi:10.1016/j.amjcard.2009.10.007
6. Nickenig G. Should angiotensin II receptor blockers and statins be combined? Circulation. 2004;110:1013–1020. doi:10.1161/01.CIR.0000139857.85424.45
7. Yi S, Kim T-E, Yoon SH, et al. Pharmacokinetic interaction of fimasartan, a new angiotensin II receptor antagonist, with amlodipine in healthy volunteers. J Cardiovasc Pharmacol. 2011;57(6):682–689. doi:10.1097/FJC.0b013e31821795d0
8. Lennernäs H. Clinical pharmacokinetics of atorvastatin. Clin Pharmacokinet. 2003;42(13):1141–1160. doi:10.2165/00003088-200342130-00005
9. Ghim J-L, Paik SH, Hasanuzzaman M, et al. Absolute bioavailability and pharmacokinetics of the angiotensin II receptor antagonist fimasartan in healthy subjects. J Clin Pharmacol. 2016;56(5):576–580. doi:10.1002/jcph.618
10. Park J, Kim CO, Jin BH, et al. Pharmacokinetic drug interaction between atorvastatin and ezetimibe in healthy Korean volunteers. Transl Clin Pharmacol. 2017;25(4):202–208. doi:10.12793/tcp.2017.25.4.202
11. Davit BM, Conner DP, Fabian-Fritsch B, et al. Highly variable drugs: observations from bioequivalence data submitted to the FDA for new generic drug applications. AAPS J. 2008;10(1):148–156. doi:10.1208/s12248-008-9015-x
12. Choi Y, Lee S, Jang I-J, et al. Pharmacokinetic interaction between fimasartan and atorvastatin in healthy male volunteers. Drug Des Devel Ther. 2018;12:2301. doi:10.2147/DDDT.S165171
13. Stern RH, Yang -B-B, Hounslow NJ, et al. Pharmacodynamics and pharmacokinetic‐pharmacodynamic relationships of atorvastatin, an HMG‐CoA reductase inhibitor. J Clin Pharmacol. 2000;40(6):616–623. doi:10.1002/j.1552-4604.2000.tb05987.x
14. Committee for Medicinal Products for Human Use. Guideline on the Investigation of Bioequivalence. London: European Medicines Agency; 2010.
15. Food and Drug Administration. Guidance for Industry: Statistical Approaches to Establishing Bioequivalence. Washington, DC: FDA; 2001.
16. Hyslop T, Iglewicz B. Alternative cross-over designs for individual bioequivalence.
17. Jeon H, Lim KS, Shin K-H, et al. Assessment of the drug–drug interactions between fimasartan and hydrochlorothiazide in healthy volunteers. J Cardiovasc Pharmacol. 2012;59(1):84–91. doi:10.1097/FJC.0b013e318237389e
18. Shin K-H, Kim T-E, Kim SE, et al. The effect of the newly developed angiotensin receptor II antagonist fimasartan on the pharmacokinetics of atorvastatin in relation to OATP1B1 in healthy male volunteers. J Cardiovasc Pharmacol. 2011;58(5):492–499. doi:10.1097/FJC.0b013e31822b9092
19. Whitfield LR, Porcari AR, Alvey C, et al. Effect of gemfibrozil and fenofibrate on the pharmacokinetics of atorvastatin. J Clin Pharmacol. 2011;51(3):378–388. doi:10.1177/0091270010366446
 © 2020 The Author(s). This work is published and licensed by Dove Medical Press Limited. The full terms of this license are available at https://www.dovepress.com/terms.php and incorporate the Creative Commons Attribution - Non Commercial (unported, v3.0) License.
By accessing the work you hereby accept the Terms. Non-commercial uses of the work are permitted without any further permission from Dove Medical Press Limited, provided the work is properly attributed. For permission for commercial use of this work, please see paragraphs 4.2 and 5 of our Terms.
© 2020 The Author(s). This work is published and licensed by Dove Medical Press Limited. The full terms of this license are available at https://www.dovepress.com/terms.php and incorporate the Creative Commons Attribution - Non Commercial (unported, v3.0) License.
By accessing the work you hereby accept the Terms. Non-commercial uses of the work are permitted without any further permission from Dove Medical Press Limited, provided the work is properly attributed. For permission for commercial use of this work, please see paragraphs 4.2 and 5 of our Terms.