")
Back to Journals » International Journal of Chronic Obstructive Pulmonary Disease » Volume 13
Comparison of the fixed ratio and the Z-score of FEV1/FVC in the elderly population: a long-term mortality analysis from the Third National Health and Nutritional Examination Survey
Authors Oh DK, Baek S, Lee SW , Lee JS , Lee SD, Oh YM
Received 5 August 2017
Accepted for publication 28 December 2017
Published 14 March 2018 Volume 2018:13 Pages 903—915
DOI https://doi.org/10.2147/COPD.S148421
Checked for plagiarism Yes
Review by Single anonymous peer review
Peer reviewer comments 2
Editor who approved publication: Dr Richard Russell
Dong Kyu Oh,1 Seunghee Baek,2 Sei Won Lee,1 Jae Seung Lee,1 Sang-Do Lee,1 Yeon-Mok Oh1
1Department of Pulmonary and Critical Care Medicine, Clinical Research Center for Chronic Obstructive Airway Diseases, Asan Medical Center, University of Ulsan College of Medicine, Seoul, South Korea; 2Department of Clinical Epidemiology and Biostatistics, Asan Medical Center, University of Ulsan College of Medicine, Seoul, South Korea
Background and objective: Despite the ongoing intense debate on the definition of airflow limitation by spirometry in the elderly population, there have only been few studies comparing the fixed ratio and the Z-score of forced expiratory volume in 1 second (FEV1)/forced vital capacity (FVC) in terms of long-term mortalities. In this study, we aimed to identify the proper method for accurately defining the airflow limitation in terms of long-term mortality prediction in the elderly population.
Methods: Data were collected from the Third National Health and Nutrition Examination Survey in the US. Non-Hispanic Caucasians aged 65–80 years were included. The receiver operating characteristic (ROC) curves of both methods were plotted and compared for 10-year all-cause, respiratory, and COPD mortalities.
Results: Of 1,331 subjects, the mean age was 71.7 years and 805 (60.5%) were males. For the 10-year all-cause mortality, the area under the curve (AUC) of the fixed ratio was significantly greater than that of the Z-score of FEV1/FVC, but both showed poor prediction performance (0.633 vs 0.616, p<0.001). For the 10-year respiratory and COPD mortalities, both the fixed ratio and the Z-score of FEV1/FVC showed comparable prediction performance with greater AUCs (0.784 vs 0.778, p=0.160, and 0.896 vs 0.896, p=0.971, respectively). Interestingly, the conventional cutoff of 0.7 in the fixed ratio was consistently higher than the optimal for the 10-year all-cause, respiratory, and COPD mortalities (0.70 vs 0.69, 0.62, and 0.61, respectively), whereas that of -1.64 in the Z-score of FEV1/FVC was consistently lower than the optimal cutoff (-1.64 vs -1.31, -1.47, and -1.41, respectively).
Conclusion: In the elderly population, both the fixed ratio and the Z-score of FEV1/FVC showed comparable prediction performance for the 10-year respiratory and COPD mortalities. However, the conventional cutoff of neither 0.70 in the fixed ratio nor -1.64 in the Z-score of FEV1/FVC was optimal for predicting the long-term mortalities.
Keywords: airway obstruction, chronic obstructive pulmonary disease, mortality, pulmonary disease, ROC curve, spirometry
Introduction
COPD is a major cause of morbidity and mortality worldwide, and the socioeconomic burden of the disease is rapidly increasing.1–3 As the airflow limitation is a distinct feature of COPD, spirometry has been widely used for its diagnosis.2–7 However, the proper method for defining the airflow limitation by spirometry has yet to be fully established and is under intense debate, particularly regarding the elderly population.8,9
For example, the fixed ratio that defines the airflow limitation as the ratio of forced expiratory volume in 1 second (FEV1) to forced vital capacity (FVC) less than a fixed cutoff, such as 0.70, has been used frequently due to the simplicity3,10–12 but has been disputed because of the possibility of overdiagnosis, especially in the elderly population.5,7,13–16 On the other hand, the Z-score or lower limit of normal of FEV1/FVC have been considered as being less influenced by the age-related issues, because it defines the pathologic state by taking into account the age-adjusted normal reference.5,7,13–16 However, this method has been criticized as well because of the complexity and the risk of underdiagnosis.17,18
As there is no gold standard for defining the airflow limitation particularly in the elderly population, several studies have compared the fixed ratio and the Z-score or lower limit of normal of FEV1/FVC using various clinical outcomes such as respiratory symptoms, FEV1 declines, emergency department visits, and respiratory- or COPD-related hospitalizations.19–22 However, there have only been a few studies comparing both methods in terms of the long-term mortality, which is the most robust and reliable outcome in clinical studies.23,24 Therefore, we performed a study to identify the proper method for defining the airflow limitation in terms of long-term mortalities in the elderly population. In addition, because there is a lack of evidence that the conventional cutoffs of 0.70 in the fixed ratio and −1.64 in the Z-score of FEV1/FVC are the optimal values for predicting long-term mortalities in the elderly population, we also examined the optimality of the conventional cutoffs in both methods.
Methods
Study design and population
We used the data from the Third National Health and Nutrition Examination Survey in the US (US NHANES III), which were utilized in our previous study.25 Briefly, non-Hispanic Caucasians (aged 17–80 years) with three or more acceptable spirometry results were included in our previous study.25 Among them, subjects who were aged ≥65 years were included and those with possible restrictive disease defined as both FVC <80% of predicted value and FEV1/FVC ≥0.70 were excluded from the study (Figure 1).
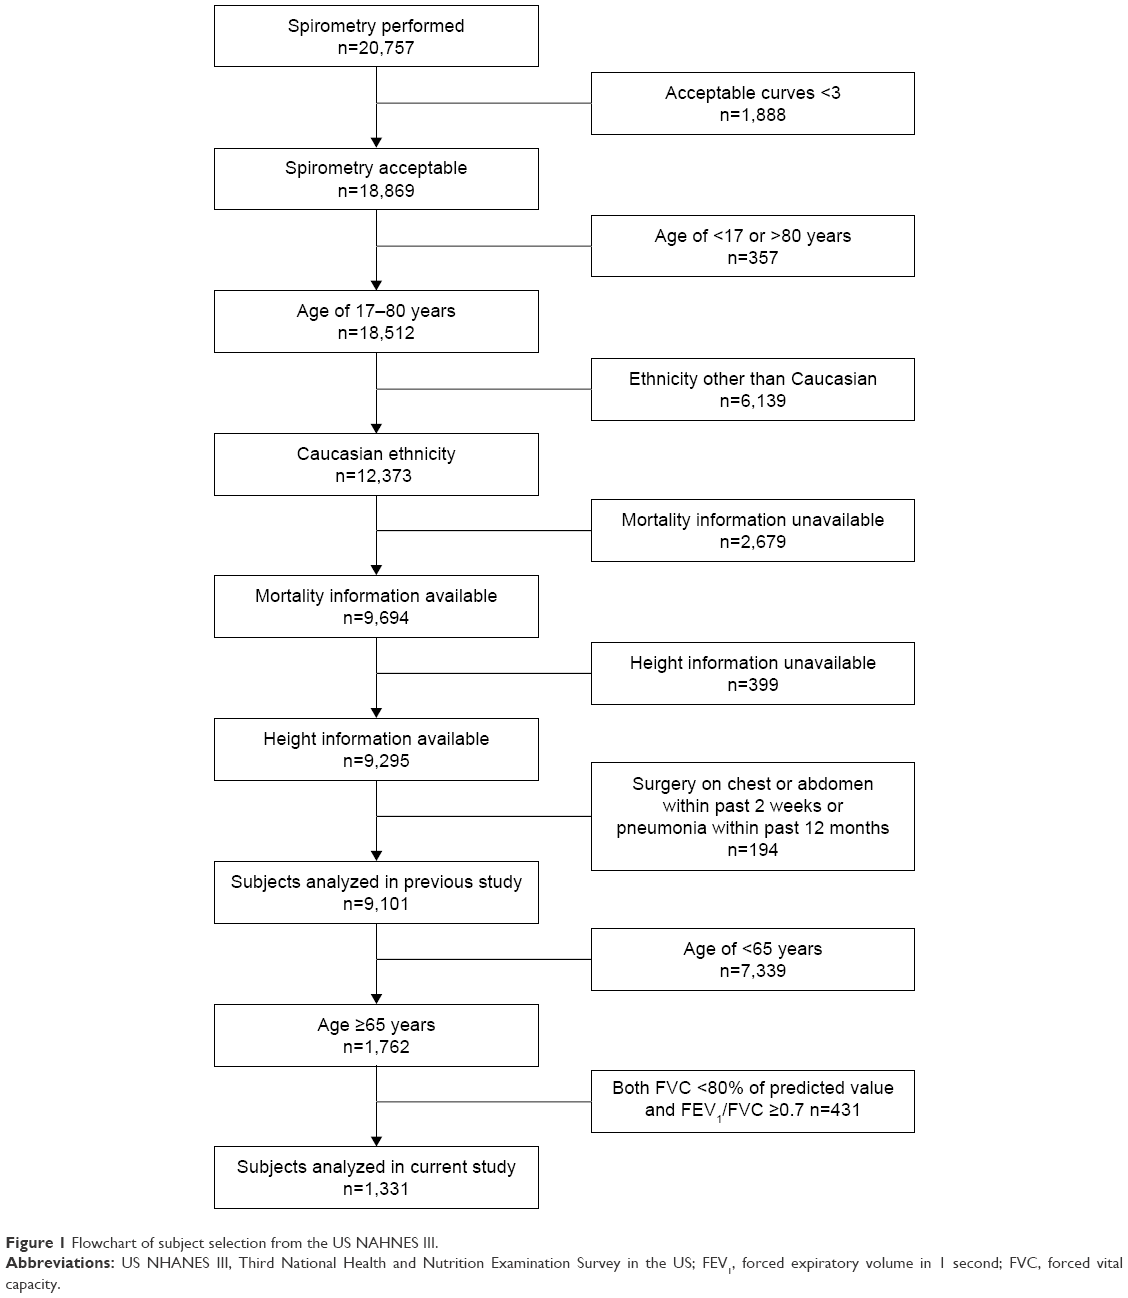 | Figure 1 Flowchart of subject selection from the US NAHNES III. |
The spirometry results and mortality status of the subjects during 10-year of follow-up were collected in addition to the demographic data including age, sex, height, smoking history, and comorbidities. The cause of death was assessed in each fatal case, and the mortality was reclassified into 10-year all-cause, respiratory, and COPD mortalities. For these outcomes, the receiver operating characteristic (ROC) curves of both the fixed ratio and the Z-score of FEV1/FVC were plotted. The preferred method was assessed by comparing the areas under the curve (AUCs) of both methods for the long-term mortalities.
The optimal cutoff that shows the highest Youden index (sensitivity + specificity - 1) was assessed in each ROC curve and compared to the conventional cutoffs – 0.70 in the fixed ratio and −1.64 in the Z-score of FEV1/FVC – as appropriate. Performance indices such as sensitivity, specificity, positive likelihood ratio (LR+), and negative likelihood ratio (LR-) were also calculated and compared at both the conventional and optimal cutoffs.
The study was approved by the institutional review board of Asan Medical Center (approval number: 2016-0198). Since the data of US NHANES III were de-identified and freely open to the public, no US institutional review board approval was required.
Spirometry results
We performed the study using the data from the US NHANES III, and the manner of the spirometry measurement used in the survey was described previously.25,26 Briefly, each subject attempted to perform at least five FVC maneuvers and was requested to meet the acceptability and reproducibility criteria of the American Thoracic Society (ATS). Bronchodilators were not used for the spirometry. The spirometry system had been independently tested and proved to be qualified for the spirometry equipment recommendations of the ATS.
The Z-scores of spirometry values were calculated using the lambda-mu-sigma (LMS) method, by which the spirometry values of median (mu), coefficient of variation (sigma), and skewness (lambda) were modeled.25,27,28 The reference spirometry values obtained from Hankinson were preferred in this study, since they were derived from the US NHANES III as well.26 In addition, we repeated the analyses using the reference spirometry values from the Global Lung Function Initiative (GLI), which is available at the official website of GLI (http://www.ers-education.org/guidelines/global-lung-function-initiative.aspx).29,33
Mortality data
The US NHANES III provided mortality data based on the National Death Index, and we reclassified them into 10-year all-cause, respiratory, and COPD mortalities. Respiratory and COPD mortalities were defined using the 10th revision of the International Classification of Diseases (ICD-10) codes J10–J98 and J40–J47, respectively. The codes for asthma, J45 and J46, were included in the respiratory mortality but excluded from the COPD mortality.
Statistical analysis
Results for continuous variables were expressed as mean ± standard deviation and those for categorical variables were expressed as absolute frequency and percentage. The AUCs were expressed with 95% confidence interval, and DeLong’s method was used for the comparison. A p-value of <0.05 was considered as statistically significant. All statistical analyses were completed using SPSS version 21.0 for Windows (IBM Corporation, Armonk, NY, USA) and MedCalc, version 17.5.5 for Windows (MedCalc Software bvba, Ostend, Belgium).
Results
Subject characteristics
Among 1,331 subjects included in the study, the mean age was 71.7±4.5 years and 805 (60.5%) were males. In all, 808 (60.7%) subjects had smoking history. The mean value of FEV1/FVC was 0.68±0.10 and that of Z-score of FEV1/FVC was −0.71±0.91 (Table 1). During the 10-year follow-up, mortality from any cause occurred in 490 (36.8%) subjects, while 48 (3.6%) and 29 (2.2%) mortalities were related to the respiratory and COPD causes, respectively.
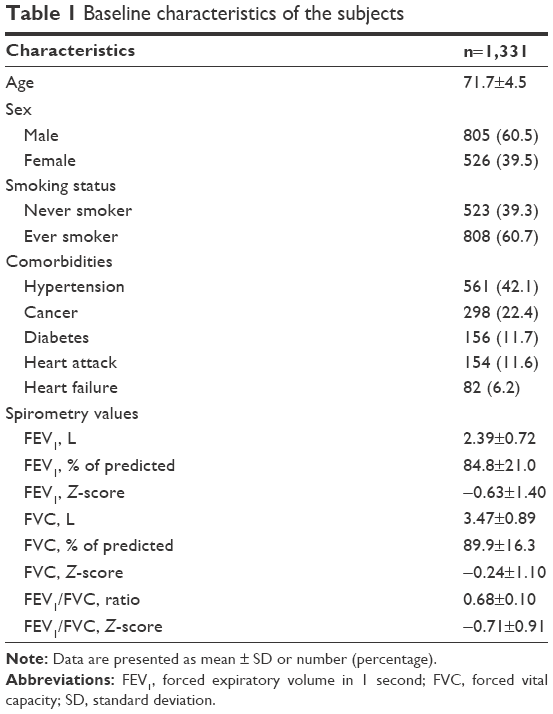 | Table 1 Baseline characteristics of the subjects |
Prediction performance of the fixed ratio and the Z-score of FEV1/FVC for the mortalities in the elderly population
For 10-year all-cause mortality, the AUC of the fixed ratio was significantly greater than that of the Z-score of FEV1/FVC (0.633 [0.607–0.659] vs 0.616 [0.589–0.642], p<0.001, respectively; Figure 2A). For 10-year respiratory and COPD mortalities, the fixed ratio and the Z-score of FEV1/FVC showed comparable prediction performance with greater AUCs (0.784 [0.761–0.806] vs 0.778 [0.755–0.800], p=0.160, for 10-year respiratory mortality and 0.896 [0.878–0.912] vs 0.896 [0.878–0.912], p=0.971, for 10-year COPD mortality, respectively; Figure 2B and C). In the analysis using the reference values from GLI, both the fixed ratio and the Z-score of FEV1/FVC showed similar results (0.633 [0.606–0.659] vs 0.607 [0.581–0.634], p<0.001, for 10-year all-cause mortality; 0.784 [0.761–0.806] vs 0.774 [0.751–0.796], p=0.073, for 10-year respiratory mortality; and 0.896 [0.878–0.912] vs 0.895 [0.877–0.911], p=0.844, for 10-year COPD mortality, respectively; Figure S1).
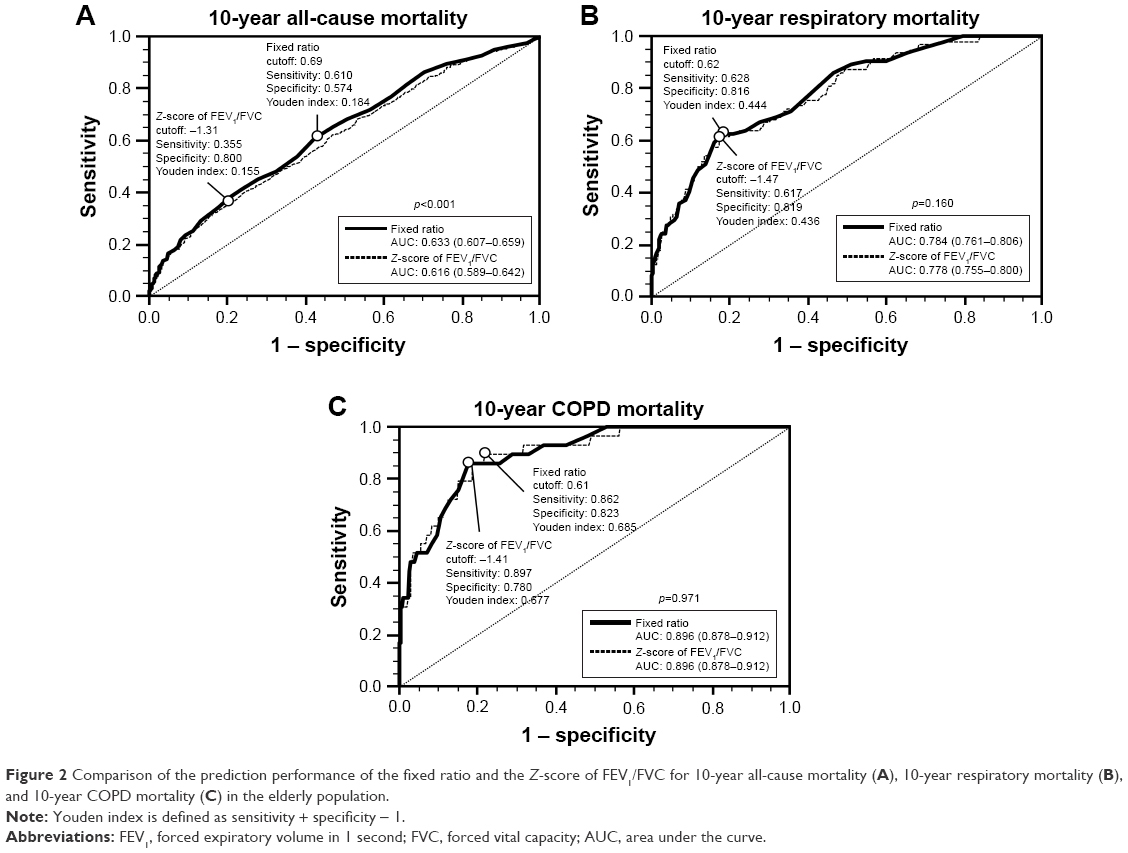 | Figure 2 Comparison of the prediction performance of the fixed ratio and the Z-score of FEV1/FVC for 10-year all-cause mortality (A), 10-year respiratory mortality (B), and 10-year COPD mortality (C) in the elderly population. |
Cutoffs and performance indices of the fixed ratio for the mortalities in the elderly population
For 10-year all-cause, respiratory, and COPD mortalities, the optimal cutoffs of the fixed ratio were 0.69, 0.62, and 0.61, respectively, and the conventional cutoff of 0.70 was consistently higher than the optimal values (Table 2 and Figure 3). Interestingly, regardless of the mortalities, the sensitivity of the conventional cutoff was consistently higher than that of the optimal cutoff (0.655 vs 0.610 for 10-year all-cause mortality, 0.894 vs 0.628 for 10-year respiratory mortality, and 1.000 vs 0.862 for 10-year COPD mortality, respectively). On the other hand, the specificity of the conventional cutoff was consistently lower than that of the optimal cutoff (0.528 vs 0.574 for 10-year all-cause mortality, 0.488 vs 0.816 for 10-year respiratory mortality, and 0.471 vs 0.823 for COPD mortality, respectively; Table 2 and Figure 3).
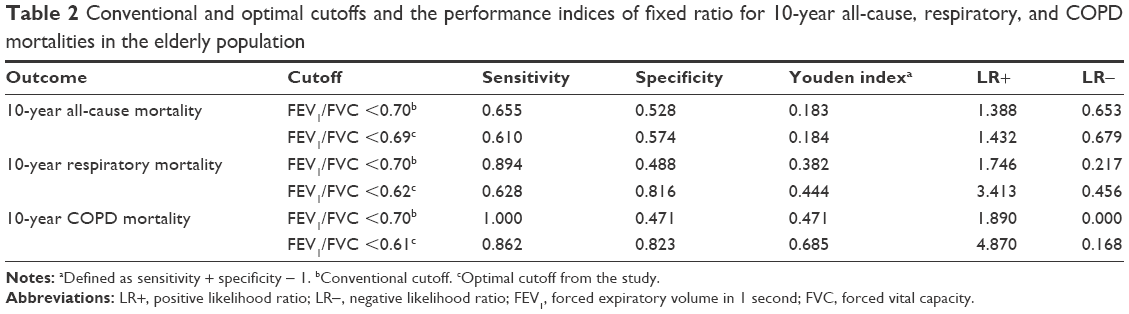 | Table 2 Conventional and optimal cutoffs and the performance indices of fixed ratio for 10-year all-cause, respiratory, and COPD mortalities in the elderly population |
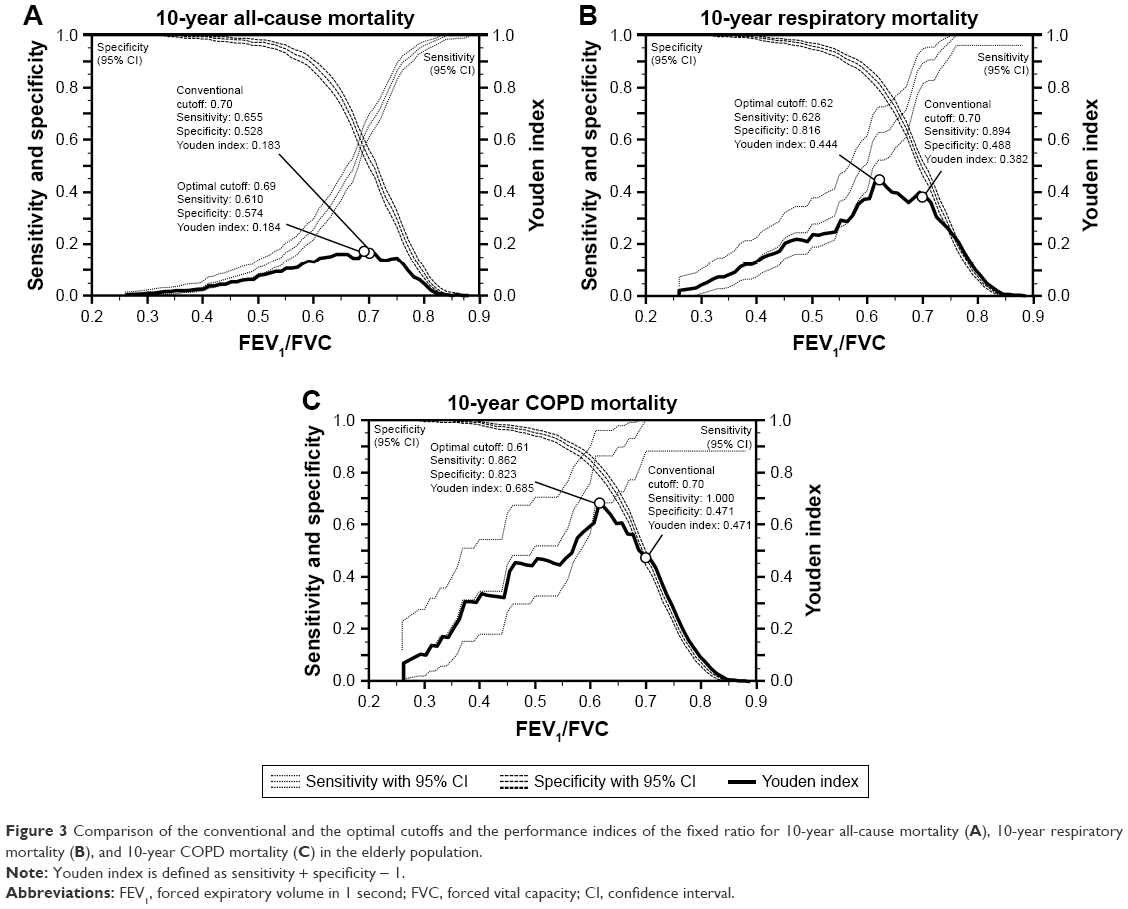 | Figure 3 Comparison of the conventional and the optimal cutoffs and the performance indices of the fixed ratio for 10-year all-cause mortality (A), 10-year respiratory mortality (B), and 10-year COPD mortality (C) in the elderly population. |
Cutoffs and performance indices of the Z-score of FEV1/FVC for the mortalities in the elderly population
For 10-year all-cause, respiratory, and COPD mortalities, the optimal cutoffs of the Z-score of FEV1/FVC were −1.31 (9th–10th percentile), −1.47 (7th–8th percentile), and −1.41 (7th–8th percentile), respectively; in contrast to the fixed ratio, the conventional cutoff of −1.64 (5th percentile) was consistently lower than the optimal values (Table 3 and Figure 4). For the performance indices, the sensitivity of the conventional cutoff was consistently lower than that of the optimal cutoffs (0.245 vs 0.355 for 10-year all-cause mortality, 0.521 vs 0.617 for 10-year respiratory mortality, and 0.724 vs 0.897 for 10-year COPD mortality, respectively). On the other hand, the specificity of the conventional cutoff was consistently higher than that of the optimal cutoff (0.892 vs 0.800 for 10-year all-cause mortality, 0.869 vs 0.819 for 10-year respiratory mortality, and 0.854 vs 0.780 for 10-year COPD mortality, respectively; Table 3 and Figure 4). When the reference values from GLI were used for the analysis, the optimal cutoffs of the Z-score of FEV1/FVC for 10-year mortalities were “left shifted” and were −1.76 (3rd–4th percentile) for both 10-year all-cause and respiratory mortalities and −1.58 (5th–6th percentile) for 10-year COPD mortality (Figure S2).
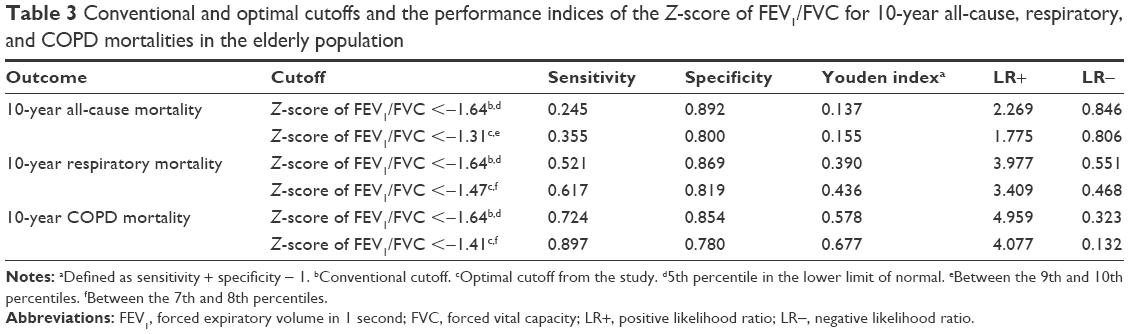 | Table 3 Conventional and optimal cutoffs and the performance indices of the Z-score of FEV1/FVC for 10-year all-cause, respiratory, and COPD mortalities in the elderly population |
 | Figure 4 Comparison of the conventional and the optimal cutoffs and the performance indices of the Z-score of FEV1/FVC for 10-year all-cause mortality (A), 10-year respiratory mortality (B), and 10-year COPD mortality (C) in the elderly population. |
Subgroup analysis by sex
In male elderly population (n=805), the AUCs of the fixed ratio for 10-year all-cause and respiratory mortalities were significantly greater than those of the Z-score of FEV1/FVC (0.633 [0.599–0.667] vs 0.624 [0.589–0.657], p<0.001, for 10-year all-cause mortality and 0.794 [0.764–0.821] vs 0.786 [0.756–0.814], p<0.001, for 10-year respiratory mortality, respectively). For 10-year COPD mortality, the fixed ratio and the Z-score of FEV1/FVC showed comparable prediction performance with greater AUCs (0.898 [0.875–0.918] vs 0.895 [0.872–0.916], p=0.415). The optimal cutoffs of the fixed ratio for 10-year all-cause, respiratory, and COPD mortalities were 0.71, 0.62, and 0.61, respectively and those of the Z-score of FEV1/FVC were −0.53 (29th–30th percentile), −1.41 (7th–8th percentile), and −1.41 (7th–8th percentile), respectively (Figure S3).
In the female elderly population (n=526), the AUC of the fixed ratio for 10-year all-cause mortality was significantly greater than that of the Z-score of FEV1/FVC (0.628 [0.585–0.670] vs 0.623 [0.580–0.664], p=0.033). For 10-year respiratory and COPD mortalities, the fixed ratio and the Z-score of FEV1/FVC showed comparable prediction performance with greater AUCs (0.764 [0.726–0.800] vs 0.769 [0.731–0.804], p=0.315, for 10-year respiratory mortality and 0.900 [0.872–0.925] vs 0.905 [0.877–0.929], p=0.561, for 10-year COPD mortality, respectively). The optimal cutoffs of the fixed ratio for 10-year all-cause, respiratory, and COPD mortalities were 0.69, 0.62, and 0.61, respectively, and those of the Z-score of FEV1/FVC were −1.45 (7th–8th percentile), −1.49 (6th–7th percentile), and −1.49 (6th–7th percentile), respectively (Figure S4).
Discussion
Although mortality is the most robust and reliable outcome of clinical studies on COPD, it has been rarely used for the comparison of the fixed ratio and the Z-score or lower limit of normal of FEV1/FVC because it requires high patient numbers and extended study duration.23,24 In this study, we compared the prediction performance of the fixed ratio and the Z-score of FEV1/FVC for 10-year all-cause, respiratory, and COPD mortalities, particularly in the elderly population, which is at the center of the debate on the definition of airflow limitation by spirometry. We found that both methods show comparable prediction performance for 10-year respiratory and COPD mortalities in the elderly population regardless of the reference values (Figures 2B and C and S1B and C). These results suggest that the fixed ratio and the Z-score or lower limit of normal of FEV1/FVC can both be used to define the airflow limitation in the elderly population and can be chosen according to the physician’s preference. Considering the advantage of the simplicity of the fixed ratio, we assume that the fixed ratio might be more favored in clinical settings, which is in line with the perspective of the Global Initiative for Chronic Obstructive Lung Disease (GOLD).3
On the other hand, for 10-year all-cause mortality, the fixed ratio consistently showed better prediction performance than the Z-score of FEV1/FVC in the elderly population (Figures 2A and S1A). However, we believe that it needs to be interpreted with caution because the low AUCs of both methods – 0.633 in the fixed ratio and 0.616 (or 0.607 with the reference values from GLI) in the Z-score of FEV1/FVC – indicate subpar prediction performance. These might stem from the heterogeneity of all-cause mortality. Since we limited the study population to those aged between 65 and 80 years, the subjects had a substantial number of comorbidities, including hypertension, diabetes, cancer, heart attack, and heart failure, that might influence the all-cause mortality (Table 1). Therefore, there might be a substantial number of mortalities independent of the pulmonary function, and the spirometry itself might be insufficient for predicting 10-year all-cause mortality in this high-comorbid population.
We also investigated the optimality of the conventional cutoffs for predicting 10-year all-cause, respiratory, and COPD mortalities in the elderly population. Although the conventional cutoffs – 0.70 in the fixed ratio and −1.64 in the Z-score of FEV1/FVC (5th percentile in the lower limit of normal) – have been widely used in clinical studies and practices, both cutoffs were defined as arbitrary by experts.16 We found that, regardless of mortalities, the conventional cutoff of 0.70 in the fixed ratio was consistently higher than the optimal cutoff with a higher sensitivity and a lower specificity (Table 2 and Figure 3). This is in line with the criticism that the fixed ratio may be prone to overdiagnosing the airflow limitation in the elderly population.5,7,13–16 On the other hand, the conventional cutoff of −1.64 in the Z-score of FEV1/FVC was consistently lower than the optimal cutoff with a lower sensitivity and a higher specificity (Table 3 and Figure 4). This also correlates well with the criticism that the Z-score or lower limit of normal of FEV1/FVC may be prone to underdiagnosing the airflow limitation in the elderly population.17,18 Thus, the conventional cutoffs of both the fixed ratio and the Z-score of FEV1/FVC may be biased in the elderly population and the over- and underdiagnosis of the airflow limitation might be affected by not only the innate characteristics of each method but also the biased cutoffs. However, we could not determine a single best cutoff from our study because the optimal cutoffs varied with the outcomes and because there was no consensus regarding the desirable clinical outcome for the comparison. Nevertheless, we believe that our findings are meaningful since they raise the awareness of the uncertain optimality of the conventional cutoffs.
In the analysis using the reference values from GLI, however, the optimal cutoffs of the Z-score of FEV1/FVC for 10-year mortalities were “left shifted” and those for both 10-year all-cause and respiratory mortalities were less than the current cutoff (−1.76 vs −1.64 for both mortalities; Figure S2). Considering the “left-shifted” distribution of the Z-scores of FEV1/FVC with the reference values from GLI in this elderly Caucasian population (Figures S5 and S6), we assume that the “left-shifted” optimal cutoffs might be influenced by the “left-shifted” distribution of the Z-scores. The geographic and time differences between the US NHANES III and GLI and the extreme age distribution of the subjects might contribute to these results, but we believe that the details should be investigated in further studies.
Since the study population was predominantly males, we performed the subgroup analysis by sex. Overall, the results were similar between the groups, but the optimal cutoffs of the fixed ratio and the Z-score of FEV1/FVC for 10-year all-cause mortality in male elderly population were “right shifted” with the optimal cutoffs of 0.71 in the fixed ratio and −0.53 in the Z-score of FEV1/FVC (Figure S3A). Considering that the male elderly subjects are prone to have comorbidities that might influence the mortalities, we assume that the spirometry itself might be insufficient for predicting 10-year all-cause mortality, particularly in male elderly population.
This study has several limitations. First, we evaluated the prediction performance of each method for defining the airflow limitation by spirometry using retrospectively collected mortality data. Although mortality is the most robust and reliable outcome in the clinical studies,24 the retrospective data on mortality might be confounded by inherent statistical biases.30,31 Second, although the ICD-10 codes were used for classifying the cause of death, there might be a potential error that may have influenced the results. However, the mortality status and cause of death of the subjects of the US NHANES III have been extensively validated in previous studies;18,25,28 therefore, we assume that the effect of potential error on the results of this study is minimal. Third, whereas post-bronchodilator spirometry is required for strict diagnostic criteria of both the fixed ratio and the Z-score of FEV1/FVC, it was not available in this general population-based survey. However, as Soriano and Mannino32 indicated, the clinical significance of bronchodilator responsiveness is not universally accepted and the importance of the post-bronchodilator spirometry is being challenged. Finally, since we only included Caucasian subjects aged 65–80 years, the general application of the results to other age or ethnic groups might be limited. However, considering that the debate on defining airflow limitation by spirometry is mainly over the elderly population, we believe that the investigation limited to this age group is necessary and has a distinct significance.
Conclusion
In the elderly population, both the fixed ratio and the Z-score of FEV1/FVC showed comparable prediction performance for 10-year respiratory and COPD mortalities. These suggest that both the fixed ratio and the Z-score or lower limit of normal FEV1/FVC can be used to define the airflow limitation in the elderly population, although we assume that the convenient fixed ratio might be favored by clinicians due to its simplicity.
In addition, the conventional cutoffs – 0.70 in the fixed ratio and −1.64 in the Z-score of FEV1/FVC – seem to provide biased results in the elderly population in that they may contribute to over- and underdiagnosis of the airflow limitation, respectively. Further investigation for defining a single best cutoff for each method is required.
Acknowledgments
This study was supported by the National Health Clinical Research (NHCR) from the Ministry of Health and Welfare, Republic of Korea (HC16C2254). We thank Dr Joon Seo Lim from the Scientific Publications Team at Asan Medical Center for his editorial assistance in preparing this manuscript.
Disclosure
The authors report no conflicts of interest in this work.
References
Pauwels RA, Rabe KF. Burden and clinical features of chronic obstructive pulmonary disease (COPD). Lancet. 2004;364(9434):613–620. | ||
Qaseem A, Wilt TJ, Weinberger SE, et al. Diagnosis and management of stable chronic obstructive pulmonary disease: a clinical practice guideline update from the American College of Physicians, American College of Chest Physicians, American Thoracic Society, and European Respiratory Society. Ann Intern Med. 2011;155(3):179–191. | ||
Vogelmeier CF, Criner GJ, Martinez FJ, et al. Global strategy for the diagnosis, management, and prevention of chronic obstructive lung disease 2017 report. GOLD executive summary. Am J Respir Crit Care Med. 2017;195(5):557–582. | ||
Miller MR, Hankinson J, Brusasco V, et al. Standardisation of spirometry. Eur Respir J. 2005;26(2):319–338. | ||
Pellegrino R, Viegi G, Brusasco V, et al. Interpretative strategies for lung function tests. Eur Respir J. 2005;26(5):948–968. | ||
Hogg JC. Pathophysiology of airflow limitation in chronic obstructive pulmonary disease. Lancet. 2004;364(9435):709–721. | ||
Bakke PS, Ronmark E, Eagan T, et al. Recommendations for epidemiological studies on COPD. Eur Respir J. 2011;38(6):1261–1277. | ||
Enright P, Brusasco V. Counterpoint: should we abandon FEV(1)/FVC <0.70 to detect airway obstruction? Yes. Chest. 2010;138(5):1040–1042. discussion 1042–1044. | ||
Celli BR, Halbert RJ. Point: should we abandon FEV(1)/FVC <0.70 to detect airway obstruction? No. Chest. 2010;138(5):1037–1040. | ||
Chronic Obstructive Pulmonary Disease. National clinical guideline on management of chronic obstructive pulmonary disease in adults in primary and secondary care. Thorax. 2004;59(suppl 1):1–232. | ||
Tunks M, Miller D. Canadian Thoracic Society recommendations for management of chronic obstructive pulmonary disease–2008 update–highlights for primary care. Can Respir J. 2008;15(4):219. author reply 219. | ||
National Clinical Guideline C. National Institute for Health and Clinical Excellence: guidance. Chronic Obstructive Pulmonary Disease: Management of Chronic Obstructive Pulmonary Disease in Adults in Primary and Secondary Care. London: Royal College of Physicians (UK) National Clinical Guideline Centre – Acute and Chronic Conditions; 2010:22–673. Available from: https://www.ncbi.nlm.nih.gov/pubmedhealth/PMH0033903/. Access date February 13, 2018. | ||
Swanney MP, Ruppel G, Enright PL, et al. Using the lower limit of normal for the FEV1/FVC ratio reduces the misclassification of airway obstruction. Thorax. 2008;63(12):1046–1051. | ||
Roberts SD, Farber MO, Knox KS, et al. FEV1/FVC ratio of 70% misclassifies patients with obstruction at the extremes of age. Chest. 2006;130(1):200–206. | ||
Hardie JA, Buist AS, Vollmer WM, Ellingsen I, Bakke PS, Morkve O. Risk of over-diagnosis of COPD in asymptomatic elderly never-smokers. Eur Respir J. 2002;20(5):1117–1122. | ||
Brusasco V. Spirometric definition of COPD: exercise in futility or factual debate? Thorax. 2012;67(7):569–570. | ||
Mannino DM, Sonia Buist A, Vollmer WM. Chronic obstructive pulmonary disease in the older adult: what defines abnormal lung function? Thorax. 2007;62(3):237–241. | ||
Mannino DM, Diaz-Guzman E. Interpreting lung function data using 80% predicted and fixed thresholds identifies patients at increased risk of mortality. Chest. 2012;141(1):73–80. | ||
Cerveri I, Corsico AG, Accordini S, et al. Underestimation of airflow obstruction among young adults using FEV1/FVC <70% as a fixed cut-off: a longitudinal evaluation of clinical and functional outcomes. Thorax. 2008;63(12):1040–1045. | ||
Garcia-Rio F, Soriano JB, Miravitlles M, et al. Overdiagnosing subjects with COPD using the 0.7 fixed ratio: correlation with a poor health-related quality of life. Chest. 2011;139(5):1072–1080. | ||
Guder G, Brenner S, Angermann CE, et al. GOLD or lower limit of normal definition? A comparison with expert-based diagnosis of chronic obstructive pulmonary disease in a prospective cohort-study. Respir Res. 2012;13(1):13. | ||
Akkermans RP, Berrevoets MA, Smeele IJ, et al. Lung function decline in relation to diagnostic criteria for airflow obstruction in respiratory symptomatic subjects. BMC Pulm Med. 2012;12:12. | ||
van Dijk WD, Gupta N, Tan WC, Bourbeau J. Clinical relevance of diagnosing COPD by fixed ratio or lower limit of normal: a systematic review. COPD. 2014;11(1):113–120. | ||
Glaab T, Vogelmeier C, Buhl R. Outcome measures in chronic obstructive pulmonary disease (COPD): strengths and limitations. Respir Res. 2010;11:79. | ||
Lee SW, Kim HK, Baek S, et al. Development of a spirometry T-score in the general population. Int J Chron Obstruct Pulmon Dis. 2016;11:369–379. | ||
Hankinson JL, Odencrantz JR, Fedan KB. Spirometric reference values from a sample of the general U.S. population. Am J Respir Crit Care Med. 1999;159(1):179–187. | ||
Stanojevic S, Wade A, Stocks J, et al. Reference ranges for spirometry across all ages: a new approach. Am J Respir Crit Care Med. 2008;177(3):253–260. | ||
Vaz Fragoso CA, Concato J, McAvay G, et al. The ratio of FEV1 to FVC as a basis for establishing chronic obstructive pulmonary disease. Am J Respir Crit Care Med. 2010;181(5):446–451. | ||
Quanjer PH, Stanojevic S, Cole TJ, et al. Multi-ethnic reference values for spirometry for the 3-95-yr age range: the global lung function 2012 equations. Eur Respir J. 2012;40(6):1324–1343. | ||
Suissa S. Effectiveness of inhaled corticosteroids in chronic obstructive pulmonary disease: immortal time bias in observational studies. Am J Respir Crit Care Med. 2003;168(1):49–53. | ||
Suissa S, Barnes PJ. Inhaled corticosteroids in COPD: the case against. Eur Respir J. 2009;34(1):13–16. | ||
Soriano JB, Mannino DM. Reversing concepts on COPD irreversibility. Eur Respir J. 2008;31(4):695–696. | ||
Global Lung Function Initiative. Available from: http://www.ers-education.org/guidelines/global-lung-function-initiative.aspx. Accessed February 08, 2018. |
Supplementary materials
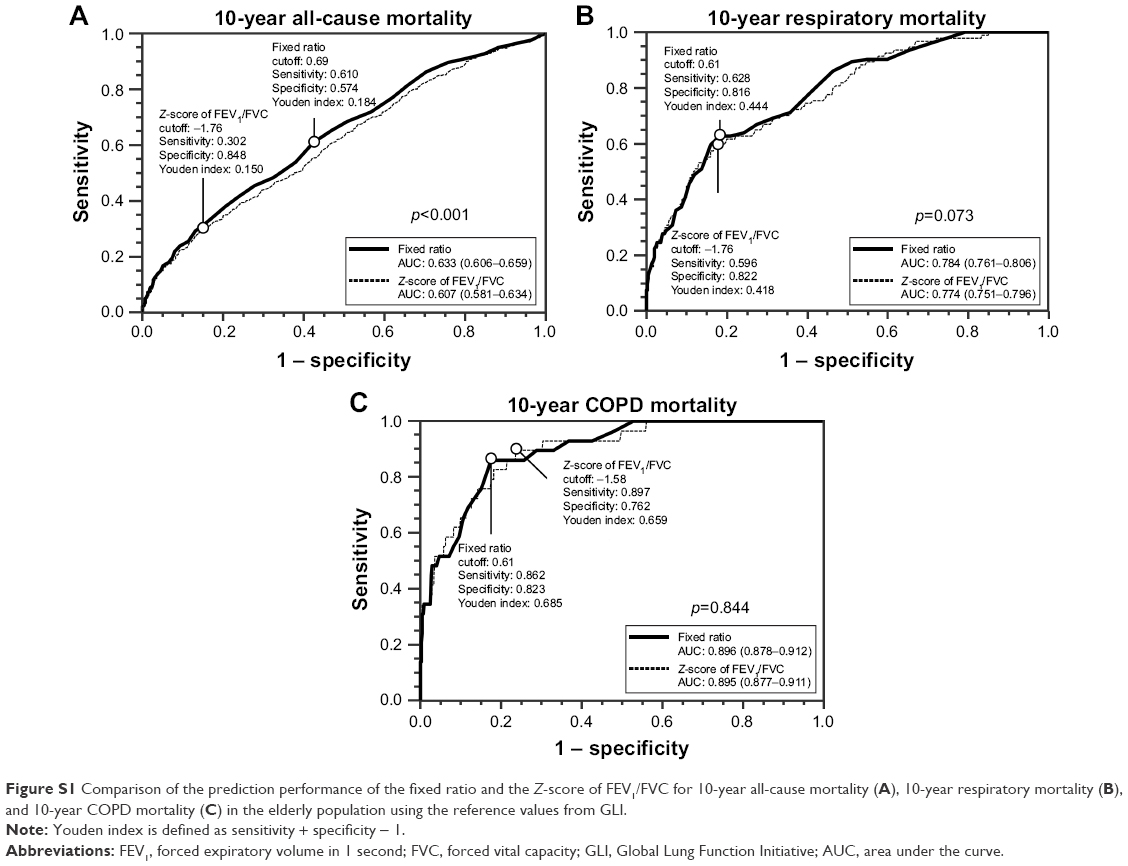 | Figure S1 Comparison of the prediction performance of the fixed ratio and the Z-score of FEV1/FVC for 10-year all-cause mortality (A), 10-year respiratory mortality (B), and 10-year COPD mortality (C) in the elderly population using the reference values from GLI. |
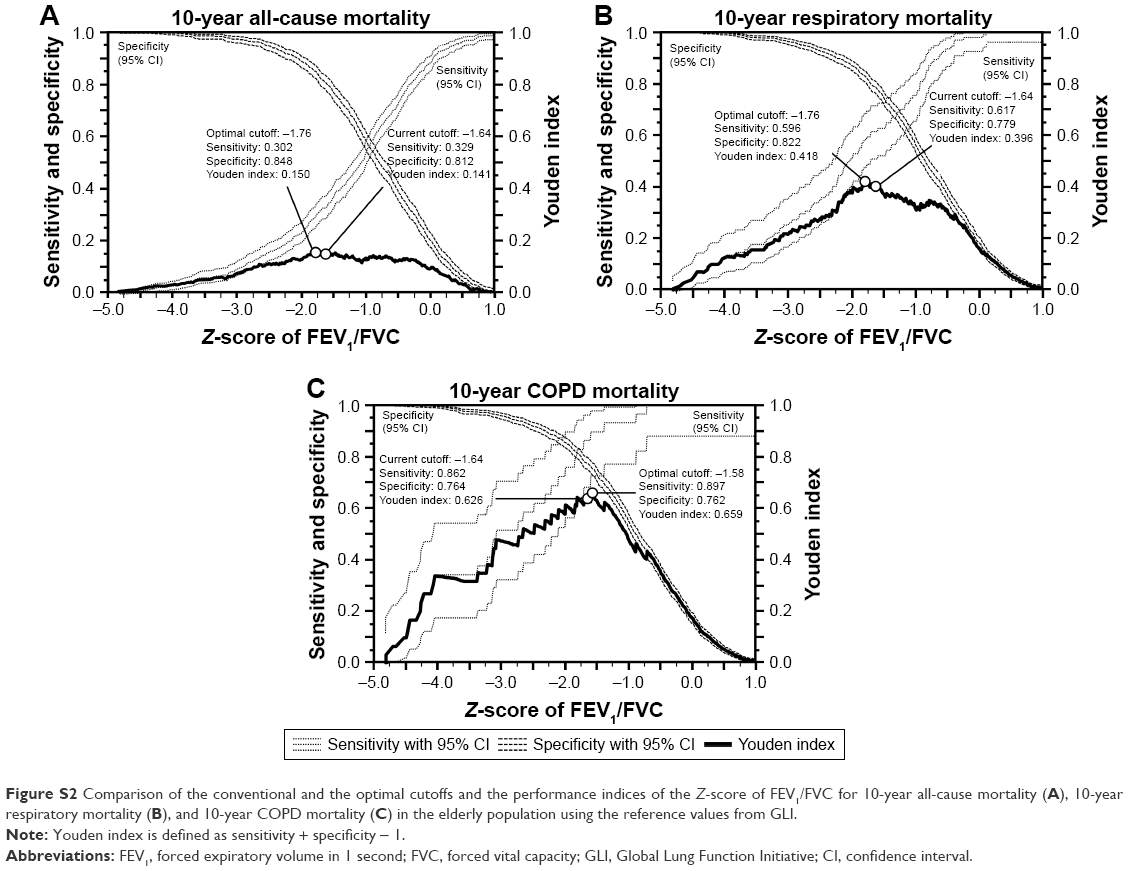 | Figure S2 Comparison of the conventional and the optimal cutoffs and the performance indices of the Z-score of FEV1/FVC for 10-year all-cause mortality (A), 10-year respiratory mortality (B), and 10-year COPD mortality (C) in the elderly population using the reference values from GLI. |
 | Figure S3 Comparison of the prediction performance of the fixed ratio and the Z-score of FEV1/FVC for 10-year all-cause mortality (A), 10-year respiratory mortality (B), and 10-year COPD mortality (C) in the male elderly population. |
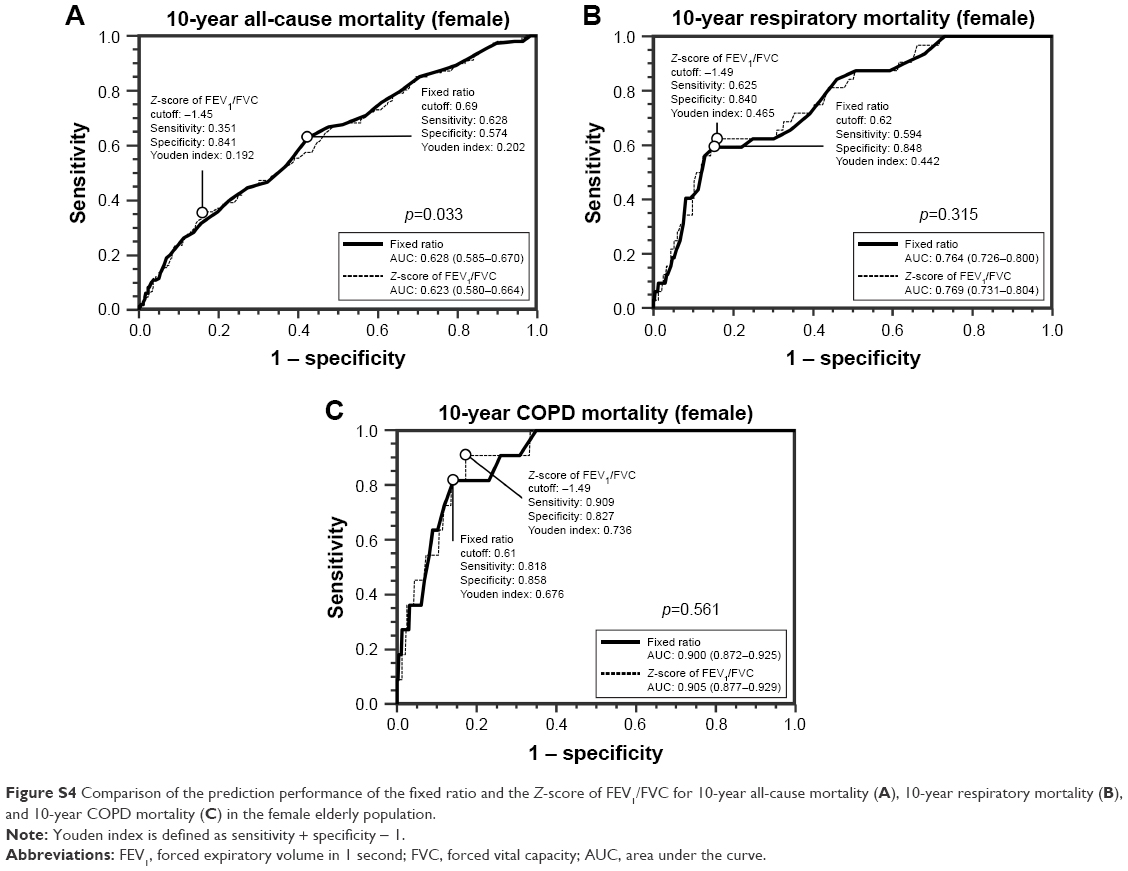 | Figure S4 Comparison of the prediction performance of the fixed ratio and the Z-score of FEV1/FVC for 10-year all-cause mortality (A), 10-year respiratory mortality (B), and 10-year COPD mortality (C) in the female elderly population. |
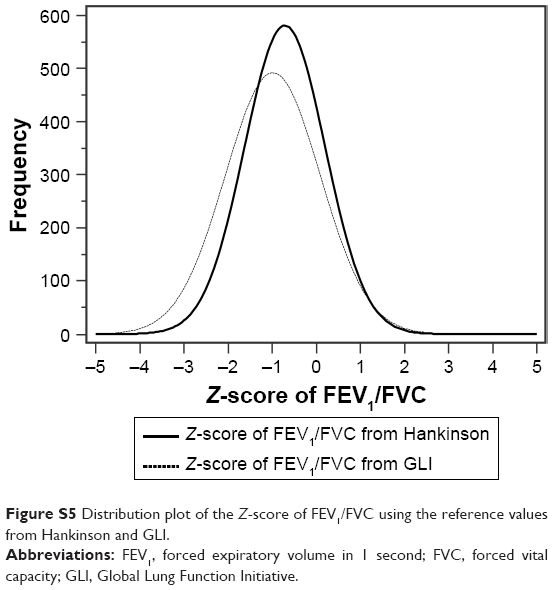 | Figure S5 Distribution plot of the Z-score of FEV1/FVC using the reference values from Hankinson and GLI. |
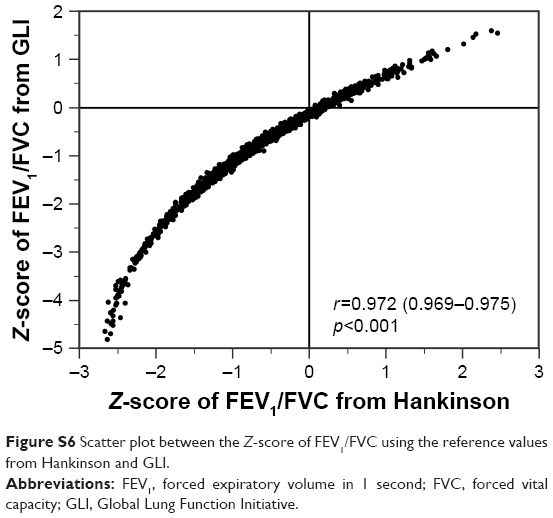 | Figure S6 Scatter plot between the Z-score of FEV1/FVC using the reference values from Hankinson and GLI. |
 © 2018 The Author(s). This work is published and licensed by Dove Medical Press Limited. The full terms of this license are available at https://www.dovepress.com/terms.php and incorporate the Creative Commons Attribution - Non Commercial (unported, v3.0) License.
By accessing the work you hereby accept the Terms. Non-commercial uses of the work are permitted without any further permission from Dove Medical Press Limited, provided the work is properly attributed. For permission for commercial use of this work, please see paragraphs 4.2 and 5 of our Terms.
© 2018 The Author(s). This work is published and licensed by Dove Medical Press Limited. The full terms of this license are available at https://www.dovepress.com/terms.php and incorporate the Creative Commons Attribution - Non Commercial (unported, v3.0) License.
By accessing the work you hereby accept the Terms. Non-commercial uses of the work are permitted without any further permission from Dove Medical Press Limited, provided the work is properly attributed. For permission for commercial use of this work, please see paragraphs 4.2 and 5 of our Terms.