")
Back to Journals » Drug Design, Development and Therapy » Volume 12
Comparison of the effects of deferasirox, deferoxamine, and combination of deferasirox and deferoxamine on an aplastic anemia mouse model complicated with iron overload
Authors Wu D , Wen X, Liu W, Hu H, Ye B , Zhou Y
Received 2 January 2018
Accepted for publication 7 March 2018
Published 3 May 2018 Volume 2018:12 Pages 1081—1091
DOI https://doi.org/10.2147/DDDT.S161086
Checked for plagiarism Yes
Review by Single anonymous peer review
Peer reviewer comments 3
Editor who approved publication: Dr Jianbo Sun
Dijiong Wu,1 Xiaowen Wen,2 Wenbin Liu,1 Huijin Hu,1 Baodong Ye,1 Yuhong Zhou1
1Department of Hematology, First Affiliated Hospital of Zhejiang Chinese Medical University, Hangzhou, Zhejiang, People’s Republic of China; 2Department of Internal Medicine, Central Hospital of Jinhua Affiliated to Zhejiang University, Jinhua, Zhejiang, People’s Republic of China
Background and aim: Iron overload is commonly observed during the course of aplastic anemia (AA), which is believed to aggravate hematopoiesis, cause multiple organ dysfunction, lead to disease progression, and impair quality of life. Deferasirox (DFX) and deferoxamine (DFO) are among the most common iron chelation agents available in the clinical setting. The aim of this study was to investigate if the combination therapy with DFX and DFO is superior in hematopoietic recovery and iron chelation.
Methods: Briefly, we developed a composite mouse model with AA and iron overload that was consequently treated with DFX, DFO, or with a combination of both agents. The changes in peripheral hemogram, marrow apoptosis, and its related protein expressions were compared during the process of iron chelation, while the iron depositions in liver and bone marrow and its regulator were also detected.
Results: The obtained results showed that compared to DFX, DFO has a better effect in protecting the bone marrow from apoptosis-induced failure. The combination of DFO and DFX accelerated the chelation of iron, while their efficiency on further hemogram improvement appeared limited.
Conclusion: To sum up, our data suggest that single treatment with DFO may be a better choice for improving the hematopoiesis during the gradual chelation treatment irrespective of the convenience of oral DFX, while the combination treatment should be considered for urgent reduction of the iron burden.
Keywords: aplastic anemia, iron overload, mouse, animal model, deferasirox, deferoxamine
Introduction
Aplastic anemia (AA) is a rare, but potentially life-threatening bone marrow failure disorder characterized by pancytopenia with an increased risk of hemorrhage and infection.1 In People’s Republic of China, the incidence of AA is nearly triple that in Western countries. Moreover, most of the cases fall under the nonsevere acquired AA category.2 Immune suppression therapy and stem cell transplantation are considered the first-line treatments for AA; nevertheless, not all patients can afford this therapy, or reach remission with it, and thus many patients still require blood transfusion as supportive therapy.3 Iron overload, which is transfusion-dependent or can be ascribed to the disease-related dysfunction in iron metabolism, is a common complication during the course of AA.3 As reported, patients who receive more than 20 U red blood cells via transfusion can develop iron overload. Iron chelation therapy, which is becoming increasingly popular in the treatment of bone marrow failure diseases, like myelodysplastic syndrome (MDS) and AA, is believed to be efficient in protecting organs (liver, heart, etc.), improving hematopoiesis, and promoting the quality of life.4
There are some clinically available iron chelation agents, such as deferiprone,5 deferasirox (DFX),6 and deferoxamine (DFO),7 which are widely used in thalassemia. DFX and DFO are also the most commonly used agents for AA.8–10 During treatment, those chelators should be continuously present in the circulation in order to achieve the best iron chelation effect. DFO should be continuously administered for at least 8–12 h subcutaneously, 5–7 days a week, which is not very convenient for outpatients, while DFX is an oral iron chelator and as such has a better patient compliance.11 The metabolisms of the 2 agents are different, and various factors may affect the efficacy of monotherapy, as well as the side effects.12 Nowadays, most patients with iron overload would prefer DFX to DFO, because of its oral administration. DFO, which has been proven to show iron-induced heart disease protection,13 may be indicated when DFX is not affordable or ineffective, especially in patients with severe iron overload or cardiac involvement. The combination therapy has been shown to be very effective in iron chelation for thalassemia,7,14 but there are no available data for AA with severe iron overload. Whether the combination treatment exerts a superior effect in iron deposition reduction and hematopoiesis recovery than the monotherapy remains unclear. In the present study, we compared the combination effect of iron chelation with DFX and DFO on an AA animal model complicated with iron overload, which was established by our group previously,15 as well as their effect on hematopoietic recovery, to clarify the underlying mechanisms.
Materials and methods
Animals
Forty clean-grade inbred female Balb/c mice aged 6–8 weeks, and 5 female DBA/2 mice aged 6–14 weeks were provided and fed by the Laboratory Animal Center of Zhejiang Chinese Medical University, Hangzhou, People’s Republic of China. All animals had free access to normal chow and water. The experiments were performed according to the National Institute of Health Guide for the Care and Use of Laboratory Animals (revised 199616) and were approved by the Animal Management and Ethics Committee of Zhejiang Chinese Medical University (No ZSLL-2013-108).
Reagents
The reagents used were as follows: Iron dextran (Sigma-Aldrich; Merck KGaA, Darmstadt, Germany); DFX and DFO pure powders (Novartis Pharma Schweiz AG, Rotkreuz ZG, Switzerland); serum iron (SI) detection kit (cat. no A039-1, Nanjing Jiancheng Bioengineering Institute, Nanjing, People’s Republic of China); serum ferritin (SF) enzyme-linked immunosorbent assay (ELISA) kit (cat. no CSB-E05187h, Cusabio Biotech Co., Ltd., Wuhan, People’s Republic of China); serum BMP-6 ELISA kit (cat. no CSB-E09277h, Cusabio Biotech Co., Ltd.); tissue hepcidin ELISA kit (cat. no CSB-E13062h, Cusabio Biotech Co., Ltd.); and TUNEL apoptosis assay kit (cat. no S7100, Millipore, Billerica, MA, USA).
Animal grouping
After the duplication of the composite model (AA complicated with iron overload), BALB/c mice (n=32) were randomly assigned into 4 groups and named as follows: DFX-treated group (DFX, n=8), DFO-treated group (DFO, n=8), DFO and DFX cotreated group (DFX + DFO, n=8), and composite model group (Model, n=8). Furthermore, 8 healthy BALB/c mice without the model duplication were considered as the normal group (Normal, n=8).
Duplication of the AA mouse model complicated with iron overload
The duplication of AA model complicated with iron overload was done according to our previous research.15 Briefly, Balb/C mice were first administered with iron dextran (200 mg/kg/wk, continue for 10 weeks) via intraperitoneal injection. After establishing the iron overload model, all the mice were treated with whole-body irradiation (60Co 6.0 Gy at 1 Gy/min), following administration of 0.2 mL (5×10⁶ cells/mL) prepared thymus cell suspensions from DBA/2 mice; the injection was preformed via the caudal vein within 4 h.
Treatments
DFO was given at a dosage of 0.2 g/kg (dissolved in normal saline) twice a day via abdominal subcutaneous injection, while DFX was given at a dosage of 0.2 g/kg (dissolved in distilled water) daily via intragastric administration for 5 weeks. The normal and model control groups received a corresponding volume of solvent by intragastric and abdominal subcutaneous administrations, respectively.
Sample collection
Blood was collected for routine testing from the orbital veins on days +14 and +35. Blood, liver, and bilateral femurs were extracted from randomly chosen mice (n=4) on day +35 following overnight fasting and euthanasia via cervical dislocation.
Detection of peripheral hemogram
Blood tests were performed using manual classification and counting protocols17 by the Department of Laboratory Medicine of Zhejiang Provincial Hospital of TCM (Hangzhou, People’s Republic of China). Briefly, the blood smears were prepared, stained with Wright–Giemsa stain, and observed under a light microscope (CX31RTSF, Olympus Optical Co., Ltd., Tokyo, Japan) at a magnification of 400×.
Pathomorphological observation
For all groups, the liver and unilateral femur were fixed in a 10% formalin solution for 24 h, and then the femur was decalcified by soaking in 5% nitric acid solution for 7–12 h. All of the tissues were dehydrated, paraffin-embedded, sliced up, stained with hematoxylin and eosin/iron (redyed by Sudan red), and consequently observed and analyzed under light microscopy at a magnification of 400×. The iron staining intensity was evaluated according to the extent of cell coloration: “−” represented negative staining; “+” represented mild staining with positively stained cells showed a light blue pigment; “++” represented moderate staining with positively stained cells showing a dusty blue pigment; and “+++” represented intense staining, with positively stained cells showing a dark blue pigment, with each scored based on 0, 1, 2, or 3 points, respectively. The total area occupied by iron deposition per 540,000 μm2 of bone marrow area (excluding adipocytes) was evaluated using a Nikon Digital Image Analyzer using Imaging Software 3.10 (Nikon Corporation, Tokyo, Japan). The product of staining intensity and staining positive area ratio was further used for statistical analysis.18
Detection of SI content
About 0.5 mL blood plasma was taken for the detection of SI content by absorption spectrophotometry using a microplate reader according to the SI detection kit instructions. The following equation was used:
|

The absorbance of the detection tube (Ad), absorbance of the blank tube (Ab), and the absorbance of the standard tube (As) are the variables encountered.
ELISA
About 1–1.5 mL serum was taken from each group for the detection of SF and BMP-6, and 10% liver homogenate (0.5 mL) was prepared for the detection of liver hepcidin using the ELISA kit (Cusabio Biotech Co., Ltd) according to the manufacturer’s protocol.
TUNEL assay
Femur were fixed in a 10% formalin solution for 24 h, decalcified by soaking in 5% nitric acid solution for 7–12 h, and then paraffin-embedded and sectioned (thickness, 4 μm) before being HRP-conjugated with dUTP. TUNEL apoptosis assay kit was used according to the manufacturer protocol. The slides were observed under a fluorescence microscope (Olympus BX51T-PHD-J11, Tokyo, Japan). Counts of TUNEL-positive nuclei were performed by counting total number of stained nuclei across 400 μm sections of each sample.
Immunohistochemistry for apoptosis-related protein expression in bone marrow
The staining intensity was evaluated according to the extent of cell coloration: “−” represented negative staining; “+” represented mild staining with positively stained cells showing a yellow pigment; “++” represented moderate staining with positively stained cells showing a brown pigment; and “+++” represented intense staining with positively stained cells showing a dark brown pigment, each scored based on 0, 1, 2, or 3 points. The product of staining intensity and staining rate was further used for statistical analysis.18
Western blot analysis
Cells were collected, washed 3 times with ice-cold PBS, and lysed on ice with lysis buffer (10 mM Tris pH 7.5, 130 mM NaCl, 1% NP-40, 10 mM NaPPi, 1 mM PMSF, 0.1 mM Na3VaO4). Lysates were transferred to microcentrifuge tubes and precleared by centrifugation at 11,900×g for 15 min at 4°C. Protein concentrations were determined using Bradford reagent according to the manufacturer’s instructions. β-actin was used as an internal reference control. An equal amount of total protein extracted from cultured cells was separated by 12% SDS-PAGE and transferred to PVDF membranes (EMD Millipore Corporation, Billerica, MA, USA). Primary antibodies and HRP-conjugated appropriate secondary antibodies were used to detect the designated proteins. The bound secondary antibodies on the PVDF membrane were reacted with the ECL detection reagents (Beyontime, Institute of Biotechnology, Jiangsu, People’s Republic of China) and exposed to X-ray films (Kodak, Tokyo, Japan). The result was analyzed using ImageJ 1.46r software (National Institutes of Health, Bethesda, MD, USA). Anti-hepcidin, anti-BMP6, anti-SMAD4, anti-TfR2 (Abcam, Eugene, OR, USA), anti-NF-κB (Protein Tech, Chicago, IL, USA), and β-actin monoclonal antibody (LiankeBio, Hangzhou, People’s Republic of China) were used in the experiments.
Statistical analysis
Data were collected and input into Excel and later analyzed by SPSS 17.0 (SPSS Inc., Chicago, IL, USA). All data were expressed as mean ± SEM. Analysis of variance was employed to compare the 2 groups of normally distributed data by using one-way analysis protocol and followed by a post hoc Newman–Keuls test. P<0.05 was considered to indicate statistically significant difference.
Results
DFO exerted a better effect on peripheral hemogram recovery
The completion of thymus cell suspensions from DBA/2 mice injected into model Balb/c mice was defined as day 0. To identify the successful duplication of AA mouse model complicated with iron overload, SI, SF, and hemogram were detected on day +14 and day +35. On day +14, the hemogram in AA mice reached the minimum value. On day +14, white blood cells (WBC), hemoglobin (Hb), and platelets (PLT) were significantly lower in the composite model group and all iron chelation group (DFX, DFO, and DFX + DFO) when compared to the normal group (P<0.01 or P<0.05), apart from Hb in DFO-treated group. Furthermore, both DFO and DFX increased the levels of WBC and Hb in the composite model mice; nonetheless, the significant difference was only observed in the DFO-treated group (P<0.01), while the effect was more obvious compared to DFX-treated group (P<0.01); In addition, DFX had a negative, but not significant, effect on the PLT count. Moreover, combined chelation treatment promoted the recovery of Hb (P<0.01), but no significant difference was observed when compared to other single chelation groups (Figure 1). On day +35, the WBC and PLT, but not Hb, were still significantly lower in the model control group, as well as in all chelation groups compared to the normal control group (P<0.01 or P<0.05). DFX had no significant effect on hemogram recovery when compared to the model control group, while DFO significantly increased the level of PLT (P<0.05); DFO had a better effect on WBC and PLT recovery than DFX (P<0.01 or P<0.05) and combined chelation treatment group (P<0.05) (Figure 2).
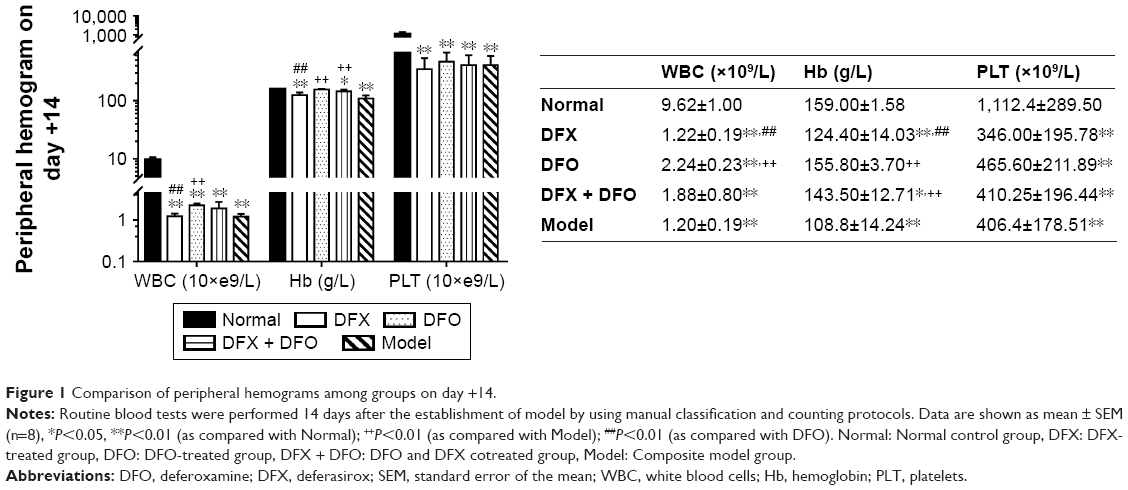 | Figure 1 Comparison of peripheral hemograms among groups on day +14. |
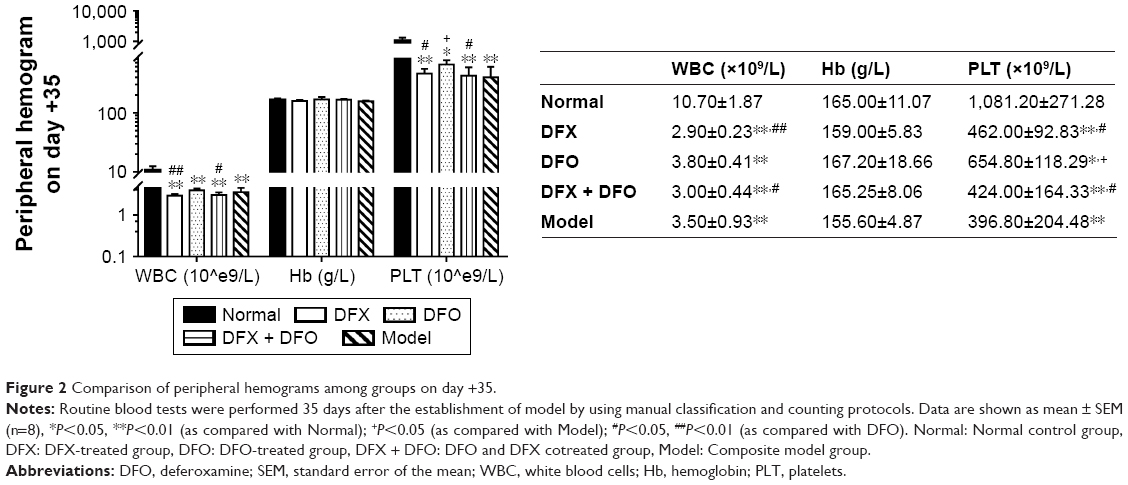 | Figure 2 Comparison of peripheral hemograms among groups on day +35. |
DFO may have a better protection effect on bone marrow apoptosis
Our data showed that in composite model group, bone marrow had a more significantly TUNEL-positive expression (P<0.01), in accordance with the increased expression of Bax, Caspase-3, Caspase-9, and PARP (P<0.01) and decreased expression of BCL-2 (P<0.01) when compared to normal control group. Iron chelation treatment with DFX, DFO, or DFX + DFO, all exerted a decreased TUNEL-positive rate (P<0.01), while the single treatment with DFO was the most significant one. DFX treatment increased the BCL-2 expression (P<0.05) and downregulated the expression of Caspase-3 and Caspase-9 (P<0.01 or P<0.05); DFO decreased the expression of Caspase-9 and PARP (P<0.01). In addition, combined treatment decreased Bax and Caspase-9 expression (P<0.05), and increased BCL-2 (P<0.05); nevertheless, the antiapoptosis effect (BCL-2 expression) was not superior to DFX or DFO single treatment, and was even inferior to DFO (P<0.05). DFO revealed a better effect on inhibiting Caspase 3 and PARP expression than DFX (P<0.01), while DFX was more effective at increasing BCL-2 and decreasing Caspase 9 (P<0.01) (Figure 3).
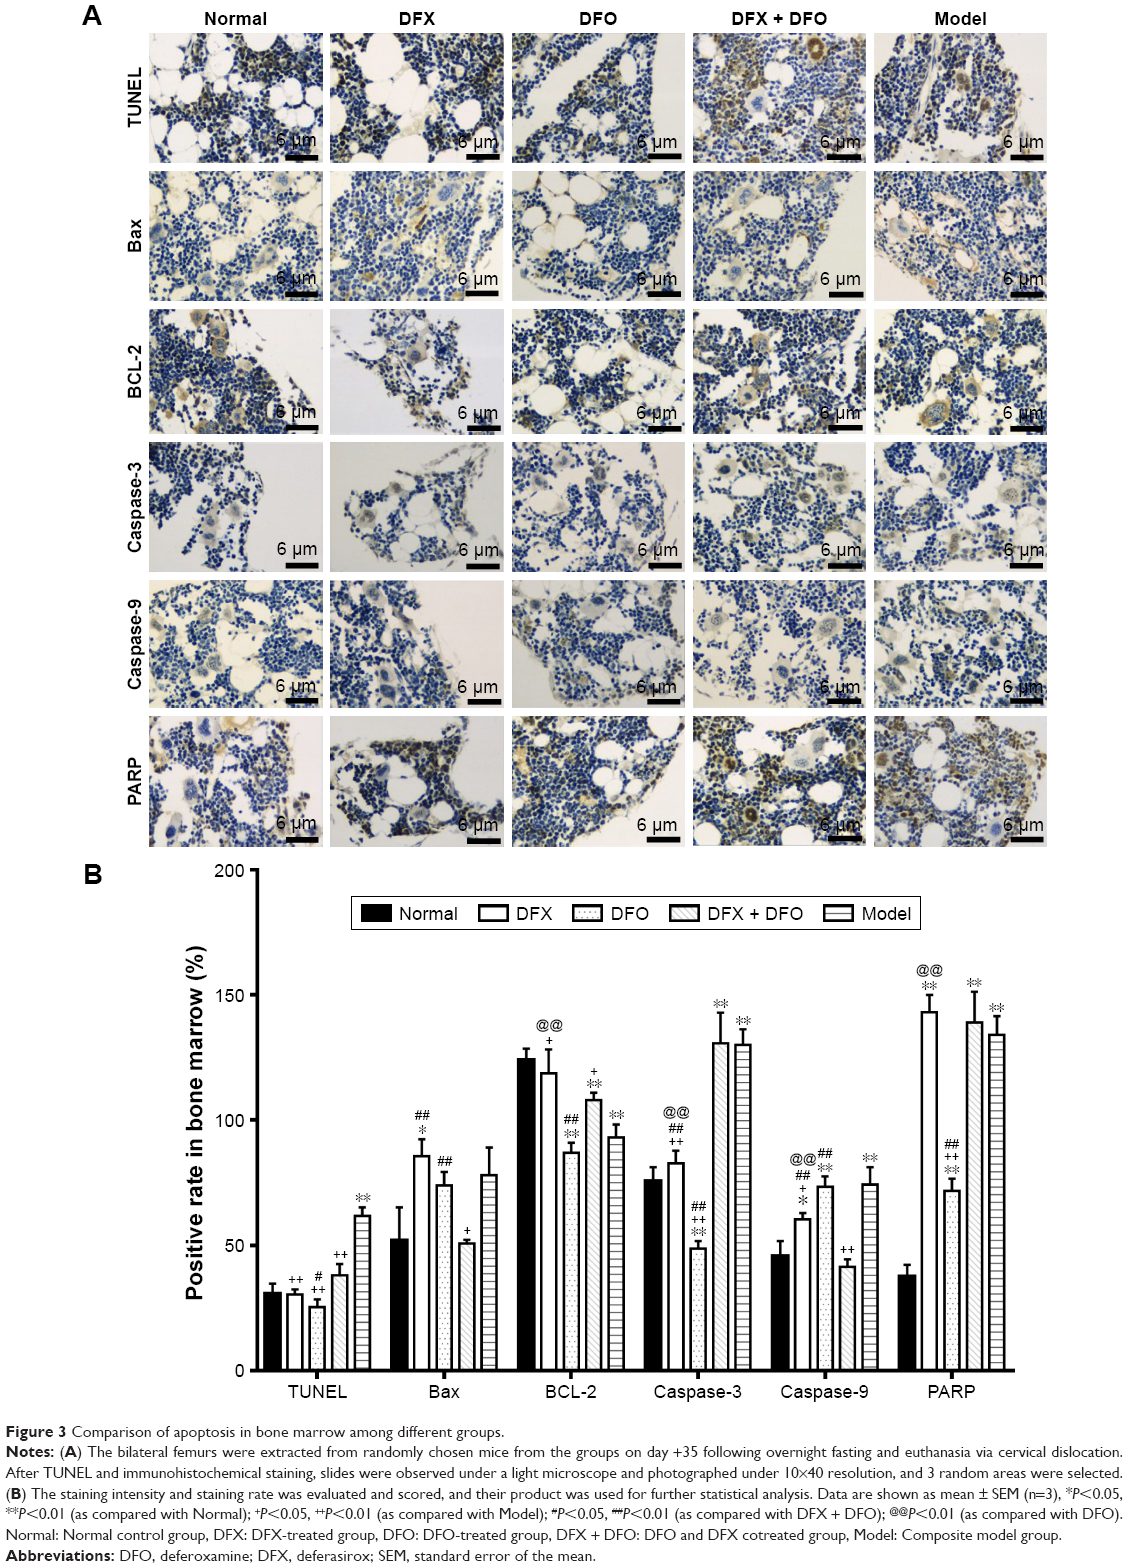 | Figure 3 Comparison of apoptosis in bone marrow among different groups. |
Iron chelation exerted an anti-NF-κB effect
After iron chelation treatment for 35 days, Western blot showed that the expression of NF-κB in liver decreased significantly in the DFO, DFX, and DFO + DFX groups when compared to the model group (P<0.01), but it was still higher than the normal group (P<0.01) (Figure 4).
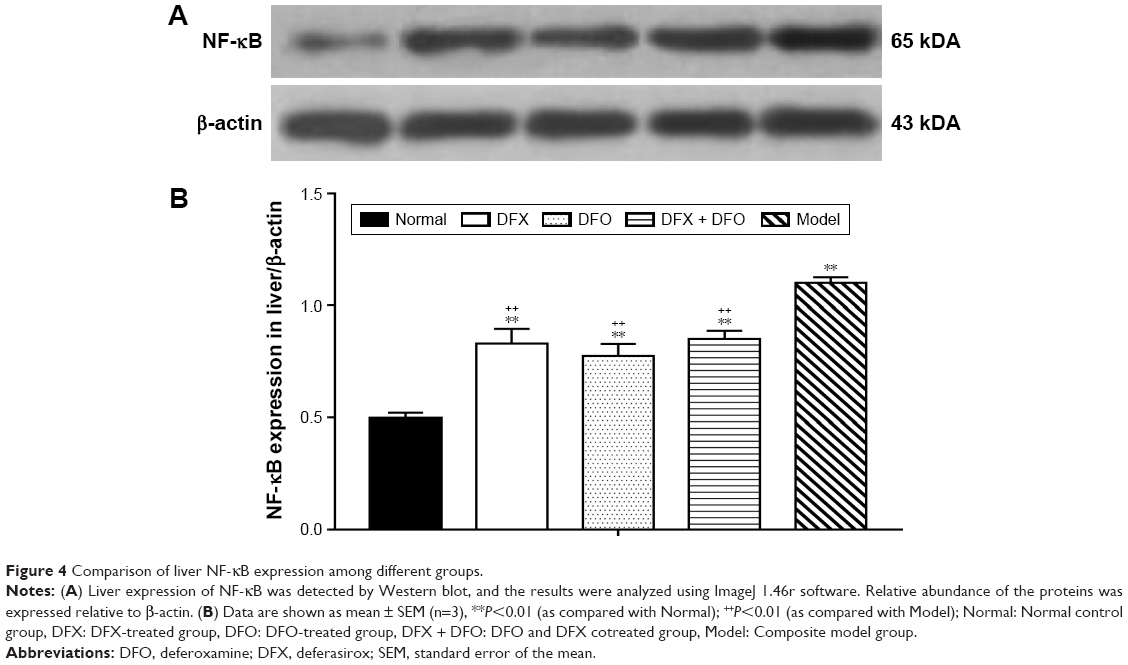 | Figure 4 Comparison of liver NF-κB expression among different groups. |
Combined iron chelation is more efficient in reducing iron load in liver and bone marrow
Heavy iron deposition in both liver (A–E) and bone marrow (F–J) were found in model mice when compared to the normal group (P<0.01). Furthermore, the iron deposition was significantly decreased after treatment with DFX or DFO when compared to the model group (P<0.01 or P<0.05); the most obvious effect was observed in the DFX + DFO group when compared to DFO or DFX single-treatment group (P<0.01) (Figure 5).
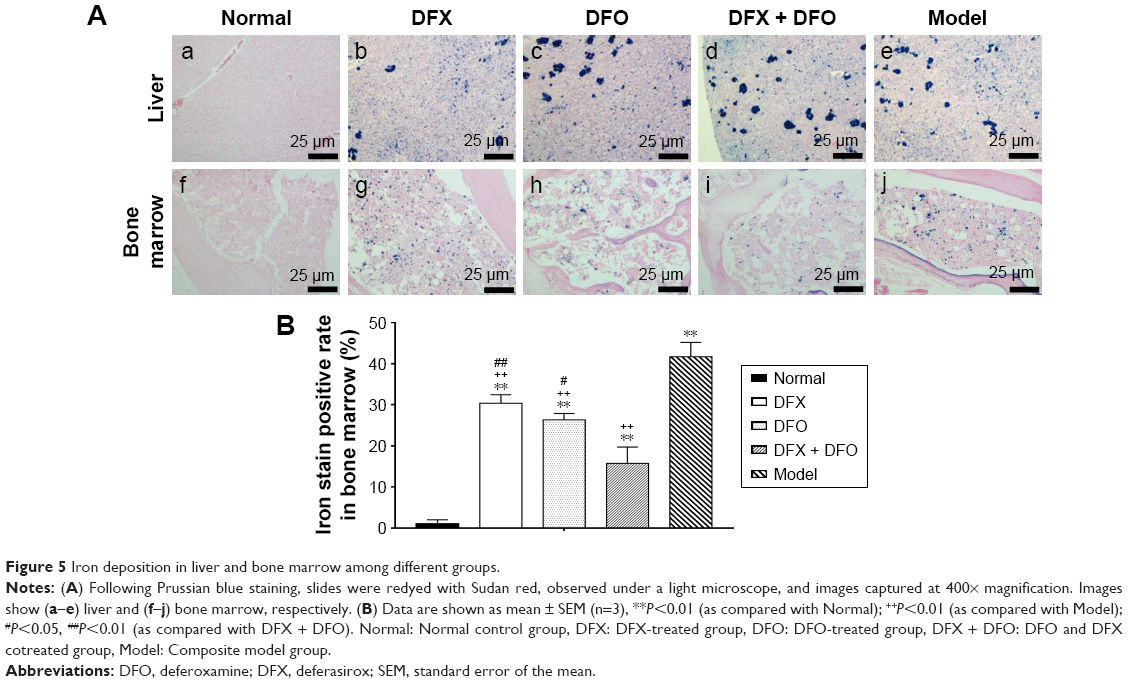 | Figure 5 Iron deposition in liver and bone marrow among different groups. |
Combined iron chelation exerted a more significant effect on iron metabolism indexes
On day +35, the SI as well as SF were significantly higher in the composite model group (P<0.01), while serum BMP-6 and liver hepcidin were obviously decreased (P<0.01) when compared to the normal group. DFX, DFO, and DFX + DFO groups had a significantly lower level of SI and SF, and higher BMP-6 and hepcidin when compared to the model group (P<0.01 or P<0.05). In addition, no differences in SI, SF, BMP-6, and liver hepcidin expression were found between DFX and DFO groups; however, the DFX + DFO group had a significantly lower SI and higher BMP-6 and hepcidin when compared to either DFX or DFO group (P<0.01 or P<0.05), and a lower SF when compared to DFX group (P<0.05); no notable differences were observed when compared to the normal group (P>0.05). DFO treatment could recover the SF when compared to normal group (P>0.05) (Figure 6).
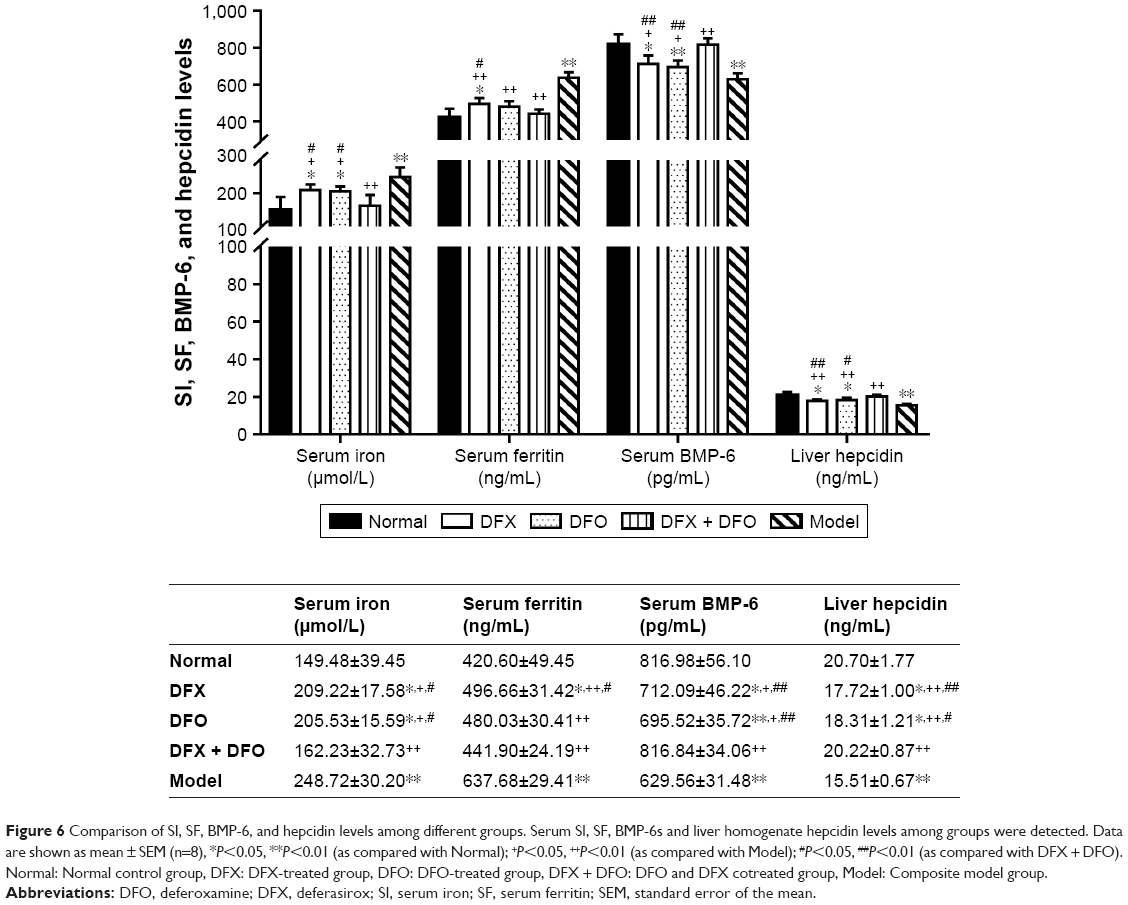 | Figure 6 Comparison of SI, SF, BMP-6, and hepcidin levels among different groups. Serum SI, SF, BMP-6s and liver homogenate hepcidin levels among groups were detected. Data are shown as mean ± SEM (n=8), *P<0.05, **P<0.01 (as compared with Normal); +P<0.05, ++P<0.01 (as compared with Model); #P<0.05, ##P<0.01 (as compared with DFX + DFO). Normal: Normal control group, DFX: DFX-treated group, DFO: DFO-treated group, DFX + DFO: DFO and DFX cotreated group, Model: Composite model group. |
Moreover, Western blot showed that the model group had a significantly lower expression of hepcidin, BMP-6, SMAD4, and TfR2 when compared to the normal group (P<0.01); both DFX and DFO upregulated the level of hepcidin and SMAD4 (P<0.01), and DFO also increased the expression of BMP-6 and TfR2 (P<0.01 or P<0.05) when compared to the model group, but all were lower than the normal group (P<0.01 or P<0.05). DFX + DFO treatment increased the expression of hepcidin, BMP-6, and SMAD4 (P<0.01) when compared to model mice, and had a better effect on upregulating BMP-6 and SMAD4 expression compared to DFX single treatment (P<0.05) and more SMAD4 expression compared to DFO group (P<0.05), but hampered the expression of hepcidin and TfR2 compared to either DFO or DFX group (P<0.01 or P<0.05). DFX showed a greater effect in increasing TfR2 level compared to DFO (P<0.05), and DFO appeared more effective in upregulating BMP-6 expression (P<0.05) (Figure 7).
 | Figure 7 Comparison of liver hepcidin regulator expression among different groups. |
Discussion
The impairment of hematopoiesis due to excessive iron overload may be ascribed to the direct effect of increased reactive oxygen species (ROS) mediated by apoptosis of hematopoietic progenitors as well as hematopoietic microenvironment dysfunction.19–21 Increasing numbers of reports have described hematopoietic improvement after the iron chelation treatment in AA and MDS patients complicated with iron overload.16,22–24 DFO can reverse the suppression effect of iron overload on erythroid burst-forming unit colonies formation and lineage differentiation by reducing intracellular ROS levels.20 DFX exerts an effect on inhibiting NF-κB-mediated gene expression, and decreases the level of activated T-cell-produced TNF, which is detrimental to normal hematopoiesis.25 Yet, it has also been reported that DFX exposure may induce ROS, which hampers the growth and viability of hematopoietic progenitor cell (HPC) from MDS, and in turn decreases CD34 expression in normal HPC. This shift may lead to the activation of POU5F1, SOX2, and SOX17 gene expression, which promote erythroid differentiation.26,27 It appears that the mechanisms underlying DFX in hematopoietic recovery are not similar to that of DFO. Thus, it needs to be clarified if there is a synergistic promotion effect of DFX and DFO on AA in vivo.
Our results showed that iron chelation treatment did promote the hematopoietic recovery in iron-overload AA mice, and DFO exerted a more significant effect on the early stage of the disease. With persistent chelation with DFO, the PLT count also improved. The combination management was not superior to single treatments. Furthermore, we detected the levels of apoptosis in bone marrow and found that the DFO single treatment also had a better effect in reducing TUNEL-positive rate than DFX or combined chelation. The effect of DFO and DFX on altering the apoptotic regulatory proteins’ expression was different. The obtained results showed that the DFO was more effective in decreasing the apoptosis promotion proteins (Bax, caspase-3, and PARP), while DFX was more effective in increasing the antiapoptosis protein expression (BCL-2) and inhibiting caspase-9 expression, and the combination treatment was more effective in decreasing the Bax and caspase-9 expression. The Western blot showed that the expression of NF-κB also decreased in all chelation groups; it seems that the DFO treatment exerted a more obvious effect that the DFX and combination treatment, but not significantly. These results suggest that the superior protective effect of DFO in hematopoiesis may be ascribed to its more predominant role in protecting the marrow from apoptosis.
After being transferred to the cytoplasm of intestinal epithelial cells by divalent metal transporter 1, which is absorbed from ingested food, iron is stored in SF or transferred into plasma by ferroportin (FPN).28 Hepcidin is believed to negatively regulate the transportation of iron into the plasma combined with FPN, and induce its phosphorylation, endocytosis, and degradation in cytoplasm.29 There are many regulatory mechanisms underlying hepcidin expression, but the HJV-BMP-SMAD signaling pathway plays one of the most important roles.30 HJV, a coreceptor of the BMP signal, can combine with type 1 BMP receptor and activate BMP. The phosphorylation of SMAD 1/5/8 can also promoted the process of combination to SMAD4, thus forming a complex that can enter the cell nucleus and stimulate hepcidin expression.31 TfR2, which is highly expressed in liver, can also positively regulate the BMP signaling pathway and upregulate hepcidin gene expression.32 In our mice model, iron-overload AA was characterized by a heavy iron deposition in liver and bone marrow and by a significantly higher expression of SI and SF and lower expression of hepcidin as well as its positive regulatory factors (BMP-6, SMAD4, and TfR2). Iron chelation can reverse this, that is, DFX has a better effect in upregulation of BMP-6 and TfR2, while the combined treatment has a more significant effect in reducing the SI and SF and increasing the expression of serum BMP-6, liver hepcidin, and SMAD4.
Conclusion
In conclusion, we found that the both DFO and DFX can promote the recovery of hematopoiesis in iron-overload AA; DFO may have a higher efficiency in improving the WBC and PLT count when compared with DFX. The combination treatment with DFO and DFX could accelerate the chelation of iron, but it did not show a further superiority in improving the hemogram recovery. In addition, there is no significant difference on the iron chelation effect between DFO and DFX. In clinical practice, it is possible to optimize the selection of iron chelation drugs based on a patient’s situation and ongoing treatment.
Acknowledgments
The present study was supported by the National Natural Science Foundation of China (grant no 81774092), Special Research Funds for Traditional Chinese Medicine Industry from State Administration of Traditional Chinese Medicine (grant nos 201107001 and 201407001), and Zhejiang Scientific Research Fund of Traditional Chinese Medicine (grant no 2016ZA069). The authors thank Xiangping Wu (First Affiliated Hospital of Zhejiang Chinese Medical University, Hangzhou, Zhejiang) for their contribution to the development of the methodology.
Author contributions
Dijiong Wu, Baodong Ye, and Yuhong Zhou conceived and designed the study. Dijiong Wu and Xiaowen Wen developed the methodology. Xiaowen Wen and Huijin Hu assisted in the acquisition of data. Dijiong Wu and Xiaowen Wen analyzed and interpreted the data. Dijiong Wu and Baodong Ye wrote, reviewed, and revised the manuscript. All authors contributed toward data analysis, drafting and critically revising the paper, gave final approval of the version to be published, and agree to be accountable for all aspects of the work.
Disclosure
The authors report no conflicts of interest in this work.
References
Young NS. Current concepts in the pathophysiology and treatment of aplastic anemia. Hematology Am Soc Hematol Educ Program. 2013;2013:76–81. | ||
Wu D, Shen Y, Ye B, et al. Efficacy and advantages of modified Traditional Chinese Medicine treatments based on “kidney reinforcing” for chronic aplastic anemia: a randomized controlled clinical trial. J Tradit Chin Med. 2016;36(4):434–443. | ||
Killick SB, Bown N, Cavenagh J, et al. Guidelines for the diagnosis and management of adult aplastic anaemia. Br J Haematol. 2016;172(2):187–207. | ||
Kim IH, Moon JH, Lim SN, et al. Efficacy and safety of deferasirox estimated by serum ferritin and labile plasma iron levels in patients with aplastic anemia, myelodysplastic syndrome, or acute myeloid leukemia with transfusional iron overload. Transfusion. 2015;55(7):1613–1620. | ||
Elalfy MS, Adly A, Awad H, Tarif Salam M, Berdoukas V, Tricta F. Safety and efficacy of early start of iron chelation therapy with deferiprone in young children newly diagnosed with transfusion-dependent thalassemia: a randomized controlled trial. Am J Hematol. 2018;93(2):262–268. | ||
Kohgo Y, Urabe A, Kilinc Y, et al. Deferasirox decreases liver iron concentration in iron-overloaded patients with myelodysplastic syndromes, aplastic anemia and other rare anemias. Acta Haematol. 2015;134(4):233–242. | ||
Ansari S, Azarkeivan A, Miri-Aliabad G, Yousefian S, Rostami T. Comparison of iron chelation effects of deferoxamine, deferasirox, and combination of deferoxamine and deferiprone on liver and cardiac T2* MRI in thalassemia maior. Caspian J Intern Med. 2017;8(3):159–164. | ||
Shi J, Chang H, Zhang L, et al. [Efficacy and safety of deferasirox in aplastic anemia patients with iron overload: a single arm, multi-center, prospective study in China]. Zhonghua Xue Ye Xue Za Zhi. 2016;37(1):1–6. Chinese. | ||
Park SJ, Han CW. Complete hematopoietic recovery after continuous iron chelation therapy in a patient with severe aplastic anemia with secondary hemochromatosis. J Korean Med Sci. 2008;23(2):320–323. | ||
Cheong JW, Kim HJ, Lee KH, et al. Deferasirox improves hematologic and hepatic function with effective reduction of serum ferritin and liver iron concentration in transfusional iron overload patients with myelodysplastic syndrome or aplastic anemia. Transfusion. 2014;54(6):1542–1551. | ||
Haghpanah S, Zarei T, Zahedi Z, Karimi M. Compliance and satisfaction with deferasirox (Exjade®) compared with deferoxamine in patients with transfusion-dependent β-thalassemia. Hematology. 2014;19(4):187–191. | ||
Breccia M, Alimena G. Efficacy and safety of deferasirox in myelodysplastic syndromes. Ann Hematol. 2013;92(7):863–870. | ||
Davis BA, Porter JB. Long-term outcome of continuous 24-hour deferoxamine infusion via indwelling intravenous catheters in high-risk β-thalassemia. Blood. 2000;95(4):1229–1236. | ||
Grady RW, Galanello R, Randolph RE, Kleinert DA, Dessi C, Giardina PJ. Toward optimizing the use of deferasirox: potential benefits of combined use with deferoxamine. Haematologica. 2013;98(1):129–135. | ||
Wu D, Wen X, Liu W, Xu L, Ye B, Zhou Y. A composite mouse model of aplastic anemia complicated with iron overload. Exp Ther Med. 2018;15(2):1449–1455. | ||
Institute of Laboratory Animal, Commission on Life Sciences, National Research Council. Guide for the Care and Use of Laboratory Animals. Washington, DC: National Academy Press; 1996. | ||
Swolin B, Simonsson P, Backman S, Lofqvist I, Bredin I, Johnsson M. Differential counting of blood leukocytes using automated microscopy and a decision support system based on artificial neural networks – evaluation of DiffMaster Octavia. Clin Lab Haematol. 2003;25(3):139–147. | ||
Wu DJ, Ye BD, Hu ZP, et al. Bone marrow angiogenesis in patients presenting with differential Chinese medicine syndrome: correlation with the clinico-pathological features of aplastic anemia. Chin J Integr Med. 2013;19(12):905–912. | ||
Okabe H, Suzuki T, Uehara E, Ueda M, Nagai T, Ozawa K. The bone marrow hematopoietic microenvironment is impaired in iron-overloaded mice. Eur J Haematol. 2014;93(2):118–128. | ||
Taoka K, Kumano K, Nakamura F, et al. The effect of iron overload and chelation on erythroid differentiation. Int J Hematol. 2012;95(2):149–159. | ||
Angelucci E, Cianciulli P, Finelli C, Mecucci C, Voso MT, Tura S. Unraveling the mechanisms behind iron overload and ineffective hematopoiesis in myelodysplastic syndromes. Leuk Res. 2017;62:108–115. | ||
Breccia M, Voso MT, Aloe Spiriti MA, et al. An increase in hemoglobin, platelets and white blood cells levels by iron chelation as single treatment in multitransfused patients with myelodysplastic syndromes: clinical evidences and possible biological mechanisms. Ann Hematol. 2015;94(5):771–777. | ||
Leitch HA. Hematologic improvement with iron chelation therapy in acquired anemias. Eur J Haematol. 2016;96(6):551–552. | ||
Lee SE, Yahng SA, Cho BS, et al. Improvement in hematopoiesis after iron chelation therapy with deferasirox in patients with aplastic anemia. Acta Haematol. 2013;129(2):72–77. | ||
Banerjee A, Mifsud NA, Bird R, et al. The oral iron chelator deferasirox inhibits NF-κB mediated gene expression without impacting on proximal activation: implications for myelodysplasia and aplastic anaemia. Br J Haematol. 2015;168(4):576–582. | ||
Pullarkat V, Sehgal A, Li L, et al. Deferasirox exposure induces reactive oxygen species and reduces growth and viability of myelodysplastic hematopoietic progenitors. Leuk Res. 2012;36(8):966–973. | ||
Tataranni T, Agriesti F, Mazzoccoli C, et al. The iron chelator deferasirox affects redox signalling in haematopoietic stem/progenitor cells. Br J Haematol. 2015;170(2):236–246. | ||
Xu Z, Sun W, Li Y, et al. The regulation of iron metabolism by hepcidin contributes to unloading-induced bone loss. Bone. 2017;94:152–161. | ||
Detivaud L, Island ML, Jouanolle AM, et al. Ferroportin diseases: functional studies, a link between genetic and clinical phenotype. Hum Mutat. 2013;34(11):1529–1536. | ||
Lee DH, Zhou LJ, Zhou Z, et al. Neogenin inhibits HJV secretion and regulates BMP-induced hepcidin expression and iron homeostasis. Blood. 2010;115(15):3136–3145. | ||
Wu XG, Wang Y, Wu Q, et al. HFE interacts with the BMP type I receptor ALK3 to regulate hepcidin expression. Blood. 2014;124(8):1335–1343. | ||
Chen J, Enns CA. CD81 promotes both the degradation of transferrin receptor 2 (TfR2) and the Tfr2-mediated maintenance of hepcidin expression. J Biol Chem. 2015;290(12):7841–7850. |
 © 2018 The Author(s). This work is published and licensed by Dove Medical Press Limited. The full terms of this license are available at https://www.dovepress.com/terms.php and incorporate the Creative Commons Attribution - Non Commercial (unported, v3.0) License.
By accessing the work you hereby accept the Terms. Non-commercial uses of the work are permitted without any further permission from Dove Medical Press Limited, provided the work is properly attributed. For permission for commercial use of this work, please see paragraphs 4.2 and 5 of our Terms.
© 2018 The Author(s). This work is published and licensed by Dove Medical Press Limited. The full terms of this license are available at https://www.dovepress.com/terms.php and incorporate the Creative Commons Attribution - Non Commercial (unported, v3.0) License.
By accessing the work you hereby accept the Terms. Non-commercial uses of the work are permitted without any further permission from Dove Medical Press Limited, provided the work is properly attributed. For permission for commercial use of this work, please see paragraphs 4.2 and 5 of our Terms.