")
Back to Journals » International Journal of Chronic Obstructive Pulmonary Disease » Volume 13
Comparison of the clinical characteristics and comprehensive assessments of the 2011 and 2017 GOLD classifications for patients with COPD in China
Authors Hu YH, Liang ZY , Xu LM, Xu WH, Liao H , Li R , Wang K, Xu Y, Ou CQ , Chen X
Received 19 May 2018
Accepted for publication 30 July 2018
Published 28 September 2018 Volume 2018:13 Pages 3011—3019
DOI https://doi.org/10.2147/COPD.S174668
Checked for plagiarism Yes
Review by Single anonymous peer review
Peer reviewer comments 3
Editor who approved publication: Dr Chunxue Bai
Yu-He Hu,1,* Zhen-Yu Liang,2,* Li-Mei Xu,1,* Wen-Hui Xu,1 Hao Liao,1 Rui Li,1 Kai Wang,1 Ying Xu,1 Chun-Quan Ou,3 Xin Chen1
1Department of Respiratory Medicine, Zhujiang Hospital, Southern Medical University, Guangzhou, China; 2State Key Laboratory of Respiratory Disease, National Clinical Research Center for Respiratory Disease, Guangzhou Institute of Respiratory Health, First Affiliated Hospital of Guangzhou Medical University, Guangzhou, China; 3State Key Laboratory of Organ Failure Research, Department of Biostatistics, Guangdong Provincial Key Laboratory of Tropical Disease Research, School of Public Health, Southern Medical University, Guangzhou, China
*These authors contributed equally to this work
Objective: Compared with the 2011 Global Initiative for Chronic Obstructive Lung Disease (GOLD), there have been significant changes in the 2017 GOLD classification. The purpose of this study was to analyze the changes in clinical characteristics of the new A-B-C-D system and to explore its role in comprehensive assessment of COPD.
Subjects and methods: A total of 631 stable COPD patients were included in a cross-sectional survey. Data collected included baseline data and pulmonary function testing results, respiratory muscle strength, symptoms and quality of life, exercise capacity, nutritional status, and anxiety and depression as a comprehensive assessment. Based on the 2011 GOLD and 2017 GOLD classifications, patients were divided into Groups A1–D1 and Groups A2–D2, respectively.
Results: In the 2011 GOLD, 64 subjects in Group C1 were reclassified into Group A2 (41.6%), while 77 subjects in Group D1 were reclassified into Group B2 (27.1%). The old and new grading systems were somewhat consistent (Cohen’s kappa=0.6963, P<0.001). Lung function was lower, while the body mass index, airflow obstruction, dyspnea, and exercise capacity index (BODE index) was higher in Group A2 than in Group A1 (P<0.001). In Group B2, lung function, 6-minute walking distance (6MWD), and respiratory muscle strength were significantly lower than in Group B1 (P<0.001), while the BODE index (P<0.001) was higher. In comprehensive assessment, subjects in Groups B2 and D2 had significantly lower lung function, 6MWD, respiratory muscle strength, quality of life, higher symptom scores, and BODE index than subjects in Group A2 (P<0.001). The differences between Group A2 and C2 were small.
Conclusion: Compared with the 2011 GOLD, the 2017 GOLD reclassified more patients into Groups A and B, those with significantly worse lung function and higher BODE index. In the comprehensive assessment of the new classification, Groups B and D may have greater disease severity. However, the effectiveness of the new grading system in predicting patient prognosis, and its guidance on the use of drugs, remains to be explored in future studies.
Keywords: COPD, Global Initiative for Chronic Obstructive Lung Disease, comprehensive assessment
Introduction
COPD is a common, preventable, and treatable chronic respiratory disease characterized by persistent respiratory symptoms and airflow limitation. It has become one of the leading causes of death worldwide, posing a heavy burden on economy and society.1 Many attempts have been made to find simple and effective indicators to assess the severity of the disease. Prior to 2011, the severity of COPD was mainly evaluated by lung function, namely FEV1. However, COPD has obvious heterogeneity in many aspects, such as clinical manifestations, pathophysiology, drug efficacy, survival, and prognosis. Therefore, FEV1 alone cannot fully reflect the characteristics of the disease.2,3 The 2011 Global Initiative for Chronic Obstructive Lung Disease (GOLD) proposed the A-B-C-D assessment approach, which evaluates COPD based on symptoms, airflow limitation, and history of exacerbations, and reflects the complexity of the disease in a more effective manner.4 However, several studies have shown this staging system has no significant advantage in predicting mortality and significant health outcomes compared with traditional one-dimensional assessment systems, and may cause some confusion.5–8
In view of these limitations, the 2017 revision separates the degree of airflow limitation from the A-B-C-D grouping, emphasizing the importance of the symptoms and the risk of exacerbations with respect to prognosis, and makes the grouping more favorable for clinicians to make treatment decisions.9 At the same time, some patients with COPD originally categorized as Groups C and D were reclassified into Groups A and B. Two previous studies on 2017 GOLD classification showed that the new grading system resulted in large changes in the demographic characteristics of patients with COPD distributed in the four categories, ie, A, B, C, and D.10,11 Two other studies arrived at similar conclusions, except for slightly different distributions among the groups.12,13 At the same time, a study by Marçoa et al indicated that patients in Group B of the new grading system had a higher risk of acute exacerbations than the old classification.13 However, these studies mainly evaluated the new categories from the perspective of basic demographic characteristics and distribution changes. The effectiveness of the new categories on the overall assessment of the severity of COPD remains unknown.
In recent years, more and more clinical indicators have been used to assess the severity of COPD. In clinical practice, the comprehensive assessment of COPD using multiple parameters such as pulmonary function, symptoms, quality of life, nutritional status, respiratory muscle function, exercise capacity, emotional status, and other parameters could make up for the limitations of a single-indicator assessment and offer a more accurate way to evaluate disease severity. A previous work by our team showed that the comprehensive assessment approach had a good effect on the evaluation of pulmonary rehabilitation in patients with COPD.14 Therefore, in the present study, we analyzed changes in characteristics brought about by the new A-B-C-D categories, used well-accepted and closely related indicators of disease severity to compare with the 2011 GOLD classification, and explored its role in comprehensive assessment.
Subjects and methods
Subjects and study design
In this study, a cross-sectional survey was conducted by selecting patients with stable COPD at the Respiratory Medicine Clinic of Zhujiang Hospital of Southern Medical University from January 2013 to December 2016. Inclusion criteria were age≥40 years; diagnosis of COPD according to pulmonary function tests, ie, FEV1/FVC<0.70 after inhaling 400 μg of salbutamol aerosol, determined that there was a persistent airflow limitation. Patients with bronchial asthma, advanced tuberculosis, bronchiectasis, severe cardiovascular disease, and those who had an exacerbation within the prior 8 weeks were excluded. An exacerbation was defined as an acute worsening of respiratory symptoms that resulted in additional therapy (including short-acting bronchodilators, antibiotics, or oral steroids).9 Frequent exacerbations were defined as ≥2 exacerbations in the previous year, or at least one hospital admission due to a COPD exacerbation.
The study was approved by the Ethics Committee of Zhujiang Hospital, Southern Medical University, and conformed to the Helsinki Affirmation. The purpose, significance, and potential benefits and risks of the study were presented to patients. All patients signed informed consent.
Pulmonary function tests were performed first, and the degree of airflow limitation was graded based on FEV1% predicted: GOLD grade 1, ≥80 FEV1% predicted; GOLD grade 2, 50–79 FEV1% predicted; GOLD grade 3, 30–49 FEV1% predicted; GOLD grade 4, <30 FEV1% predicted. Subjects were also investigated by questionnaires, including the COPD Assessment Test (CAT)15 and the Modified Medical Research Council Scale (mMRC).16 The number of exacerbations in the previous year, CAT≥10, mMRC≥2, and whether there is frequent exacerbation were used as grouping thresholds. The mMRC classification was used when it was inconsistent with CAT score. According to the 2011 GOLD,17 all subjects were divided into A1, B1, C1, and D1 categories, and redivided into A2, B2, C2, and D2 categories according to the 2017 GOLD.1
Data collection and comprehensive assessment
Data collection for all COPD subjects was completed within 3 days of inclusion in the study. Data collected included demographic characteristics, smoking history, history of exacerbations, and other relevant comprehensive assessment parameters such as pulmonary function testing results, respiratory muscle strength, symptoms and quality of life, exercise capacity, nutritional status, and anxiety and depression. All relevant data were collected by experienced respiratory physicians.
Pulmonary function
Pulmonary function was measured by a spirometer (Pony FX229; Cosmed, Rome, Italy), which met the ATS guidelines.18 The collected parameters of pulmonary function included FEV1, FVC, FEV1% predicted, and FEV1/FVC, and were all measured before and after a bronchodilator test. The bronchodilator test was performed 20 minutes after inhaling 400 μg of salbutamol aerosol. Patients were excluded if they used any bronchial inhalation drug 3 days prior to the pulmonary function testing. Before and after the testing, three curves that accorded to the standards were selected for analysis.
Respiratory muscle strength
Respiratory muscle function was determined by maximal inspiratory pressure (PImax) and maximal expiratory pressure (PEmax). A digital manometer (AZ-8205; AZ Instruments, Taichung City, Taiwan) was used. Quality control was conducted according to the American Thoracic Society and the European Respiratory Society standardization protocols.19 The three largest measurements were selected for analysis. The lower limit of the normal value for PImax was 75 cm H2O in males, and 50 cm H2O in females. The lower limit of the normal value for PEmax was 100 cm H2O in males, and 80 cm H2O in females.20
Symptom and quality of life
Severity of symptoms was evaluated by CAT scores and mMRC grades. Quality of life was evaluated using the St George’s Respiratory Questionnaire (SGRQ).21
Exercise capacity
Exercise capacity was determined by a 6-minute walking distance (6MWD), according to the American Thoracic Society guidelines.22 During the test, oxygen saturation and heart rate were monitored by pulse oximetry (8A; JiaxingKanghe, Beijing, China). The whole process was under the supervision of an experienced respiratory physician to ensure that the oxygen saturation was maintained at above 90%. The maximum value measured over 2 days was used for analysis.
Nutritional status
Nutritional status was evaluated by body mass index (BMI) and fat-free body mass index (FFMI), as described in prior research.23,24 BMI and FFMI were measured by multifrequency and 8-spot electrodes (Inbody720; Biospace, Seoul, Korea) at the Department of Endocrinology of Zhujiang Hospital of Southern Medical University. Measurements were performed twice, and the average was used for analysis. BMI=body mass (BM)/(height)2 (m2). FFMI=fat-free body mass (FFM)/(height)2 (m2).
Depression and anxiety
Depression and anxiety were assessed by the Hospital Anxiety and Depression Scale (HADS).25 The scale contains seven questions about depression and seven questions about anxiety. The HADS was administered by experienced physicians.
Statistical analysis
Statistical analyses were performed using SPSS 20 (IBM Corporation, Armonk, NY, USA). Results were presented as the mean±SD for continuous variables, and categorical data were presented as numbers and percentages. Differences between two groups in the same category were compared by the independent samples t-test. The marginal homogeneity test was used to assess the distribution changes between the 2011 GOLD and the 2017 GOLD. The coherence of the two grouping methods was expressed by Cohen’s K coefficient.13 Group A served as the reference to the other three categories in the comprehensive assessment using multiple linear regression (patient characteristics were outcome variables, and the other three categories were dummy independent variables). A value of P<0.05 was considered statistically significant.
Results
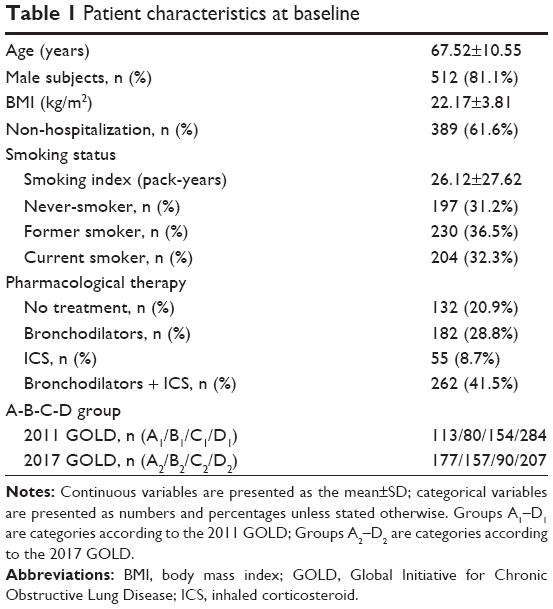
A total of 755 patients were initially enrolled in this study, of whom 124 did not meet the COPD criteria. Thus, 631 patients were ultimately included in the analysis (Figure 1). Baseline patient characteristics are shown in Table 1. The mean age of all subjects was 67.52±10.55 years, with males accounting for 81.1% of the population. The mean smoking index of all patients was 26.12±27.62; 31.2% were never-smokers, 36.5% were former smokers, and 32.3% were current smokers. According to the 2011 GOLD, 17.9% (n=113) of the total population were in Group A1, 12.7% (n=80) were in Group B1, 24.4% (n=154) were in Group C1, and 45.0% (n=284) were in Group D1. According to the 2017 GOLD, 28.0% (n=177) of the population were in Group A2, 24.9% (n=157) were in Group B2, 14.3% (n=90) were in Group C2, and 32.8% (n=207) were in Group D2.
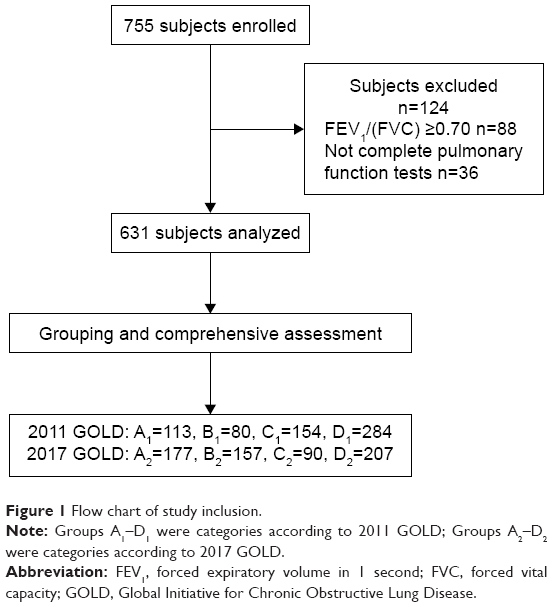 | Figure 1 Flow chart of study inclusion. |
 | Table 1 Patient characteristics at baseline |
2017 GOLD grouping brings changes
In order to demonstrate the distributional changes that occurred as a result of changes in the grading system, the distributions of all patients according to the 2011 GOLD and 2017 GOLD are presented in Figure 2. According to the new grouping criteria, 64 patients were reclassified into Group A2 from Group C1, accounting for 41.6% of the original total. Seventy-seven patients were reclassified into Group B2 from Group D1, accounting for 27.1% of the original total. In summary, a total of 141 patients were reclassified to the new group. As shown in Figure 2, the marginal homogeneity test demonstrated the difference in the distribution of patients in the 2011 GOLD and 2017 GOLD was statistically significant (χ2=11.874, P<0.001). Cohen’s kappa coefficient was 0.6963, indicating the two classification systems have some degree of consistency (Z=31.14, P<0.001; Table 2).
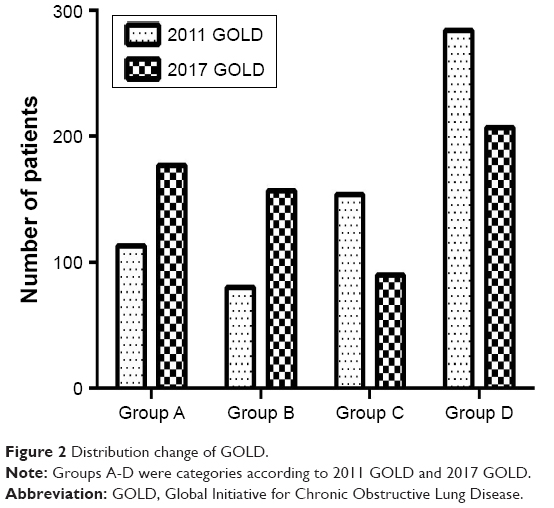 | Figure 2 Distribution change of GOLD. |
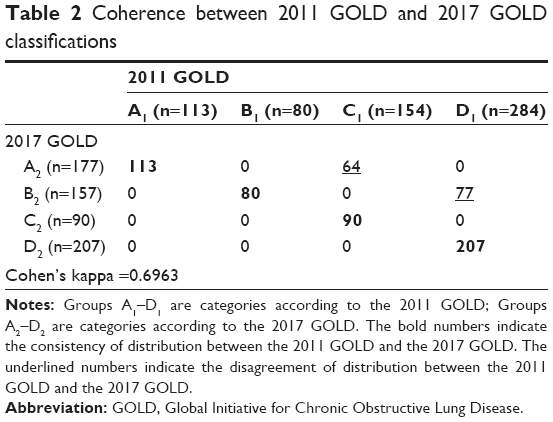 | Table 2 Coherence between 2011 GOLD and 2017 GOLD classifications |
The differences of comprehensive assessment parameters between two groups in the same category in the 2011 GOLD and 2017 GOLD are shown in Table 3. In category A, patients in Group A2 had significantly lower FEV1, FVC, FEV1% predicted, and FEV1/FVC (P<0.001), while mMRC (P=0.045) and body mass index, airflow obstruction, dyspnea, and exercise capacity index (BODE index; P<0.001) were higher than in the old group. In category B, patients in Group B2 had lower FEV1, FVC, FEV1% predicted, FEV1/FVC, 6MWD, PImax, and PEmax (P<0.001), while BODE was higher than in the previous group (P<0.001). In category D, none of the parameters changed significantly.
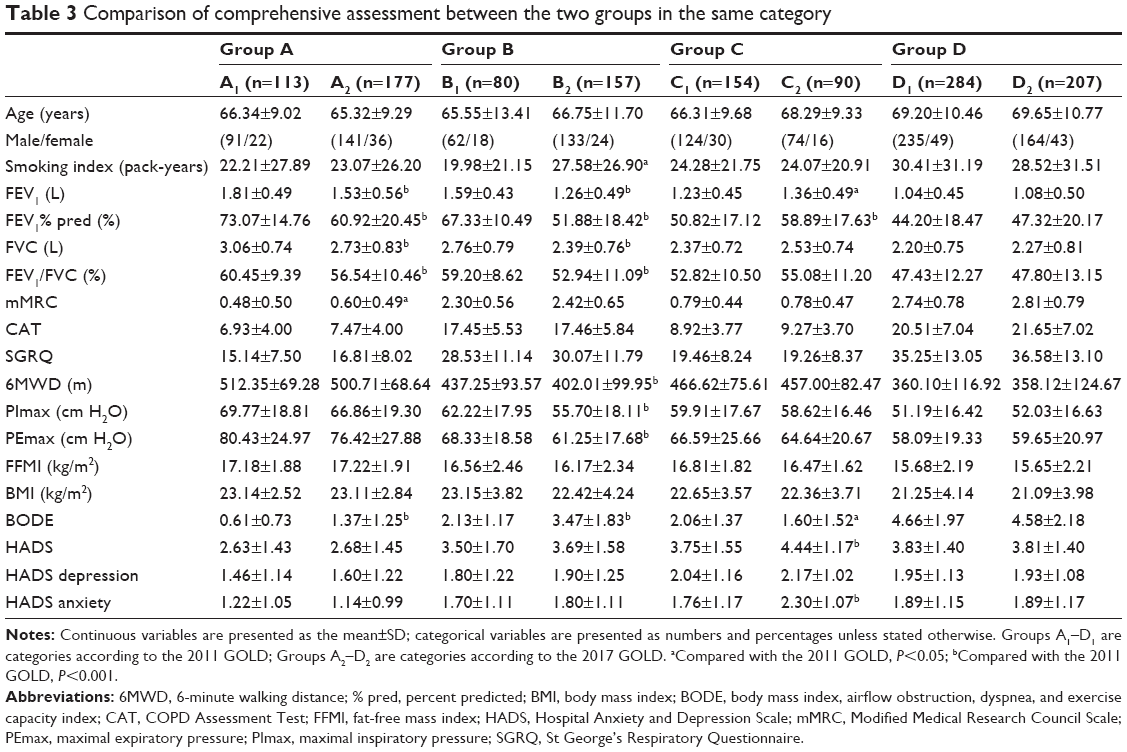 | Table 3 Comparison of comprehensive assessment between the two groups in the same category |
2011 GOLD and 2017 GOLD grouping in the comprehensive assessment of the characteristics
To further show the differences between groups in the new grading system, after adjusting for age, sex, and smoking index, the characteristics of the comprehensive evaluation of each group were compared and the results are presented in Tables 4 and 5. In the 2017 GOLD, patients in Group D2 had significantly lower FEV1, FVC, FEV1% predicted, 6MWD, PImax, PEmax, BMI, and FFMI, and higher mMRC, CAT, SGRQ, BODE, and HADS scores than patients in Group A2 (P<0.001). Similar results were observed for patients in Group B2, except for no significant difference in BMI (P=0.158). The differences between Groups A2 and C2 were relatively small.
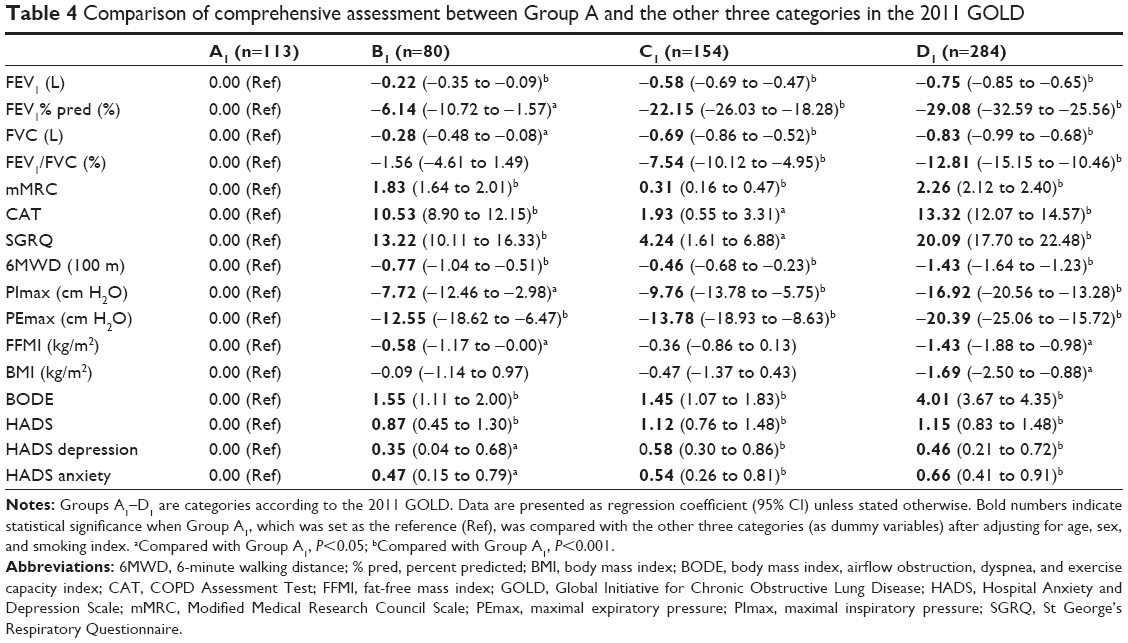 | Table 4 Comparison of comprehensive assessment between Group A and the other three categories in the 2011 GOLD |
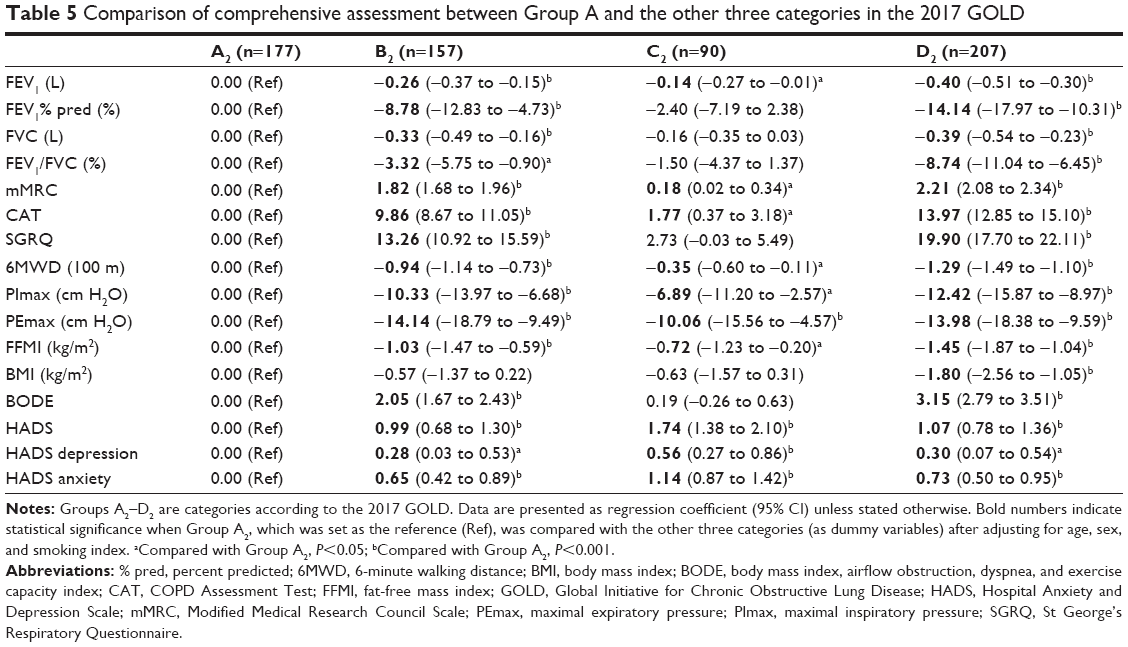 | Table 5 Comparison of comprehensive assessment between Group A and the other three categories in the 2017 GOLD |
Discussion
The results of this study showed that the new A-B-C-D grouping method based on the 2017 GOLD underwent tremendous changes in terms of clinical features and comprehensive evaluation compared with the 2011 GOLD. Almost half of the patients originally located in Group C1 based on the 2011 GOLD were reclassified into Group A2. Among the patients originally in Group D1 in the 2011 GOLD, nearly 30% were reclassified into Group B2. In addition, patients in Groups A2 and B2 had significantly worse lung function compared with the old group, especially Group B2 in which patients also had worse exercise performance and respiratory muscle strength. In the 2017 GOLD, when lung function was no longer a basis for grouping, patients in each group had significant differences in disease severity. Compared with patients in Groups A2 and C2, those in Groups B2 and D2 had worse comprehensive assessment outcomes.
Obviously, the change of assessment method was the main reason for the above changes. All of the patients who were reclassified into a lower group were at higher risk in the old grading system because they all had poorer lung function, instead of more frequent exacerbations. Tudoric et al showed that in the revised A-B-C-D classification, about half of the patients in Group C of the 2011 GOLD were reclassified into Group A, and more than one-third of those formerly in Group D were reclassified into Group B according to the 2017 GOLD.10 Similar conclusions were arrived at in a study by Sun et al.11 But two other studies showed that more than half of the patients in both Groups C and D were reclassified into low-risk groups.12,13 This was slightly different from the change in distribution found in this study, with the difference mainly due to the lower proportion of people being redistributed into Group B. Similar to Sun et al,11 but different from the other studies, was that in the 2011 evaluation method, Groups C and D had a larger number of subjects, while Groups A and B were relatively smaller. This matches the real situation of COPD in China because most patients tend to go to the hospital only when their lung function is deteriorating and symptoms have become more severe. This study also showed that there was a low degree of consistency between the newly revised evaluation method and the previous one, resulting in large differences in the distribution between groups and in clinical characteristics.
At the same time, we should also recognize that the existing assessment model is still relatively simple. COPD is a chronic inflammatory disease. In addition to impaired pulmonary function and respiratory symptoms, COPD produces a series of extrapulmonary manifestations such as decreased exercise ability, malnutrition, osteoporosis, anxiety, and depression. A comprehensive assessment of as many aspects as possible could offer a more accurate evaluation of the severity of COPD. For example, Celli et al used the BODE index consisting of four indicators to predict the long-term prognosis of patients with COPD, and found it superior to FEV1 alone.26 Previous research by our team also demonstrated that the comprehensive assessment had greater power for the evaluation of pulmonary rehabilitation in patients with COPD.14 Our study found that Groups C and D barely changed when evaluating the differences between the 2011 and 2017 GOLD by comprehensive assessment. Especially, there were no significant differences in the clinical characteristics of Group D. However, changes were significant in both Groups A and B, with patients in the new group significantly worse in terms of lung function and BODE index than the original group. Although lung function no longer serves as a basis for grouping in the current evaluation model, the ECLIPSE study targeting the 2011 classification also recommended more methods for assessing COPD than FEV1 alone.27 However, the 2017 GOLD pointed out that lung function was still very important in disease diagnosis, outcome prediction, and evaluating treatment options, as are symptoms and acute exacerbations.9 The results of this study also indicated that lung function may still play a significant role in the assessment of disease severity, especially because lung function may have a more pronounced effect on respiratory muscle function, exercise capacity, and BODE index in Group B. As patients in Group C and D had more severe exacerbations, the study showed that acute exacerbations have an adverse effect on a patient’s health status, hospitalization rate, and prognosis.28,29 The impact of lung function changes on this part of the subjects may be relatively small, so the new group and the old group did not produce more obvious changes in many perspectives.
In the 2011 assessment model, it was reported that the incidence of cardiovascular and metabolic diseases significantly increased with increasing A-B-C-D group.30 But, as previously described,5–7 compared with a single lung function classification, this assessment model did not show any significant advantage in predicting patient outcomes. A study had even shown that this evaluation system was not as good as the BODE index in predicting the long-term survival of patients.31 Our results also showed that while the 2017 GOLD simply excluded pulmonary function from grouping criteria, the new A-B-C-D groups had distinct clinical features compared with the former groups. Groups A2 and C2 were significantly better than Groups B2 and D2 with respect to lung function, symptoms, exercise capacity, respiratory muscle function, and other indicators, rather than the original linear distribution. Research by Lange et al showed that in the 2011 A-B-C-D evaluation system, long-term survival was lower in patients who had more severe dyspnea and were in Group B than in patients in Group C.32 The ECLIPSE study also found that in the 2011 assessment model, patients in Groups B and C had more variability, yet similar clinical outcomes.27 The results of this study may be because the new assessment model is based only on symptom evaluation and the number of exacerbations as a grouping basis, making the characteristics of different groups more pronounced. Overall, it appears that in the comprehensive evaluation of COPD, symptom assessment may play an extremely important role, and may be one of the most significant factors that determines the long-term outcome of patients. At the same time, only inhaled glucocorticoids are recommended for patients in Groups C and D, and not for those in Group B. However, if the severity of illness in Group B is worse than that in Group C, the rationality of this recommendation should be examined.
In summary, the results of this study suggested that in the revised evaluation method, patients in Groups B and D may have worse disease severity, and the long-term prognosis may be less optimistic, suggesting that clinicians should pay more attention to the condition of patients in Group B. Of course, all these results remain to be confirmed by further explorations.
There are some limitations to the current study. First, we evaluated the two assessment systems by cross-sectional data, rather than long-term dynamic observations and assessment of the corresponding prognostic indices. In addition, data for this study came mainly from hospitals, and the patient distributions were somewhat different from previous large-scale cross-sectional studies, and also did not fully reflect the distribution of COPD in the general population.
Conclusion
We found that compared with the 2011 GOLD, the 2017 GOLD classified more patients to Groups A and B, with significantly worse lung function and higher BODE index in both groups. At the same time, in the 2017 GOLD, patients in each group were not linearly distributed in disease severity, and the disease severity in Groups B and D was possibly more serious. However, the effectiveness of the new grading system in predicting patient prognosis and guiding the use of drugs remains to be further refined in future studies.
Acknowledgments
This work was supported by Clinical Research training program of Southern Medical University (LC2016PY032), National Key R&D Program of China (2017YFC1310601), The Guangzhou Healthcare Collaborative Innovation Major Project (201604020012), Guangzhou Innovation and Entrepreneurship Education Project of Universities (201709T26), Special Funds for the Cultivation of Guangdong College Students’ Scientific and Technological Innovation (PDJHB0101), and Nursing Special Funds of Southern Medical University (Y2017023).
Author contributions
All authors contributed toward data analysis, drafting and revising the paper and agree to be accountable for all aspects of the work.
Disclosure
The authors report no conflicts of interest in this work.
References
Global Initiative for Chronic Obstructive Lung Disease. Global Strategy for the Diagnosis, Management and Prevention of COPD. 2017. Available from: http://goldcopd.org. Accessed November 10, 2016. | ||
Han MK, Agusti A, Calverley PM, et al. Chronic obstructive pulmonary disease phenotypes: the future of COPD. Am J Respir Crit Care Med. 2010;182(5):598–604. | ||
Anderson D, Macnee W. Targeted treatment in COPD: a multi-system approach for a multi-system disease. Int J Chron Obstruct Pulmon Dis. 2009;4:321–335. | ||
Franssen FM, Han MK. “The ABC of GOLD A-B-C-D”. Eur Respir J. 2013;42(5):1166–1168. | ||
Soriano JB, Lamprecht B, Ramírez AS, et al. Mortality prediction in chronic obstructive pulmonary disease comparing the GOLD 2007 and 2011 staging systems: a pooled analysis of individual patient data. Lancet Respir Med. 2015;3(6):443–450. | ||
Goossens LM, Leimer I, Metzdorf N, Becker K, Rutten-van Mölken MP, Rutten-van MM. Does the 2013 GOLD classification improve the ability to predict lung function decline, exacerbations and mortality: a post-hoc analysis of the 4-year UPLIFT trial. BMC Pulm Med. 2014;14(14):163. | ||
Kim J, Yoon HI, Oh YM, Ym O, et al. Lung function decline rates according to GOLD group in patients with chronic obstructive pulmonary disease. Int J Chron Obstruct Pulmon Dis. 2015;10:1819–1827. | ||
Han MK, Muellerova H, Curran-Everett D, et al. GOLD 2011 disease severity classification in COPDGene: a prospective cohort study. Lancet Respir Med. 2013;1(1):43–50. | ||
Vogelmeier CF, Criner GJ, Martinez FJ, et al. Global Strategy for the Diagnosis, Management, and Prevention of Chronic Obstructive Lung Disease 2017 Report. GOLD Executive Summary. Am J Respir Crit Care Med. 2017;195(5):557–582. | ||
Tudoric N, Koblizek V, Miravitlles M, et al. GOLD 2017 on the way to a phenotypic approach? Analysis from the Phenotypes of COPD in Central and Eastern Europe (POPE) Cohort. Eur Respir J. 2017;49(4):1602518. | ||
Sun L, Chen Y, Wu R, Lu M, Yao W. Changes in definition lead to changes in the clinical characteristics across COPD categories according to GOLD 2017: a national cross-sectional survey in China. Int J Chron Obstruct Pulmon Dis. 2017;12:3095–3102. | ||
Högman M, Sulku J, Ställberg B, et al. 2017 Global Initiative for Chronic Obstructive Lung Disease reclassifies half of COPD subjects to lower risk group. Int J Chron Obstruct Pulmon Dis. 2018;13(13):165–173. | ||
Marçôa R, Rodrigues DM, Dias M, et al. Classification of Chronic Obstructive Pulmonary Disease (COPD) according to the new Global Initiative for Chronic Obstructive Lung Disease (GOLD) 2017: Comparison with GOLD 2011. COPD. 2018;15(1):21–26. | ||
Wang K, Zeng GQ, Li R, et al. Cycle ergometer and inspiratory muscle training offer modest benefit compared with cycle ergometer alone: a comprehensive assessment in stable COPD patients. Int J Chron Obstruct Pulmon Dis. 2017;12:2655–2668. | ||
Jones PW, Harding G, Berry P, Wiklund I, Chen WH, Kline Leidy N, Kline LN. Development and first validation of the COPD Assessment Test. Eur Respir J. 2009;34(3):648–654. | ||
Bestall JC, Paul EA, Garrod R, Garnham R, Jones PW, Wedzicha JA. Usefulness of the Medical Research Council (MRC) dyspnoea scale as a measure of disability in patients with chronic obstructive pulmonary disease. Thorax. 1999;54(7):581–586. | ||
Vestbo J, Hurd SS, Agustí AG, et al. Global strategy for the diagnosis, management, and prevention of chronic obstructive pulmonary disease: GOLD executive summary. Am J Respir Crit Care Med. 2013;187(4):347–365. | ||
Standardization of Spirometry, 1994 Update. American Thoracic Society. Am J Respir Crit Care Med. 1995;152(3):1107–1136. | ||
American Thoracic Society/European Respiratory Society. ATS/ERS Statement on respiratory muscle testing. Am J Respir Crit Care Med. 2002;166(4):518–624. | ||
Bruschi C, Cerveri I, Zoia MC, et al. Reference values of maximal respiratory mouth pressures: a population-based study. Am Rev Respir Dis. 1992;146(3):790–793. | ||
Jones PW, Quirk FH, Baveystock CM, Littlejohns P. A self-complete measure of health status for chronic airflow limitation. The St. George’s Respiratory Questionnaire. Am Rev Respir Dis. 1992;145(6):1321–1327. | ||
ATS statement, ATS Committee on Proficiency Standards for Clinical Pulmonary Function Laboratories, Statement ATS. ATS statement: guidelines for the six-minute walk test. Am J Respir Crit Care Med. 2002;166(1):111–117. | ||
Vestbo J, Prescott E, Almdal T, et al. Body mass, fat-free body mass, and prognosis in patients with chronic obstructive pulmonary disease from a random population sample: findings from the Copenhagen City Heart Study. Am J Respir Crit Care Med. 2006;173(1):79–83. | ||
Ischaki E, Papatheodorou G, Gaki E, Papa I, Koulouris N, Loukides S. Body mass and fat-free mass indices in COPD: relation with variables expressing disease severity. Chest. 2007;132(1):164–169. | ||
Bjelland I, Dahl AA, Haug TT, Neckelmann D. The validity of the Hospital Anxiety and Depression Scale. An updated literature review. J Psychosom Res. 2002;52(2):69–77. | ||
Celli BR, Cote CG, Marin JM, et al. The body-mass index, airflow obstruction, dyspnea, and exercise capacity index in chronic obstructive pulmonary disease. N Engl J Med. 2004;350(10):1005–1012. | ||
Agusti A, Edwards LD, Celli B, et al. Characteristics, stability and outcomes of the 2011 GOLD COPD groups in the ECLIPSE cohort. Eur Respir J. 2013;42(3):636–646. | ||
Wedzicha JA, Seemungal TA. COPD exacerbations: defining their cause and prevention. Lancet. 2007;370(9589):786–796. | ||
Seemungal TA, Donaldson GC, Paul EA, Bestall JC, Jeffries DJ, Wedzicha JA. Effect of exacerbation on quality of life in patients with chronic obstructive pulmonary disease. Am J Respir Crit Care Med. 1998;157(5 Pt 1):1418–1422. | ||
Jones PW, Nadeau G, Small M, Adamek L. Characteristics of a COPD population categorised using the GOLD framework by health status and exacerbations. Respir Med. 2014;108(1):129–135. | ||
de Torres JP, Casanova C, Marín JM, et al. Prognostic evaluation of COPD patients: GOLD 2011 versus BODE and the COPD comorbidity index COTE. Thorax. 2014;69(9):799–804. | ||
Lange P, Marott JL, Vestbo J, et al. Prediction of the clinical course of chronic obstructive pulmonary disease, using the new GOLD classification: a study of the general population. Am J Respir Crit Care Med. 2012;186(10):975–981. |
 © 2018 The Author(s). This work is published and licensed by Dove Medical Press Limited. The full terms of this license are available at https://www.dovepress.com/terms.php and incorporate the Creative Commons Attribution - Non Commercial (unported, v3.0) License.
By accessing the work you hereby accept the Terms. Non-commercial uses of the work are permitted without any further permission from Dove Medical Press Limited, provided the work is properly attributed. For permission for commercial use of this work, please see paragraphs 4.2 and 5 of our Terms.
© 2018 The Author(s). This work is published and licensed by Dove Medical Press Limited. The full terms of this license are available at https://www.dovepress.com/terms.php and incorporate the Creative Commons Attribution - Non Commercial (unported, v3.0) License.
By accessing the work you hereby accept the Terms. Non-commercial uses of the work are permitted without any further permission from Dove Medical Press Limited, provided the work is properly attributed. For permission for commercial use of this work, please see paragraphs 4.2 and 5 of our Terms.