")
Back to Journals » Research and Reports in Urology » Volume 13
Comparison of Risk Factors for the Development of Proteinuria After Radical Nephrectomy for Renal Cell Carcinoma
Authors Lee CU , Choi DK, Chung JH, Song W , Kang M, Sung HH , Jeong BC, Seo SI, Jeon SS, Lee HM, Jeon HG
Received 7 May 2021
Accepted for publication 18 June 2021
Published 25 June 2021 Volume 2021:13 Pages 407—414
DOI https://doi.org/10.2147/RRU.S317543
Checked for plagiarism Yes
Review by Single anonymous peer review
Peer reviewer comments 3
Editor who approved publication: Dr Jan Colli
Chung Un Lee,1,* Don Kyoung Choi,2,* Jae Hoon Chung,1 Wan Song,1 Minyong Kang,1 Hyun Hwan Sung,1 Byong Chang Jeong,1 Seong Il Seo,1 Seong Soo Jeon,1 Hyun Moo Lee,1 Hwang Gyun Jeon1
1Department of Urology, Samsung Medical Center, Sungkyunkwan University School of Medicine, Seoul, Korea; 2Department of Urology, Kangnam Sacred Heart Hospital, Hallym University School of Medicine, Seoul, Korea
*These authors contributed equally to this work
Correspondence: Hwang Gyun Jeon
Department of Urology, Samsung Medical Center, Sungkyunkwan University School of Medicine, 81 Irwon-ro, Gangnam-gu, Seoul, 135-710, Korea
Tel +82-2-2148-9599
Fax +82-2-3410-6992
Email [email protected]
Purpose: We investigated compensatory structural hypertrophy and functional hyperfiltration in patients with renal cell carcinoma (RCC) after radical nephrectomy (RN) according to the presence of proteinuria.
Patients and Methods: We retrospectively enrolled 471 patients who underwent RN for RCC between October 2005 and December 2013. These patients were divided into two groups according to the presence of postoperative proteinuria (trace or greater (≥ 1+) urine dipstick). We obtained computed tomography images before and 1 year after surgery to calculate the functional renal volume (FRV). The preoperative and postoperative Chronic Kidney Disease Epidemiology Collaboration equation-calculated glomerular filtration rates (CKD-EPI GFRs) per unit FRV (GFR/FRV) were used to calculate the degree of hyperfiltration.
Results: The mean patient age was 54.7± 11.1 years, and the mean preoperative CKD-EPI GFR, FRV, and GFR/FRV were 89.3± 13.3 mL/min/1.73 m2, 357.2± 71.8 cm3, and 0.26± 0.05 mL/min/1.73 m2/cm3, respectively. The percentage reduction rate of the GFR was not significantly different according to the presence of proteinuria (normal: − 28.5± 11.6% vs proteinuria: − 28.7± 15%; p=0.902); however, the postoperative hypertrophic FRV in the remnant kidney was significantly different (normal: 17.5± 9.1% vs proteinuria: 13.8± 14.1%; p=0.001). Meanwhile, the change in the percentage rate of the GFR/FRV was not significantly different (normal: 21.1± 23% vs proteinuria: 23.8± 28.3%; p=0.324). Multivariate logistic regression analysis revealed that age (p=0.010) and the GFR/FRV (p< 0.001) were significant predictors of postoperative proteinuria.
Conclusion: Compensatory structural hypertrophy and functional hyperfiltration are positive adaptations that reduce the occurrence of proteinuria.
Keywords: nephrectomy, proteinuria, glomerular filtration rate, hypertrophy, renal cell carcinoma
Introduction
Radical nephrectomy (RN) or partial nephrectomy (PN) is the gold standard surgical treatment option in patients with renal cell carcinoma (RCC).1,2 However, one of the major problems in the surgical treatment of RCC is that RN or PN increases the risk of postoperative proteinuria and chronic kidney disease (CKD) significantly with an estimated glomerular filtration rate (GFR) of <60 mL/min/1.73 m2.1,3 Furthermore, proteinuria not only indicates the severity of CKD but is also strongly related to CKD progression.4 Consequently, the occurrence of CKD has been related to an increased risk of all-cause mortality and cardiovascular disease in large population-based cohort studies, even when controlling for other confounding factors.5,6
Previous studies have shown that the occurrence of CKD or proteinuria after renal surgery is affected by older age, presence of diabetes mellitus (DM), type of surgery (RN or PN), and low preoperative GFR.3,7–9 Particularly, a low preoperative GFR is a well-known factor for predicting the rate of postoperative decline in the GFR, as the decrease in the postoperative GFR is greater in patients with a preoperative GFR of <60 mL/min/1.73 m2 than in those with a preoperative GFR of >60 mL/min/1.73 m2.10,11 Additionally, compared with healthy individuals, approximately 26%–34% of patients with RCC show a decline in renal function before renal surgery.12,13
In a recent study, hypertrophic functional renal volume (FRV) has been suggested as a factor affecting the recovery of postoperative GFR in the remnant kidney.14,15 Following renal surgery, the postoperative GFR recovers owing to compensatory structural hypertrophy in the remnant kidney and functional hyperfiltration in the renal glomeruli. Some studies in the clinical setting have suggested that the rate of structural hypertrophy in the remnant kidney is significantly related to postoperative recovery of renal function.16,17 However, with respect to functional adaptation after renal surgery, hyperfiltration has only been observed in animal studies; no studies have yet been conducted in clinical settings. In some experimental animal trials involving reduced renal parenchyma, fractional sodium reabsorption and renal blood flow were reduced acutely following nephrectomy but recovered rapidly to the preoperative level.12,13 However, in a previous animal study, it was questioned whether functional hyperfiltration had a long-term positive or negative effect on the kidneys in a clinical setting.18
In this study, preoperative and postoperative measurements were performed regarding compensatory hypertrophy in patients with a normal preoperative GFR. The GFR was measured per unit FRV after examining the hyperfiltration rate. The data were used to determine the effects of proteinuria which is strongly associated with CKD for assessing on the volumetric and functional adaptations after surgery.
Materials and Methods
This study was approved by the Institutional Review Board of Samsung Medical Center (2018–11-079) and performed in accordance with the Declaration of Helsinki. Informed consent of patients was waived owing to the study design, but all patient data complied with relevant privacy regulations and data protection. Among the 610 patients who underwent RN between October 2005 and December 2013, 471 patients had available GFR data and computed tomography (CT) images from both before and up to ≥1 year after the surgery and were thus enrolled in this study. All clinical data were recorded from individual patient medical records at the time of admission for the surgery. Patients with a solitary kidney, who underwent bilateral RCC, who had a preoperative GFR of <60 mL/min/1.73 m2, or who had proteinuria before surgery were excluded from the study. The GFR was calculated using the Chronic Kidney Disease Epidemiology Collaboration (CKD-EPI) equation.19 The patients were divided into two groups according to the presence of proteinuria 1 year after surgery. Proteinuria was defined as trace or greater (≥1+) on urine dipstick. All methods were performed in accordance with the relevant guidelines and regulations.
Preoperative CT images within 60 days of RN were included in this study. CT was performed using a 16 or 64 row multi-detector CT scanner (Siemens, Erlangen, Germany) according to the standard clinical protocol for abdominopelvic CT. Renal parenchyma images were obtained at 5-mm slice thickness. Normal enhancement (>50 Hounsfield units [HU]) of the renal parenchyma indicated the functional area on the CT images. Based on the preoperative cross-sectional CT images, venous or portal phase images were extracted using Xelis software (Infinitt, Seoul, Korea). A threshold of 50 HU was selected for this study. After manual rendering of the tumor area, the software automatically calculated the three-dimensional tumor volume.18 The overall preoperative FRV was calculated by summing the operated kidney FRV minus the tumor volume and remnant kidney FRV based on the preoperative CT images. The postoperative FRV was calculated only from the remnant kidney FRV from the CT images obtained 1 year after surgery. The preoperative GFR per unit volume (GFR/FRV) was calculated by dividing the preoperative CKD-EPI equation-calculated GFR (CKD-EPI GFR) by the preoperative overall FRV. As such, the postoperative GFR/FRV was calculated by dividing the postoperative CKD-EPI GFR by the postoperative FRV.
Continuous variables were summarized as means ± standard deviations and compared using analysis of variance. Categorical variables were summarized as frequency counts and percentages and compared using Pearson’s chi-square test. According to the presence of proteinuria, the CKD-EPI GFR, FRV, and GFR/FRV were assessed in the grouped patients, and the differences were analyzed. Using logistic regression analysis, we determined the factors that affected the presence of proteinuria 1 year after surgery. Statistical significance was set at p-values of <0.05. All analyses were performed using the Statistical Product and Services Solutions statistical software (version 20.0, Chicago, IL, USA).
Results
A total of 471 patients with RCC were enrolled in this study. The clinical characteristics of all patients are shown in Table 1. The mean age at the time of RN was 54.7±11.1 years. The mean preoperative GFR was 89.3±13.3 mL/min/1.73 m2; the mean preoperative FRV was 357.2±71.8 cm3; and the mean preoperative GFR/FRV was 0.26±0.05 mL/min/1.73 m2/cm.3
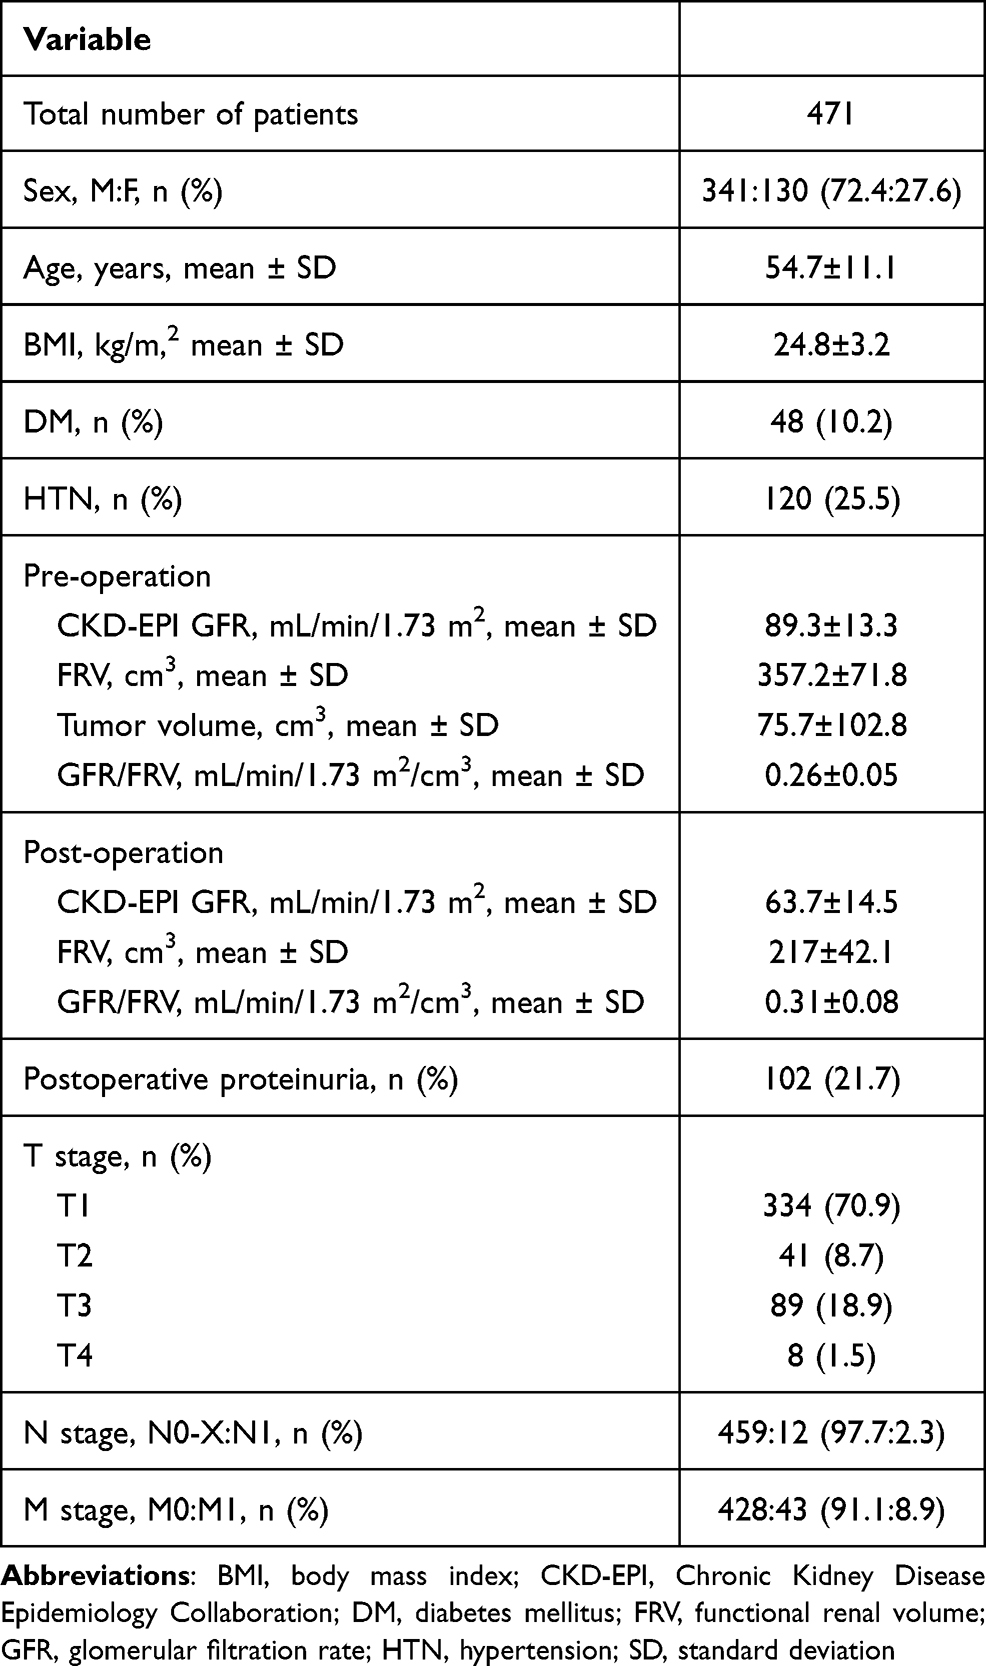 |
Table 1 Overall Cohort Characteristics |
The results of the comparison of patients grouped according to the presence of postoperative proteinuria are shown in Table 2. Of the 471 patients, 369 (78.3%) and 102 (21.7%) belonged to the postoperative normal and proteinuria groups, respectively. The body mass index (BMI) did not differ between the two groups; however, sex, age, and presence of hypertension (HTN) and DM differed significantly (p<0.05). The mean preoperative GFRs in the postoperative normal and proteinuria groups were 90.4±17.5 mL/min/1.73 m2 and 85.4±18.3 mL/min/1.73 m2, respectively (p=0.001). The preoperative volume of the operative kidney significantly differed between the groups (173.5±40.7 cm3 vs 185.7±59 cm3; p=0.017) as did the preoperative volume of the remnant kidney (177.6±34.4 cm3 vs 194±40 cm3; p<0.001). Similarly, the preoperative GFR/FRV significantly differed between them (0.27±0.06 mL/min/1.73 m2/cm3 vs 0.23±0.05 mL/min/1.73 m2/cm3; p<0.001).
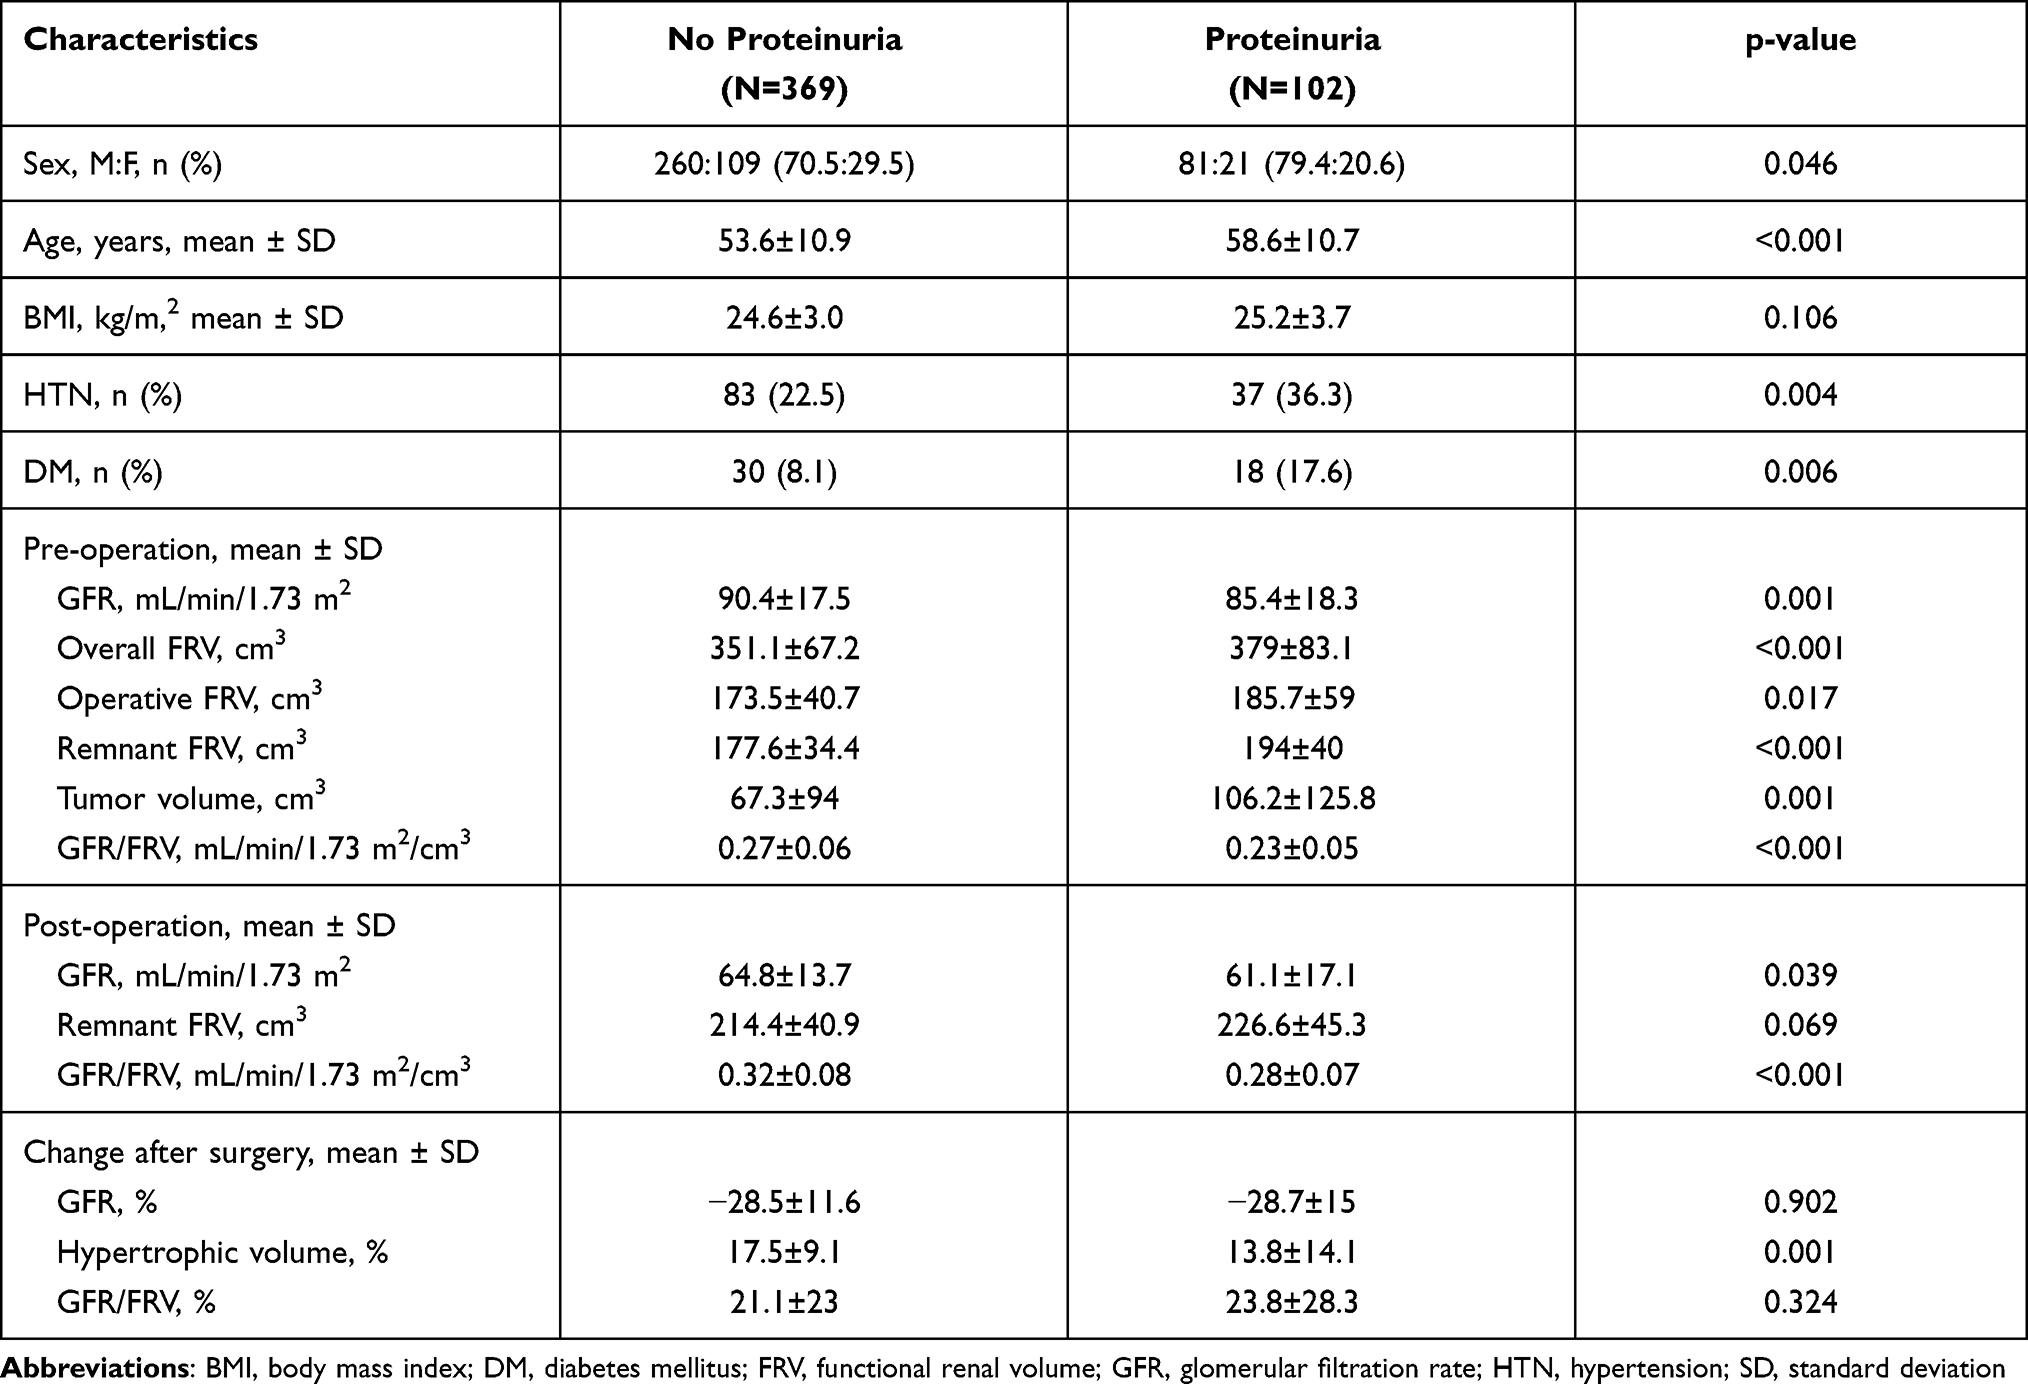 |
Table 2 Pre- and Post-Operative Differences According to the Presence of Proteinuria |
Significant differences between the postoperative normal and proteinuria groups were also observed at the 1-year postoperative follow-up in terms of the GFR (64.8±13.7 mL/min/1.73 m2 vs 61.1±17.1 mL/min/1.73 m2; p=0.039) and GFR/FRV (0.32±0.08 mL/min/1.73 m2/cm3 vs 0.28±0.07 mL/min/1.73 m2/cm3; p<0.001); however, the remnant FRV did not differ significantly (214.4±40.9 cm3 vs 226.6±45.3 cm3; p=0.069).
The comparison of postoperative changes between the two groups showed that the GFR decreased by −28.5±11.6% in the postoperative normal group and by −28.7±15% in the postoperative proteinuria group (Figure 1A), p=0.902). Meanwhile, the postoperative volume of the remnant kidney increased by 17.5±9.1% in the postoperative normal group and by 13.8±14.1% in the postoperative proteinuria group, with a significant difference between them (Figure 1B), p=0.001). Conversely, the overall GFR/FRV increased in average by 21.1±23% in the postoperative normal group and by 23.8±28.3% in the postoperative proteinuria group (Figure 1C), p=0.324).
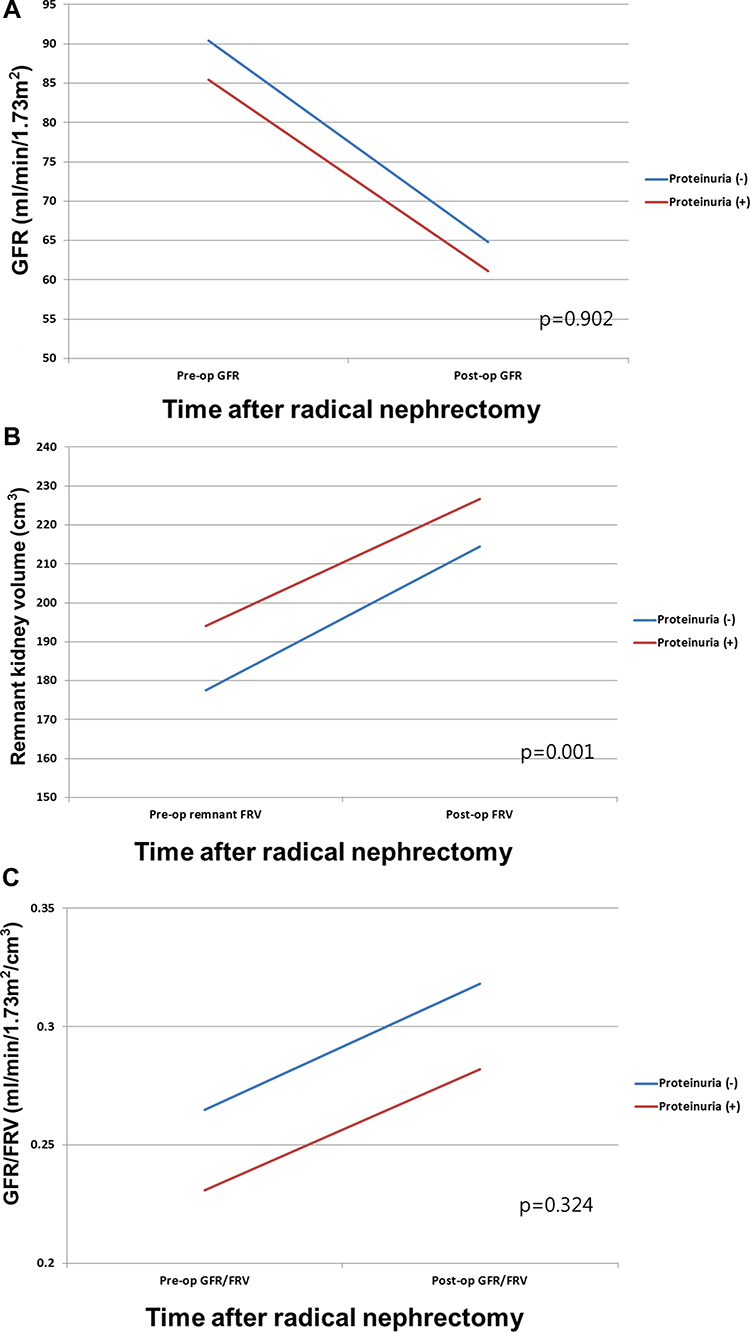 |
Figure 1 (A) Preoperative GFR and postoperative reduction in GFR according to proteinuria. (B) Preoperative functional renal volume of the remnant kidney and degree of hypertrophy according to proteinuria. (C) Changes in preoperative and 1-year postoperative GFR/FRV according to proteinuria. |
Table 3 shows the results of logistic regression analysis performed to identify the predictive factors of proteinuria. Multivariate regression analysis revealed that age (p=0.010) and the GFR/FRV (p<0.001) were significant predictors of postoperative proteinuria.
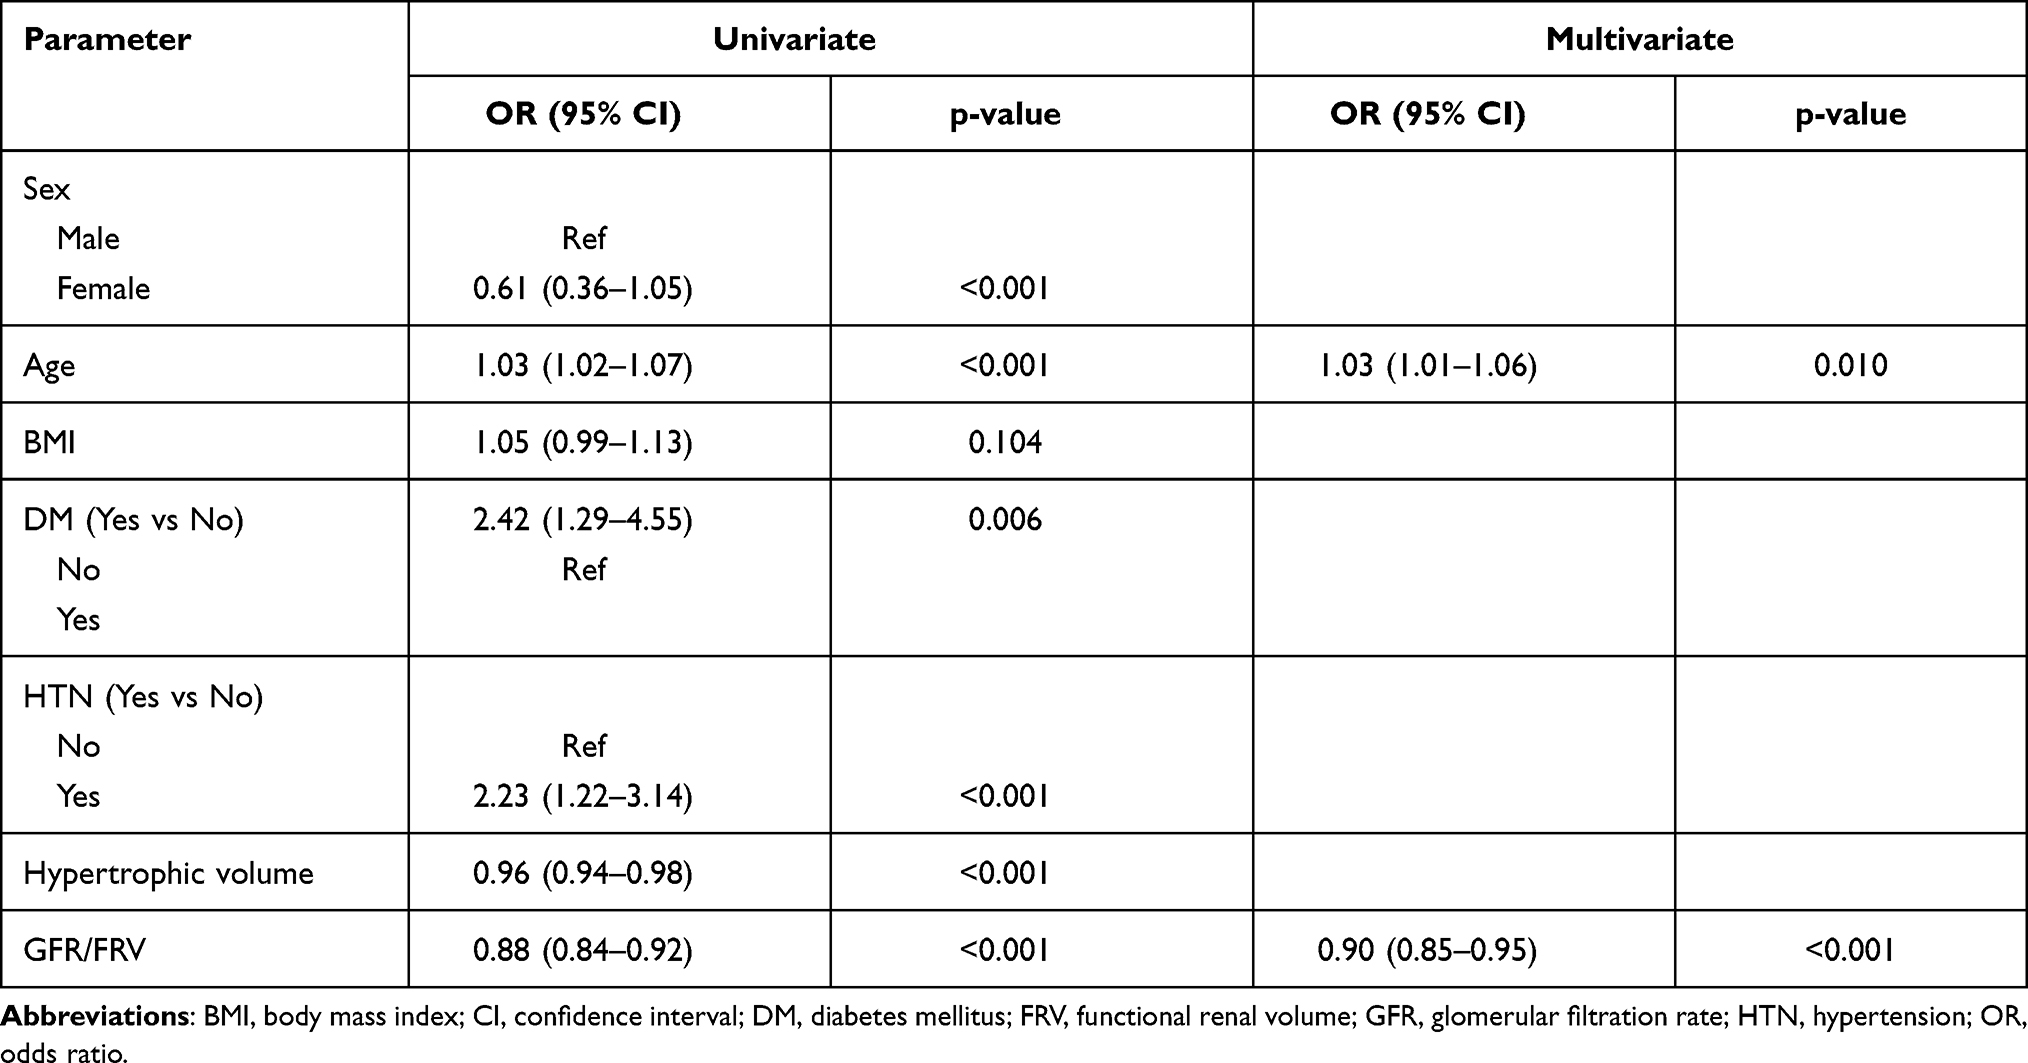 |
Table 3 Logistic Regression Analysis to Identify the Predictive Factors of Proteinuria |
Discussion
Renal surgery has an impact on the postoperative GFR owing to surgical removal of functional renal parenchyma or damage to functioning nephrons.1,20 Thus, CKD following renal surgery has a major influence on the all-cause mortality and the subsequent risk of cardiovascular events.5,6 Furthermore, postoperative proteinuria increases the risk of CKD and thus the mortality in patients with RCC.21,22 Recently, numerous studies have been established to determine the factors predictive of postoperative CKD and proteinuria.4,5,22,23 After renal surgery, the remnant kidney is affected by compensatory structural hypertrophy and functional filtration through several factors, such as patient body size, sex, and ethnicity.24,25 Therefore, accurate individual prediction of the recovery of renal function is limited. To compensate for these limited predictive factors, we previously investigated the increase in the incidence of compensatory hypertrophy and functional filtration in the remnant kidney based on the GFR/FRV.18 However, in that study, it was not clear whether the increase in the GFR per unit volume would positively or negatively affect the postoperative recovery of renal function; further, no other studies have investigated the effect of increased filtration per unit FRV on the occurrence of proteinuria in patients. This study was performed to determine the volume of structural hypertrophy and GFR/FRV per unit FRV in relation to the development of proteinuria in patients 1 year after surgery.
When the two study groups were divided according to the presence of proteinuria after renal surgery, significant differences were observed in baseline characteristics, including sex, age, and presence of HTN and DM (each p<0.05). This difference may be attributed to the fact that the study was performed in patients without a GFR of <60 mL/min/1.73 m2 and proteinuria preoperatively. In terms of preoperative renal function and functional volume, the patients without proteinuria were found to have significantly better renal function (90.4±17.5 mL/min/1.73 m2 vs 85.4±18.3 mL/min/1.73 m2; p=0.001); however, the patients with proteinuria were found to have a higher FRV (351.1±67.2 cm3 vs 379±83.1 cm3; p<0.001). Meanwhile, the postoperative GFR/FRV was found to be 0.27±0.06 mL/min/1.73 m2/cm3 among the patients without proteinuria, which was significantly higher than 0.23±0.05 mL/min/1.73 m2/cm3 among the patients with proteinuria (p<0.001). After surgery, there was no significant difference observed in the FRV between the two groups (214.4±40.9 cm3 vs 226.6±45.3 cm3; p=0.069); however, there was a significant difference found in the GFR (64.8±13.7 mL/min/1.73 m2 vs 61.1±17.1 mL/min/1.73 m2; p=0.039) and GFR/FRV (0.32±0.08 mL/min/1.73 m2/cm3 vs 0.28±0.07 mL/min/1.73 m2/cm3; p<0.001).
In a recent study, Tourojman et al suggested that the prevalence of proteinuria is lower in the presence of a higher preoperative GFR; similar to our findings, this finding supports the result of a previous study that investigated patients with a higher GFR with no proteinuria.4 In contrast, from a volumetric point of view, the overall FRV was found to be higher in patients with preoperative proteinuria. No previous studies have reported a correlation between the FRV and proteinuria. Conversely, Hosokawa et al reported that the incidence of proteinuria was higher in patients with a GFR/FRV of <0.24, although it can be indirectly expected that a lower GFR/FRV may result in the development of proteinuria.8
This study revealed that the GFR decreased by −28.5±11.6% among the patients without proteinuria and by −28.7±15% among those with proteinuria (p=0.902). However, the hypertrophic FRV after RN was 17.5±9.1% among the patients without proteinuria and 13.8±14.1% among those with proteinuria, with an observed significant difference (p=0.001). Meanwhile, the GFR/FRV increased by 21.1±23% among the patients without proteinuria and by 23.8±28.3% among those with proteinuria, without any significant difference (p=0.324).
Previous studies have suggested that the changes in the remnant kidney are attributed to the division between postoperative structural adaptation and functional adaptation.24 As a structural adaptation, compensatory hypertrophy is characterized by structural hypertrophy after renal surgery. Recently, this was estimated using volumetric measurement software via CT, wherein the percentage was found to be 21.2% after RN and 10.9% after PN for RCC.15 Further, the degree of compensatory hypertrophic FRV was dependent on the BMI, age, and presence of HTN.26 Animal studies have shown that structural hypertrophy causes lengthening of the proximal and distal tubules in the glomeruli, which consequently functionally increases fractional sodium reabsorption.27 In this study, a significant difference was observed in the remnant kidney volume between the two groups after surgery; those without proteinuria were found to have a 17.5±9.1% increase and those with proteinuria were found to have a 13.8±14.1% increase. After RN, both structural and functional adaptations can be observed.
To date, functional adaptation has been explained as the maintenance of GFR via induction of glomerular hyperfiltration that increases renal blood flow.24 Previous studies have suggested that the GFR can reach up to 70% of the preoperative level several weeks after donor nephrectomy.26,28 In a previous animal study, such changes were investigated; the GFR reached up to 80% of the preoperative renal function level by postoperative day 32, after which the GFR stabilized.17 A decreased FRV reduces afferent arteriolar resistance and thus improves effective plasma blood flow.28 Additionally, nitric oxide production increases, thereby increasing renal plasma blood flow and the single-nephron GFR (SNGFR).29 Consequently, mesangial cells in a single nephron lead derivation of chemokines to increase the SNGFR and ultimately cause compensatory hypertrophy.14,24 However, through adaptation, hyperfiltration increases the GFR as well as the possibility of nephron injury, suggesting maladaptation in relation to the presence of proteinuria or HTN.24 In this study, the GFR/FRV increased from 0.27±0.06 mL/min/1.73 m2/cm3 to 0.32±0.08 mL/min/1.73 m2/cm3 among patients without proteinuria and from 0.23±0.05 mL/min/1.73 m2/cm3 to 0.28±0.07 mL/min/1.73 m2/cm3 among patients with proteinuria; therefore, a difference could be seen between the two groups. Patients without proteinuria showed higher hyperfiltration per unit area than patients with proteinuria; this measurement showed an insignificant difference in the growth rate between the two groups (21.1±23% vs 23.8±28.3%; p=0.324).
We then analyzed the factors that can cause proteinuria through multivariate logistic regression analysis, which showed that increased age was linked to a higher proteinuria occurrence rate (p=0.010) and that a higher GFR/FRV was significantly linked to a decreased proteinuria occurrence rate (p<0.001). Based on this finding, we can posit that GFR/FRV changes after RN have a positive effect on the occurrence of proteinuria, rather than maladaptation-induced proteinuria, causing hyperfiltration.
It is difficult to clinically measure the degree of recovery for functional adaptation. The SNGFR was mostly measured in animal models because such measurements would involve invasive procedures in the clinical setting. To date, human studies have used CT scans to measure structural hypertrophy following renal surgery but could not measure changes in functional adaptation.14 Nevertheless, in this study, we measured the renal volume before and 1 year after RN and calculated the GFR per cm3 of the FRV to estimate the compensatory functional changes 1 year after RN. In this study, the increase in the unit area filtration after RN was considered a positive adaptation that decreases the occurrence of proteinuria and improves the prognosis of patients after RN.
This study has several limitations. First, this study was retrospective in nature. Second, the GFR values used in this study were derived using the CKD-EPI equation. More accurate measurements of fractionated renal function (ie, renal scintigraphy) could not be obtained preoperatively; thus, preoperative function of the remnant kidney could not be accurately represented. Additionally, our study used the dipstick test for the pre- and post-operative assessments of proteinuria. The dipstick test is less sensitive and less reliable than the quantified measurement based on 24-hour urine collection. Further prospective studies are needed to obtain more quantifiable estimates of proteinuria. Finally, the method for assessing the FRV employed in this study was based on CT, which is not a standardized method despite it being precise.
Conclusion
Development of proteinuria after RN increases the incidence of CKD and worsens patients’ prognosis. After surgery, structural hypertrophy and functional hyperfiltration occur for GFR recovery through compensatory adaptation, which act as positive adaptations to decrease the occurrence of proteinuria. Therefore, the renal function per unit area can be used as a prognostic factor to determine the occurrence of proteinuria after surgery; however, additional research is necessary to evaluate this value.
Disclosure
All authors have no conflicts of interest to declare.
References
1. Huang WC, Levey AS, Serio AM, et al. Chronic kidney disease after nephrectomy in patients with renal cortical tumours: a retrospective cohort study. Lancet Oncol. 2006;7(9):735–740. doi:10.1016/S1470-2045(06)70803-8
2. Yokoyama M, Fujii Y, Iimura Y, et al. Longitudinal change in renal function after radical nephrectomy in Japanese patients with renal cortical tumors. J Urol. 2011;185(6):2066–2071. doi:10.1016/j.juro.2011.02.005
3. Malcolm JB, Bagrodia A, Derweesh IH, et al. Comparison of rates and risk factors for developing chronic renal insufficiency, proteinuria and metabolic acidosis after radical or partial nephrectomy. BJU Int. 2009;104(4):476–481. doi:10.1111/j.1464-410X.2009.08376.x
4. Tourojman M, Kirmiz S, Boelkins B, et al. Impact of Reduced Glomerular Filtration Rate and Proteinuria on Overall Survival of Patients with Renal Cancer. J Urol. 2016;195(3):588–593. doi:10.1016/j.juro.2015.09.083
5. Levey AS, Coresh J. Chronic kidney disease. Lancet. 2012;379(9811):165–180. doi:10.1016/S0140-6736(11)60178-5
6. Go AS, Chertow GM, Fan D, McCulloch CE, Hsu CY. Chronic kidney disease and the risks of death, cardiovascular events, and hospitalization. N Engl J Med. 2004;351(13):1296–1305. doi:10.1056/NEJMoa041031
7. Kim SH, Lee SE, Hong SK, et al. Incidence and risk factors of chronic kidney disease in korean patients with t1a renal cell carcinoma before and after radical or partial nephrectomy. Jpn J Clin Oncol. 2013;43(12):1243–1248. doi:10.1093/jjco/hyt149
8. Hosokawa Y, Tanaka N, Mibu H, et al. Follow-up study of unilateral renal function after nephrectomy assessed by glomerular filtration rate per functional renal volume. World J Surg Oncol. 2014;12:59. doi:10.1186/1477-7819-12-59
9. Zhang Z, Zhao J, Zabell J, et al. Proteinuria in Patients Undergoing Renal Cancer Surgery: impact on Overall Survival and Stability of Renal Function. Eur Urol Focus. 2016;2(6):616–622. doi:10.1016/j.euf.2016.01.003
10. Lane BR, Campbell SC, Demirjian S, Fergany AF. Surgically induced chronic kidney disease may be associated with a lower risk of progression and mortality than medical chronic kidney disease. J Urol. 2013;189(5):1649–1655. doi:10.1016/j.juro.2012.11.121
11. Demirjian S, Lane BR, Derweesh IH, Takagi T, Fergany A, Campbell SC. Chronic kidney disease due to surgical removal of nephrons: relative rates of progression and survival. J Urol. 2014;192(4):1057–1062. doi:10.1016/j.juro.2014.04.016
12. Lane BR, Whelan CM. The influence of surgical approach to the renal mass on renal function. Urol Clin North Am. 2012;39(2):191–8, vi. doi:10.1016/j.ucl.2012.01.007
13. Lane BR, Demirjian S, Derweesh IH, Riedinger CB, Fergany AF, Campbell SC. Is all chronic kidney disease created equal? Curr Opin Urol. 2014;24(2):127–134. doi:10.1097/MOU.0000000000000029
14. Takagi T, Mir MC, Sharma N, et al. Compensatory hypertrophy after partial and radical nephrectomy in adults. J Urol. 2014;192(6):1612–1618. doi:10.1016/j.juro.2014.06.018
15. Jeon HG, Gong IH, Hwang JH, Choi DK, Lee SR, Park DS. Prognostic significance of preoperative kidney volume for predicting renal function in renal cell carcinoma patients receiving a radical or partial nephrectomy. BJU Int. 2012;109(10):1468–1473. doi:10.1111/j.1464-410X.2011.10531.x
16. Chamberlain RM, Shirley DG. Time course of the renal functional response to partial nephrectomy: measurements in conscious rats. Exp Physiol. 2007;92(1):251–262. doi:10.1113/expphysiol.2006.034751
17. Shirley DG, Walter SJ. Acute and chronic changes in renal function following unilateral nephrectomy. Kidney Int. 1991;40(1):62–68.
18. Choi DK, Jung SB, Park BH, et al. Compensatory Structural and Functional Adaptation after Radical Nephrectomy for Renal Cell Carcinoma According to Preoperative Stage of Chronic Kidney Disease. J Urol. 2015;194(4):910–915. doi:10.1016/j.juro.2015.04.093
19. Matsushita K, Mahmoodi BK, Woodward M, et al. Comparison of risk prediction using the CKD-EPI equation and the MDRD study equation for estimated glomerular filtration rate. JAMA. 2012;307(18):1941–1951. doi:10.1001/jama.2012.3954
20. Jeon HG, Choo SH, Sung HH, et al. Small tumour size is associated with new-onset chronic kidney disease after radical nephrectomy in patients with renal cell carcinoma. Eur J Cancer. 2014;50(1):64–69. doi:10.1016/j.ejca.2013.08.018
21. Wang HE, Jain G, Glassock RJ, Warnock DG. Comparison of absolute serum creatinine changes versus Kidney Disease: improving Global Outcomes consensus definitions for characterizing stages of acute kidney injury. Nephrol Dial Transplant. 2013;28(6):1447–1454. doi:10.1093/ndt/gfs533
22. O’Donnell K, Tourojman M, Tobert CM, et al. Proteinuria is a Predictor of Renal Functional Decline in Patients with Kidney Cancer. J Urol. 2016;196(3):658–663. doi:10.1016/j.juro.2016.03.134
23. Barlow LJ, Korets R, Laudano M, Benson M, McKiernan J. Predicting renal functional outcomes after surgery for renal cortical tumours: a multifactorial analysis. BJU Int. 2010;106(4):489–492. doi:10.1111/j.1464-410X.2009.09147.x
24. Fong D, Denton KM, Moritz KM, Evans R, Singh RR. Compensatory responses to nephron deficiency: adaptive or maladaptive? Nephrology (Carlton). 2014;19(3):119–128. doi:10.1111/nep.12198
25. Puelles VG, Douglas-Denton RN, Zimanyi MA, et al. Glomerular hypertrophy in subjects with low nephron number: contributions of sex, body size and race. Nephrol Dial Transplant. 2014;29(9):1686–1695. doi:10.1093/ndt/gfu088
26. Strandgaard S, Kamper A, Skaarup P, Holstein-Rathlou NH, Leyssac PP, Munck O. Changes in glomerular filtration rate, lithium clearance and plasma protein clearances in the early phase after unilateral nephrectomy in living healthy renal transplant donors. Clin Sci (Lond). 1988;75(6):655–659.
27. Hayslett JP, Kashgarian M, Epstein FH. Functional correlates of compensatory renal hypertrophy. J Clin Invest. 1968;47(4):774–799. doi:10.1172/JCI105772
28. Pabico RC, McKenna BA, Freeman RB. Renal function before and after unilateral nephrectomy in renal donors. Kidney Int. 1975;8(3):166–175.
29. Valdivielso JM, Perez-Barriocanal F, Garcia-Estan J, Lopez-Novoa JM. Role of nitric oxide in the early renal hemodynamic response after unilateral nephrectomy. Am J Physiol. 1999;276(6 Pt 2):R1718–23.
 © 2021 The Author(s). This work is published and licensed by Dove Medical Press Limited. The full terms of this license are available at https://www.dovepress.com/terms.php and incorporate the Creative Commons Attribution - Non Commercial (unported, v3.0) License.
By accessing the work you hereby accept the Terms. Non-commercial uses of the work are permitted without any further permission from Dove Medical Press Limited, provided the work is properly attributed. For permission for commercial use of this work, please see paragraphs 4.2 and 5 of our Terms.
© 2021 The Author(s). This work is published and licensed by Dove Medical Press Limited. The full terms of this license are available at https://www.dovepress.com/terms.php and incorporate the Creative Commons Attribution - Non Commercial (unported, v3.0) License.
By accessing the work you hereby accept the Terms. Non-commercial uses of the work are permitted without any further permission from Dove Medical Press Limited, provided the work is properly attributed. For permission for commercial use of this work, please see paragraphs 4.2 and 5 of our Terms.