")
Back to Journals » International Journal of Nephrology and Renovascular Disease » Volume 13
Comparison of Respiratory Variations of Subclavian Vein and Inferior Vena Cava in Hospitalized Patients with Kidney Disease
Authors Kaptein EM , Cantillep A, Kaptein JS , Oo Z , Thu MB , Thwe PP, Kaptein MJ
Received 4 September 2020
Accepted for publication 17 October 2020
Published 10 November 2020 Volume 2020:13 Pages 329—339
DOI https://doi.org/10.2147/IJNRD.S280458
Checked for plagiarism Yes
Review by Single anonymous peer review
Peer reviewer comments 3
Editor who approved publication: Professor Pravin Singhal
Elaine M Kaptein, 1 Alan Cantillep, 1 John S Kaptein, 1 Zayar Oo, 1 Myint B Thu, 1 Phyu Phyu Thwe, 1 Matthew J Kaptein 1, 2
1Department of Medicine, Division of Nephrology, University of Southern California, Los Angeles, CA, USA; 2Department of Medicine, Division of Nephrology, Loma Linda University Medical Center, Loma Linda, CA, USA
Correspondence: Elaine M Kaptein Tel +1 213 220-0373
Email [email protected]
Background: Accurate assessment of relative intravascular volume is critical for appropriate volume management of patients with kidney disease. Respiratory variations of inferior vena cava (IVC) diameter have been used and may correlate with those of subclavian vein (SCV) by bedside ultrasound. The purpose of this study was to assess the relationship between SCV and IVC respiratory variations by bedside ultrasound in a large group of hospitalized patients with acute and/or chronic kidney disease.
Methods: We compared 160 paired SCV and IVC bedside ultrasound studies from 102 semi-recumbent hospitalized adult patients with kidney disease. Patient encounters in which the SCV or IVC could not be clearly visualized were excluded. Collapsibility index=(Dmax–Dmin)/Dmax*100%; D=venous diameter.
Results: Relationships between SCV collapsibility index and IVC collapsibility index were not different for longitudinal and transverse views of the SCV. Correlation of SCV collapsibility index with IVC collapsibility index was 0.75 for mechanical ventilation (n=65, P< 0.0001) and 0.67 for spontaneous breathing (n=95, P< 0.0001). IVC collapsibility index cut-offs < 20% for hypervolemia and > 50% for hypovolemia corresponded to SCV collapsibility index cut-offs of < 22% and > 39%, respectively, for both mechanical ventilation and spontaneous breathing encounters. Using these cut-offs for SCV collapsibilities, assessment as hypervolemia versus not-hypervolemia had maximal sensitivity and specificity for predicting respective IVC collapsibility cut-offs of 88% for mechanical ventilation and 74% for spontaneous breathing, and assessment as hypovolemia versus not-hypovolemia had maximal sensitivity and specificity of 91% and 70%, respectively. Concordance, defined as agreement between assessment using SCV CI and assessment using IVC CI, was 85% for mechanical ventilation and 72% for spontaneous breathing when differentiating hypervolemia versus not-hypervolemia and was 89% and 71% respectively when differentiating hypovolemia versus not-hypovolemia.
Conclusion: Assessment using SCV collapsibility index in the semi-recumbent position has a reasonable concordance with assessment using IVC collapsibility index for both spontaneous breathing and mechanical ventilation, in a wide range of hospitalized patients with concurrent kidney disease, and may be a useful adjunct to assess relative intravascular volume in patients with kidney disease.
Keywords: acute kidney injury, chronic kidney disease, end-stage kidney disease, hospitalized patients, inferior vena cava ultrasound, intravascular volume assessment, point-of-care ultrasound, subclavian vein ultrasound, venous collapsibility index
Corrigendum for this paper has been published
Plain Language Summary
Hospitalized patients with kidney disease require evaluation of whether excess volume has to be removed using dialysis or with diuretics, or whether volume should be administered. Relative volume in the veins can be assessed by using ultrasound at the bedside to determine whether the larger veins of the body are full or empty. Most frequently the inferior vena cava, a large vein in the upper abdomen below the heart, is viewed using ultrasound. In some patients, this is not possible. An alternate vein that has been proposed is the subclavian vein, which is just below the clavicle or collar bone. The ultrasound findings comparing these two veins have only been reported in two small studies that did not involve patients with kidney disease. Therefore, we compared the ultrasound findings for the inferior vena cava and subclavian vein done at the same patient visit in 160 encounters from 102 hospitalized patients with kidney disease. We found that the ultrasound assessment of the volume of blood in the veins was similar for the two veins. Therefore, ultrasound of the subclavian vein may be a useful alternative to guide volume management in patients with kidney disease.
Introduction
Accurate assessment of relative intravascular volume is critical to guide volume management of patients with acute and/or chronic kidney diseases especially for those with complex comorbidities requiring hospitalization and/or intensive care. Clinical evaluation of relative intravascular volume has been shown to be largely unreliable,1,2 which may be due to non-steady state conditions and mismatch between intravascular and extravascular volume in hospitalized patients.3 More reliable and readily available techniques to assess relative intravascular volume to guide volume management are necessary to improve the quality of patient care.
Techniques to predict relative intravascular volume responsiveness, defined as an increase in cardiac output of 10% to 15% after a volume challenge, can be categorized as static or dynamic.3 Static parameters include mean values for central venous pressure, right atrial pressure (RAP), pulmonary artery occlusion pressure, maximum inferior vena cava (IVC) diameter, stroke volume, or cardiac output and generally have low sensitivity and specificity to assess relative intravascular volume and volume responsiveness3–5 Dynamic parameters which take into account the respiratory/ventilatory variation of RAP, IVC diameter, stroke volume, systolic blood pressure, or pulse pressure, vary throughout the respiratory and cardiac cycles and tend to have higher sensitivity and specificity to predict volume responsiveness.3 IVC variability by ultrasound allows a dynamic non-invasive point-of-care estimate of relative intravascular volume. Greater IVC variation predicts an increase in cardiac output in response to volume administration in patients with relative intravascular volume depletion with reasonable sensitivity and specificity,3,4,6–8 and lesser variation is associated with the ability to remove volume by ultrafiltration9 or to increase cardiac output in response to volume removal10 in kidney disease patients with relative intravascular volume overload.
Ultrasound visualization of the IVC may not be adequate in up to 16% of patients,11,12 particularly those with anterior abdominal injury or surgery, severe obesity or abdominal distention, abdominal breathing, and abdominal wall edema.13 Fatty liver, hepatocellular damage, cirrhosis and acute pancreatitis may also result in poor visualization of the IVC. In patients with abdominal compartment syndrome, the IVC collapsibility (CI) has been shown not to correlate well with extra-abdominal venous collapsibilities.14 Thus, an alternate site to assess respiratory/ventilatory variations in venous diameters by ultrasound would be desirable. Correlations of respiratory variations of the IVC with those of the internal jugular vein (R=0.62) or femoral vein (R=0.64) by ultrasound were reported to be considerably weaker than with the subclavian vein (R=0.78) in critically ill surgical patients.15 Further, many of our patients requiring nephrology consults have internal jugular and/or femoral catheters making ultrasound of these vessels impractical.
Subclavian vein (SCV) ultrasound may be useful to assess relative intravascular volume when there is difficulty visualizing the IVC and/or as a confirmatory assessment. SCV respiratory variation has been shown to be predictive of volume responsiveness in mechanically ventilated patients as defined by an increase in cardiac output with volume administration.5 One small study of subjects undergoing echocardiography for various clinical indications, showed a correlation of IVC variation while supine with SCV variation when semi-recumbent during spontaneous breathing.16 Another study of surgical intensive care unit patients during spontaneous breathing or on mechanical ventilation (positions not specified), indicated a good correlation of IVC and SCV variations.13
The purpose of this study is to assess the relationship between SCV and IVC respiratory variations by bedside ultrasound in a large group of hospitalized patients with acute and/or chronic kidney disease. We hypothesized that assessment of relative intravascular volume by SCV collapsibility index would be concordant with the assessment by IVC collapsibility index in this patient population.
Materials and Methods
Study Design, Setting and Population
This is a retrospective chart review of intensive care unit (ICU) and non-ICU adult patients with kidney disease hospitalized in a large urban academic medical center between June 6, 2017 and June 3, 2019. Only patient encounters with adequate visualization and measurement of both the SCV and IVC in the supine semi-recumbent position, who had data recorded, were included. Exclusions were patient encounters in whom the IVC or the SCV could not be clearly visualized or measured, patients under age 18 years, and those who were pregnant. During this period there were 102 patients with 160 encounters of paired SCV and IVC ultrasound studies performed at the bedside during the same nephrology consult patient care and teaching round as part of the physical examination for the assessment of relative intravascular volume (Table 1). Changes in cardiac output in response to subsequent volume management were not available for any of the encounters.
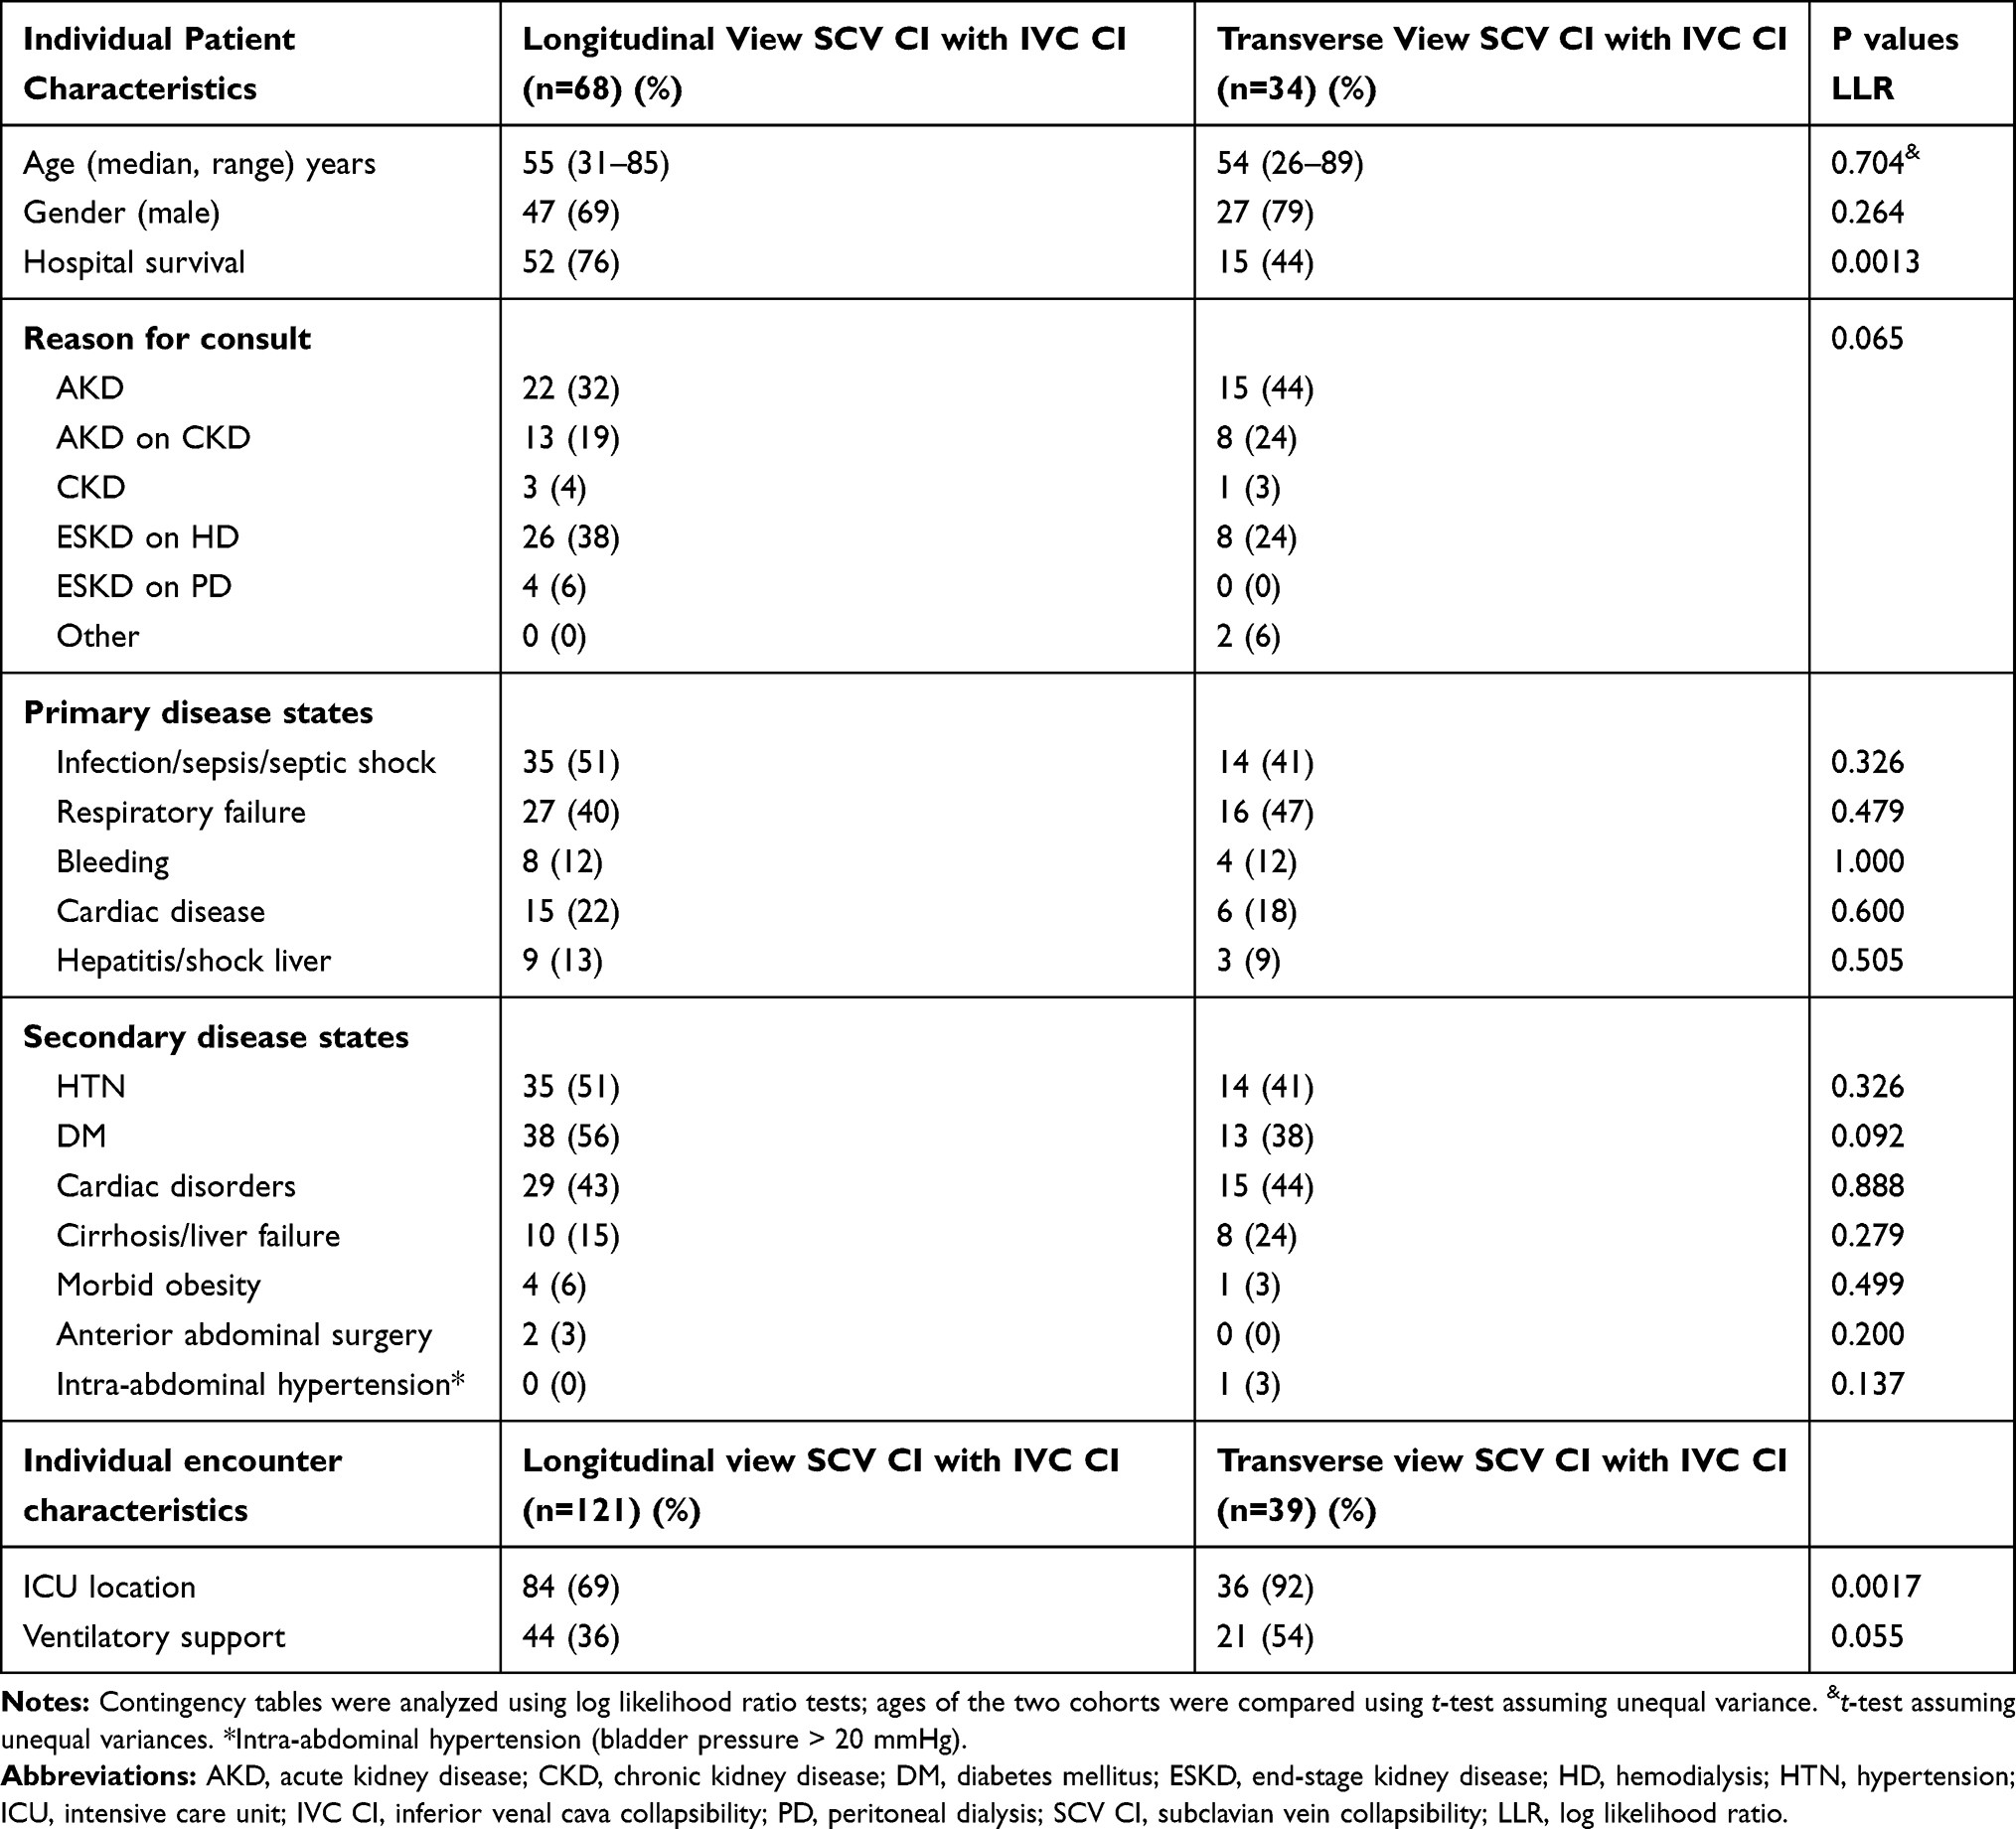 |
Table 1 Clinical Characteristics of Patients and Encounters |
Approval for this study was obtained from the University of Southern California Institutional Review Board (HS-12-00383). Procedures were followed in accordance with the ethical standards of the University of Southern California Institutional Review Board and with the Declaration of Helsinki of 1975, as revised in 2000. Written informed consent was not required for the ultrasound procedure, data collection or analysis since this was a retrospective study of data acquired for clinical purposes.
Measurements
Ultrasound (US) measurements of the IVC and SCV were performed during bedside rounds using a portable ultrasound machine (LOGIQ e B12, GE Healthcare, Wauwatosa, WI 53226) as previously described.5,9,13 All patients were imaged in the semi-recumbent position at approximately 30 to 45 degrees during quiet spontaneous breathing or with mechanical ventilation. The SCV and IVC ultrasound studies were both performed during the same patient encounter. All ultrasound studies were acquired by the senior investigator (EK) and/or by a trained Nephrology fellow (AC).
Longitudinal images of the IVC were obtained with a 3.5-MHz curvilinear probe in the subcostal view in the sagittal plane with the patient in a semi-recumbent position. Maximum and minimum IVC diameters were measured approximately 2 to 3 cm from the IVC junction with the right atrium or distal to the hepatic vein.3,13 SCV images were obtained using a high-frequency linear array probe in a subclavicular long-axis view parallel to the clavicle5 for the first cohort (performed by EK and AC), and in the transverse view with the probe positioned in the sagittal plane at the delta-pectoral triangle, perpendicular to the long axis of the clavicle for the second cohort (by EK) (Table 1);13 the two groups did not overlap temporally. Color flow doppler was found to be useful to define the SCV location and diameter particularly when the SCV diameter was small. Minimal pressure was applied to avoid compressing the SCV.13
Respiratory variations were observed for at least five cycles. A frame-by-frame analysis of grey scale (B-Mode) images was performed to identify SCV and IVC maximum (Dmax) and minimum (Dmin) diameters which were then measured using calipers.12,17
Calculation of Changes in Venous Diameters with Respiration
The physiology with spontaneous breathing is different from that of mechanical ventilation. With spontaneous breathing during inspiration, the negative intrathoracic pressure increases the venous return and reduces the IVC diameter.18 During expiration, the intrathoracic pressure increases, decreasing the venous return and increasing the IVC diameter at end-expiration.18 This was characterized by collapsibility index [CI=(Dmax – Dmin)/Dmax].18 With mechanical ventilation, positive intrathoracic pressure during inspiration reduces the venous return, which increases the IVC diameter, and during expiration the lower intrathoracic pressure reduces the venous return which decreases IVC diameter at end-expiration.18,19 For mechanically ventilated patients, calculation of distensibility of IVC [DI=(Dmax – Dmin)/Dmin] has also been reported.19
Relative intravascular volume is reflected by the difference in IVCmax and IVCmin when intrathoracic pressure is increased relative to when it is decreased, with IVC diameter being larger when intrathoracic pressure is increased and smaller when intrathoracic pressure is decreased. Changes in IVC diameter due to variations in intrathoracic pressures appear to be independent of the mechanism by which the pressure is changed. Thus, either collapsibility or distensibility could be used to reflect relative intravascular volume.
Although IVC collapsibility [(IVCmax-IVCmin)/IVCmax] and IVC distensibility [(IVCmax-IVCmin)/IVCmin] are conventionally based on different physiological circumstances, these terms are merely mathematical transformations of each other [DI=CI/(100%-CI) *100%; CI=DI/(100%+DI) *100%]. The relationship between CI and DI is not directly linear. An IVC CI of <20% corresponds to an IVC DI of <25% and an IVC CI of >50% corresponds to an IVC DI of >100%. When relative intravascular volume is very low, IVCmin approaches zero, and IVC CI approaches 100%, which is readily comprehendible. In this circumstance, distensibility may approach infinity which is difficult to conceptualize in physiological terms.
The convention to use CI for spontaneous breathing and DI for ventilated breathing in some publications, does not readily allow comparison of data between ventilated and spontaneously breathing encounters. Since CI and DI are complementary mathematical transformations, inferences based on one can also be inferred from the other. This corollary is supported by the finding that the optimum IVC CI cut-offs of <20% for predicting the ability to remove specified volumes by ultrafiltration were similar for spontaneous breathing and mechanical ventilation encounters.9 This indicates that the ICV CI cut-off for hypervolemia was similar for both spontaneous breathing and mechanical ventilation despite the differences in the physiology.9
For these reasons, we used CI for both spontaneous and ventilated breathing encounters to enable comparison, as previously described.9
Data Analysis
Bias was assessed by plotting the difference between paired SCV CI and IVC CI values against the average of these values to determine whether the difference was preferentially positive or negative (Bland–Altman bias analysis). For all values, there was no preference for either SCV CI or IVC CI being greater and the slope was zero.
Linear regression analysis was performed to assess the relationship of paired SCV CI and IVC CI values. This relationship was determined for the entire group, and relationships were compared for transverse versus longitudinal SCV views, for ventilated versus non-ventilated encounters, for those with internal jugular venous accesses versus arm fistulas versus no central vascular access, and for those with AKD versus AKD on CKD, versus ESKD groups.
Sensitivity and specificity curves were generated for various SCV CI cut-off values for predicting whether IVC CI was <20% (consistent with hypervolemia and RAP ≥20 mmHg) or IVC CI >50% (consistent with hypovolemia and RAP <5 mmHg).9
The cut-off for hypovolemia was based on the relationship of paired IVC CI to mean RAP derived from four publications with more than 50 extractable data points (total n=298).9,20–23 Optimal sensitivity (80%) and specificity (79%) for predicting an RAP <5 mmHg were obtained at a cut-off for IVC CI of ≥47.3% (approximately 50%).9 For mean RAP <5 mmHg, approximately 80% of IVC CI values were ≥47.3%.9 The cut-off for hypervolemia was based on the echocardiography guidelines which state that in patients who are unable to adequately perform a sniff, an IVC that collapses <20% with quiet inspiration suggests elevated mean RAP24 and thus, hypervolemia. In addition, for an mean RAP >20 mmHg, approximately 90% of IVC CI values were <20%.9,20–23 Our previous data showed that the ability to remove ≥0.5 liters to ≥1.5 liters of ultrafiltrate during dialysis could best be predicted using an IVC CI cut-off of 21.7% to 19.2% (approximately 20%).9 Thus, these IVC CI cut-offs of <20% and >50% were used to assess hypervolemia and hypovolemia, respectively, for this study.
Sensitivity and specificity data for various SCV CI cut-offs predicting whether IVC CI was <20% or IVC CI >50% were fitted to sigmoidal curves with maxima and minima constrained to 100% and 0%, respectively, using SigmaPlot version 13 (Systat Software Inc, San Jose, CA, USA). SCV CI cut-offs were determined at the point where the fitted sensitivities and specificities were equal (cross-over point). At that SCV CI cut-off, the concordances of the IVC CI assessment with that of the SCV CI assessment, positive and negative predictive values and positive and negative likelihood ratios were determined. Receiver operator characteristic (ROC) curves were generated and areas under the curve (AUC) were calculated from observed sensitivity and specificity data.
Results
The clinical characteristics for the 102 patients and 160 encounters with paired SCV and IVC ultrasound measurements are summarized in Table 1. These patients had a variety of primary and secondary medical conditions in addition to acute and/or chronic kidney disease. Twenty-five percent of encounters were from patients being cared for on the hospital wards and 75% of encounters were from patients in the medical or surgical intensive care units. Of 160 patient encounters with paired SCV and IVC ultrasound measurements; 41% were mechanically ventilated and 59% were breathing spontaneously. For the two different cohorts in which the probe orientation for SCV ultrasound was either longitudinal or transverse, the only statistically significant differences were that the patient encounters with the transverse view were more frequently in the ICU (92% versus 69%, respectively; P=0.0017) and these patients had a lower hospital survival rate (44% versus 76%; P=0.0013).
Figure 1 shows the relationship of paired SCV CI to IVC CI values for encounters for the entire group (Figure 1A), and relationships among subgroups including transverse versus longitudinal SCV views (Figure 1B), for ventilated versus non-ventilated encounters (Figure 1C), for those with internal jugular venous accesses versus arm fistulas versus no vascular access (Figure 1D), and for those with AKD versus AKD on CKD, versus ESKD groups (Figure 1E). There were no significant differences of slopes or intercepts among the subgroup cohorts.
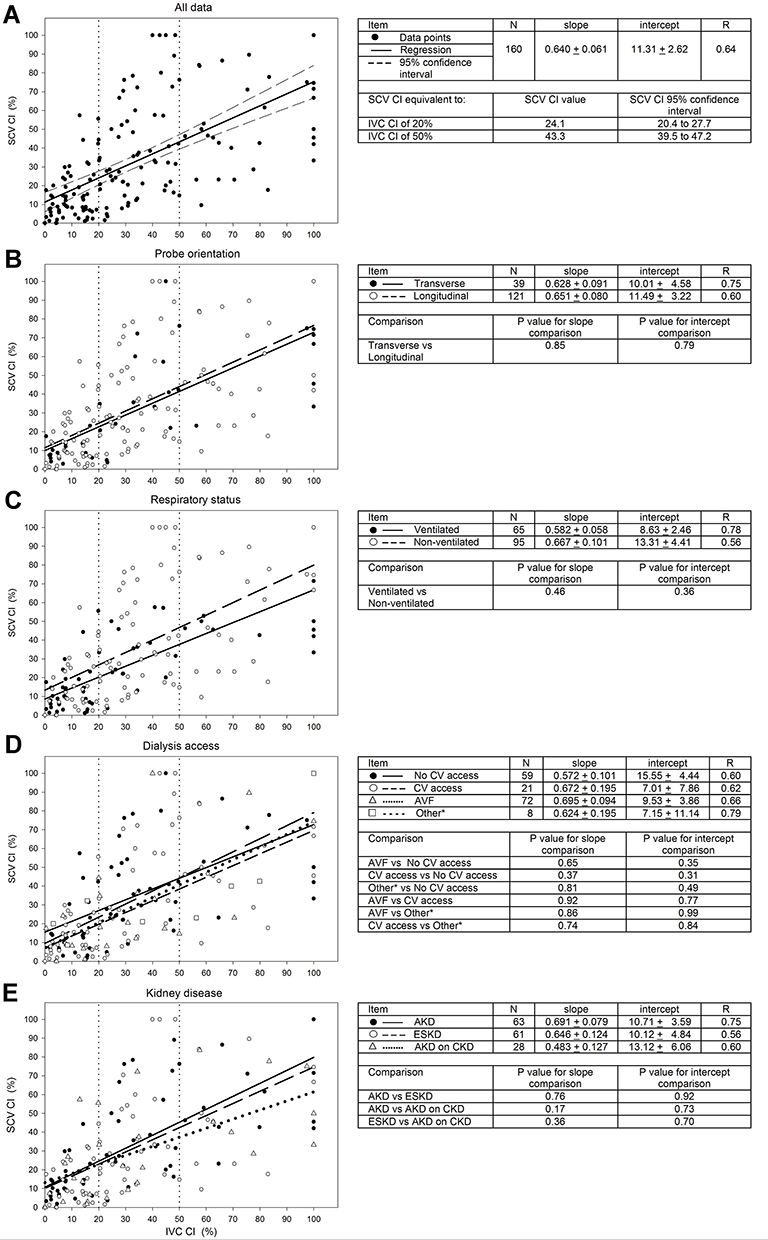 |
Figure 1 Relationship of paired SCV CI to IVC CI values for encounters determined for all data (A), and different subgroups including transverse versus longitudinal SCV views (B), ventilated versus non-ventilated encounters (C), no central venous (CV) access versus CV access versus arterio-venous fistula (AVF) versus other* (peritoneal dialysis access (n=6) or femoral access (n=2)) (D), and AKD versus AKD on CKD versus ESKD (E). The IVC CI cut-offs of 20% and 50% are indicated by vertical-dotted lines. |
Previously published data indicated that in spontaneously breathing patients, an IVC CI >50% predicted mean RAP <5 mmHg,9 consistent with relative intravascular hypovolemia, and an IVC CI <20%9 predicted mean RAP ≥20 mmHg, consistent with relative intravascular hypervolemia. At all possible discrimination thresholds for SCV CI, sensitivities and specificities for whether SCV CI below the cut-off predicts IVC CI <20% and whether SCV CI greater than the cut-off predicts IVC CI >50% are shown in Figure 2A to 2D. The optimal SCV CI cut-offs for maximal sensitivities and specificities are shown by the vertical lines in Figure 2A to 2D and in Table 2. An SCV CI of <22% best predicts an IVC CI <20% and an SCV CI >39% best predicts an IVC CI >50% for both spontaneous breathing and mechanically ventilated encounters (Table 2). The sensitivity and specificity for hypervolemia (IVC CI <20%) were 74% for spontaneous breathing encounters and 88% for ventilated encounters, and for hypovolemia (IVC CI >50%) were 70% and 91%, respectively. Concordance of predictions using SCV CI cut-offs with predictions using IVC CI cut-offs for categorization as hypervolemia versus not hypervolemia were 72% for spontaneous breathing and 85% for ventilated encounters which were not significantly different (p=0.0503 LLR). Likewise, concordance for categorization as hypovolemia versus not hypovolemia were 71% for spontaneous breathing and 89% for ventilated encounters which were significantly different (p=0.0036 LLR).
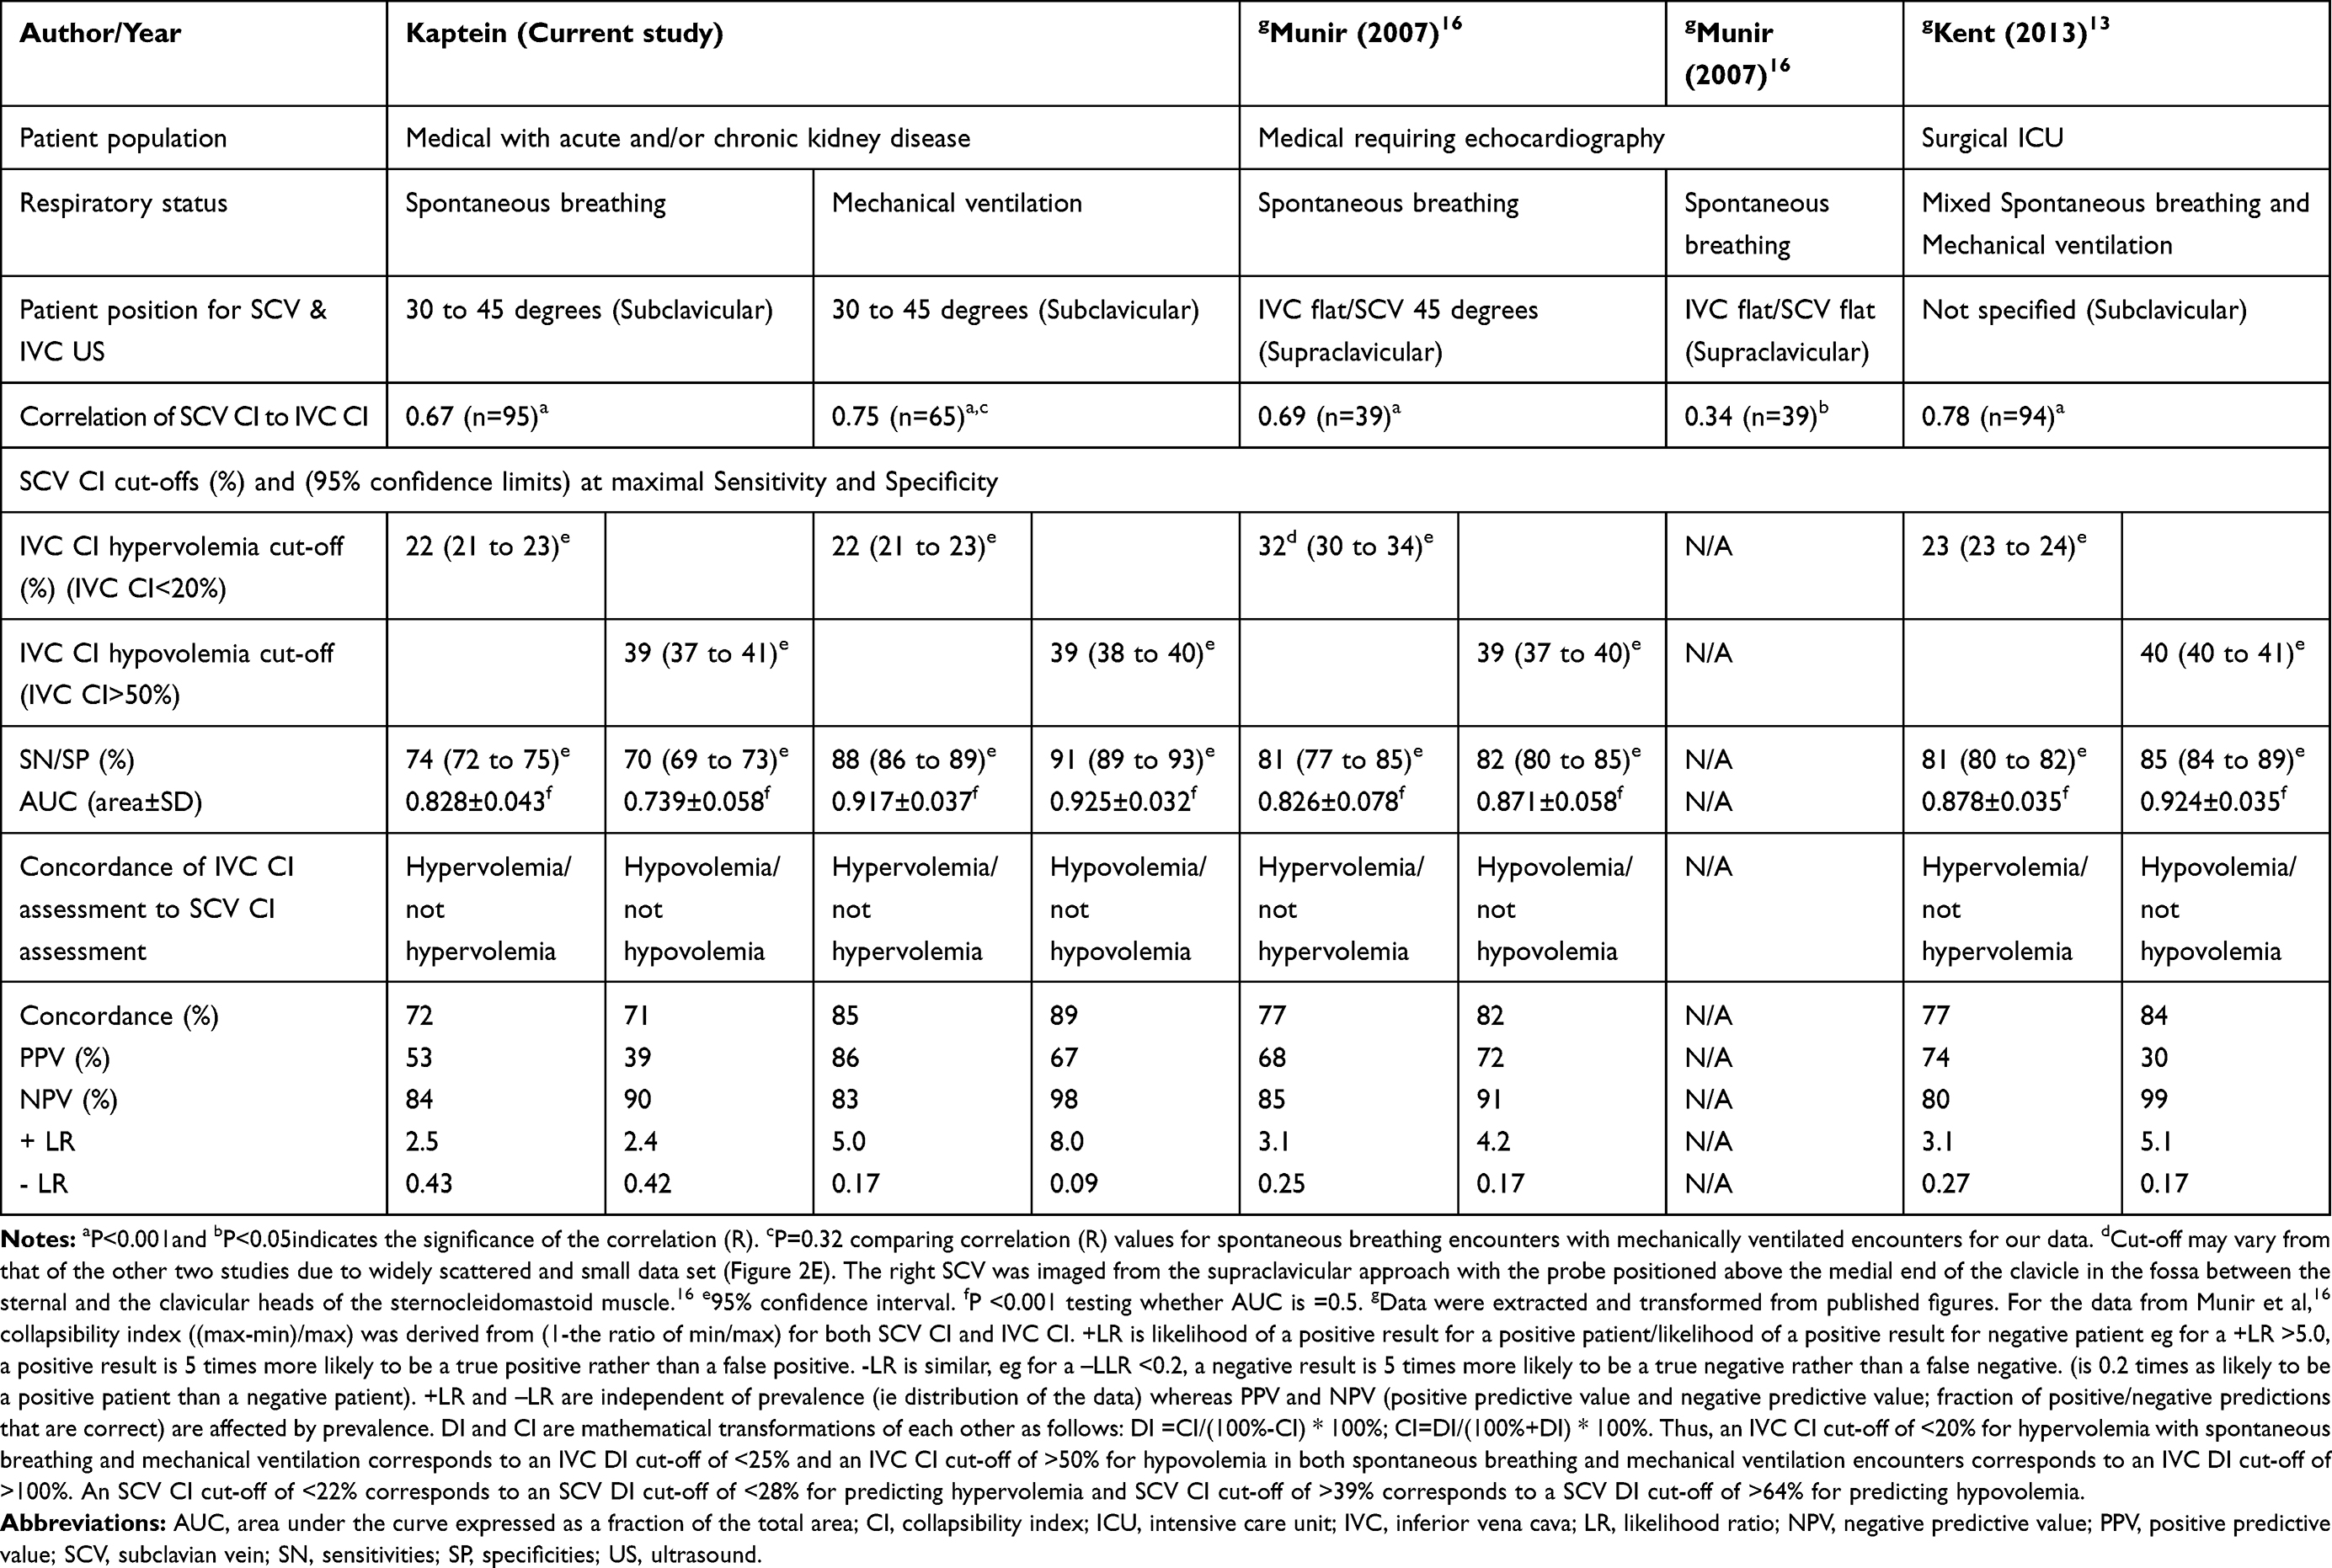 |
Table 2 Relationship of Subclavian Vein to Inferior Vena Cava Data for Our Study, and Comparison to Data Derived from Previous Studies |
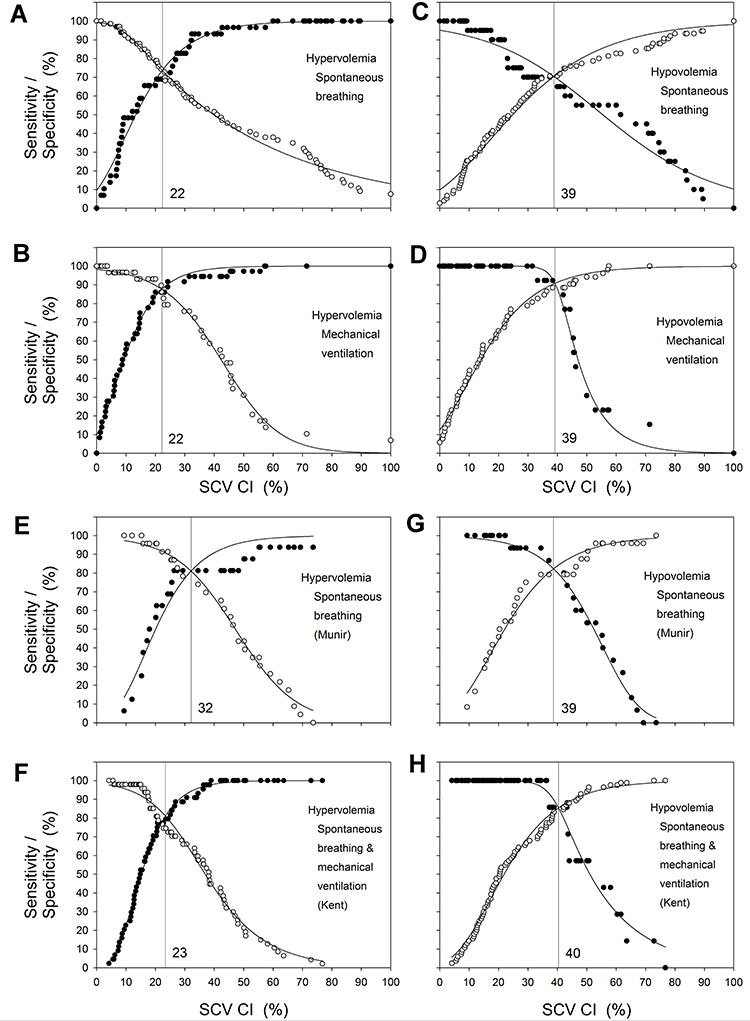 |
Figure 2 Sensitivity and specificity plots for various SCV CI cut-offs as predictors for whether IVC CI is <20% or >50% for spontaneous breathing and ventilated encounters. Solid circles are sensitivity and open circles are specificity. The solid lines are the sigmoidal fit to the data constrained to maximum and minimum sensitivities and specificities of 100% and 0%, respectively. The SCV CI cut-off at which the sensitivity and specificity are equal is indicated by the vertical lines. Sensitivity and specificity plots for various SCV CI cut-offs as predictors for whether IVC CI is <20% for spontaneous breathing encounters (A), <20% for mechanically ventilated encounters (B), >50% for spontaneous breathing encounters (C), >50% for mechanically ventilated encounters (D). Sensitivity and specificity plots for various SCV CI cut-offs from data derived from published reports, as predictors for whether IVC CI is <20% for spontaneous breathing encounters for medical patients (Munir et al16) (E), <20% for spontaneous breathing and mechanically ventilated encounters for surgical ICU patients (Kent et al13) (F), >50% for spontaneous breathing encounters for medical patients (Munir et al16) (G), and >50% for a combination of spontaneous breathing and mechanically ventilated encounters for surgical ICU patients (Kent et al13) (H). For the data from Munir et al,16 collapsibility index ((max-min)/max) *100% was derived from (1-the ratio of min/max) for both SCV CI and IVC CI. |
Discussion
The SCV CI cut-offs which predict specific IVC CI cut-offs for hypervolemia or hypovolemia were the same for spontaneous breathing and mechanically ventilated encounters for our medical and surgical ICU and non-ICU hospitalized patients with acute and/or chronic kidney disease. Our findings were comparable to data extracted and analyzed from two other medical or surgical populations (Figure 2E to 2H and Table 2). 13,16
In our study, the SCV CI cut-off value, corresponding to the IVC CI cut-off of <20% for hypervolemia, was SCV CI <22% for both spontaneous breathing and mechanically ventilated encounters. The comparable SCV CI cut-off derived for data from Kent et al,13 for a combination of spontaneously breathing and mechanically ventilated patients in the surgical ICU, was <23% (Figure 2E and Table 2) and, for data from Munir et al16 for spontaneously breathing patients receiving echocardiography studies, was higher at <32% (Figure 2F and Table 2); the latter difference may be due to the widely scattered and smaller data set.
In our study, the SCV CI cut-off corresponding to the IVC CI cut-off of >50% for hypovolemia, was SCV CI >39% for both spontaneous breathing and mechanically ventilated encounters. A comparable SCV CI cut-off was >40% for data from Kent et al13 and was >39% for data from Munir et al16 (Figure 2G and 2H and Table 2). The SCV CI cut-offs being lower than IVC CI cut-offs in our study and that of Munir et al16 may relate to the patients’ semi-recumbent position at 30 to 45 degrees. The SCV CI cut-off derived from the data of Kent et al13 was also lower than the IVC CI cut-off, however, patient positioning was not specified. Interestingly, Killu et al25 showed that an internal jugular vein (IJV) collapsibility index greater than 39%, determined at 30 degree head elevation, was also strongly associated with overt hypovolemia in surgical ICU patients. This is not surprising since the IJV and SCV are contiguous.
Our IVC and SCV ultrasound procedures were both performed in the semi-recumbent position at 30 to 45 degrees, whereas in the study by Munir et al.16 IVC ultrasounds were performed when supine and SCV ultrasounds were performed both when supine and at 45 degrees. Prior studies documented that 0, 30 or 45 degree positions resulted in similar values for IVC CI.26,27 Munir et al16 showed that the relationship of SCV CI to ICV CI was much weaker when patients were supine than when semi-recumbent at 45 degrees. When supine, 34 of 39 (87%) of patients had SCV CI <32% consistent with hypervolemia, whereas when semi-recumbent at 45 degrees, 19 of 39 (48%) of patients had SCV CI <32% (P<0.0001). SCV CI was noted to be much greater at 45 degrees than when lying flat in patients that did not have overt relative intravascular overload based on IVC CI.16 Giraud et al5 reported that the greater the SCV CI, determined in the semi-recumbent position at 30 degrees, the more likely the cardiac output would increase after volume administration.
The positional effects on SCV CI are not surprising since the SCV is directly connected to the internal and external jugular veins, and their venous distensions are affected by elevation of the patient’s upper body, distention being greater in the supine than the semi-recumbent position.28 Since head of the bed position most likely plays an important role in the determination of SCV CI,16 SCV ultrasound studies should be performed in the semi-recumbent position at 30 to 45 degrees during assessment for relative intravascular volume.
SCV CI cut-offs corresponding to designated IVC CI cut-offs consistent with hypervolemia (IVC CI <20%) or hypovolemia (IVC CI >50%) were comparable for both spontaneous breathing and mechanical ventilation encounters. This is consistent with SCV CI and IVC CI usage being appropriate for both spontaneous breathing and mechanical ventilation encounters.
Overall concordances using SCV CI or IVC CI for categorizations as hypovolemia versus not hypovolemia or hypervolemia versus not hypervolemia tended to be better for ventilated encounters (89% and 85%, respectively) than for spontaneous breathing encounters (71% and 72%, respectively) and not much different than those derived from interpretation of data from Kent et al13 (77% and 84%, respectively) or Munir et al16 (82% and 77%, respectively) (Table 2).
The strength of these findings is that the derived SCV CI cut-offs were similar for data comparing three diverse patient populations from independent studies as were the sensitivities and specificities for the predictions using these cut-offs. The IJV cut-off for hypovolemia of 39% in surgical ICU patients corroborates these findings.25 These data indicate the validity of SCV CI to reflect ICV CI in hospitalized patients seen on the Nephrology consult service with acute and/or chronic kidney disease in our study, medical patients studied in an echocardiography laboratory for various clinical indications with a wide range of ejection fractions,16 and patients in the surgical ICU.13 Thus, SCV CI cut-offs may be useful to assess relative intravascular volume in a population of hospitalized patients with a variety of medical and surgical illnesses.
Limitations
- Our observational study was retrospective and not controlled, randomized, or blinded.
- Selection bias may have arisen from convenience sampling.
- Our patients had kidney disease as well as multiple medical illnesses including the need for ICU care and increased thoracic or intra-abdominal pressure which was not evaluated,14 which may have affected the relationship of SCV CI to IVC CI.
- SCV CI by the longitudinal and transverse axes were not performed concurrently in the same patient encounter.
- The two cohorts differed by probe orientation being longitudinal or transverse for the SCV ultrasound, the ultrasonographer(s), as well as more patients with the transverse view being primarily in the intensive care unit and consequently have a higher mortality rate.
- The SCV CI cut-offs determined in our study were dependent upon the IVC CI cut-offs designated to represent hypovolemia and hypervolemia.
- Our study lacks a gold standard to assess relative intravascular volume to which the SCV CI and IVC CI could be compared.
Conclusion
Respiratory changes in SCV diameters in the semi-recumbent position are concordant with respiratory changes in IVC diameters. Respiratory variations in the diameters of either the SCV or IVC by ultrasound, defined using maximum and minimum diameters, appear to be applicable to both spontaneous breathing and mechanical ventilation. These findings may apply to a diverse population including patients in intensive care units and hospital ward services in both medical and surgical settings. Variations in diameters of the SCV and IVC with respiration must be interpreted in the clinical context to make treatment decisions.3,19,29,30
Abbreviations
AUC, area under the curve; CI, collapsibility index; Dmax, maximum diameter; Dmin, minimum diameter ICU, intensive care unit; IVC, inferior vena cava; LLR, log likelihood ratio test; LR, likelihood ratio; MV, mechanical ventilation; NPV, negative predictive value; PPV, positive predictive value; RAP, right atrial pressure; ROC, receiver operator characteristic; SB, spontaneous breathing; SCV, subclavian vein; SN, sensitivities; SP, specificities; US, ultrasound.
Data Sharing Statement
The data underlying this article will be shared on reasonable request to the corresponding author.
Ethics Approval and Informed Consent
Approval for this study was obtained from the University of Southern California Institutional Review Board (HS-12-00383). Procedures were followed in accordance with the ethical standards of the University of Southern California Institutional Review Board and with the Declaration of Helsinki of 1975, as revised in 2000. Written informed consent was not required for the ultrasound procedure, data collection or analysis since this was a retrospective study of data acquired for clinical purposes.
Acknowledgment
Presented at the National Kidney Foundation Meeting, April 2018, Austin, Texas. Am J Kidney Dis 71(4) 502, 2018.
Funding
There is no funding to report.
Disclosure
The authors report no conflicts of interest in this work.
References
1. Tuy T, Peacock W. Fluid overload assessment and management in heart failure patients. Semin Nephrol. 2012;32(1):112–120. doi:10.1016/j.semnephrol.2011.11.014
2. Frank Peacock W, Soto KM. Current technique of fluid status assessment. Congestive Heart Fai. 2010;16(Suppl 1):S45–S51. doi:10.1111/j.1751-7133.2010.00166.x
3. Kaptein MJ, Kaptein EM. Focused real-time ultrasonography for nephrologists. Int J Nephrol. 2017;2017:3756857. doi:10.1155/2017/3756857
4. Bentzer P, Griesdale DE, Boyd J, MacLean K, Sirounis D, Ayas NT. Will this hemodynamically unstable patient respond to a bolus of intravenous fluids? JAMA. 2016;316(12):1298–1309. doi:10.1001/jama.2016.12310
5. Giraud R, Abraham PS, Brindel P, Siegenthaler N, Bendjelid K. Respiratory changes in subclavian vein diameters predicts fluid responsiveness in intensive care patients: a pilot study. J Clin Monit Comput. 2018;32(6):1049–1055. doi:10.1007/s10877-018-0103-x
6. Si X, Cao D, Xu H, Guan X. Meta-analysis of ventilated versus spontaneously breathing patients in predicting fluid responsiveness by inferior vena cava variation. Int J Clin Med. 2018;9:760–777. doi:10.4236/ijcm.2018.910063
7. Long E, Oakley E, Duke T, Babl FE. Does respiratory variation in inferior vena cava diameter predict fluid responsiveness: a systematic review and meta-analysis. Shock (Augusta, Ga). 2017;47(5):550–559. doi:10.1097/SHK.0000000000000801
8. Bortolotti P, Colling D, Preau S. Inferior vena cava respiratory variations: a useful tool at bedside to guide fluid therapy in spontaneously breathing patients. Shock (Augusta, Ga). 2018;49(2):235–236. doi:10.1097/SHK.0000000000000950
9. Kaptein MJ, Kaptein JS, Oo Z, Kaptein EM. Relationship of inferior vena cava collapsibility to ultrafiltration volume achieved in critically ill hemodialysis patients. Int J Nephrol Renovasc Dis. 2018;11:195–209. doi:10.2147/IJNRD.S165744
10. Kaptein MJ, Kaptein JS, Nguyen CD, et al. Changes in cardiac output with hemodialysis relate to net volume balance and to inferior vena cava ultrasound collapsibility in critically ill patients. Ren Fail. 2020;42(1):179–192. doi:10.1080/0886022X.2020.1726384
11. Corl KA, George NR, Romanoff J, et al. Inferior vena cava collapsibility detects fluid responsiveness among spontaneously breathing critically-ill patients. J Crit Care. 2017;41:130–137. doi:10.1016/j.jcrc.2017.05.008
12. Fields JM, Lee PA, Jenq KY, Mark DG, Panebianco NL, Dean AJ. The interrater reliability of inferior vena cava ultrasound by bedside clinician sonographers in emergency department patients. Acad Emerg Med. 2011;18(1):98–101. doi:10.1111/j.1553-2712.2010.00952.x
13. Kent A, Bahner DP, Boulger CT, et al. Sonographic evaluation of intravascular volume status in the surgical intensive care unit: a prospective comparison of subclavian vein and inferior vena cava collapsibility index. J Surg Res. 2013;184(1):561–566. doi:10.1016/j.jss.2013.05.040
14. Bauman Z, Coba V, Gassner M, et al. Inferior vena cava collapsibility loses correlation with internal jugular vein collapsibility during increased thoracic or intra-abdominal pressure. J Ultrasound. 2015;18(4):343–348. doi:10.1007/s40477-015-0181-2
15. Kent A, Patil P, Davila V, et al. Sonographic evaluation of intravascular volume status: can internal jugular or femoral vein collapsibility be used in the absence of IVC visualization? Ann Thorac Med. 2015;10(1):44–49.
16. Munir A, D’Cruz I, Minderman D, Shelton M. The right subclavian vein can be used as a surrogate of the inferior vena cava, as an echocardiographic indicator of systemic venous congestion. Am J Med Sci. 2007;333(5):280–284. doi:10.1097/MAJ.0b013e3180533fa1
17. Finnerty NM, Panchal AR, Boulger C, et al. Inferior vena cava measurement with ultrasound: what is the best view and best mode? West J Emerg Med. 2017;18(3):496–501. doi:10.5811/westjem.2016.12.32489
18. Natori H, Tamaki S, Kira S. Ultrasonographic evaluation of ventilatory effect on inferior vena caval configuration. Am Rev Respir Dis. 1979;120(2):421–427.
19. Barbier C, Loubieres Y, Schmit C, et al. Respiratory changes in inferior vena cava diameter are helpful in predicting fluid responsiveness in ventilated septic patients. Intensive Care Med. 2004;30(9):1740–1746. doi:10.1007/s00134-004-2259-8
20. Kircher BJ, Himelman RB, Schiller NB. Noninvasive estimation of right atrial pressure from the inspiratory collapse of the inferior vena cava. Am J Cardiol. 1990;66(4):493–496. doi:10.1016/0002-9149(90)90711-9
21. Nakao S, Come PC, McKay RG, Ransil BJ. Effects of positional changes on inferior vena caval size and dynamics and correlations with right-sided cardiac pressure. Am J Cardiol. 1987;59(1):125–132. doi:10.1016/S0002-9149(87)80084-X
22. Moreno FL, Hagan AD, Holmen JR, Pryor TA, Strickland RD, Castle CH. Evaluation of size and dynamics of the inferior vena cava as an index of right-sided cardiac function. Am J Cardiol. 1984;53(4):579–585. doi:10.1016/0002-9149(84)90034-1
23. Capomolla S, Febo O, Caporotondi A, et al. Non-invasive estimation of right atrial pressure by combined Doppler echocardiographic measurements of the inferior vena cava in patients with congestive heart failure. Ital Heart J. 2000;1(10):684–690.
24. Rudski LG, Lai WW, Afilalo J, et al. Guidelines for the echocardiographic assessment of the right heart in adults: a report from the American Society of Echocardiography endorsed by the European Association of Echocardiography, a registered branch of the European Society of Cardiology, and the Canadian Society of Echocardiography. J Am Soc Echocardiogr. 2010;23(7):
25. Killu K, Coba V, Huang Y, Andrezejewski T, Dulchavsky S. Internal jugular vein collapsibility index associated with hypovolemia in the intensive care unit patients. Crit Ultrasound J. 2010;2:13–17. doi:10.1007/s13089-010-0034-3
26. Bondarsky E, Rothman A, Ramesh N, Love A, Kory P, Lee YI. Influence of head-of-bed elevation on the measurement of inferior vena cava diameter and collapsibility. J Clin Ultrasound. 2020;48(5):249–253. doi:10.1002/jcu.22817
27. Panebianco NL, Shofer F, Cheng A, Fischer J, Cody K, Dean AJ. The effect of supine versus upright patient positioning on inferior vena cava metrics. Am J Emerg Med. 2014;32(11):1326–1329. doi:10.1016/j.ajem.2014.07.036
28. Meyer TE. Examination of the jugular venous pulse. In: UpToDate Online [Internet]. In: Drazner MH, Editor. Alphen aan den Rijn, Netherlands: Wolter Kluwer; Topic 1076 Version 22.0, 2020.
29. Via G, Tavazzi G, Price S. Ten situations where inferior vena cava ultrasound may fail to accurately predict fluid responsiveness: a physiologically based point of view. Intensive Care Med. 2016;42(7):1164–1167. doi:10.1007/s00134-016-4357-9
30. Long E, Duke T, Oakley E, O’Brien A, Sheridan B, Babl FE. Does respiratory variation of inferior vena cava diameter predict fluid responsiveness in spontaneously ventilating children with sepsis. Emerg Med Australas. 2018;30(4):556–563. doi:10.1111/1742-6723.12948
 © 2020 The Author(s). This work is published and licensed by Dove Medical Press Limited. The full terms of this license are available at https://www.dovepress.com/terms.php and incorporate the Creative Commons Attribution - Non Commercial (unported, v3.0) License.
By accessing the work you hereby accept the Terms. Non-commercial uses of the work are permitted without any further permission from Dove Medical Press Limited, provided the work is properly attributed. For permission for commercial use of this work, please see paragraphs 4.2 and 5 of our Terms.
© 2020 The Author(s). This work is published and licensed by Dove Medical Press Limited. The full terms of this license are available at https://www.dovepress.com/terms.php and incorporate the Creative Commons Attribution - Non Commercial (unported, v3.0) License.
By accessing the work you hereby accept the Terms. Non-commercial uses of the work are permitted without any further permission from Dove Medical Press Limited, provided the work is properly attributed. For permission for commercial use of this work, please see paragraphs 4.2 and 5 of our Terms.