")
Back to Journals » International Journal of Chronic Obstructive Pulmonary Disease » Volume 12
Comparison of pulsed versus continuous oxygen delivery using realistic adult nasal airway replicas
Authors Chen JZ , Katz IM , Pichelin M, Zhu K, Caillibotte G, Noga ML, Finlay WH, Martin AR
Received 17 May 2017
Accepted for publication 13 July 2017
Published 24 August 2017 Volume 2017:12 Pages 2559—2571
DOI https://doi.org/10.2147/COPD.S141976
Checked for plagiarism Yes
Review by Single anonymous peer review
Peer reviewer comments 3
Editor who approved publication: Dr Richard Russell
John Z Chen,1 Ira M Katz,2 Marine Pichelin,2 Kaixian Zhu,3 Georges Caillibotte,2 Michelle L Noga,4 Warren H Finlay,1 Andrew R Martin1
1Department of Mechanical Engineering, University of Alberta, Edmonton, AB, Canada; 2Medical R&D, Air Liquide Santé International, Centre de Recherche Paris-Saclay, Les Loges-en-Josas, 3Centre Explor!, Air Liquide Healthcare, Gentilly, France; 4Radiology and Diagnostic Imaging, University of Alberta, Edmonton, AB, Canada
Background: Portable oxygen concentrators (POCs) typically include pulse flow (PF) modes to conserve oxygen. The primary aims of this study were to develop a predictive in vitro model for inhaled oxygen delivery using a set of realistic airway replicas, and to compare PF for a commercial POC with steady flow (SF) from a compressed oxygen cylinder.
Methods: Experiments were carried out using a stationary compressed oxygen cylinder, a POC, and 15 adult nasal airway replicas based on airway geometries derived from medical images. Oxygen delivery via nasal cannula was tested at PF settings of 2.0 and 6.0, and SF rates of 2.0 and 6.0 L/min. A test lung simulated three breathing patterns representative of a chronic obstructive pulmonary disease patient at rest, during exercise, and while asleep. Volume-averaged fraction of inhaled oxygen (FiO2) was calculated by analyzing oxygen concentrations sampled at the exit of each replica and inhalation flow rates over time. POC pulse volumes were also measured using a commercial O2 conserver test system to attempt to predict FiO2 for PF.
Results: Relative volume-averaged FiO2 using PF ranged from 68% to 94% of SF values, increasing with breathing frequency and tidal volume. Three of 15 replicas failed to trigger the POC when used with the sleep breathing pattern at the 2.0 setting, and four of 15 replicas failed to trigger at the 6.0 setting. FiO2 values estimated from POC pulse characteristics followed similar trends but were lower than those derived from airway replica experiments.
Conclusion: For the POC tested, PF delivered similar, though consistently lower, volume-averaged FiO2 than SF rates equivalent to nominal PF settings. Assessment of PF oxygen delivery using POC pulse characteristics alone may be insufficient; testing using airway replicas is useful in identifying possible cases of failure and may provide a better assessment of FiO2.
Keywords: long term oxygen therapy (LTOT), ambulatory oxygen, portable oxygen concentrator (POC)
Introduction
Portable oxygen concentrators (POCs) are devices developed relatively recently in response to demand for a lightweight, portable source of supplemental oxygen.1 While most frequently prescribed to patients needing long-term oxygen therapy (LTOT), POCs can play a role in any application requiring a source of supplemental oxygen. For example, POCs have been evaluated as a possible solution to supplemental oxygen requirements in military settings2 and high altitude environments.3,4 A recent study showed that chronic obstructive pulmonary disease (COPD) patients requiring LTOT generally prefer a single source POC over a combined stationary and portable oxygen source both in the home and during activity, citing the practicality of the system as its main advantage.5
POCs primarily deliver oxygen in one of two modes: steady flow (SF) and pulse flow (PF), with the most recent generation of lightweight devices (<5 lb) offering only PF mode.6,7 While SF remains the more straightforward of the two options, continuous delivery throughout the breath leads to a significant fraction of delivered oxygen being lost to the ambient air, never reaching the patient’s lungs.1 In contrast, PF aims to improve efficiency by limiting oxygen delivery only to times when patient inspiration can be detected, and delivering oxygen as a bolus, or pulse, early in the breath so that the fraction of oxygen exhaled from the anatomical dead space is reduced.
Ideally, PF modes provide a volume of oxygen for inhalation equivalent to the volume of supplemental oxygen inhaled at a given SF rate. In light of this, oxygen delivery at varied PF settings for commercial POCs is frequently interpreted as nominally equal to that which would be achieved at equivalent SF rates; for example, a PF setting of 1.0 corresponds to an SF rate of 1.0 L/min, a PF setting of 2.0 to SF rate of 2.0 L/min, etc.8 However, the total oxygen volume administered over a complete breathing cycle is typically less for PF than SF, owing to the efficiencies gained by synchronizing oxygen delivery with patient inspiration.
Since PF/SF equivalency is dependent upon a number of shifting variables, conclusively demonstrating such equivalency can be a difficult task.9 Furthermore, as standards of equivalency may currently vary between manufacturers, different POC devices may deliver different volumes of oxygen at nominally the same PF setting.1 While some clinical studies have suggested equivalence of PF and SF oxygen delivery,10,11 others have reported differences.12,13 Recent studies have shown that in pairs of nominally equivalent PF/SF settings, PF fraction of inspired oxygen (FiO2) was consistently lower than SF FiO2.13–16
For evaluating administration of medical aerosols to the lungs, in vitro benchtop testing using realistic or idealized 3D-printed airway replicas has proven valuable in providing a fast, convenient, and noninvasive research and development tool compared to in vivo studies.6,7,17,18 These realistic airway replicas, derived from medical imaging, are more representative of human upper airways compared with highly simplified geometries that have been previously used for evaluating inhaled concentrations of medical gases.16,19 Testing with multiple replicas can aid in accounting for variability in the airway geometry of different patients; that is, intersubject variability.17 In addition, benchtop experiments permit precise control of simulated breathing patterns, eliminating a significant source of variance that may be present during in vivo human studies.
To our knowledge, no work has been done to date comparing the differences between SF and PF oxygen administration from POCs using realistic airway replicas. Accordingly, the primary aims of the present study are to develop a predictive in vitro model for inhaled oxygen delivery using a set of 15 realistic adult nasal airway replicas, and then to compare SF and PF for a widely used commercial POC. To this end, we developed a testing protocol that measures the real-time oxygen concentration at the outlet (trachea) of the airway replica, which can then be integrated with the instantaneous inspiratory flow rate to determine a volume-averaged FiO2 over the course of inspiration. Volume-averaged FiO2 can be used as a common basis for comparison between nominally equivalent settings of SF and PF. We further aimed to develop an algorithm to estimate PF FiO2 based on pulse characteristics, tidal volume, and upper airway volume. These estimated values can be compared with FiO2 values derived from oxygen concentration measurements.
Methods
Realistic airway replicas
Fifteen adult nasal airway replicas built in acrylic plastic using rapid prototyping were used in the present study. Each replica included air passages starting from the nares through the entrance to the trachea. Five of the airway replicas were based on magnetic resonance (MR) images as previously reported,20 while the remaining 10 replicas were based on a new set of anonymized high resolution computed tomography (CT) scans acquired retrospectively from patients scanned for clinical purposes unrelated to the nasal passage at the University of Alberta Hospital, with Health Research Ethics Board approval. All CT scans were reviewed by an expert radiologist and the nasal passage considered normal. The MR images and CT scans used to build the replicas did not contain any identifying information. CT scans were segmented using Mimics software (Materialise, Leuven, Belgium) and replicas were built from plastic (Objet VeroGray RGD850; Stratsys, Ltd., Eden Prairie, MN, USA) using a PolyJet 3D printer (Objet Eden 350V High Resolution 3D Printer; Stratsys, Ltd., Eden Prairie, MN, USA). Segmented 3D airways based on both the MR and CT images are presented in Figure 1. Geometric parameters for each of the 15 replicas were obtained using MeshLab (Visual Computing Laboratory, Istituto di Scienza e Tecnologie dell’Informazione, Italy) and ParaView (Kitware, Clifton Park, NY, USA). These parameters are shown in Table 1.
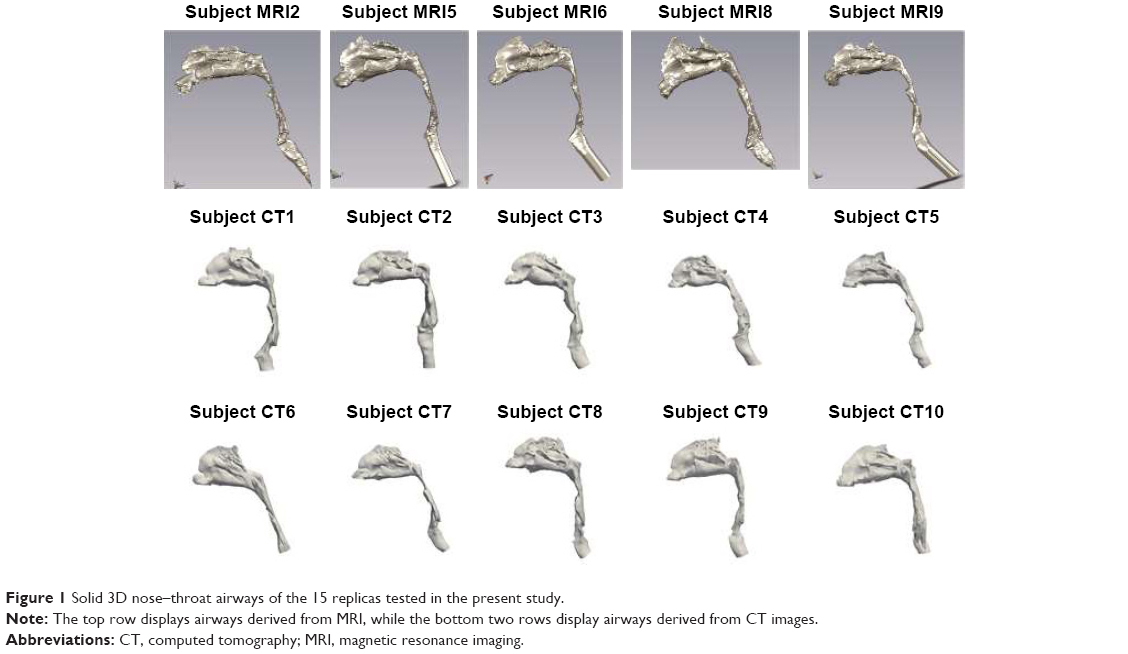 | Figure 1 Solid 3D nose–throat airways of the 15 replicas tested in the present study. |
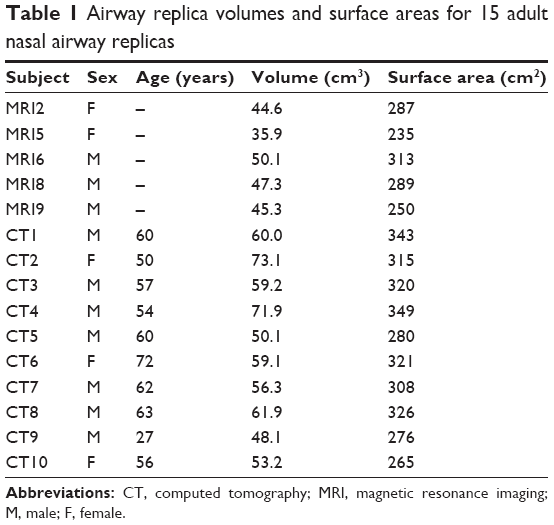 | Table 1 Airway replica volumes and surface areas for 15 adult nasal airway replicas |
Representative breathing patterns
To simulate tidal breathing, airway replicas were connected to a lung simulator (ASL 5000 Breathing Simulator; IngMar Medical, Pittsburgh, PA, USA), as shown schematically in Figure 2. Plastic tubing with 22 mm internal diameter connected the replica outlet to the lung simulator. The total internal volume of this tubing was 135 cm3, representative of the conducting airway volume from the trachea to the gas-exchange regions of the lungs for an average adult with 3 L functional residual capacity.21
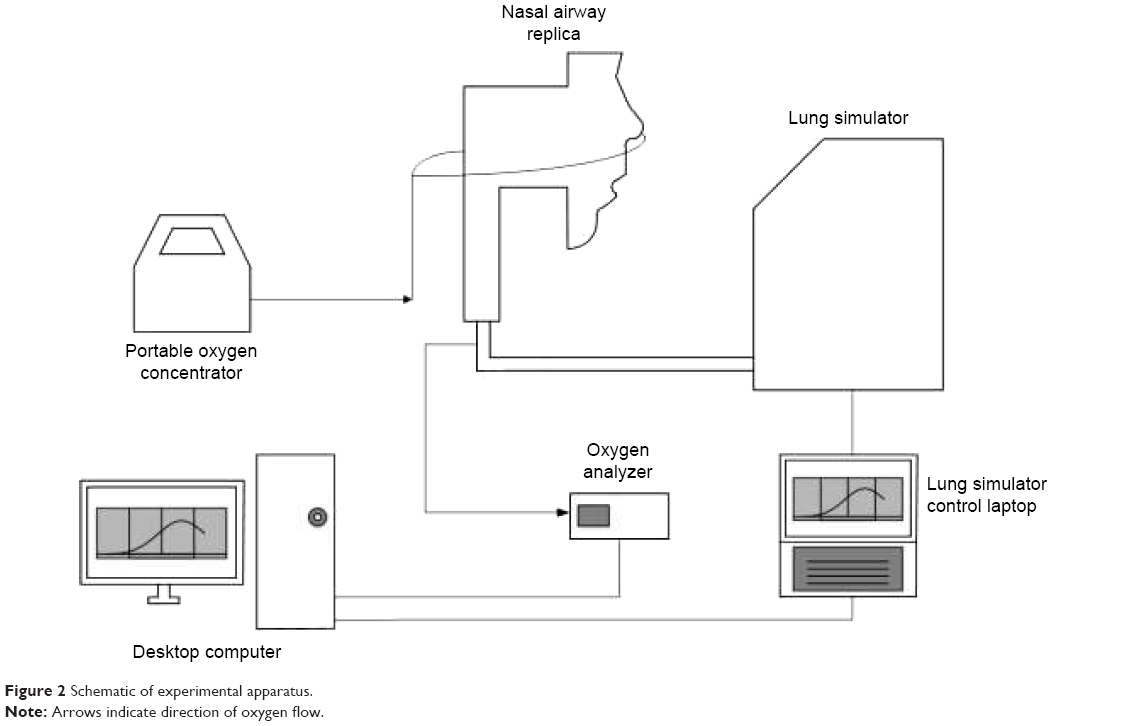 | Figure 2 Schematic of experimental apparatus. |
To capture a range of activity levels in daily life, we used three different breathing patterns representative of a COPD patient on LTOT at rest, doing light exercise, and while asleep. Inspiratory and expiratory phases of the breath were represented using sinusoidal flow patterns with one half sinusoid for inspiration and another half sinusoid for expiration. Sinusoidal breathing patterns have been used previously to approximate human breathing.22–26 Inspiration and expiration flow rates were derived using tidal volume (VT), inspiratory time (TI), expiratory time (TE), and breathing frequency (f). Values of each of these parameters for the three breathing patterns are shown in Table 2. The rest and exercise breathing parameters were chosen based on average values reported previously by Chatila et al27 for 10 patients with COPD at baseline (rest) and while on low SF rate (2.5–6 L/min) oxygen while performing light exercise on a cycle ergometer. Parameters for the sleep breathing pattern were chosen based on average values measured by Hudgel et al28 for 13 COPD patients while asleep.
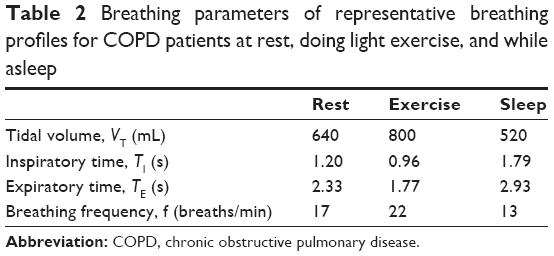 | Table 2 Breathing parameters of representative breathing profiles for COPD patients at rest, doing light exercise, and while asleep |
Flow rate and oxygen concentration measurements
Experiments were carried out using a Philips SimplyGo POC (Philips Respironics, Murrysville, PA, USA) and a cylinder source of 100% oxygen (Praxair Canada, Mississauga, ON, Canada). A test lung simulated the three different breathing patterns, each for ~50 breathing cycles. Oxygen delivery in each of the replicas via a nasal cannula (Hudson RCI adult nasal cannula; Teleflex Medical, Research Triangle Park, NC, USA) was first tested at SF rates from the cylinder source of 2.0 and 6.0 L/min, and then at nominal PF settings of 2.0 and 6.0. SimplyGo features two different PF operating modes: pulse mode and sleep mode. Sleep mode is similar to pulse mode, but features more sensitive breath detection, lower pulse amplitude, and longer pulse duration aimed to improve comfort during sleeping. The sleep breathing pattern was tested using both pulse mode and sleep mode in order to comprehensively evaluate potential device performance.
The volume of the chamber of the test lung was recorded during simulated breathing at a sampling frequency of 512 Hz using the ASL 5000 software. Oxygen concentrations were measured using a GA-200 CO2 and O2 Gas Analyzer (iWorx, Dover, NH, USA), and were corrected for delay and time constant, which was done by approximating the concentration as a first order system and following methods outlined in Langer et al.26 We assumed that the step response of the gas analyzer could be well approximated by a first order exponential function. The time constant for this exponential function, which is defined as the time required for the response of the system to reach 63% of its final value as the result of a step increase, was measured to be 227 ms in preliminary experiments by rapidly switching supply to the gas analyzer via a three-way stopcock between two different gas mixtures of known concentration (in this case, air and 100% oxygen).
Calculation of SF and PF FiO2
The flow rate of oxygen passing through the trachea over time was calculated by multiplying inspiration flow rate, known at each time point, with the measured real-time oxygen concentrations at the same time point. Inspiration start and end times were identified as times when flow rates crossed 0. These oxygen flow rates were then numerically integrated using the trapezoidal rule from the start to the end of inspiration to determine a volume of oxygen inhaled per breath. VT was also calculated from inspiration flow rates using a similar procedure. The volume of inhaled oxygen was then divided by VT to obtain a volume-averaged value for FiO2 for that breath. FiO2 for each combination of replica and oxygen delivery condition was taken as the average of five consecutive breaths after a steady state in expiratory oxygen concentration was observed (at least 50 breaths). Variability between average FiO2 values obtained in experiments repeated on separate days of testing was found in preliminary testing to be of similar magnitude as variability between individual breaths.
Measurement of pulse characteristics
A 1130 series O2 Conserver Testing System (Hans Rudolph Inc, Shawnee, KS, USA) was used to obtain oxygen pulse volumes, durations, and delays for both the 2.0 and 6.0 settings of the POC using the breathing frequency of each breathing pattern shown in Table 3. SimplyGo was connected to the testing system using a standard 2.1 mm single lumen cannula. Data were recorded as the average of 10 successive pulses for each breathing pattern/setting combination. Variance around reported averages was very small. The oxygen concentration of the pulse itself was measured to be 94% across all breathing pattern/setting combinations.
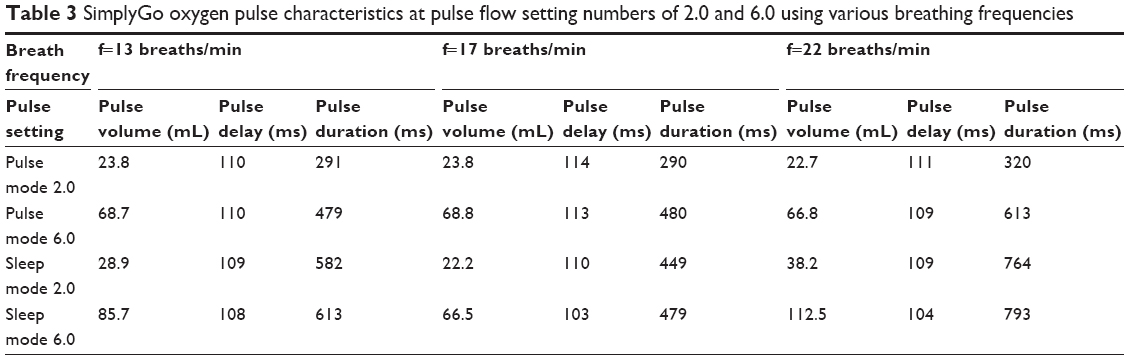 | Table 3 SimplyGo oxygen pulse characteristics at pulse flow setting numbers of 2.0 and 6.0 using various breathing frequencies |
Prediction of PF FiO2
The model used in this study to estimate PF FiO2 depends on the following parameters: the tidal volume VT, the ambient oxygen fraction XO2,ambient, the volume of the airway replica Vreplica, the total volume of the “lower conducting airways” VLA (represented by the tubing connecting the airway replica to the lung simulator), the oxygen fraction of the pulse XO2,pulse, and the volume of the pulse Vpulse.
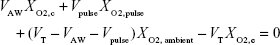
Breathing was modeled with the assumption that exhaled gas in the anatomical dead space, consisting of upper and lower conducting airways at end-expiration, is immediately re-inhaled, and that none of the pulse remains in the anatomical dead space of the airways at the start of expiration. That is, pulse timing is assumed to be ideal, in that all oxygen delivered in the pulse reaches peripheral regions of the lungs (in the present experiments represented by the lung simulator). Following re-inhalation of gas from the anatomical dead space, the remainder of the breath consists of the oxygen pulse and entrained ambient air. Over multiple breathing cycles, the gas mixture contained within the cylinder of the lung simulator will approach some steady-state concentration, XO2,c.
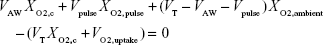
To derive the equation for XO2,c, it was noted that in this steady state the volume of oxygen entering the lung simulator, VO2,I, must be equal to the volume of oxygen that exits, VO2,E. Therefore
| (1) |

Based on the assumptions made above, this equation can be rewritten as
|
|
where VAW, the total volume of the airways (including the replica), is given by
| (3) |

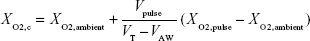
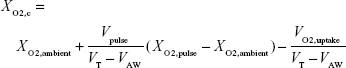
Rearranging, one can solve for XO2,c
| (4) |
To find FiO2 as measured and reported in the present experiments, one needs to take into account the volume of oxygen passing the trachea, rather than that reaching the lung simulator. Therefore, recently exhaled oxygen remaining in VLA prior to the start of inspiration does not need to be accounted for. FiO2 can then be estimated by calculating the total volume of oxygen passing the trachea and dividing by VT:
|
|
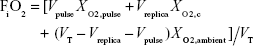
FiO2 was calculated in this manner using each of the 15 different replica volumes and then averaged to give a single value. Averaged predicted values of FiO2, based on measured pulse characteristics, were then compared to average values measured using the realistic replicas and lung simulator.
Pressure drop measurements
In most POCs, breaths are detected using an internal pressure sensor that measures a reduction in pressure monitored at the oxygen supply tubing (the triggering pressure) corresponding to the start of inhalation. Pressure drops across each airway replica were measured at the cannula based on methods outlined in Moore et al.29 An adult nasal cannula was inserted into the nostrils of each replica. The cannula was connected to a differential manometer (HHP-103; OMEGA Engineering, Norwalk, CT, USA) measuring the difference between the cannula and atmospheric pressure. A vacuum was connected to each replica and a valve used to control inhalation flow rate, which was monitored using a mass flowmeter (TSI Mass Flowmeter 4043; TSI Inc, Shoreview, MN, USA). Pressure drops were measured at flow rates of 10, 20, 30, and 40 L/min.
Results
Oxygen concentration and flow rate waveforms
Figure 3 shows oxygen concentrations and inspiration flow rates at the trachea for the selected replicas plotted against time. As a matter of convention, positive flow rates indicate inspiration and negative flow rates indicate exhalation. Oxygen concentration waveforms could be broadly classified as falling into one of three groups: waveforms indicating SF oxygen delivery, Figure 3A; waveforms indicating complete pulse delivery (the entire pulse reaches the internal cylinder of the lung simulator), Figure 3B; and waveforms indicating incomplete pulse delivery (a portion of the pulse remains in the anatomical dead space and is exhaled), Figure 3C.
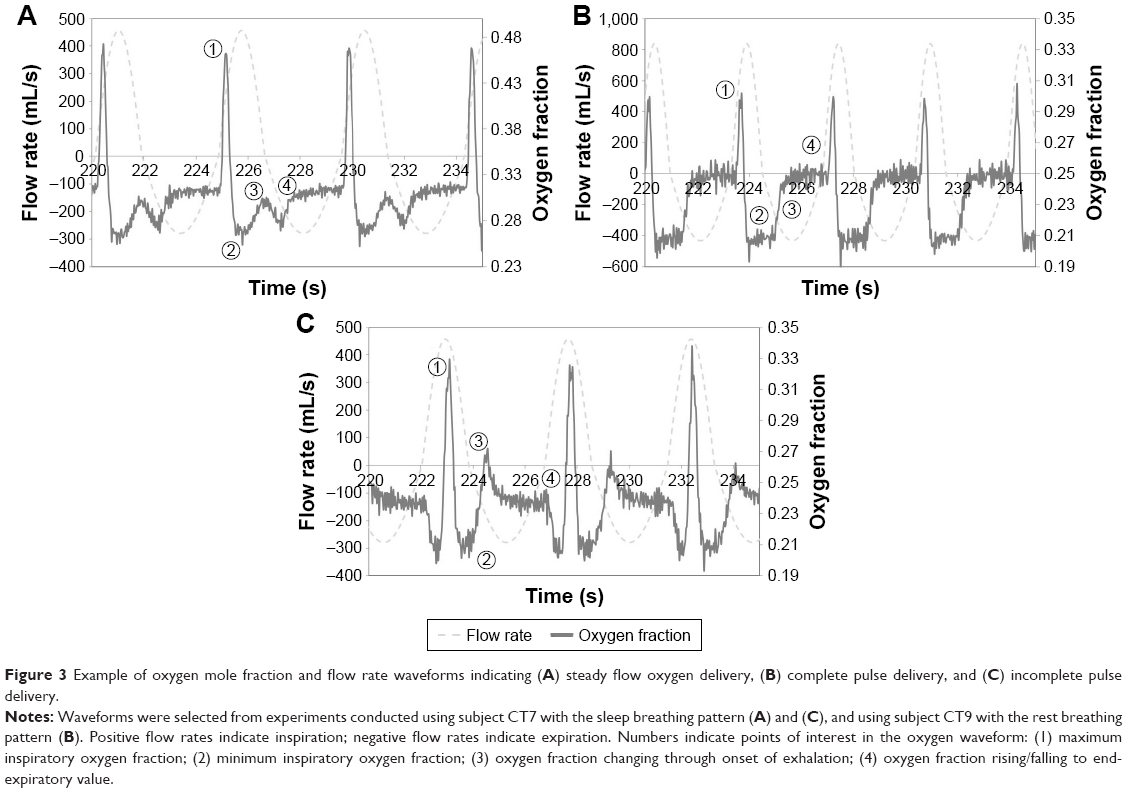 | Figure 3 Example of oxygen mole fraction and flow rate waveforms indicating (A) steady flow oxygen delivery, (B) complete pulse delivery, and (C) incomplete pulse delivery. |
Continuous oxygen delivery waveforms (Figure 3A) were characterized by the presence of two peaks over the course of inspiration, one large, sharp peak occurring shortly after the beginning of inspiration, and another smaller peak at the end. The variation in oxygen concentration over the course of inspiration for SF can be explained as follows.
- The first, taller peak indicates pooling in the anatomic reservoir at the end of expiration. Since oxygen flow continues throughout the entire breath in SF, oxygen will accumulate in the upper airways as exhalation ends and the expiratory flow rate approaches zero. This pooled oxygen is then inhaled at the start of the next inspiration, which is reflected in the first sharp peak in oxygen concentration.
- Once pooled oxygen is inhaled, the inspiration flow rate then increases toward a maximum, and therefore the fraction of inhaled gas represented by supplementary oxygen will decrease, which is reflected in a steep decrease in oxygen concentration. Conversely, as the inspiration flow rate passes its maximum and begins to decrease again, the supplementary oxygen fraction in the inhaled gas will increase.
- As exhalation begins, gas remaining in the dead space (in this case, the tubing connecting the replica to the lung simulator) is immediately exhaled. Due to imperfect mixing in the airways, the dead space gas is exhaled on a first-in, last-out basis and will tend to lower the oxygen concentration. In other words, any comparatively low-oxygen gas (inhaled when the inspiration flow rate was high) remaining in the tubing will be further from the trachea than high-oxygen gas (inhaled when the inspiration flow rate was low).
- Finally, as exhalation proceeds, the oxygen concentration approaches the constant oxygen concentration found in the internal chamber of the lung simulator.
On the other hand, oxygen concentration waveforms indicating complete pulse delivery (Figure 3B) can be identified by the presence of a single peak occurring near, but not coinciding with, the beginning of inspiration. Unlike the SF case, no pooling exists since oxygen delivery does not occur if no inspiratory effort is detected. The variation in oxygen concentration over the course of inspiration for complete pulse delivery can be explained as follows.
- Here, the single peak at the start of inspiration indicates the passage of the pulse from the POC and through the trachea. The sharp initial decrease in oxygen concentration shortly following the start of inspiration is due to the delay between the start of the inspiratory effort and its detection by the POC, along with the transit time of the pulse through the upper airways.
- Once the POC emits the pulse, no further supplementary oxygen is delivered. Oxygen concentration drops quickly to that of ambient air (~21%) and remains there, indicating that the entire pulse likely reached the lung simulator chamber.
- Expiration begins, and the gas (mostly ambient air) remaining in the dead space (the tubing connecting the replica to the lung simulator) is flushed out.
- Oxygen concentration then rises to that of the mixed gas inside the lung simulator chamber.
Incomplete delivery waveforms for PF (Figure 3C) proceed similarly to the complete case during the beginning of inspiration. However, in this case, a second peak exists near the beginning of exhalation. For incomplete delivery, a portion of the pulse remains in the dead space tubing connecting the replica to the lung simulator, which is exhaled immediately, creating the second peak.
The number of replicas indicating incomplete pulse delivery as a fraction of the total is shown in Table 4.
SF and PF FiO2
Figures 4 and 5 show comparisons of FiO2 between nominally equivalent PF settings (both pulse and sleep mode for the sleep breathing pattern) and SF flow rates. For the sleep breathing pattern, three of the replicas failed to trigger the POC (ie, no breathing was detected) at pulse mode setting 2.0, and four replicas failed to trigger the device at pulse mode setting 6.0. At sleep mode settings of 2.0 and 6.0, only one replica failed to trigger the device. FiO2 values measured for replicas and breathing patterns which failed to trigger the POC were excluded in the calculation of the average values reported in Figure 3A and B.
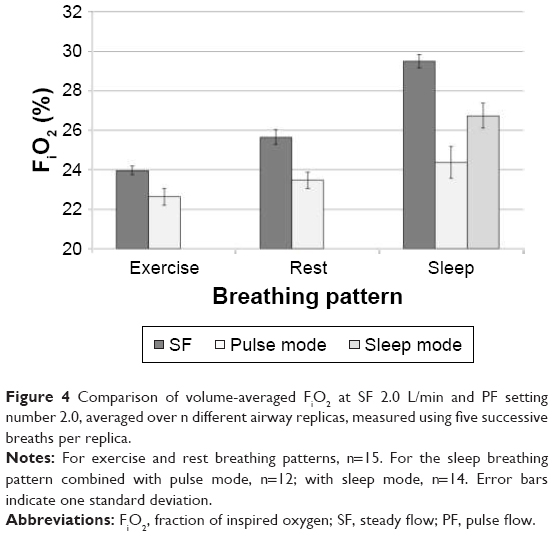 | Figure 4 Comparison of volume-averaged FiO2 at SF 2.0 L/min and PF setting number 2.0, averaged over n different airway replicas, measured using five successive breaths per replica. |
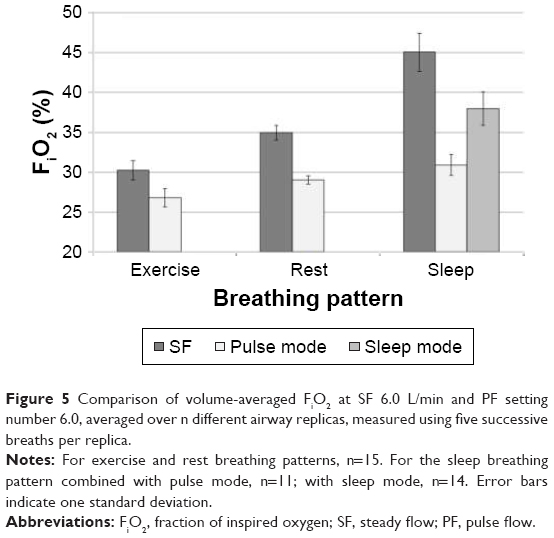 | Figure 5 Comparison of volume-averaged FiO2 at SF 6.0 L/min and PF setting number 6.0, averaged over n different airway replicas, measured using five successive breaths per replica. |
Mean PF FiO2 ranged from 68% to 94% of mean values obtained for nominally equivalent SF rates, generally decreasing with minute ventilation. Despite differences in airway volume and internal surface area, variability between replicas remained small compared to the mean (standard deviation <5% relative to the mean).
Pressure drop measurements
Figure 6 shows the variation of pressure drop at the cannula for each of the 15 replicas with a steady inhalation flow rate. Differences between replicas increased sharply with increasing flow rate. On the whole, most MR imaging replicas tended toward the low end of pressure drops.
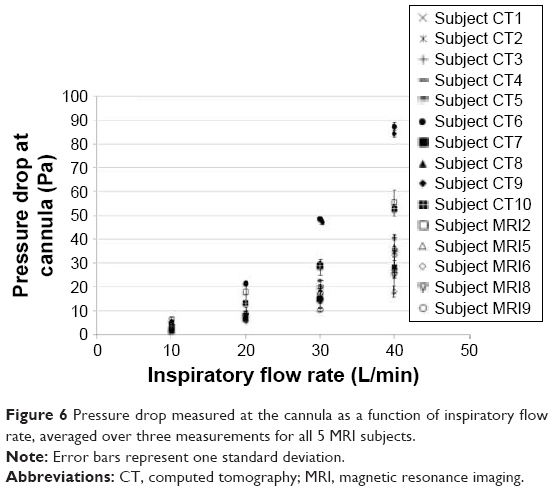 | Figure 6 Pressure drop measured at the cannula as a function of inspiratory flow rate, averaged over three measurements for all 5 MRI subjects. |
Predicting PF FiO2
PF FiO2 values estimated using Equation 5 and PF FiO2 values derived from airway replica experiments are plotted in Figure 7. Overall, Equation 5 consistently overpredicted average FiO2, but by a small margin. This margin increased as the setting number increased from 2.0 to 6.0 for both pulse mode and sleep mode, but no definite trend was observed as the breathing pattern was varied.
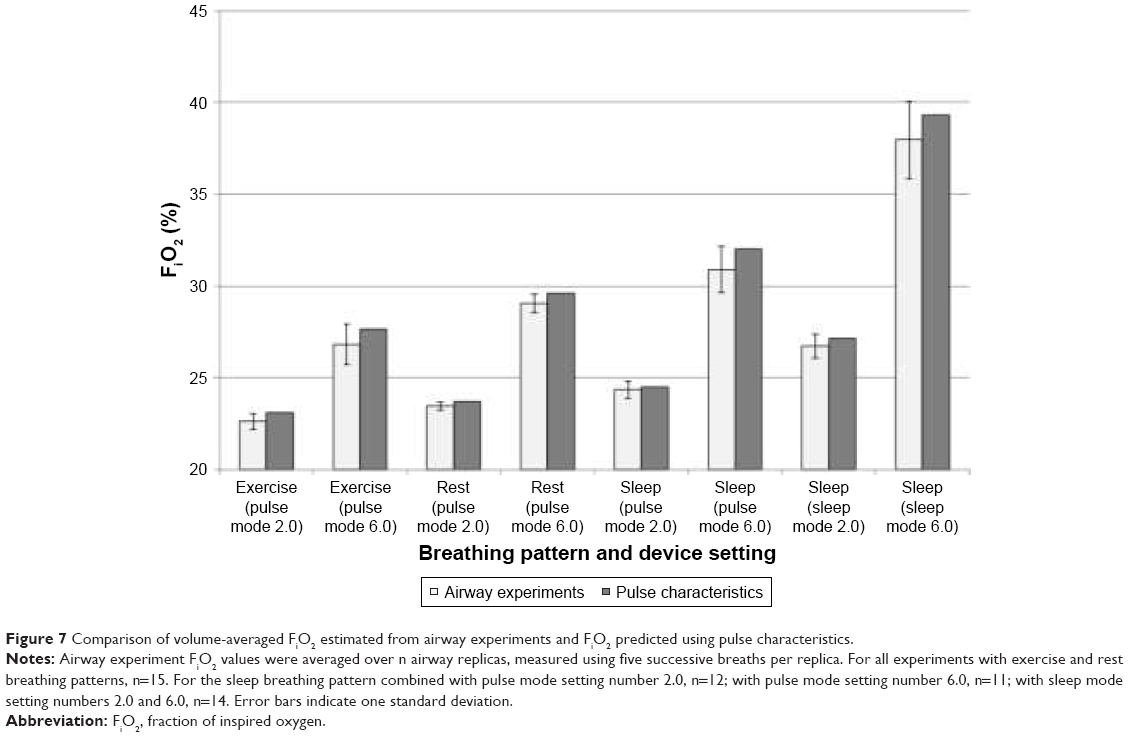 | Figure 7 Comparison of volume-averaged FiO2 estimated from airway experiments and FiO2 predicted using pulse characteristics. |
Discussion
We developed an in vitro model that enabled us to measure real-time FiO2 values at the trachea while maintaining precise control of both breathing rate and tidal volume. This model was used to compare oxygen delivery between SF and PF delivery modes of a commercial POC under realistic triggering conditions, and to determine if oxygen pulse characteristics could adequately predict PF oxygen delivery.
Comparison with the in vivo case
Since FiO2 varies over the course of a breath during delivery of supplemental oxygen, it is challenging to accurately measure the amount of oxygen inhaled per breath in vivo. O’Reilly Nugent et al30 monitored oxygen concentration at the trachea in vivo (sampled through a catheter) during oxygen delivery via nasal cannula for 20 adult subjects throughout inspiration, and calculated time-averaged FiO2 values. For subjects breathing at a rate of 15 breaths/min receiving supplemental SF oxygen at a rate of 2.0 L/min, time-averaged tracheal FiO2 ranged from 25% to 32%. When applying a similar time-averaging procedure to oxygen concentration data at similar settings (SF 2.0 L/min, 13 and 17 breaths/min) obtained during in vitro experiments in the present study, we obtained an FiO2 range of 26%–31%, which is in good agreement with the in vivo data.
On the other hand, the volume-averaged FiO2 reported in the present study is consistently 1%–3% O2 (absolute) lower than our own calculated time-averaged values. The volume-averaged values are considered to be more pertinent here to supplemental oxygen delivery compared to procedures that simply average by time, as high instantaneous inhaled oxygen concentrations may coincide with relatively low inspiratory flow rates near the start of the breath (and thus simple time-averaging procedures overweigh the contribution of these transient peaks in concentration).
These considerations touch on what FiO2 actually represents. Waldau et al31 note that
the efficacy of oxygen therapy can be evaluated by a number of methods that reflect different steps in the oxygenation process depending on the sampling site.
In other words, FiO2 has been considered as the concentration of inspired oxygen anywhere from a position within the patient interface to the alveoli (estimated based on measurements in the exhalation gas).31,32 It has been noted that measurements in the upper airways can be compromised by incomplete mixing of oxygen with inhaled air such that “gas can be sampled at a more distal point, preferably the trachea, where gas mixing is more assured.”33 Regarding estimates based on exhaled gas, homogeneous gas distribution in the lung must be assumed; an assumption that certainly does not apply for all patients. Thus, the bench model employed here where flow and concentration measured in the trachea are measured and integrated over the whole breath allows for a very robust approach that can account for variations in breathing parameters and delivery devices. Further accounting for myriad factors affecting alveolar gas concentrations and oxygen uptake, including gas transport and mixing through the airspaces of the lung and the diffusion capacity of the lung, may be best left to computational modeling.9 In vitro measurement of tracheal oxygen concentrations over the breath, as presented here for example, in Figure 3, would serve as valuable input to such computational models. In clinical practice, noting both the variability in oxygen delivery to the trachea measured in the present study with existing delivery systems, plus the additional intersubject and intrasubject variability that surely exists in oxygen transport and diffusion capacity, evaluation of oxygenation on an individual and ongoing basis, for example, using pulse oximetry, is advisable.
Breath detection in POCs
Chatburn and Williams found that trigger pressures in five commercial POCs ranged from 14 to 22 Pa.14 Since inspiratory flow rates in the sleep breathing pattern reach a maximum of ~27 L/min, Figure 6 implies that at or below that flow rate, a commercial POC would be unlikely to detect the initiation of a breath in several of the replicas (<10 Pa).
While the exact mechanisms of and conditions for breath detection in this specific POC are unknown, given that, in general, negative pressure sensors are frequently used for breath detection in POCs, we hypothesize that a low pressure drop at the nasal cannula may contribute to problems in POC breath detection.
Comparison of SF and PF delivery
PF FiO2 values are consistently lower than those at equivalent SF rates. This difference increased with decreasing minute ventilation (ie, with the sleep breathing pattern having the greatest difference). The higher pulse volumes delivered by the sleep mode relative to pulse mode translated into relatively higher (but still not equivalent to SF) FiO2 values, despite a higher prevalence of incomplete pulse delivery when using the sleep mode. Our data show that, for the SimplyGo POC, the nominal PF setting and the SF flow rate are not equivalent when assessed using FiO2.
The increased prevalence of incomplete pulse delivery in the sleep breathing pattern very likely contributes to the minute ventilation-PF/SF trend described above. As part of the oxygen bolus remains in the upper airways at the start of exhalation, FiO2 will be lower as a result.
At first glance, one might expect that the increased breathing frequency of the high minute ventilation exercise breathing pattern would lead to more frequent incomplete pulse deliveries (on account of shortened breathing times). While we did observe some cases of incomplete pulse delivery in the exercise case due to the above effect, these instances still remained more infrequent than in the sleep case. This may be due to two factors: 1) the time taken for an oxygen pulse to arrive at the trachea in sleep breathing patterns is the longest of all three patterns, and 2) measured pulse durations were significantly longer for the sleep breathing pattern than they were for the other two patterns. While measurement of pulse characteristics using the O2 Conserver Test System confirmed the latter factor, rigorous demonstration of the former factor, the influence of pulse arrival time, would require the ability to distinguish oxygen in the emitted pulse from oxygen entrained from ambient air. This was not possible given our experimental setup. To qualitatively demonstrate the effect of pulse arrival time, we can utilize Figure 2. Sudden drops in oxygen concentration near the start of inspiration occur due to the temporary absence of supplemental oxygen. When concentration increases again, the pulse has arrived at the trachea. Therefore, in pulse delivery oxygen waveforms, the time it takes for the oxygen concentration to arrive at a temporary minimum after the start of inspiration indicates roughly how long it takes the pulse to arrive at the trachea. In Figure 3C (sleep breathing pattern), these times tend to be much longer than those in Figure 3B (rest breathing pattern). If one considers changes in inspiration flow rates between these two breathing patterns, this is to be expected. Because the ramp-up of inspiration flow rate slows down as minute ventilation decreases, the negative pressure trigger threshold is reached later in the course of inspiration. Pulse arrival times will also vary due to differences in individual airway geometries; thus, only some of the airway replicas tested resulted in incomplete pulse delivery.
The commercial O2 Conserver Test System is able to measure a pulse delay, representative of the time required for a pulse to arrive at the machine measured from when the machine attempts to trigger the POC. These pulse delays were constant across all breathing frequencies tested (110 ms); however, the ramp-up of flow rate is absent in the O2 Conserver Test System testing protocol; thus, these pulse delays are not equivalent to the pulse arrival times discussed above. Use of realistic airway replicas, as in the present experiments, therefore provides a test platform through which interaction between simulated breathing patterns and nasal airway geometry can be explored, and may be more representative of in vivo oxygen delivery via nasal cannula. Even so, the ability of the limited set of 15 realistic nose–throat airway replicas used herein to adequately capture variability in airway geometry in the much larger population of COPD patients receiving supplemental oxygen is unknown. Accordingly, variation between replicas in volume-averaged FiO2 (Figures 4 and 5), in triggering pressure measured at the cannula (Figure 6), and in complete versus incomplete pulse delivery (Table 4), should be interpreted as illustrative, rather than representative, of variability occurring in the larger population.
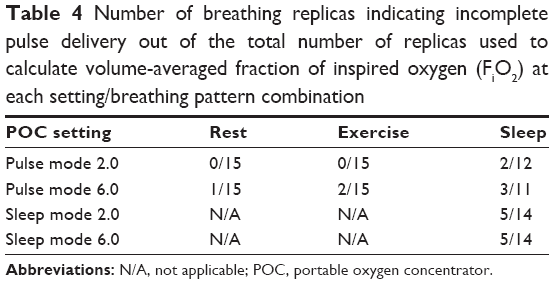 | Table 4 Number of breathing replicas indicating incomplete pulse delivery out of the total number of replicas used to calculate volume-averaged fraction of inspired oxygen (FiO2) at each setting/breathing pattern combination |
Another difference between SF and PF delivery is in the pooling effect of the anatomic reservoir during SF delivery. Zhou and Chatburn examined the effect of elimination of the anatomic reservoir on FiO2 in SF oxygen delivery.16 They found that FiO2 was reduced in breathing in which the pooling effect of the anatomic reservoir was removed. In those breathing waveforms, expiratory flow was not allowed to slowly decay to zero, which shortened the period of time in which expiratory flow was sufficiently low to permit supplemental oxygen to pool in the nasal airway. In the present study, the time needed for expiratory flow to reach zero is shorter in the exercise breathing pattern than in the rest or sleep breathing patterns, on account of an increased tidal volume and breathing rate. Therefore, one would expect the magnitude of the pooling effect to increase as the tidal volume and breathing rate decrease. The effect of the anatomic reservoir would be greatest for the sleep breathing pattern and smallest for the exercise breathing pattern. In contrast, because of the absence of end-expiratory oxygen flow, the anatomic reservoir has no effect on oxygen delivery in PF. As such, one would expect the discrepancy between SF and PF FiO2 to grow as tidal volume decreases and breathing slows down, as observed in Figures 3 and 4.
Predicting PF FiO2 based on pulse characteristics
PF FiO2 estimated using real-time oxygen concentrations and PF FiO2 calculated by way of Equation 5 using pulse characteristics were generally in agreement. However, since absolute differences in FiO2 of 1% may be clinically significant in long-term therapy, we can conclude that while usage of pulse characteristics alone is sufficient to predict oxygen delivery for many conditions, testing using realistic airway replicas is still useful in some cases where calculation using pulse characteristics might significantly overpredict POC performance (eg, sleeping patients at high setting numbers).
Study limitations
Although the present testing methodology can be seen as an improvement of past attempts to precisely quantify the amount of oxygen inspired during supplemental oxygen therapy, several limitations can be noted. First, the results presented above are specific to a single POC, and therefore do not reflect the performance of POCs in general. Expanded testing, using the present methodology, may provide valuable information describing relative oxygen delivery from different POCs operating at nominally equivalent pulse settings.
In addition, medical images upon which the airway replicas are based were acquired in awake subjects during tidal breathing. Therefore, they do not encompass any changes to the upper airway geometry that may occur during sleep or at high minute ventilation during exercise.
Further, the lack of oxygen uptake in the test lung places a limit on our ability to accurately predict FiO2 in a clinical, rather than benchtop, setting. Because breathing involves re-inhalation of gas from the conducting airways, the concentration of oxygen exhaled from gas-exchange regions of the lungs, and subsequently re-inhaled, is relevant in determining FiO2. As there is no analog present for alveolar oxygen uptake in the lung simulator used in this study, any amount of supplementary oxygen supplied will, over time, increase the inner chamber oxygen concentration (analogous to the alveolar oxygen concentration). In the in vivo case, oxygen is constantly being removed through the alveoli into the blood, thus decreasing the oxygen concentration of the exhaled gas. To demonstrate this effect, we can consider what happens when Equation 1 is modified to include a nonzero term for oxygen uptake into the blood.
|
|
VO2,uptake represents a volume of oxygen that is drawn into the blood in a single breath. Rearranging Equation 6, we can obtain a modified version of Equation 4.
|
|
Since all values in the final term on the right hand side of Equation 7 are greater than zero, XO2,c calculated using Equation 7 will always be lower than XO2,c calculated using Equation 4.
Incomplete pulse delivery also has implications on oxygen delivery to the lungs beyond what is observed in its effect on FiO2 evaluated at the trachea. In cases of incomplete pulse delivery, less of the pulse is able to travel past the trachea and into the lungs. However, our reported FiO2 values do not account for a portion of the oxygen pulse that is immediately exhaled from the dead space of the tracheo-bronchial airways. When assessing oxygen delivery to the gas-exchange regions of the lungs, modeling the transport of oxygen from the trachea through a multi-generation airway tree may provide a more complete picture.9
Additional future work may also involve comparisons of oxygen delivery in closed versus open mouth breathing, in children versus adults, or in diseased versus healthy lungs. The effect of mouth breathing versus nose breathing, or open versus closed mouth position,31 is especially relevant during sleep and exercise.
Conclusion
This study examined a benchtop testing method for assessing POC performance using realistic airway models and real-time monitoring of inspired oxygen concentrations at the trachea. Testing using nasal airway replicas derived from medical imaging and simulated breathing patterns permitted oxygen delivery from a POC to be evaluated under realistic triggering conditions.
Based on the measurement of volume-averaged tracheal FiO2 for the POC studied, PF delivered consistently lower amounts of oxygen than SF at flow rates equivalent to nominal PF settings. Differences were largest when the higher PF setting was combined with breathing parameters typical of sleeping patients. We hypothesize that this difference is primarily due to two factors: 1) the increased effect of oxygen pooling for SF in the anatomic reservoir during slower, shallower breathing, and 2) a delay in the arrival of the pulse, which leads to retention in the upper airways and exhalation of part of the oxygen bolus.
Acknowledgments
The authors would like to thank Cole Christianson for his work in measuring airway replica pressure drops, Kelvin Duong for his help in analyzing raw data, Eric Bracke for contributions to building the CT replicas, and Dr Joëlle Texereau for reviewing and providing helpful comments on an earlier version of this manuscript. This work was funded by Air Liquide and by Alberta Economic Development and Trade and benefited from an equipment grant from the Canadian Natural Sciences and Engineering Research Council.
Disclosure
IMK, MP, KZ, and GC are current employees of Air Liquide, a major provider of home oxygen therapy. The authors report no other conflicts of interest in this work.
References
McCoy R. Oxygen-conserving techniques and devices. Respir Care. 2000;45(1):95. | ||
Gustafson JD, Yang S, Blakeman TC, Dorlac WC, Branson R. Pulsed dosed delivery of oxygen in mechanically ventilated pigs with acute lung injury. J Trauma Acute Care Surg. 2013;75(5):775. | ||
Blakeman TC, Rodriquez D, Britton TJ, Johannigman JA, Petro MC, Branson RD. Evaluation of oxygen concentrators and chemical oxygen generators at altitude and temperature extremes. Mil Med. 2016;181(5 Suppl):160–168. | ||
Blakeman TC, Rodriquez D, Gerlach TW, Dorlac WC, Johannigman JA, Branson RD. Oxygen requirement to reverse altitude-induced hypoxemia with continuous flow and pulsed dose oxygen. Aerosp Med Hum Perform. 2015;86(4):351–356. | ||
Yáñez AM, Prat JP, Álvarez-Sala JL, et al. Oxygenation with a single portable pulse-dose oxygen-conserving device and combined stationary and portable oxygen delivery devices in subjects with COPD. Respir Care. 2015;60(3):382–387. | ||
Byron PR, Hindle M, Lange CF, et al. In vivo–in vitro correlations: predicting pulmonary drug deposition from pharmaceutical aerosols. J Aerosol Med Pulm Drug Deliv. 2010;23(Suppl 2):S59–S69. | ||
Sandeau J, Katz I, Fodil R, et al. CFD simulation of particle deposition in a reconstructed human oral extrathoracic airway for air and helium–oxygen mixtures. J Aerosol Sci. 2010;41(3):281–294. | ||
Airsep Freestyle Patient Manual. MN123-1 rev E 11/12. Buffalo, NY, USA: AirSep. | ||
Katz I, Pichelin M, Montesantos S, et al. An in silico analysis of oxygen uptake of a mild COPD patient during rest and exercise using a portable oxygen concentrator. Int J Chron Obstruct Pulmon Dis. 2016;11:2427–2434. | ||
Garrod R, Bestall E, Paul E, Wedzicha JA. Evaluation of pulsed dose oxygen during exercise in patients with severe chronic obstructive pulmonary disease. Thorax. 1999;54:242–244. | ||
Carter R, Tashkin D, Djahed B, Hathaway E, Nicotra B, Tiep BL. Demand oxygen delivery for patients with restrictive lung disease. Chest. 1989;96:1307–1311. | ||
Braun SR, Spratt G, Graham SC, Ellersieck M. Comparison of six oxygen delivery systems for COPD patients at rest and during exercise. Chest. 1992;102:694–698. | ||
Palwai A, Skowronski M, Coreno A, Drummond C, McFadden ER Jr. Critical comparisons of the clinical performance of oxygen-conserving devices. Am J Respir Crit Care Med. 2010;181(10):1061–1071. | ||
Chatburn RL, Williams TJ. Performance comparison of 4 portable oxygen concentrators. Respir Care. 2010;55(4):433–442. | ||
Bliss PL, McCoy RW, Adams AB. Characteristics of demand oxygen delivery systems: maximum output and setting recommendations. Respir Care. 2004;49(2):160–165. | ||
Zhou S, Chatburn RL. Effect of the anatomic reservoir on low-flow oxygen delivery via nasal cannula: constant flow versus pulse flow with portable oxygen concentrator. Respir Care. 2014;59(8):1199. | ||
Grgic B, Finlay WH, Burnell PKP, Heenan AF. In vitro intersubject and intrasubject deposition measurements in realistic mouth–throat geometries. J Aerosol Sci. 2004;35(8):1025–1040. | ||
Golshahi L, Vehring R, Noga ML, Finlay WH. In vitro deposition of micrometer-sized particles in the extrathoracic airways of children during tidal oral breathing. J Aerosol Sci. 2013;57:14–21. | ||
Martin AR, Katz IM, Lipsitz Y, Terzibachi K, Caillibotte G, Texereau J. Methods for evaluation of helium/oxygen delivery through non-rebreather facemasks. Med Gas Res. 2012;2(1):31. | ||
Golshahi L, Noga ML, Thompson RB, Finlay WH. In vitro deposition measurement of inhaled micrometer-sized particles in extrathoracic airways of children and adolescents during nose breathing. J Aerosol Sci. 2011;35(4):1. | ||
Finlay WH. The Mechanics of Inhaled Pharmaceutical Aerosols: An Introduction. San Diego: Academic Press; 2001. | ||
Knoch M, Wunderlich E. Effect of age related breathing parameters on the performance of a new nebulizer system: an in vitro study. J Aerosol Med. 1995;8(3):285–288. | ||
Coates AL, Macneish CF, Allen PD, Ho SL, Lands LC. Do sinusoidal models of respiration accurately reflect the respiratory events of patients breathing on nebulizers? J Aerosol Med. 1999;12(4):265–273. | ||
Prokop RM, Finlay WH, Stapleton KW. An in vitro technique for calculating the regional dosages of drugs delivered by an ultrasonic nebulizer. J Aerosol Sci. 1995;26(5):847–860. | ||
Weber A, Morlin G, Cohen M, Williams-Warren J, Ramsey B, Smith A. Effect of nebulizer type and antibiotic concentration on device performance. Pediatr Pulmonol. 1997;23(4):249–260. | ||
Langer AW, Hutcheson JS, Charlton JD, McCubbin JA, Obrist PA, Stoney CM. On-line minicomputerized measurement of cardiopulmonary function on a breath by breath basis. Psychophysiology. 1985;22(1):50–58. | ||
Chatila W, Nugent T, Vance G, Gaughan J, Criner GJ. The effects of high-flow vs low-flow oxygen on exercise in advanced obstructive airways disease. Chest. 2004;126(4):1108–1115. | ||
Hudgel DW, Martin RJ, Capehart M, Johnson B, Hill P. Contribution of hypoventilation to sleep oxygen desaturation in chronic obstructive pulmonary disease. J Appl Physiol. 1983;55(3):669–677. | ||
Moore CP, Finlay WH, Martin AR. Investigating intersubject variability in pulsed oxygen delivery using adult nasal airway replicas. Am J Respir Crit Care Med. 2015;191:A5811. | ||
O’Reilly Nugent A, Kelly PT, Stanton J, Swanney MP, Graham B, Beckert L. Measurement of oxygen concentration delivered via nasal cannulae by tracheal sampling. Respirology. 2014;19(4):538–543. | ||
Waldau T, Larsen VH, Bonde J. Evaluation of five oxygen delivery devices in spontaneously breathing subjects by oxygraphy. Anaesthesia. 1998;53:256–263. | ||
Wettstein RB, Shelledy DC, Peters JI. Delivered oxygen concentrations using low-flow and high-flow nasal cannulas. Respir Care. 2005;50(5):604–609. | ||
Casaburi R. Assessing the dose of supplemental oxygen: let us compare methodologies. Respir Care. 2005;50(5):594–595. |
 © 2017 The Author(s). This work is published and licensed by Dove Medical Press Limited. The full terms of this license are available at https://www.dovepress.com/terms.php and incorporate the Creative Commons Attribution - Non Commercial (unported, v3.0) License.
By accessing the work you hereby accept the Terms. Non-commercial uses of the work are permitted without any further permission from Dove Medical Press Limited, provided the work is properly attributed. For permission for commercial use of this work, please see paragraphs 4.2 and 5 of our Terms.
© 2017 The Author(s). This work is published and licensed by Dove Medical Press Limited. The full terms of this license are available at https://www.dovepress.com/terms.php and incorporate the Creative Commons Attribution - Non Commercial (unported, v3.0) License.
By accessing the work you hereby accept the Terms. Non-commercial uses of the work are permitted without any further permission from Dove Medical Press Limited, provided the work is properly attributed. For permission for commercial use of this work, please see paragraphs 4.2 and 5 of our Terms.