")
Back to Journals » Clinical Interventions in Aging » Volume 18
Comparison of Half-Effective Concentration of Propofol in Patients with Parkinson’s Disease and Non-Parkinson’s Disease
Authors Wang P, Zhao L, Wang T, Mei W , Li J, An Y, Li L, Li Z
Received 28 June 2022
Accepted for publication 13 February 2023
Published 28 February 2023 Volume 2023:18 Pages 307—315
DOI https://doi.org/10.2147/CIA.S380416
Checked for plagiarism Yes
Review by Single anonymous peer review
Peer reviewer comments 2
Editor who approved publication: Dr Zhi-Ying Wu
Ping Wang,1,2 Lei Zhao,1 Tianlong Wang,1 Wei Mei,3 Jingsheng Li,1 Yi An,1 Lixia Li,1 Zhongjia Li1
1Department of Anesthesiology, Xuanwu Hospital, Capital Medical University, Beijing, 100053, People’s Republic of China; 2Department of Anesthesiology, Jinling Hospital, Medical School of Nanjing University, Nanjing, Jiangsu, 210000, People’s Republic of China; 3Department of Anesthesiology, Tongji Hospital, Tongji Medical College, Huazhong University of Science and Technology, Wuhan, Hubei, 430000, People’s Republic of China
Correspondence: Lei Zhao, Email [email protected]
Objective: This study aimed to compare the half-effective concentration (EC50) of propofol required for the bispectral index (BIS) 50 in patients with Parkinson’s disease (PD) and non-PD (NPD) during induction by the Dixon’s improved sequential method.
Methods: This prospective study recruited 20 patients with PD undergoing deep brain stimulation and 20 patients with NPD accompanied by meningioma or glioma undergoing intracranial surgery from March 2018 to March 2019. The patients were induced by propofol via target-controlled infusion. The target effect-site concentration of propofol was determined by the Dixon’s improved sequential method. The results of the pilot experiment showed that the target effect-site concentration for the first patient with PD and NPD was 3.5 μg/mL and 2.8 μg/mL, respectively. BIS values were recorded after achieving a constant effect-site concentration of propofol. The increment or decrement of the target effect-site concentration of the next patient was 0.1 μg/mL.
Results: Demographic data, general physical condition, and hemodynamic values were similar between the PD and the NPD groups. The target effect-site concentration of propofol induction doses was significantly higher in the PD group than in the NPD group. The EC50 of propofol required for BIS 50 was 3.213 μg/mL [95% confidence interval (CI), 3.085– 3.287 μg/mL] in the PD group and 2.77 μg/mL (95% CI, 2.568– 2.977 μg/mL) in the NPD group.
Conclusion: The EC50 of propofol required for BIS 50 was higher in patients with PD than in patients with NPD.
Keywords: BIS, effect-site concentration, Parkinson’s disease, propofol, sequential method, TCI
Introduction
Parkinson’s disease (PD) is the second most common neurodegenerative disease next to Alzheimer’s disease. It is common in elderly people. The incidence of PD has increased every year, with the aging of the population.1 For decades, the clinical diagnosis of PD was based on a set of motor symptoms such as rigidity, bradykinesia, akinesia, abnormal posture, and resting tremor.2 The etiology of PD is still unclear. It is thought to be caused by the degeneration of dopaminergic neurons in the striatum of the substantia nigra.3
Studies have reported that the midbrain dopaminergic neurons release not only dopamine but also gamma-aminobutyric acid (GABA), which may explain why dopamine recovery can lead to an initial improvement in patients with PD but eventually lose effect, suggesting that GABA and PD are closely linked.4,5 Researchers show different opinions on the changes in GABA in patients with PD.6–8 The balance between glutamate and GABA is crucial for brain physiological functioning, and neurotransmitter abnormality is believed to cause several movement disorders, including PD.9 Some studies have reported decreased brain GABA levels in PD.10–12 Other studies are inconsistent with decreased GABA levels in PD.13–15 Previous MRS (Magnetic Resonance Spectroscopy) studies on PD have reported an increased GABA level in the pons, putamen, and thalamus.6,16 Besides, studies have reported that effective subthalamic nucleus (STN) deep brain stimulation (DBS) or following levodopa administration promoted a similar decreased GABA level in the ventralis anterior thalamus, together with a significant clinical improvement.7,8 However, inconsistent with this finding, other studies have demonstrated a significant decrease in the GABA level in the cerebrospinal fluid (CSF) during the DBS.17 That said, the GABA level is still unknown in patients with PD.
Propofol is a common intravenous sedative drug with rapid distribution and metabolism. It can be quickly recovered and subjected to neurological examination after surgery. Studies have found that propofol can protect the brain by inhibiting oxidative stress while the shortage of natural antioxidants is observed in PD.18,19 These characteristics account for the frequent use of propofol for sedation of patients with PD undergoing DBS. Propofol acts on GABAA receptors as most anesthetics do20,21 and retards the inactivation and desensitization of GABA receptors.22 However, it is speculated that a difference exists in propofol sensitivity between patients with PD and NPD.
The target-controlled infusion (TCI) system enables the automatic dose control of sedative drugs, reduces hemodynamic fluctuation, and ensures a better quality of anesthesia.23–26 Propofol infused with Cp (concentration in plasma) or Ce (concentration at the site of effect) can be safely and effectively used for general anesthesia and can reach sufficient sedation depth. Some research results show that compared with Ce, Cp is expected to have a large difference due to different administration rates. Ce is more closely related to the clinical sedation level, which can rapidly and accurately reach the expected sedation effect.27 Moreover, Ce has shorter induction time and seldom causes a severe cardiovascular response.
Gajraj found that the mean of BIS was 89.5 in conscious states and 48.8 in unconscious states during anesthesia induction with propofol via TCI. Yue Yun showed that implicit memory disappeared when the BIS threshold was below 50. Anderson et al found that the BIS value had an obvious lag behind the disappearance of consciousness, and the BIS was 85 (73–98) when patients were awake and 48 (10–83) when consciousness disappeared. Kuizenga et al found that, under the condition of the unstable concentration of propofol, the relationship between the plasma concentration of propofol and BIS was still uncertain. Therefore, the target of sedation depth was maintained at BIS 50, and BIS was recorded 3 min after the effect-site concentration reached the target concentration in the present study.
EC50 refers to the concentration of the drug that causes 50% of participants to have a positive qualitative reaction. The Dixon’s improved sequential method, also known as the up-down method, is a simple and rapid method for determining EC50. It applies to the drug that is effective and fast in endpoint determination.28
Few studies examined the requirement of propofol in patients with PD.29 This study aimed to compare the EC50 of the target effect-site concentration of propofol induction doses required for BIS 50 in patients with PD and NPD by the sequential method, so as to explore a safer and more effective anesthesia management, rather than just being induced by weight.
Materials and Methods
Participants
This prospective study was performed from March 2018 to March 2019 in the Xuanwu Hospital of the Capital Medical University (Beijing, China). It was approved by the ethics committee of the Xuanwu Hospital ([2018]051) and registered at the clinicaltrials.gov (registration number: ChiCTR1800014542, principal investigator’s name: Lei Zhao, date of registration: 20th January 2018). A total of 20 patients with PD undergoing DBS and 20 patients with NPD undergoing intracranial surgery, aged 45–65 years with the body mass index (BMI) of 18.5–28 kg/m2, were recruited. Before enrollment, written informed consent was obtained. The exclusion criteria were as follows: (1) American Society of Anesthesiologists (ASA) III and above; (2) patients allergic to propofol and dependent on alcohol or opioids; (3) patients with severe respiratory and circulatory diseases; (4) patients with the bispectral index (BIS) less than 80 before induction; (5) patients whose mean arterial pressure decreased by more than 20% even after treatment with vasoactive drugs; and (6) patients who rejected the study. This study involved no blinding.
Methods
All patients with PD underwent DBS electrode placement under local anesthesia. Then, the pulse generator was placed under general anesthesia, and the study was started when anesthesia induction begins. Only under local anesthesia to insert the electrodes. No sedative medication is given to avoid affecting our study. All patients fasted for 8 h before the surgery. Anti-PD medications were suspended at the night before the surgery. After entering the room, the noninvasive blood pressure (BP), heart rate (HR), pulse oximetry, and BIS (using the Aspect BIS sensor 186–1100, Mansfield, MA) were monitored. A 16 G intravenous catheter was inserted. Further, 100% oxygen was given for 2 min through the mask. Anesthesia was induced using propofol (Fresenius Kabi, 1711170), sufentanil, and rocuronium to facilitate endotracheal intubation.
The target effect-site concentration of propofol was determined using the Dixon’s improved sequential method: according to the commonly used clinical dose of propofol combined with the pilot experiment results, the target effect-site concentration of propofol for the first patient in the PD group was set at 3.5 µg/mL and the concentration in the NPD group was set at 2.8 µg/mL with the TCI pump (INJECTOMAT TIVA AGILIA, Fresenius, Germany) using the Schnider model. Referring to the results of the pilot experiment and similar studies using the sequential method to measure the EC50 of propofol,29 the gradient between adjacent target concentrations was set to 0.1 µg/mL. The BIS was recorded 3 min after the effect-site concentration reached the set target. If the BIS of the first patient reached 50 (positive), the target effect-site concentration of the next patient was decreased by 0.1 µg/mL. If the BIS of the first patient did not reach 50 (negative), the target concentration of the next patient was increased by 0.1 µg/mL, and so on. The target effect-site concentration of propofol and BIS value were recorded. Then, 0.3 µg/kg sufentanil and 0.6 mg/kg rocuronium were given.
After tracheal intubation, the tidal volume was set to 6–8 mL/kg, the fresh gas flow was adjusted to 2L/min, the inhaled oxygen concentration was adjusted to 50%, the SpO2 was maintained at 98–100%, and the partial pressure of end-tidal carbon dioxide was maintained at 35–45 mm Hg. Patients with PD might have different sensitivity to propofol. Therefore, the dose of propofol should be adjusted in time to avoid intraoperative awareness and maintain the BIS at 40–60. Remifentanil was infused at a rate of 0.1–0.4 µg/(kg ⋅ min) for analgesia. The infusion rate was adjusted to keep the BP and HR within 20% of the normal value. Noradrenaline bitartrate pump injection or phenylephrine single administration was used to control the BP if necessary. During the surgery, the pulse oxygen saturation was kept at 98–100% and the body temperature was kept at 36–37°C 5 min before the end of the surgery. The infusion of all drugs was stopped. Extubation was performed after the patients met extubation criteria.
Indicators
The general data of patients were recorded, including age, sex, BMI, and ASA classification. HR, systolic blood pressure (SBP), diastolic blood pressure (DBP), and BIS were recorded before induction (T1) and 3 min after the target effect-site concentration of propofol was approached (T2).
Statistical Analysis
Although Dixon et al suggested that 40 patients should be included in an up-down sequential study, it is now generally accepted that 20–40 patients would provide a stable estimation of the target dose in most situations.30 Hence, 20 patients in the PD group and 20 patients in the NPD group were recruited in the present study. All statistical analyses were performed using SPSS version 24.0 (International Business Machines Corp). EC50 values were analyzed with the Probit Review. Continuous data were presented as mean and standard deviation, whereas EC50 values were presented as an estimated value [95% confidence interval (CI)]. Demographics between the two groups were compared using the Student t-test or χ2 test. Categorical data were expressed as percentages. A P value of 0.05 or less was considered statistically significant.
Results
General Demographics
Thirty patients in PD group and 33 patients in NPD group were assessed for eligibility based on inclusion and exclusion criteria. Among them, 10 patients in PD group were excluded for not meeting inclusion criteria due to ASA physical status III or above (n = 4) and patients’ refusal (n = 6). Thirteen patients in NPD group were excluded for not meeting inclusion criteria due to ASA physical status III or above (n = 7), dependent on alcohol (n = 2) and patients’ refusal (n = 4). Arrhythmia and hypotension did not occur in either group during induction. The SpO2 was maintained above 95%. No intraoperative awareness occurred in both groups during the postoperative follow-up. Finally, 20 patients in PD group and 20 patients in NPD group were included in present analysis (Figure 1).
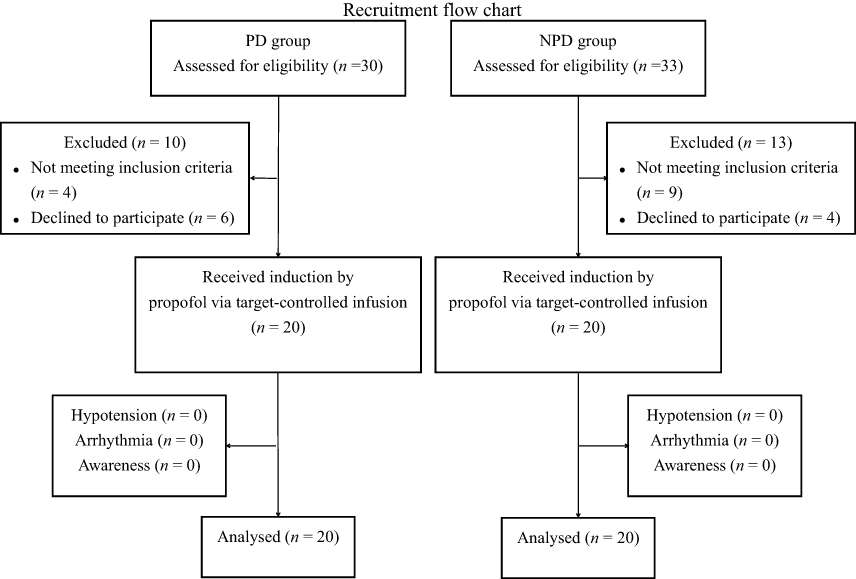 |
Figure 1 Recruitment flow chart. |
The general demographic data were comparable between the PD and NPD groups, including age, sex, BMI, ASA classification, and HR, SBP, DBP, and BIS before induction (T1) (P > 0.05, Table 1).
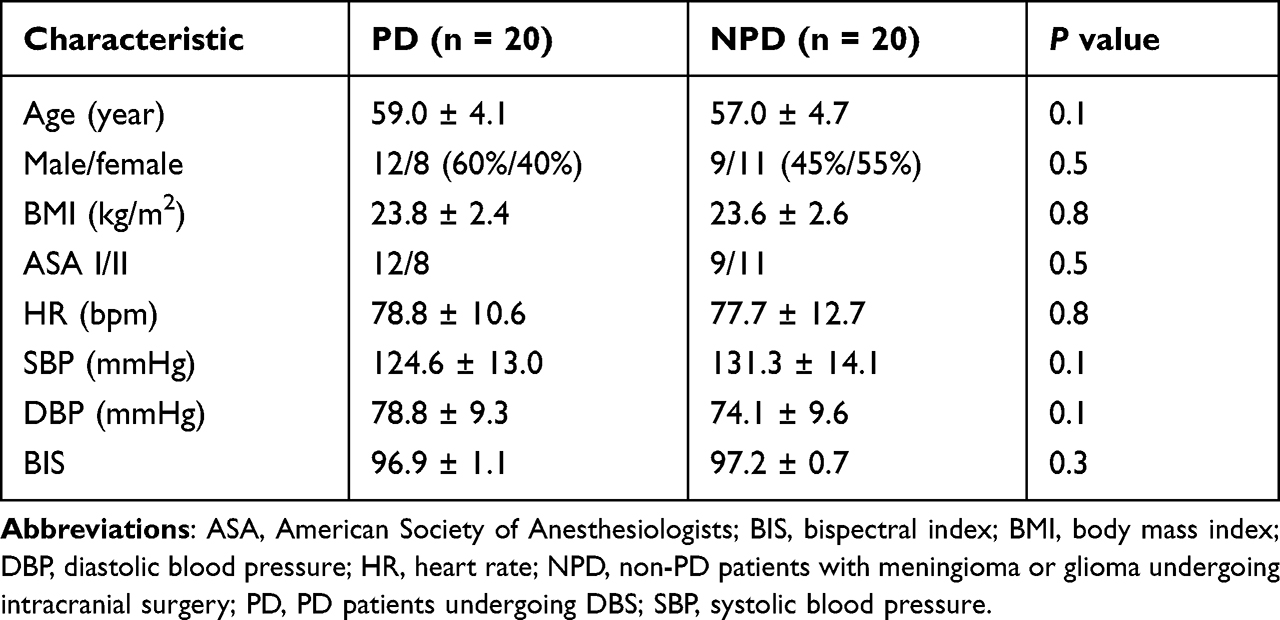 |
Table 1 Demographic Data of Patients in the Two Groups |
Hemodynamics
The hemodynamic changes are shown in Table 2. Anesthesia induction led to slight changes in the HR and BP in the two groups.


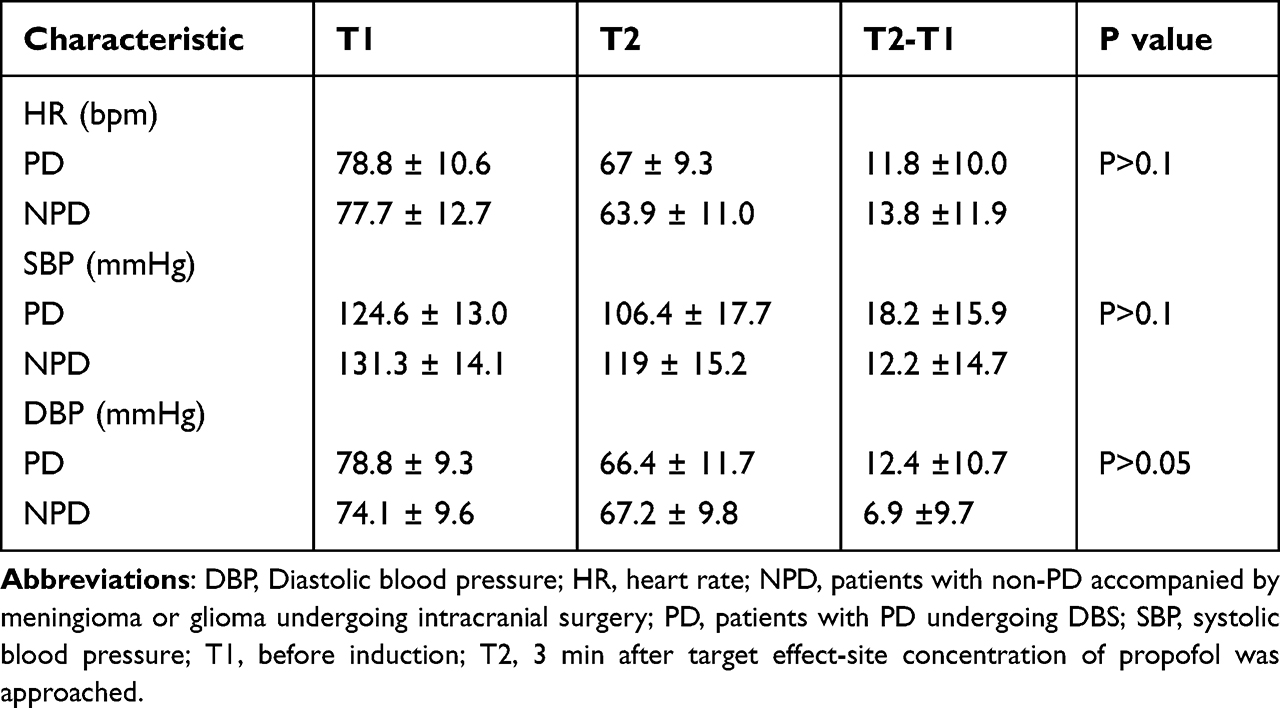 |
Table 2 Hemodynamic Comparison in Patients of the Two Groups |
According to two equations above, no significant difference in the HR, SBP, and DBP was observed in the PD group compared with the NPD group at the time before induction (T1) and 3 min after the target effect-site concentration of propofol was approached (T2) (P > 0.05, Table 2).
EC50
Figures 2 and 3 show the individual responses to induction by propofol via TCI according to the up-down sequence. The average propofol target effect-site concentration required for BIS 50 was higher in the PD group than in the NPD group. EC50 was 3.213 µg/mL (95% CI, 3.085–3.287 µg/mL) in the PD group, versus 2.77 µg/mL (95% CI, 2.568–2.977 µg/mL) in the NPD group.
 |
Figure 2 Individual responses to induction by propofol via TCI according to the up-down sequence in PD group. |
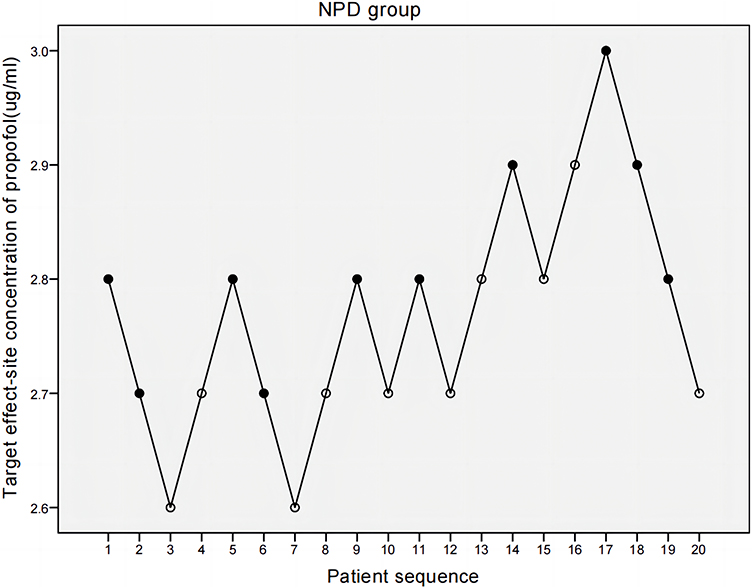 |
Figure 3 Individual responses to induction by propofol via TCI according to the up-down sequence in NPD group. |
Discussion
This study found the average propofol effect-site concentration required for BIS 50 was higher in the PD group than in the NPD group, which might be related to the high demand for general anesthesia drugs in patients with PD. Further, patients with PD wake up slowly probably because of the slow metabolism of general anesthesia drugs.
A multicenter, large-sample clinical study showed that the effective-site EC50 of propofol via TCI required for subconscious disappearance was 2.2 µg/mL, and the BIS of 50% patients losing consciousness was 58.4.31 In this study, the EC50 of propofol required for BIS 50 was 2.77 µg/mL in the NPD group (95% CI, 2.568–2.977 µg/mL). It was consistent with the clinical results of previous multicenter large-sample studies.
This study found that the dose of propofol for induction was more in patients with PD than in patients with NPD. While propofol acted on the GABAA receptor, it was speculated that the GABAA receptor might be insensitive in patients with PD and GABA levels might increase compensatively. This was consistent with previous findings. These studies suggested that the loss of nigrostriatal neurons in PD led to the increased activity of GABA neurons,32,33 resulting in increased GABA levels in pons and further inhibiting the activity of dopaminergic neurons. The decrease in dopaminergic activity led to the enhancement of STN activity,34 which eventually caused disease progression in PD.
However, Xu et al found that the EC 50 of propofol was lower in the PD group than in the NPD group. They judged the consciousness of patients based on the observer’s assessment of alertness and sedation score (OAA/S), whereas in the present study, unconsciousness was defined as the BIS value below 50.29 For anesthetized individuals, the concentration of anesthetic drugs as a group pharmacodynamic index had large differences. The traditional sedation depth (OAA/S),35 which was judged according to clinical signs, had the disadvantage of requiring frequent stimulation for evaluation, besides its subjectivity and variability. Some studies showed a negative correlation between the propofol effect-site concentration via TCI and BIS.36,37 Many studies found that using propofol via TCI with BIS monitoring reduced the total required dose of propofol and the recovery time in patients under sedation, preventing the adverse events of overdose.38–40
This study had few limitations. First, the sequential method was used to reduce the number of patients. A total of 20 patients were recruited in both groups. The sample size was small, but the PD group had eight alternating waveforms and the NPD group had six alternating waveforms, which met the requirement of the sequential method. Second, the effect of DBS implantation under local anesthesia on propofol requirement could not be ruled out. At this stage, pain mainly occurred during drilling. Local anesthesia was used to ensure the VAS (Visual Analogue Score) pain score, which the patients reported as 0. Third, the sedation depth of propofol depended on not only blood concentration but also stimulation, age, and BMI. In this study, no one-to-one pairing might have caused some deviation of the results. Only patients aged 45–65 years with the BMI of 18.5–28 kg/m2 were selected for this study. Propofol was used before the start of the surgery to eliminate the influence of surgical noxious stimulation and other narcotic drugs on the sedation depth.
Conclusions
The etiology of PD is still not completely clear. Few studies explored the requirement of propofol in patients with PD. An accurate use of anesthetics under general anesthesia is worth investigating. This study filled the gap in this aspect and had better innovation and clinical significance. The EC50 of propofol required for BIS 50 was found to be higher in patients with PD than in patients with NPD, thus providing a reference for the rational use of anesthetics in clinic.
Data Sharing Statement
All data in the manuscript are accessible if requested (contact e-mail address [email protected]). The authors verify that all data intended for sharing are deidentified.
Acknowledgments
The authors would like to thank Dr. Chunxiu Wang for the guidance of statistics in the study.
Funding
This study was funded by the programs of the National Key R&D Program of China (SQ2018YFC010196) and the Beijing Municipal Administration of Hospitals Clinical Medicine Development of Special Funding Support (ZYLX201818).
Disclosure
The authors report no conflicts of interest in this work.
References
1. Bergman H, Deuschl G. Pathophysiology of Parkinson’s disease: from clinical neurology to basic neuroscience and back. Mov Disord. 2002;17:28–40. doi:10.1002/mds.10140
2. Siderowf A, Lang A. Pre-motor Parkinson’s disease: concepts and definitions. Mov Disord. 2012;27:608–616. doi:10.1002/mds.24954
3. Blaszczyk JW. Parkinson’s disease and neurodegeneration: GABA-collapse hypothesis. Front Neurosci. 2016;10:269. doi:10.3389/fnins.2016.00269
4. Brichta L, Greengard P, Flajolet M. Advances in the pharmacological treatment of Parkinson’s disease: targeting neurotransmitter systems. Trends Neurosci. 2013;36:543–554. doi:10.1016/j.tins.2013.06.003
5. Diogenes MJ, Dias RB, Rombo DM, et al. Extracellular alpha-synuclein oligomers modulate synaptic transmission and impair LTP via NMDA-receptor activation. J Neurosci. 2012;32:11750–11762. doi:10.1523/JNEUROSCI.0234-12.2012
6. Emir UE, Tuite PJ, Öz G. Elevated pontine and putamenal GABA levels in mild-moderate Parkinson disease detected by 7 tesla proton MRS. PloS One. 2012;7:30918. doi:10.1371/journal.pone.0030918
7. Abbott RJ, Pye I, Nahorski S. CSF and plasma GABA levels in Parkinson’s disease. J Neurol Neurosurg Psychiatry. 1982;45:253–256. doi:10.1136/jnnp.45.3.253
8. Stefani A, Fedele E, Vitek J, et al. The clinical efficacy of L-DOPA and STN-DBS share a common marker: reduced GABA content in the motor thalamus. Cell Death Dis. 2011;2:154. doi:10.1038/cddis.2011.35
9. Barone P. Neurotransmission in Parkinson’s disease: beyond dopamine. Eur J Neurol. 2010;17:364–376. doi:10.1111/j.1468-1331.2009.02900.x
10. Ciurleo R, Di Lorenzo G, Bramanti P, et al. Magnetic resonance spectroscopy: an in vivo molecular imaging biomarker for Parkinson’s disease? Biomed Res Int. 2014;2014:1–10. doi:10.1155/2014/519816
11. Ding S, Li L, Zhou FM. Nigral dopamine loss induces a global upregulation of presynaptic dopamine D1 receptor facilitation of the striatonigral GABAergic output. J Neurophysiol. 2015;113:1697–1711. doi:10.1152/jn.00752.2014
12. Elmaki EEA, Gong T, Nkonika DM, Wang G. Examining alterations in GABA concentrations in the basal ganglia of patients with Parkinson’s disease using MEGA‑PRESS MRS. Jpn J Radiol. 2018;36:194–199. doi:10.1007/s11604-017-0714-z
13. Kish SJ, Rajput A, Gilbert J, et al. Elevated gamma-aminobutyric acid level in striatal but not extrastriatal brain regions in Parkinson’s disease: correlation with striatal dopamine loss. Ann Neurol. 1986;20:26–31. doi:10.1002/ana.410200106
14. Chassain C, Bielicki G, Durand E, et al. Metabolic changes detected by proton magnetic resonance spectroscopy in vivo and in vitro in a murin model of Parkinson’s disease, the MPTP-intoxicated mouse. J Neurochem. 2008;105:874–882. doi:10.1111/j.1471-4159.2007.05185.x
15. Chassain C, Bielicki G, Keller C, et al. Metabolic changes detected in vivo by 1H MRS in the MPTP-intoxicated mouse. NMR Biomed. 2010;23:547–553. doi:10.1002/nbm.1504
16. Dharmadhikari S, Ma R, Yeh CL, et al. Striatal and thalamic GABA level concentrations play differential roles for the modulation of response selection processes by proprioceptive information. Neuroimage. 2015;120:36–42. doi:10.1016/j.neuroimage.2015.06.066
17. Ogura M, Nakao N, Nakai E, et al. The mechanism and effect of chronic electrical stimulation of the globus pallidus for treatment of Parkinson disease. J Neurosurg. 2004;100:997–1001. doi:10.3171/jns.2004.100.6.0997
18. Romuk E, Szczurek W, Nowak P, et al. Effects of propofol on oxidative stress parameters in selected parts of the brain in a rat model of Parkinson disease. Postepy Hig Med Dosw. 2016;70:1441–1450. doi:10.5604/17322693.1227841
19. Romuk E, Szczurek W, Nowak P, et al. Influence of propofol on oxidative-antioxidative system parameters in peripheral organs of rats with Parkinson disease. Postepy Hig Med Dosw. 2015;69:661–667. doi:10.5604/17322693.1156935
20. Yip GM, Chen ZW, Edge CJ, et al. A propofol binding site on mammalian GABAA receptors identified by photolabeling. Nat Chem Biol. 2013;9:715–720. doi:10.1038/nchembio.1340
21. Jayakar SS, Zhou X, Chiara DC, et al. Multiple propofol-binding sites in a gamma-aminobutyric acid type A receptor (GABAAR) identified using a photoreactive propofol analog. J Biol Chem. 2014;289:27456–27468. doi:10.1074/jbc.M114.581728
22. Bai D, Pennefather PS, MacDonald JF, et al. The general anesthetic propofol slows deactivation and desensitization of GABAA receptors. J Neurosci. 1999;19:10635–10646. doi:10.1523/jneurosci.19-24-10635.1999
23. Witkowska M, Karwacki Z, Rzaska M, et al. Comparison of target controlled infusion and total intravenous anaesthesia with propofol and remifentanil for lumbar microdiscectomy. Anaesthesiol Intensive Ther. 2012;44:138–144.
24. Koo BN, Lee JR, Noh GJ, et al. A pharmacodynamic analysis of factors affecting recovery from anesthesia with propofol-remifentanil target controlled infusion. Acta Pharmacol Sin. 2012;33:1080–1084. doi:10.1038/aps.2012.85
25. Yeganeh N, Roshani B, Latifi H, et al. Comparison of target-controlled infusion of sufentanil and remifentanil in blunting hemodynamic response to tracheal intubation. J Inj Violence Res. 2013;5:101–107. doi:10.5249/jivr.v5i2.325
26. Dussaussoy C, Peres M, Jaoul V, et al. Automated titration of propofol and remifentanil decreases the anesthesiologist’s workload during vascular or thoracic surgery: a randomized prospective study. J Clin Monit Comput. 2014;28:35–40. doi:10.1007/s10877-013-9453-6
27. Struys MM, De Smet T, Depoorter B, et al. Comparison of plasma compartment versus two methods for effect compartment-controlled target-controlled infusion for propofol. Anesthesiology. 2000;92:399. doi:10.1097/00000542-200002000-00021
28. Dixon WJ. Staircase bioassay: the up-and-down method. Neurosci Biobehav Rev. 1991;15:47–50. doi:10.1016/s0149-7634(05)80090-9
29. Xu XP, Yu XY, Wu X, et al. Propofol requirement for induction of unconsciousness is reduced in patients with Parkinson’s disease: a case control study. Biomed Res Int. 2015;2015:1–5. doi:10.1155/2015/953729
30. Dixon WJ, Mood AM. A method for obtaining and analyzing sensitivity data. J Am Stat Assoc. 1948;43:109–126. doi:10.1080/01621459.1948.10483254
31. Xuan G, Pinwen W, Honglin Z, et al. Determining hypnotic ED50 and EC50 of propofol and the influence of age in Chinese. J Clin Anesthesiol. 2002;18:7.
32. Pahapill PA, Lozano AM. The pedunculopontine nucleus and Parkinson’s disease. Brain. 2000;123:1767–1783. doi:10.1093/brain/123.9.1767
33. Tanaka Y, Niijima K, Mizuno Y, et al. Changes in gamma-aminobutyrate, glutamate, aspartate, glycine, and taurine contents in the striatum after unilateral nigrostriatal lesions in rats. Exp Neurol. 1986;91:259–268. doi:10.1016/0014-4886(86)90066-x
34. Bergman H, Wichmann T, Karmon B, et al. The primate subthalamic nucleus. II. Neuronal activity in the MPTP model of parkinsonism. J Neurophysiol. 1994;72:507–520. doi:10.1152/jn.1994.72.2.507
35. Chernick DA, Gillings D, Laine H, et al. Validity and reliability of the observer’s assessment of alertness/sedation scale: study with intravenous midazolam. J Clin Psychopharmacol. 1990;10:244.
36. Klopman MA, Sebel PS. Cost-effectiveness of bispectral index monitoring. Curr Opin Anaesthesiol. 2011;24:177–181. doi:10.1097/ACO.0b013e328343eb19
37. Orhon ZN, Devrim S, Celik M, et al. Comparison of recovery profiles of propofol and sevoflurane anesthesia with bispectral index monitoring in percutaneous nephrolithotomy. Korean J Anesthesiol. 2013;64:223. doi:10.4097/kjae.2013.64.3.223
38. Johansen JW. Update on bispectral index monitoring. Best Pract Res Clin Anaesthesiol. 2006;20:81–99. doi:10.1016/j.bpa.2005.08.004
39. Liu J, Singh H, White PF. Electroencephalographic bispectral correlates with intraoperative recall and depth of propofol-induced sedation. Anesth Analg. 1997;84:185–189. doi:10.1097/00000539-199701000-00033
40. Punjasawadwong Y, Phongchiewboon A, Bunchungmongkol N. Bispectral index for improving anaesthetic delivery and postoperative recovery. Cochrane Database Syst Rev. 2014. doi:10.1002/14651858.CD003843.pub3
 © 2023 The Author(s). This work is published and licensed by Dove Medical Press Limited. The full terms of this license are available at https://www.dovepress.com/terms.php and incorporate the Creative Commons Attribution - Non Commercial (unported, v3.0) License.
By accessing the work you hereby accept the Terms. Non-commercial uses of the work are permitted without any further permission from Dove Medical Press Limited, provided the work is properly attributed. For permission for commercial use of this work, please see paragraphs 4.2 and 5 of our Terms.
© 2023 The Author(s). This work is published and licensed by Dove Medical Press Limited. The full terms of this license are available at https://www.dovepress.com/terms.php and incorporate the Creative Commons Attribution - Non Commercial (unported, v3.0) License.
By accessing the work you hereby accept the Terms. Non-commercial uses of the work are permitted without any further permission from Dove Medical Press Limited, provided the work is properly attributed. For permission for commercial use of this work, please see paragraphs 4.2 and 5 of our Terms.