")
Back to Journals » OncoTargets and Therapy » Volume 13
Comparison of Gut Microbiome in Human Colorectal Cancer in Paired Tumor and Adjacent Normal Tissues
Authors Sheng QS , He KX, Li JJ, Zhong ZF, Wang FX, Pan LL , Lin JJ
Received 1 June 2019
Accepted for publication 12 December 2019
Published 21 January 2020 Volume 2020:13 Pages 635—646
DOI https://doi.org/10.2147/OTT.S218004
Checked for plagiarism Yes
Review by Single anonymous peer review
Peer reviewer comments 2
Editor who approved publication: Prof. Dr. Nicola Silvestris
Qin-Song Sheng, 1 Kang-Xin He, 2 Jian-Jiong Li, 3 Zi-Feng Zhong, 1 Fei-Xia Wang, 1 Le-Lin Pan, 1 Jian-Jiang Lin 1
1Department of Colorectal and Anal Surgery, the First Affiliated Hospital of College of Medicine, Zhejiang University, Hangzhou, People’s Republic of China; 2State Key Laboratory for Diagnosis and Treatment of Infectious Diseases, the First Affiliated Hospital of College of Medicine, Zhejiang University, Hangzhou, People’s Republic of China; 3Department of Colorectal and Anal Surgery, the First Affiliated Hospital of College of Medicine, Zhejiang University, Ningbo, People’s Republic of China
Correspondence: Jian-Jiong Li
Department of Colorectal and Anal Surgery, the First Affiliated Hospital of College of Medicine, Zhejiang University, 79 Qingchun Road, Hangzhou 310003, People’s Republic of China
Tel +86 571 8723 6131
Email [email protected]
Background: To understand the biological effect of gut microbiome on the progression of colorectal cancer (CRC), we sequenced the V3-V4 region of the 16S rRNA gene to illustrate the overall structure of microbiota in the CRC patients.
Methods: In this study, a total of 66 CRC patients were dichotomized into different groups based on the following characteristics: paired tumor and adjacent normal tissues, distal and proximal CRC segments, MMR (-) and MMR (+), different TNM staging and clinic tumor staging.
Results: By sequencing and comparing the microbial assemblages, our results indicated that 7 microbe genus (Fusobacterium, Faecalibacterium, Akkermansia, Ruminococcus2, Parabacteroides, Streptococcus, and f_Ruminococcaceae) were significantly different between tumor and adjacent normal tissues; and 5 microbe genus (Bacteroides, Fusobacterium, Faecalibacterium, Parabacteroides, and Ruminococcus2) were significantly different between distal and proximal CRC segments; only 2 microbe genus (f_Enterobacteriaceae and Granulicatella) were significantly different between MMR (-) and MMR (+); but there was no significant microbial difference were detected neither in the TNM staging nor in the clinic tumor staging.
Conclusion: All these findings implied a better understanding of the alteration in the gut microbiome, which may offer new insight into diagnosing and therapying for CRC patients.
Keywords: colorectal cancer, CRC, gut microbiota, 16S rRNA sequencing, TNM staging, MMR
Introduction
Colorectal cancer (CRC) is a considerable prevalent cancer in the world, ranking third in terms of incidence and the second in terms of mortality. In 2018, over 1.8 million new CRC cases and 881,000 deaths in worldwide were predicted to generate. Although the incidence and mortality rates of CRC were decreased by about 3% per year from 2003 to 2012, it is still one of the most life-threatening cancers and advanced CRC remains an incurable disease.1
Diverse gut microbiome plays complex and key roles in numerous diseases. Accumulating evidence indicate that the etiology of CRC is related to the gut microbiota.2 Some bacterial pathogens (e.g., Bacteroides fragilis, Escherichia coli strain NC101) directly promote the progression of CRC.3,4 Enriched Fusobacterium of CRC has an invasive role in colonic epithelial cells.5 Some bacterial metabolites (e.g., butyrate, short-chain fatty acids) may reduce the risk of CRC.6,7 The structural imbalance does exist in the gut microbiome of CRC patients.6 Therefore, better understanding the differential assemblage of gut microbiota will improve the therapy for CRC patients.
Tumour-nodes-metastasis (TNM) staging system provides crucial clinical management for therapy of patients with cancers.8 Despite many molecular features (i.e., cytotoxic CD8/CD45, proteins, p38) being investigated,9–12 few studies identify the features of microbiota aggregates in colorectal cancer. For instance, cyclomodulin-positive pathogenic strains are more prevalent at TNM II/III/IV stages (>64%) than TNM I stage (45%). Comprehensive interpretation of gut microbiota diversity is imperative according to different TNM staging.
DNA mismatch repair (MMR) deficiency (defined as the loss or inadequate of MMR pathway) is one of the best-understood forms of genetic instability in CRC.13 The variation of short-repeated DNA sequences widely existed in most familial colorectal cancers, implying that almost replication errors had occurred during the process of tumor development.14 In some cases, CRC with defective MMR is linked to the alterations of DNA mismatch repair genes through activating β-catenin/TCF signaling.15 However, differences in intestinal microbial diversity in patients with CRC with or without defective MMR still need to be further study.
To better understand the structure alteration of microbiota, in this study, we selected 66 CRC patients and performed high-throughput sequencing of 16S rRNA gene to investigate the overall of microbiota assemblage in paired tumor and adjacent normal tissues (>10 cm from tumor tissues), distal and proximal CRC segments, MMR(-) and MMR(+), different TNM staging and tumor staging.
Materials and Methods
Patients and Sampling
This study was approved by the ethics committee of First Affiliated Hospital of College of Medicine, Zhejiang University (No. 2016–436). All 66 new diagnosed CRC patients (aged 35–94 years, 38 males and 28 females) were sampled consecutively from July to August 2017 from the First Affiliated Hospital of College of Medicine, Zhejiang University in Hangzhou City, China. Written informed consent was obtained from the patients to utilize their tissue samples. The CRC patients were selected based on the following criteria: no complicating diseases (such as chronic bowel disease, diabetes, other signs of infections or hypertension); no family history of CRC or recurrence in CRC patients, no radiotherapy and chemotherapy before the surgical resection; no use of antibiotic, non-steroidal anti-inflammatory drugs (NSAID), statins or probiotics within the past 3 months; and no food allergies. All CRC patients were categorized into a different group based on the histopathological features in the TNM staging system of malignant tumors after surgery. The distal segment includes a distal colon, sigmoid colon, and rectum. The general information (age, gender) and clinical data (including tumor stages, tumor sites, pathological data) were recorded. The clinicopathological classification of 66 CRC patients is shown in Table 1. All paired tumor and adjacent normal tissue samples were dissected and frozen immediately after collection and stored at −80°C until DNA extraction.
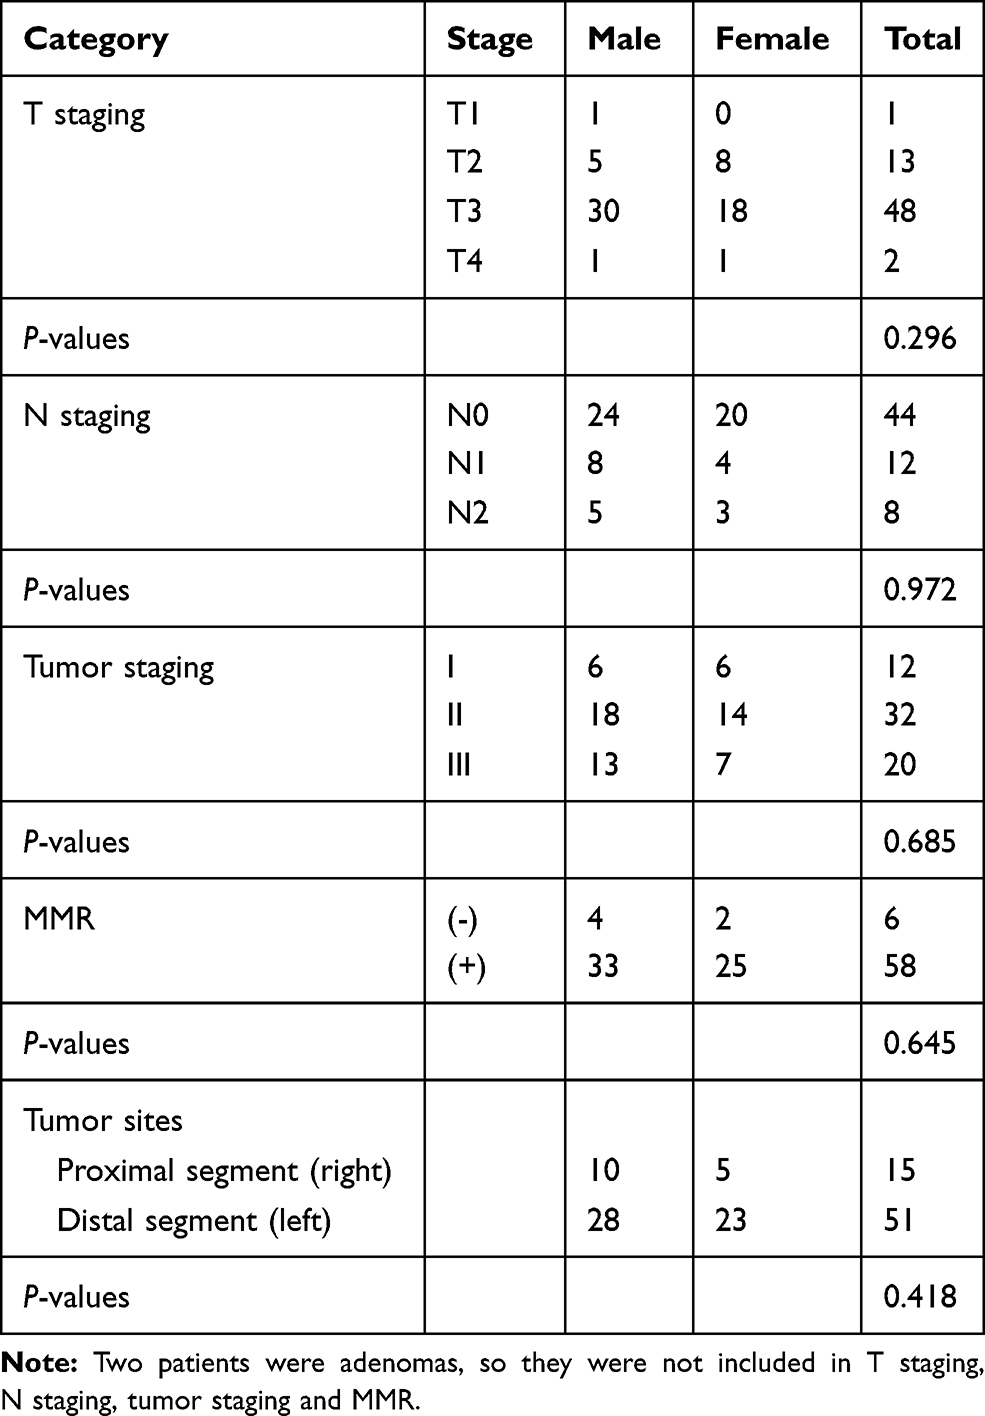 |
Table 1 The Clinicopathological Classification of 66 CRC Patients |
DNA Extraction
Genomic DNA was extracted from each sample (~200 mg) according to the protocol of TIANamp Stool DNA Kit (Tiangen Biotech, Bejing, China). DNA quality and DNA concentration were measured by a NanoDrop. Integrity and size of DNA were measured by 2% (w/v) agarose gel electrophoresis. All DNA samples were stored at −80°C until further processing.
Illumina MiSeq Sequencing
The V3-V4 region of the 16S rRNA gene was amplified using general primers (Forward: 5ʹ-CCTACGGGNGGCWGCAG-3ʹ; Reverse: 5ʹ-GACTACHVGGGTATCTAATCC-3ʹ). The reaction system was performed in a 50 μL volume, including 2×Phanta Max Master Mix 25 μL, Nextera XT Index Primer-F (10 M) 2 μL, Nextera XT Index Primer-R (10 M) 2 μL, template DNA 5 μL, and ddH2O 16 μL. Thermal cycling programs were accomplished after 3-min activation and denaturation at 95°C, followed by 25 cycles at 95°C for 30 s, 55°C for 30 s and 72°C for 45 s. Finally, elongation at 72°C for 5 min. PCR products were purified using MiniE-lute PCR purification kit (AXYGEN) and quantified using the detection system (Light Cycler® 96 Flex Real-time PCR System, Roche, Switzerland). Library construction and sequencing were performed on the Illumina MiSeq PE300 with the paired-end protocol (Jingbai Biotech, Hangzhou, China).
Bioinformatics
All reads were filtered according to the following conditions: the maximum mismatch ratio of overlap was 0.15; the minimum overlap was 10 bp; the average based on the reads tail was lower than 20; the average length was 300–480 bp. To acquire high-quality and more precise bioinformation, we used effective sequences consisting of some point mutation and macromolecular homopolymers through Qiime v1.17 (http://qiime.org/) (Hamady et al, 2008). Operational taxonomic units (OTUs) was classified with Usearch v7.1 (http://drive5.com/uparse/) and OTUs defined at 97% minimum similarity level were used to evaluate the coverage analysis. The taxonomic assignments for each sample were made using the RDP Classifier. The richness and alpha-diversity estimators were analyzed by the mothur software package (Wu et al, 2013). The relative abundance in each sample was performed by unweighted unifrac distance metrics analysis. Principal coordinate analysis (PCoA) illuminated the clustering difference among samples based on the matrix of distance (Lozupone et al, 2011).
Statistical Analyses
To evaluate the differences in the relative abundances at the genus level among different groups, we performed the Mann–Whitney test, Kruskal–Wallis test, and ANOVA using SPSS v22.0 software (SPSS Inc, Chicago, IL, US). Moreover, the False Discovery Rate was used to conduct multiple comparison. All data were shown as mean ± SD, and P-values <0.05 were considered statistically significant.
Results
Abundance and Composition of Microbiota in Paired Tumor and Adjacent Normal Tissues of 66 CRC Patients
In total, 2,326,082 and 2,344,106 high-quality and usable reads, with an average length of 417 bp and 417 bp were obtained from paired tumor and adjacent normal tissues in 66 CRC patients, respectively. The alpha-diversity (Shannon and Simpson index) in paired tumor and adjacent normal tissues of CRC patients was similar (Table 2).
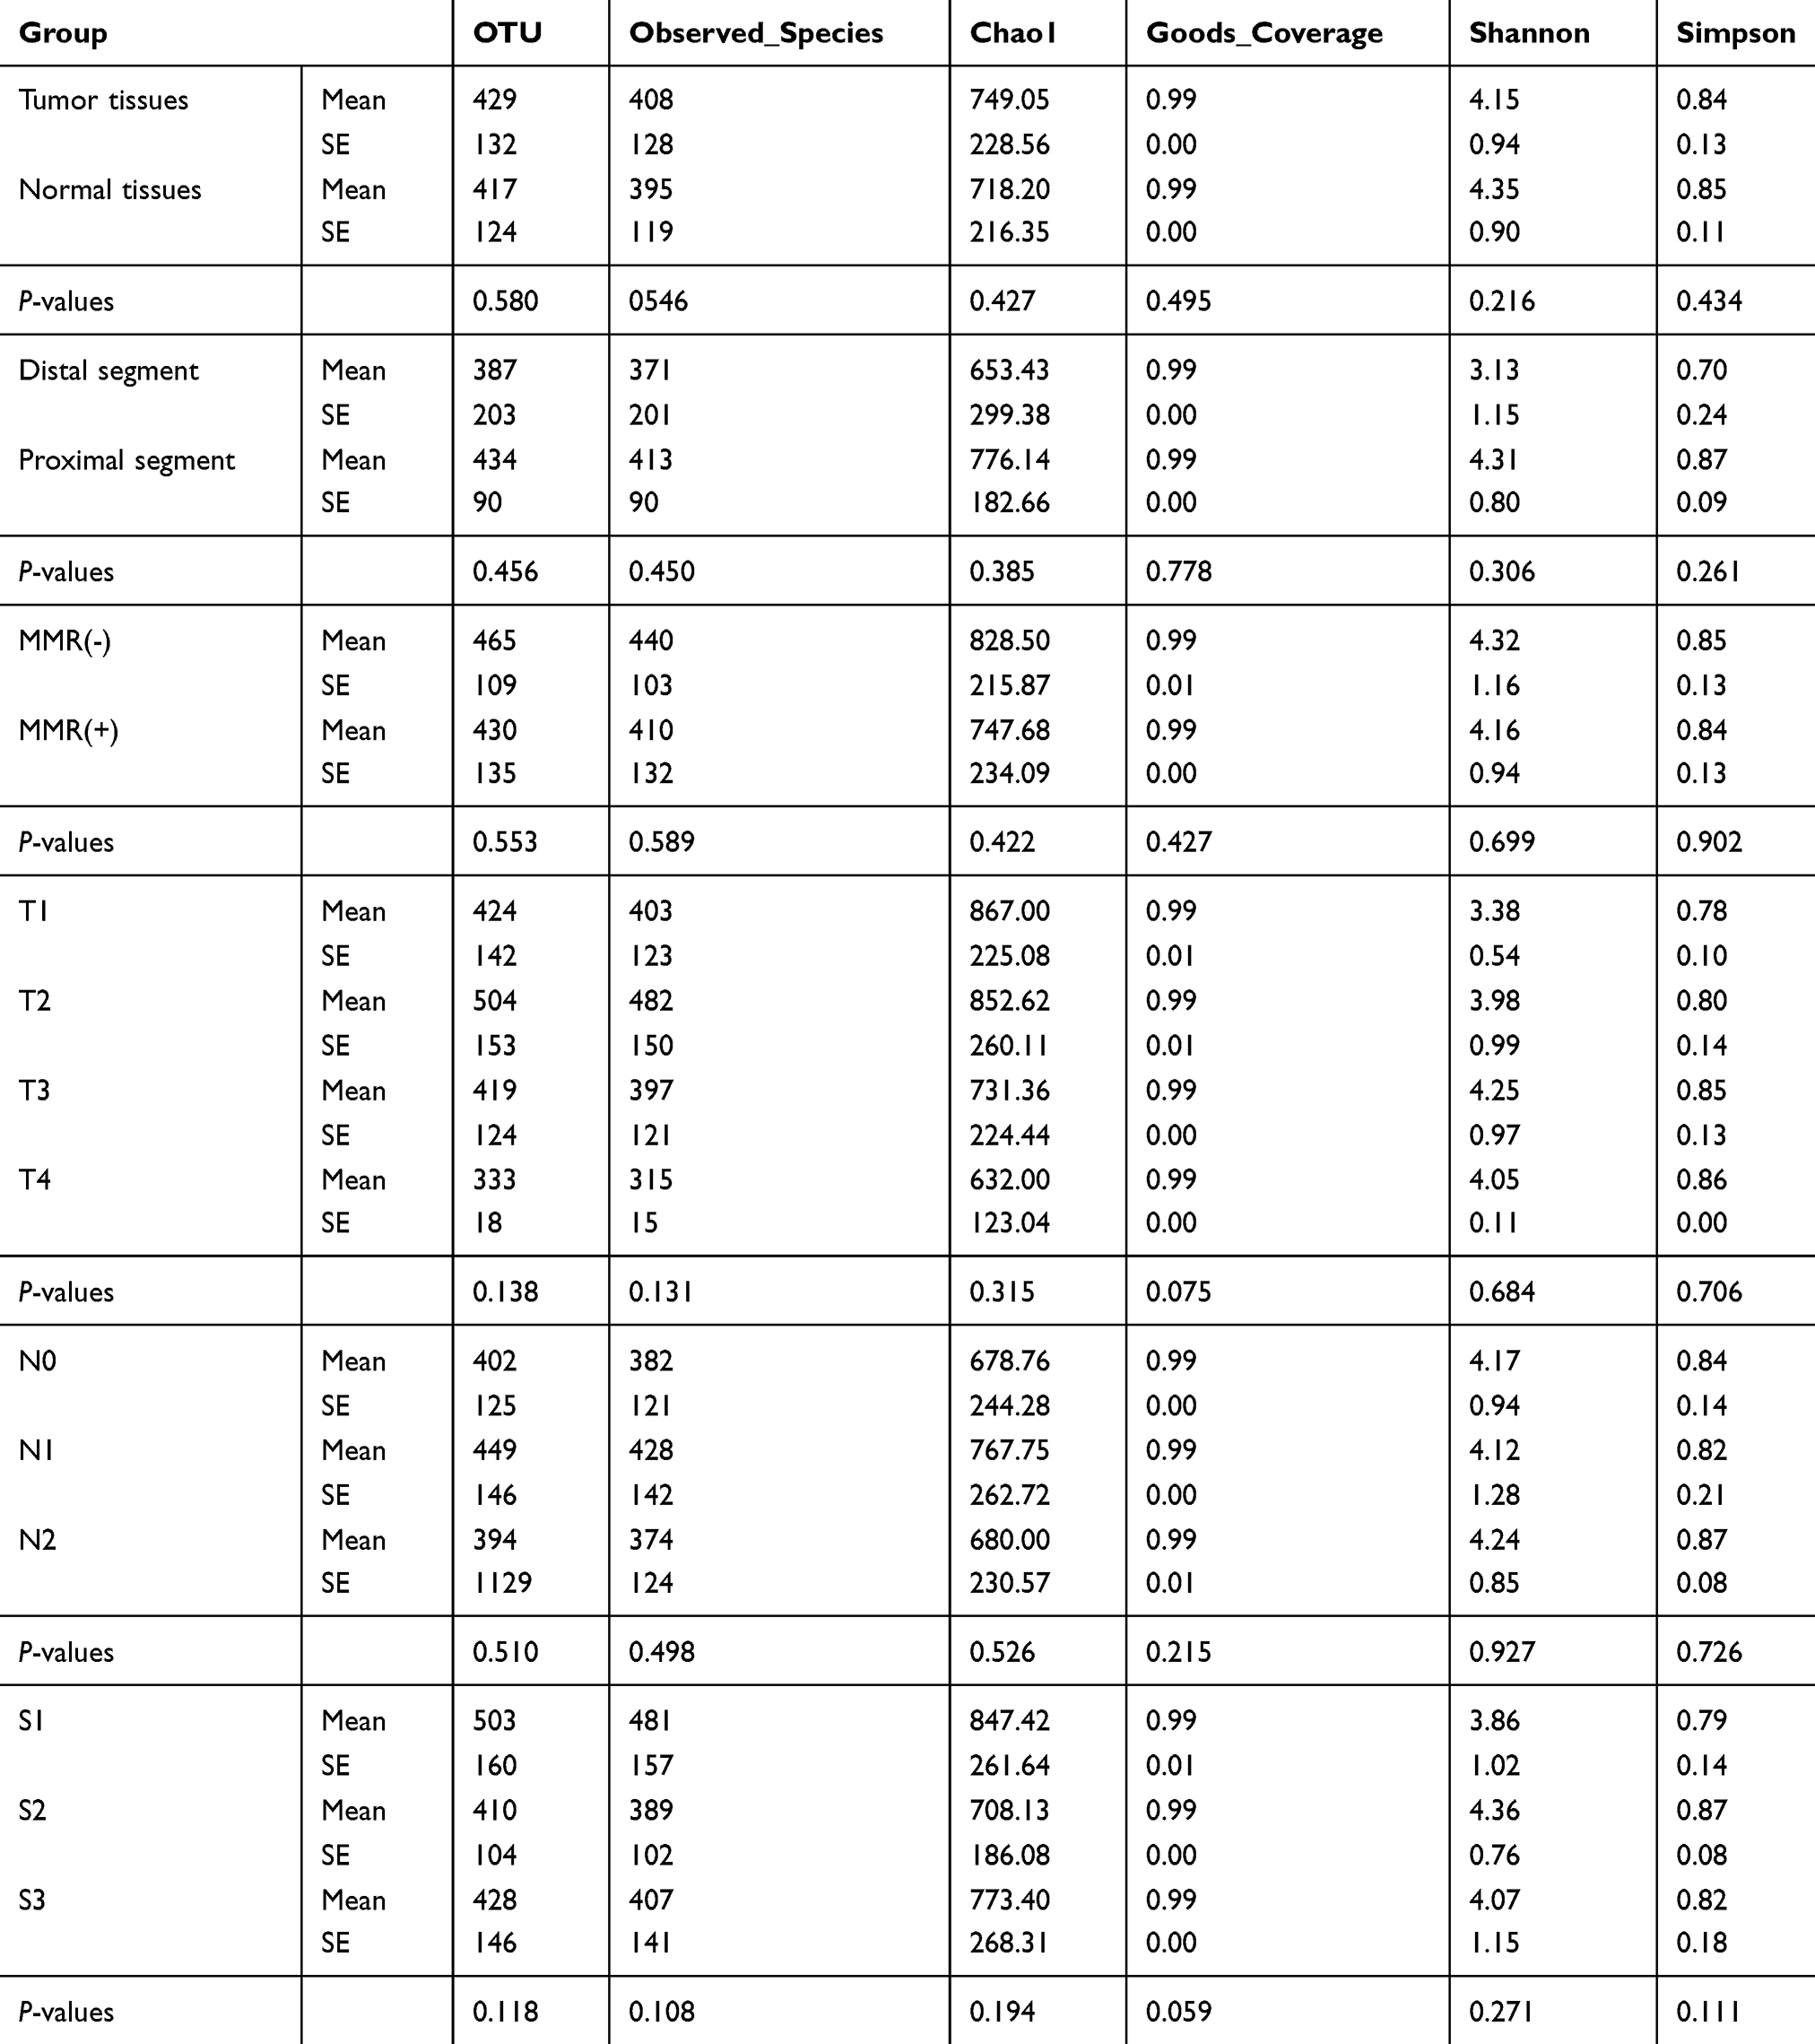 |
Table 2 The Alpha-Diversity in Paired Tumor and Adjacent Normal Tissues of CRC Patients (n=66) |
Relative abundance analysis (Figure 1A) revealed that 7 microbe genus (Fusobacterium, Faecalibacterium, Akkermansia, Ruminococcus2, Parabacteroides, Streptococcus, and f__Ruminococcaceae) were significantly different between paired tumor and adjacent normal tissues of CRC patients (P < 0.05). To compare the overall structure (relative OTUs) of the gut microbiota in all samples, we performed the principal component analysis (PCA), principal coordinate analysis (PCoA) and anosim analysis. The results illustrated that these microbes shared similar diversity between two tissues (Figure 1B–C).
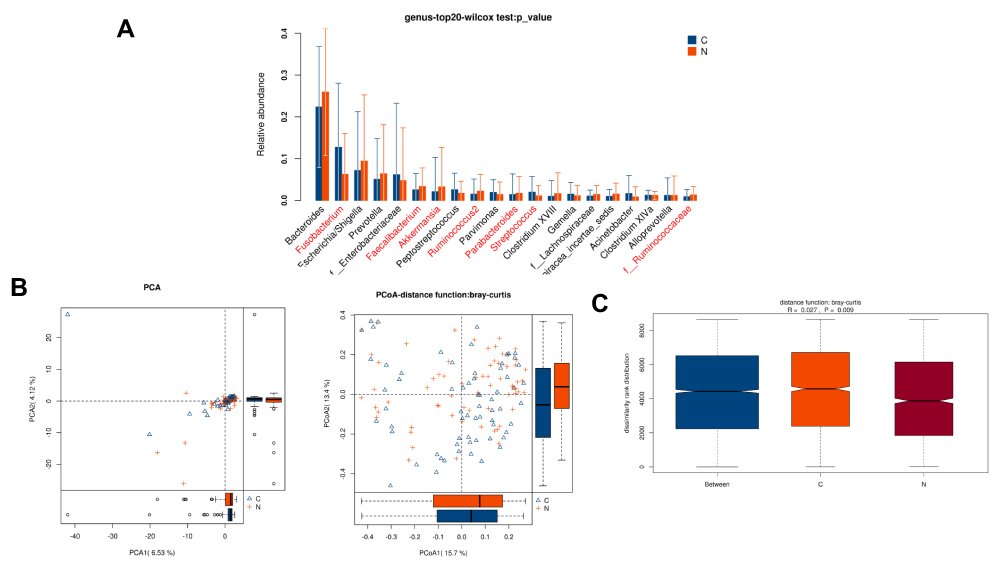 |
Figure 1 Diversity comparison of microbiota assemblage among paired tumor and adjacent normal tissues of 66 CRC patients. (A) Relative abundance in top-20 species between paired tumor and adjacent normal tissues was indicated by Wilcoxon test at the genus level. A significant difference was marked in red font between two groups, P<0.05; (B) PCA and PCoA; (C) Anosim analysis between paired tumor and adjacent normal tissues. Between: the difference between the two segments. C: adjacent normal tissues; N: tumor tissues. |
Further, based on the KEGG database, gene functional classifications of assembled unigenes were shown in Figure 2. The pathways such as ribosome, translation proteins, arginine and proline metabolism, glycine, serine and threonine metabolism, glycerolipid metabolism, sporulation, starch and sucrose metabolism, fructose and mannose metabolism were significantly different between two tissues (P < 0.05).
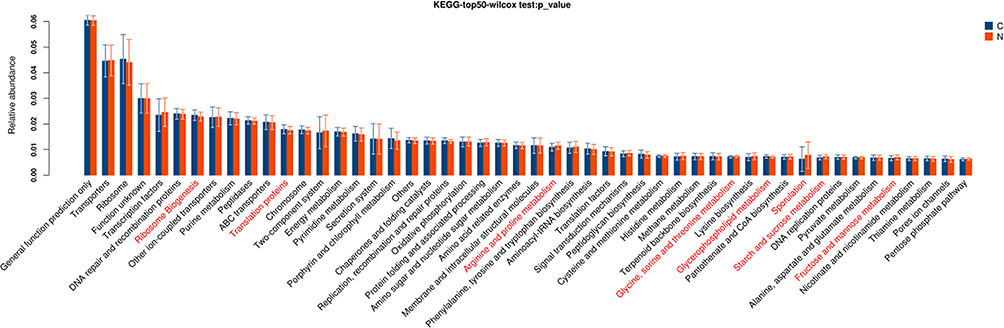 |
Figure 2 Gene functional classifications of assembled unigenes at top-50 were exhibited using the KEGG database. A significant difference was marked in red font between two groups, P<0.05. C: adjacent normal tissues; N: tumor tissues. |
Diversity Comparison Between Proximal and Distal CRC Segment
In total, 489,670 and 247,585 high-quality and usable reads (34,976 ± 737 reads in left vs 35,369 ± 927 reads in right per sample), with an average length of 414 bp and 421 bp, were obtained from 15 proximal segments and 51 distal segments of CRC patients, respectively. No significant differences in Simpson and Shannon index were found between two segments (P>0.05, Table 2). And 5 microbe genus (Bacteroides, Fusobacterium, Faecalibacterium, Parabacteroides, and Ruminococcus2) were significantly different between the two segments (P<0.05, Figure 3A). PCA, PCoA and anoism analysis results revealed a good separation between distal and proximal CRC (Figure 3B–C).
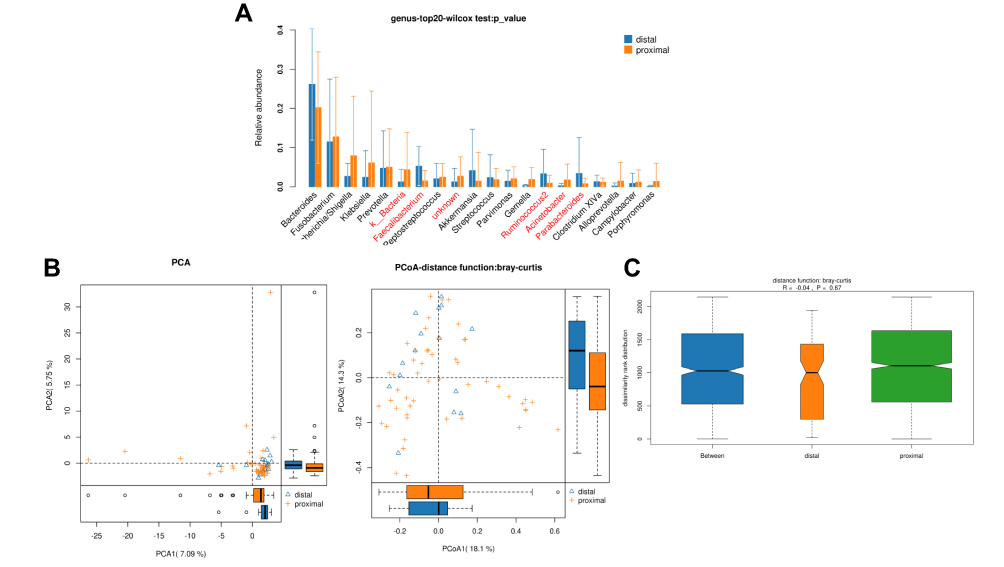 |
Figure 3 Diversity comparison of microbiota assemblage between distal CRC and proximal CRC. (A) Relative abundance in top-20 species between two segments was indicated by Wilcoxon test at the genus level. A significant difference was marked in red font between two segments, P<0.05; (B) PCA and PCoA; (C) Anosim analysis was performed between two segments. Between: the difference between the two segments. |
These pathways were significantly different between two segments (P<0.05, Figure 4), including porphyrin and chlorophyll metabolism, secretion system, chaperones and folding catalysts, amino sugar and nucleotide sugar metabolism, membrane and intracellular structural molecules, arginine and proline metabolism, phenylalanine, tyrosine and tryptophan biosynthesis, sporulation, cysteine and methionine metabolism, histidine metabolism, methane metabolism, lysine biosynthesis, pantothenate and CoA biosynthesis, starch and sucrose metabolism, pyruvate metabolism, fructose and mannose metabolism, alanine, aspartate and glutamate metabolism, thiamine metabolism, pentose phosphate pathway, pores ion channels.
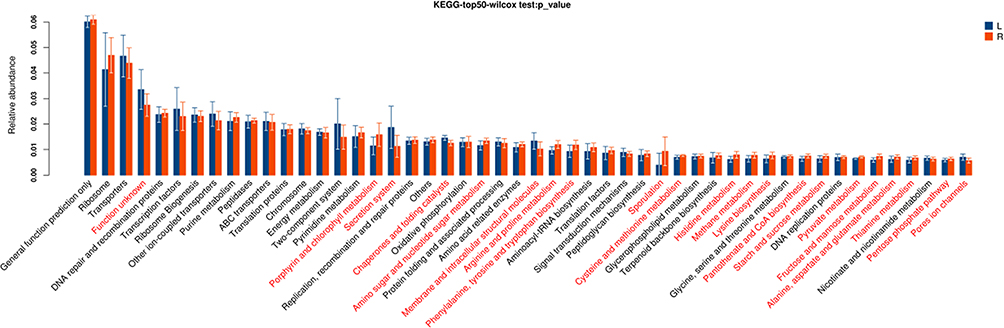 |
Figure 4 Gene functional classifications of assembled unigenes at top-50 were exhibited using the KEGG database. A significant difference was marked in red font between two segments, P<0.05. L: distal-CRC; R: proximal-CRC. |
Diversity Comparison Between CRC Patients with MMR(-) and MMR(+)
n total, 208,915 and 2,018,193 high-quality and usable reads (34,819 ± 1542 vs 35,407 ± 1171 reads per sample), with an average length of 414 bp and 417 bp, were obtained from 6 patients with MMR(-) and 58 patients with MMR(+), respectively. No significant difference in alpha-diversity between patients with MMR(-) and MMR(+) (P>0.05, Table 2). Only 2 microbe genus (f_Enterobacteriaceae and Granulicatella) were significantly different between patients with MMR(-) and MMR(+) (P<0.05, Figure 5A). PCA, PCoA and anoism analysis results illustrated that these microbial communities shared similar diversity between patients with MMR(-) and MMR(+) (Figure 5B–C).
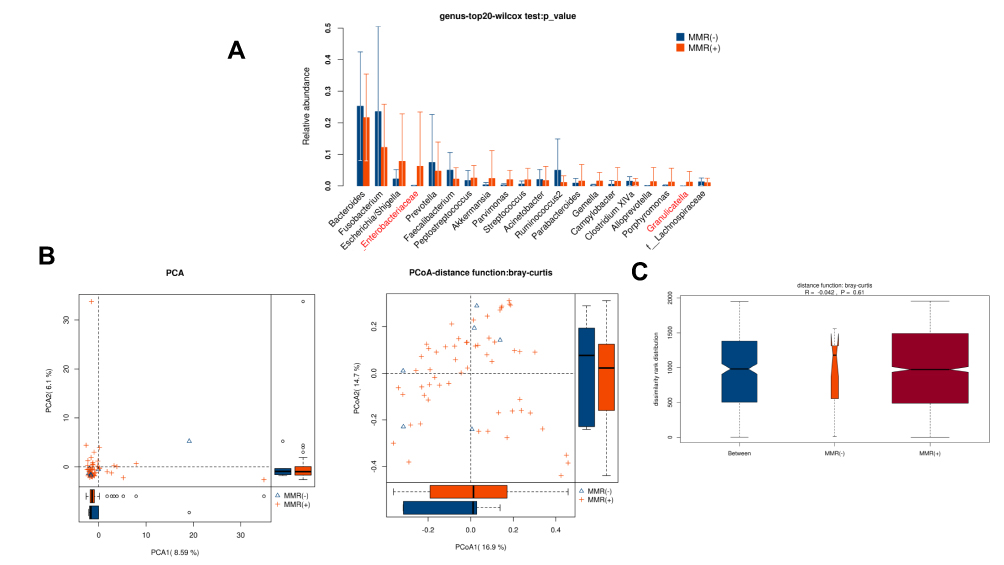 |
Figure 5 Diversity comparison of microbiota assemblage between CRC patients with MMR(-) and MMR(+). (A) Relative abundance in top-20 species between MMR(-) and MMR(+) was indicated by the Wilcoxon test at the genus level. A significant difference was marked in red font between two groups, P<0.05; (B) PCA and PCoA; (C) Anosim analysis was performed between MMR(-) and MMR(+). Between: the difference between the two segments. |
These pathways were significantly different between patients with MMR(-) and MMR(+), including two-component system, porphyrin and chlorophyll metabolism, protein folding and associated processing, amino sugar and nucleotide sugar metabolism, phenylalanine, tyrosine and tryptophan biosynthesis, signal transduction mechanisms, cysteine and methionine metabolism (P<0.05, Figure 6).
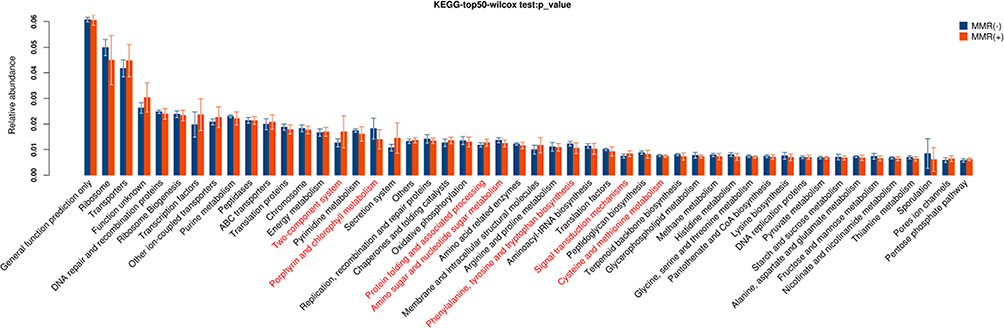 |
Figure 6 Gene functional classifications of assembled unigenes at top-50 were exhibited using the KEGG database. A significant difference was marked in red font between patients with MMR(-) and MMR(+), P<0.05. |
Diversity Comparison Among CRC Patients with Different TNM Staging
There was no obvious difference in alpha-diversity among CRC patients with different TNM staging (Table 2). Although the percentages of species among TNM staging were different, relative abundance in top-20 species was not significantly different in TNM staging (Figure 7A, Figure 8A), with sharing similar diversity (Figure 7B and C; Figure 8B and C).
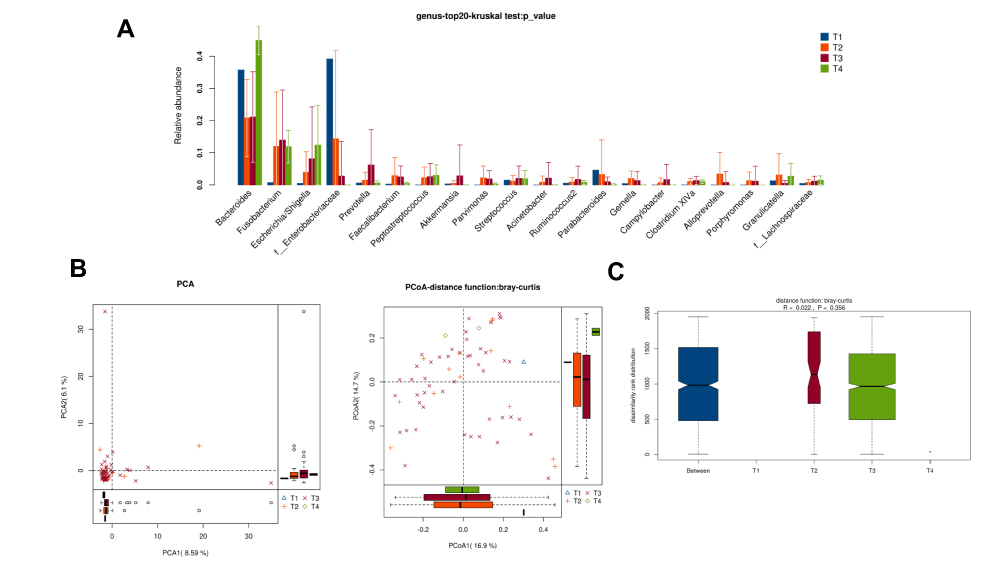 |
Figure 7 Diversity comparison of microbiota assemblage among CRC patients with T1, T2, T3, and T4 staging. (A) Relative abundance in top-20 species among CRC patients with T1, T2, T3, and T4 staging was indicated by Wilcoxon test at the genus level; (B) PCA and PCoA; (C) Anosim analysis was performed among CRC patients with T1, T2, T3, and T4 staging. Between: the difference between the two segments. |
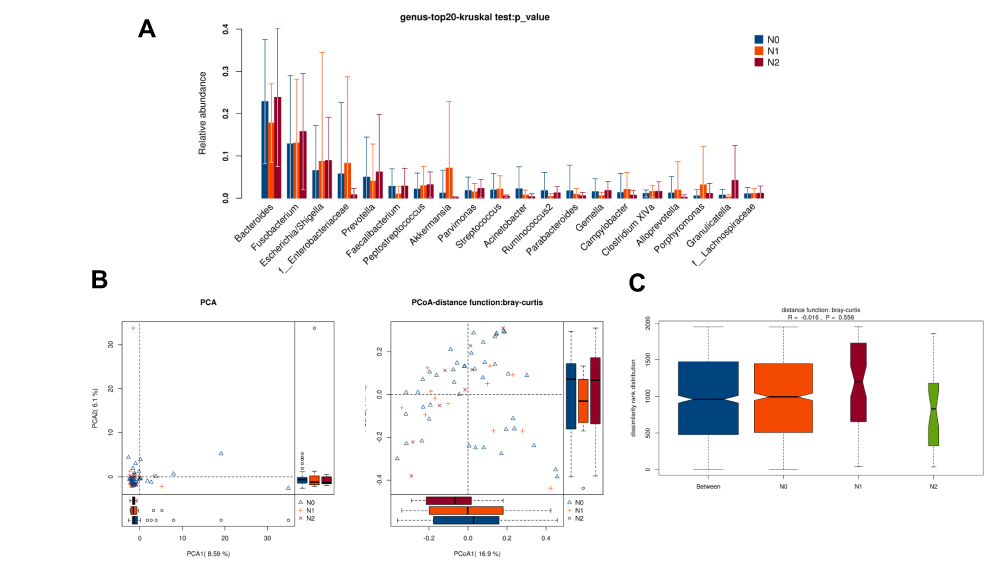 |
Figure 8 Diversity comparison of microbiota assemblage among CRC patients with N0, N1 and N2 staging. (A) Relative abundance in top-20 species among CRC patients with N0, N1 and N2 staging was indicated by Wilcoxon test at the genus level; (B) PCA and PCoA; (C) Anosim analysis was performed among CRC patients with N0, N1 and N2 staging. Between: the difference between the two segments. |
Diversity Comparison Among CRC Patients with Different Staging
There was no obvious difference in alpha-diversity and relative abundance among CRC patients with staging I, II and III were different (Table 2, Figure 9).
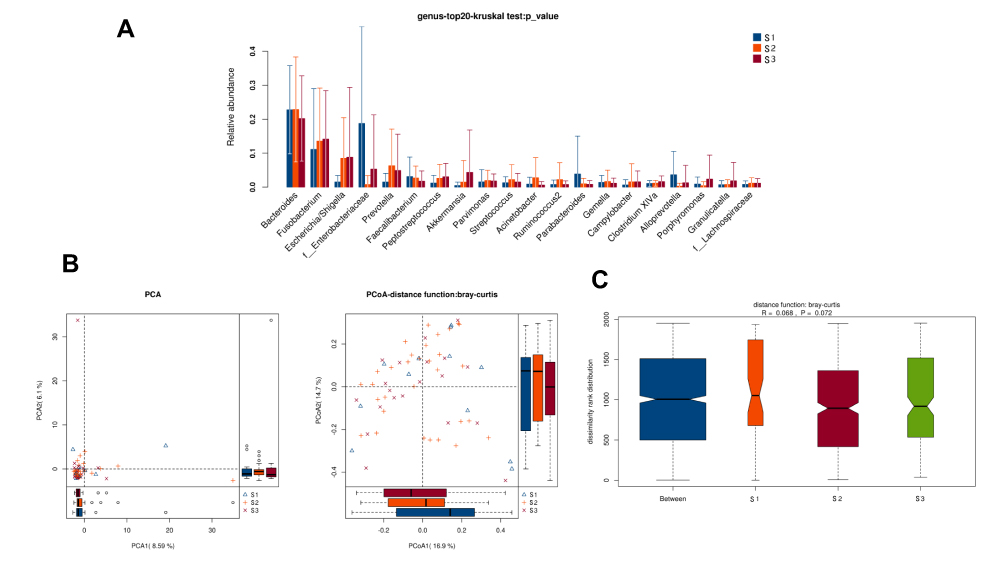 |
Figure 9 Diversity comparison of microbiota assemblage among CRC patients with S1, S2, and S3 staging. (A) Relative abundance in top-20 species among CRC patients with S1, S2, and S3 staging was indicated by Wilcoxon test at the genus level; (B) PCA and PCoA; (C) Anosim analysis was performed among CRC patients with S1, S2, and S3 staging. Between: the difference between the two segments. |
However, these pathways were significantly different among CRC patients with staging I, II and III (P<0.05, Figure 10), including phenylalanine, tyrosine and tryptophan biosynthesis, cysteine and methionine metabolism, lysine biosynthesis, sporulation.
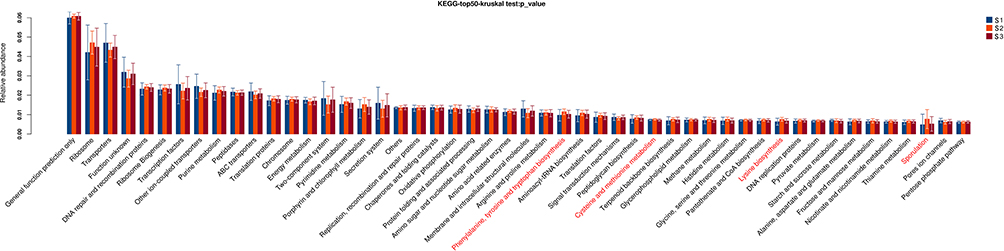 |
Figure 10 Gene functional classifications of assembled unigenes at top-50 were exhibited using the KEGG database. A significant difference was marked in red font among CRC patients with staging I, II and III, P<0.05. |
Discussion
The incidence of colorectal cancer is generally associated with genetic factors, environmental factors, eating habits, and lifestyle. Over the last few decades, an increasing body of studies has indicated the assemblage of gut microbiota influences the formation and progression of CRC.16–19 However, few studies focus on the difference of gut microbiome in paired tumor and adjacent normal tissues of CRC patients. In this study, we used 16S rRNA sequencing to show the profile of the gut microbiome in Chinese CRC patients. All the results indicated specific microbiota features of a Chinese population only. First, 7 microbe genus (Fusobacterium, Faecalibacterium, Akkermansia, Ruminococcus2, Parabacteroides, Streptococcus, and f_Ruminococcaceae) were significant differences between the paired tumor and adjacent normal tissues of CRC patients. Our previous study indicated that 5 dominant fecal genus (Escherichia/Shigella, Bacteroides, Faecalibacterium, Prevotella, and Akkermansia) were different between CRC patients and healthy controls. The Prevotella, Peptostreptococcus, and other opportunistic bacteria were enriched at the cancer sites.20,21 Previous studies have investigated that the presence of fecal Bacteroidaceae, Fusobacteriaceae (i.e., Fusobacterium), Peptostreptococcaceae and Porphyromonas was relatively abundant in CRC patients.22 Hypothetically, tumor tissues and adjacent normal tissues exhibit a better correlation between microbial genus and CRC risk, compared with fecal samples. The variation of microbiota assemblage between tumor and adjacent normal tissues would provide new perspective insight to better understand the processing mechanism and therapying of CRC.
Next, the genus Bacteroides, Fusobacterium, Faecalibacterium, Parabacteroides, and Ruminococcus2 were obviously different between the proximal and distal segments of CRC. The different sensitivities between proximal and distal segments of CRC might be attributable to functional differentiation. The proximal (right) and distal (left) colon were respectively obtained from midgut and hindgut and play various roles in embryologic, morphologic, physiologic and biochemical aspects.23 The previous study illustrated that mucosal immune cells in the proximal colon have higher immunogenicity than that in the distal colon; however, the distal colorectum with a high concentration of microbiota requires immune cells to promote immune tolerance.24 Therefore, proximal tumors appear to be more genetically stable and distal tumors have greater genetic instability.25 Moreover, the proximal colon provides the maximum carbohydrate availability, resulting in the highest levels of fermentation, bacterial proliferation and the emergence of the probiotics. However, some pathogenic genus (e.g., Fusobacterium) were increasingly grew in CRC patients. Invasive polymicrobial bacterial biofilms nearly universally (89%) distribute on right-sided tumors.26 These evidences implied that microbiome alternation in proximal segment may be associated with the development of cancer.
Some function cellular pathways and amino acid metabolism were estimated to differ between the proximal and distal segments of CRC. The intestinal microbiota interacts extensively with the host via metabolic exchange and co-metabolism of the substrate to maintain normal function.27 While we have no more experimental evidence that the change in microbiota assemblage between paired tumor and adjacent normal tissues of CRC patients or between proximal and distal CRC segments would directly impact the functional activity of colon to enhance the process of CRC. Based on the metabolomics and metabolic pathway networks from human CRC, adjacent mucosa, and stool, metabolic pathways were conserved.28 But it was limited for linkage between CRC and adjacent mucosa. Pentose phosphate pathway plays a key role in metabolism and could approach saturation with respect to intracellular glucose in a tumor cell. Some studies have indicated that several signal pathways, such as WNT/β-catenin signal pathway, TGF-β signal transduction pathway, RAS/RAF signaling pathway and MAPK signaling pathways, involved the regulation of CRC.29–32 Further, we need to investigate the relationship between microbiota and signal transduction pathway and how to up- or down-regulate these crucial signal pathways.
MMR system involving in post-replication repair, MMR proteins, and several other functional proteins, which is a very complex system in regulating the CRC process.33 Cancer risk associated with germline DNA mismatch repair was 91% for males and 69% for females whose risk to age 70, and it was significantly greater for males than for females.34 In our study, even though the microbial richness and alpha diversity showed no significant difference, the genus f_Enterobacteriaceae and Granulicatella were significantly different between patients with MMR(-) and MMR(+). The abundance of Granulicatella adiacens in saliva involved in the processes of chronic pancreatitis and pancreatic cancer.3 However, these potentially pathogenic members of the genus f_Enterobacteriaceae and Granulicatella were underrepresented in CRC tissue due to the sample size. Also, some metabolism processes were clearly different between the two groups. DNA MMR maintaining genomic integrity plays a critical role in cell growth and apoptosis. To execute cell death, MMR proteins stimulate a signaling cascade for apoptosis, in turn, activated p53 and p73 transmit the signal to the apoptotic machinery.35 However, the mechanism of gut microbiota associated with MMR or regulated MMR-related protein or other functional molecular is still undefined.
There was no significant effect in microbial richness and alpha diversity among TNM staging. Only pathways phenylalanine, tyrosine and tryptophan biosynthesis, cysteine and methionine metabolism, lysine biosynthesis, and sporulation were significantly different among CRC patients with staging I, II and III. The probable reason is limiting the number of samples. A similar result that no significant link was observed with TNM staging was also illustrated by Sobhani.36 However, Wu et al37 found that Bacteroides-related OTUs in CRC were higher than that in the control of fecal samples, with a positive correlation between Bacteroides prevalence and CRC disease status (TNM classification). We assume that the microbiota assemblage probably relies on dysbiosis dependent, although the initial assembly is consistent. Next, we will expand the sample size and further study mechanism whether the gut microbiome was similar among TNM staging, and which force (endogenous force or exogenous force) to generate this pattern.
Conclusion
In conclusion, this study investigated the overall structure pattern of microbiota assemblage in paired tumor and adjacent normal tissues, proximal and distal segment, MMR(-) and MMR(+), different TNM staging and tumor staging of CRC patients. Our results indicated the correlation between the gut microbiome and different clinic states of CRC patients, which may hopefully develop the therapying for CRC.
Data Sharing Statement
The data used to support the finding of this study are available from the corresponding author upon request.
Acknowledgment
This work was supported by Natural Science Foundation of Zhejiang Province (No. LY18H160018), and Medical and Health Science and Technology Project of Zhejiang Province (No. 2017KY360).
Author Contributions
Sheng QS drafted the manuscript. Sheng QS, Lin JJ and Li JJ carried out the studies, participated in collecting data. Wang FX and He KX performed the statistical analysis and helped to draft the manuscript. Zhong ZF and Pan LL participated in its design. All authors contributed to data analysis, drafting or revising the article, gave final approval of the version to be published, and agree to be accountable for all aspects of the work.
Disclosure
The authors report no conflicts of interest in this work.
References
1. Meyerhardt JA, Mayer RJ. Systemic therapy for colorectal cancer. N Engl J Med. 2005;352:476–487. doi:10.1056/NEJMra040958
2. Louis P, Hold GL, Flint HJ. The gut microbiota, bacterial metabolites and colorectal cancer. Nat Rev Microbiol. 2014;12(10):661–672. doi:10.1038/nrmicro3344
3. Wu S, Rhee KJ, Albesiano E, et al. A human colonic commensal promotes colon tumorigenesis via activation of T helper type 17 T cell responses. Nat Med. 2009;15(9):1016–1022. doi:10.1038/nm.2015
4. Sears CL. Enterotoxigenic Bacteroides fragilis: a rogue among symbiotes. Clin Microbiol Rev. 2009;22(2):349–369,. doi:10.1128/CMR.00053-08.
5. Kostic AD, Gevers D, Pedamallu CS, et al. Genomic analysis identifies association of Fusobacterium with colorectal carcinoma. Genome Res. 2012;22(2):292–298. doi:10.1101/gr.126573.111
6. Wang T, Cai G, Qiu Y, et al. Structural segregation of gut microbiota between colorectal cancer patients and healthy volunteers. ISME J. 2012;6(2):320–329. doi:10.1038/ismej.2011.109
7. Scharlau D, Borowicki A, Habermann N, et al. Mechanisms of primary cancer prevention by butyrate and other products formed during gut flora-mediated fermentation of dietary fibre. Mutat Res. 2009;682(1):39–53. doi:10.1016/j.mrrev.2009.04.001
8. Quirke P, Williams GT, Ectors N, Ensari A, Piard F, Nagtegaal I. The future of the TNM staging system in colorectal cancer: time for a debate? Lancet Oncol. 2007;8(7):651–657. doi:10.1016/S1470-2045(07)70205-X
9. Fan XJ, Wan XB, Fu XH, et al. Phosphorylated p38, a negative prognostic biomarker, complements TNM staging prognostication in colorectal cancer. Tumour Biol. 2014;35(10):10487–10495. doi:10.1007/s13277-014-2320-3
10. Hu B, Ren D, Su D, et al. Expression of the phosphorylated MEK5 protein is associated with TNM staging of colorectal cancer. BMC Cancer. 2012;12:127. doi:10.1186/1471-2407-12-127
11. Wang Y, Sun J, Gao W, et al. Preoperative Tim3 expression on peripheral NK cells is correlated with pathologic TNM staging in colorectal cancer. Mol Med Rep. 2017;15(6):3810–3818. doi:10.3892/mmr.2017.6482
12. Broussard EK, Disis ML. TNM staging in colorectal cancer: T is for T cell and M is for memory. J Clin Oncol. 2011;29(6):601–603. doi:10.1200/JCO.2010.32.9078
13. Poulogiannis G, Frayling IM, Arends MJ. DNA mismatch repair deficiency in sporadic colorectal cancer and Lynch syndrome. Histopathology. 2010;56(2):167–179. doi:10.1111/j.1365-2559.2009.03392.x
14. Aaltonen LA, Peltomaki P, Leach FS, et al. Clues to the pathogenesis of familial colorectal cancer. Science. 1993;260(5109):812–816. doi:10.1126/science.8484121
15. Liu W, Dong X, Mai M, et al. Mutations in AXIN2 cause colorectal cancer with defective mismatch repair by activating beta-catenin/TCF signalling. Nat Genet. 2000;26:146–147. doi:10.1038/79859
16. Garcia-Castillo V, Sanhueza E, McNerney E, Onate SA, Garcia A. Microbiota dysbiosis: a new piece in the understanding of the carcinogenesis puzzle. J Med Microbiol. 2016;65(12):1347–1362. doi:10.1099/jmm.0.000371
17. Geng J, Fan H, Tang X, Zhai H, Zhang Z. Diversified pattern of the human colorectal cancer microbiome. Gut Pathog. 2013;5(1):2. doi:10.1186/1757-4749-5-2
18. Guthrie L, Gupta S, Daily J, Kelly L. Human microbiome signatures of differential colorectal cancer drug metabolism. NPJ Biofilms Microbiomes. 2017;3:27. doi:10.1038/s41522-017-0034-1
19. Rajagopala SV, Vashee S, Oldfield LM, et al. The human microbiome and cancer. Cancer Prev Res (Phila). 2017;10(4):226–234. doi:10.1158/1940-6207.CAPR-16-0249
20. Chen W, Liu F, Ling Z, Tong X, Xiang C, Moschetta A. Human intestinal lumen and mucosa-associated microbiota in patients with colorectal cancer. PLoS One. 2012;7(6):e39743. doi:10.1371/journal.pone.0039743
21. Gao R, Kong C, Huang L, et al. Mucosa-associated microbiota signature in colorectal cancer. Eur J Clin Microbiol Infect Dis. 2017;36(11):2073–2083. doi:10.1007/s10096-017-3026-4
22. Vogtmann E, Hua X, Zeller G, et al. Colorectal cancer and the human gut microbiome: reproducibility with whole-genome shotgun sequencing. PLoS One. 2016;11(5):e0155362. doi:10.1371/journal.pone.0155362
23. Iacopetta B. Are there two sides to colorectal cancer? Int J Cancer. 2002;101(5):403–408. doi:10.1002/ijc.10635
24. Lee G, Malietzis G, Askari A, Bernardo D, Al-Hassi H, Clark S. Is right-sided colon cancer different to left-sided colorectal cancer?–a systematic review. Eur J Surg Oncol. 2015;41(3):300–308. doi:10.1016/j.ejso.2014.11.001
25. Bufill JA. Colorectal cancer: evidence for distinct genetic categories based on proximal or distal tumor location. Ann Intern Med. 1990;113(10):779–788. doi:10.7326/0003-4819-113-10-779
26. Dejea CM, Wick EC, Hechenbleikner EM, et al. Microbiota organization is a distinct feature of proximal colorectal cancers. Proc Natl Acad Sci U S A. 2014;111(51):18321–18326. doi:10.1073/pnas.1406199111
27. Nicholson JK, Holmes E, Wilson ID. Gut microorganisms, mammalian metabolism and personalized health care. Nat Rev Microbiol. 2005;3:431–438. doi:10.1038/nrmicro1152
28. Brown DG, Rao S, Weir TL, et al. Metabolomics and metabolic pathway networks from human colorectal cancers, adjacent mucosa, and stool. Cancer Metab. 2016;4:11. doi:10.1186/s40170-016-0151-y
29. Suzuki H, Watkins DN, Jair KW, et al. Epigenetic inactivation of SFRP genes allows constitutive WNT signaling in colorectal cancer. Nat Genet. 2004;36:417–422. doi:10.1038/ng1330
30. Fodde R, Smits R, Clevers H. APC, signal transduction and genetic instability in colorectal cancer. Nat Rev Cancer. 2001;1:55–67. doi:10.1038/35094067
31. Benvenuti S, Sartore-Bianchi A, Di Nicolantonio F, et al. Oncogenic activation of the RAS/RAF signaling pathway impairs the response of metastatic colorectal cancers to anti-epidermal growth factor receptor antibody therapies. Cancer Res. 2007;67:2643–2648. doi:10.1158/0008-5472.CAN-06-4158
32. Fang JY, Richardson BC. The MAPK signalling pathways and colorectal cancer. Lancet Oncol. 2005;6:322–327. doi:10.1016/S1470-2045(05)70168-6
33. Peltomaki P. Deficient DNA mismatch repair: a common etiologic factor for colon cancer. Hum Mol Genet. 2001;10:735–740. doi:10.1093/hmg/10.7.735
34. Dunlop MG, Farrington SM, Carothers AD, et al. Cancer risk associated with germline DNA mismatch repair gene mutations. Hum Mol Genet. 1997;6:105–110. doi:10.1093/hmg/6.1.105
35. Li GM. The role of mismatch repair in DNA damage-induced apoptosis. Oncol Res. 1999;11:393–400.
36. Sobhani I, Ghozelane A, Bergsten EB, Kennedy S. Microbiota as a new indicator of colorectal cancer (CRC) heterogeneity. Am Soci Clin Oncol. 2017;35:3615. doi:10.1200/JCO.2017.35.15_suppl.3615
37. Wu N, Yang X, Zhang R, et al. Dysbiosis signature of fecal microbiota in colorectal cancer patients. Microb Ecol. 2013;66(2):462–470. doi:10.1007/s00248-013-0245-9
 © 2020 The Author(s). This work is published and licensed by Dove Medical Press Limited. The full terms of this license are available at https://www.dovepress.com/terms.php and incorporate the Creative Commons Attribution - Non Commercial (unported, v3.0) License.
By accessing the work you hereby accept the Terms. Non-commercial uses of the work are permitted without any further permission from Dove Medical Press Limited, provided the work is properly attributed. For permission for commercial use of this work, please see paragraphs 4.2 and 5 of our Terms.
© 2020 The Author(s). This work is published and licensed by Dove Medical Press Limited. The full terms of this license are available at https://www.dovepress.com/terms.php and incorporate the Creative Commons Attribution - Non Commercial (unported, v3.0) License.
By accessing the work you hereby accept the Terms. Non-commercial uses of the work are permitted without any further permission from Dove Medical Press Limited, provided the work is properly attributed. For permission for commercial use of this work, please see paragraphs 4.2 and 5 of our Terms.