")
Back to Journals » Veterinary Medicine: Research and Reports » Volume 10
Comparison Of Four Anti-Avian IgY Secondary Antibodies Used In Western Blot And Dot-Blot ELISA To Detect Avian Bornavirus Antibodies In Four Different Bird Species
Authors Escandon P, Heatley JJ , Berghman LR, Tizard I , Musser JMB
Received 17 August 2019
Accepted for publication 24 October 2019
Published 12 November 2019 Volume 2019:10 Pages 141—150
DOI https://doi.org/10.2147/VMRR.S227616
Checked for plagiarism Yes
Review by Single anonymous peer review
Peer reviewer comments 2
Editor who approved publication: Professor Young Lyoo
Paulina Escandon,1,2 J Jill Heatley,1,3 Luc R Berghman,2,4 Ian Tizard,1,2 Jeffrey MB Musser1,2
1Schubot Exotic Bird Health Center, College of Veterinary Medicine, Texas A&M University, College Station, TX 77843, USA; 2Department of Veterinary Pathobiology, College of Veterinary Medicine, Texas A&M University, College Station, TX 77843, USA; 3Department of Small Animal Clinical Sciences, College of Veterinary Medicine, Texas A&M University, College Station, TX 77843, USA; 4Department of Poultry Science, College of Agriculture & Life Sciences, Texas A&M University, College Station, TX 77843, USA
Correspondence: Jeffrey MB Musser
4467 TAMU, VTPB, College of Veterinary Medicine, College Station, TX 77843-4467, USA
Tel +1 979 458 9946
Fax +1 979 458 0321
Email [email protected]
Purpose: This study evaluated the specificity of different avian secondary antibodies used in Western blot and dot-blot ELISA to detect avian bornavirus antibodies in bird plasma.
Methods: Plasma samples were collected from: two Blue and gold macaws, one positive and one negative for avian bornavirus by RT-PCR; a Cockatiel and a Monk parakeet prior to and following experimental infection; and, two Mallards, one positive and one negative for avian bornavirus by RT-PCR Samples were analyzed by Western blot and dot-blot ELISA that incorporated recombinant avian bornavirus nucleoprotein as the target analyte. Four species-specific anti-IgY secondary antibodies were used in the assays: goat anti-macaw IgY, goat anti-bird IgY, goat anti-duck IgY, and rabbit anti-chicken IgY.
Results: In the Western blot, anti-macaw IgY secondary antibody produced strong signals with Blue and gold macaw and Cockatiel positive plasma, but no signal with Mallard positive plasma. Anti-bird IgY secondary antibody produced strong signals with Blue and gold macaw, Cockatiel, and Mallard positive plasma. Anti-duck and anti-chicken IgY secondary antibody produced a strong and moderate signal, respectively, only with Mallard positive plasma. In the dot-blot ELISA, there was a distinct and significant difference (P<0.05) in the signal intensity between the different secondary antibodies within a bird species. Anti-macaw IgY secondary antibody produced significantly (P<0.05) stronger signals than the other secondary antibodies in Blue and gold macaw, Cockatiel, and Monk parakeet positive plasma, while anti-duck IgY secondary antibody produced significantly (P<0.05) stronger signals than the other secondary antibodies in Mallard positive plasma.
Conclusion: In testing psittacines with immunoassays, and especially in assays that incorporate short incubation reaction times such as a dot-blot ELISA, species-specific anti-IgY secondary antibodies provided more accurate results.
Keywords: immunodiagnostics, serology, proventricular dilatation disease, avian ganglioneuritis
Introduction
In 2008, avian bornavirus (ABV) was discovered to be the causative agent of Parrot bornavirus syndrome (PaBVs), formerly known as macaw wasting disease, proventricular dilatation disease or PDD, enteric ganglioneuritis and encephalitis, and avian ganglioneuritis.1–3 Since then, multiple ABV genotypes have been recognized in over 80 different species such as psittaciformes, passeriformes, and waterfowls.4 Diagnosis of PaBVs includes clinical signs and radiological changes, detection of viral antigen, viral RNA or ABV antibodies, gross pathology, and histopatholgy.5–8 Sampling for histopathology and tissue immunoassays, especially of nervous tissues, is not practical in living birds, thus these tests are more commonly used in post-mortem diagnosis. Reverse transcriptase polymerase chain reaction (RT-PCR) can utilize less invasive samples such as feather follicles, feces/urine, and cloacal swabs,5,7,9–13 however sensitivity will vary due to intermittent viral shedding.13–15
Immunologic testing comparing ABV specific antigens found that the viral nucleoprotein is immunodominant and hence the best antigen to use in a microtiter plate ELISA and in fluorescent antibody assays.9,16 A mixed anti-avian species IgY secondary antibody is often used in ABV serologic tests.8,9,17–20 The anti-bird secondary antibody, produced in goats using immunoglobulins from the White-crowned sparrow, Ringed turtle dove, domestic chicken, and Muscovy duck,a has been used in other ELISAs for the detection of arboviruses, flaviviruses, alpha-viruses, and poxviruses.21–24 The advantage of an anti-bird secondary antibody is the range of species that can be tested. This anti-bird secondary antibody has been used in serologic tests for the detection of antibodies in psittacine birds, even though the immunogen used to stimulate this secondary antibody did not contain antibodies from psittaciformes. Anti-passerine IgY secondary antibody produces better results than the anti-bird IgY secondary antibody or the anti-chicken IgY secondary antibody for serologic assays on passerine birds.25 This suggests that species-specific secondary antibodies may provide more sensitive results in immunologic assays than commercially available mixed species anti-bird secondary antibody. In assays that employ short antigen-antibody incubation times, such as dot-blot or lateral flow ELISAs, a species-specific secondary antibody may be more useful when testing psittacine birds. Additionally due to the large variety of avian species susceptible to ABV infection, a low affinity of the secondary antibody could result in erroneous test results. The goal of this study was to evaluate the specificity of different avian secondary antibodies used in Western blot and dot-blot ELISA to detect ABV antibodies in the plasma of Blue and gold macaw (Ara ararauna), Cockatiel (Nymphicus hollandicus), Monk parakeet (Myiopsitta monachus), and Mallard (Anas platyrhynchos).
Materials And Methods
Anti-IgY Secondary Antibodies
Polyclonal IgG rabbit anti-chicken IgY-H+L (anti-chicken IgY secondary antibody), conjugated with alkaline phosphatase, 0.1 mg/mL (Sigma-Aldrich A9171) was obtained from Sigma-Aldrich, Inc. (St. Louis, MO. USA). Polyclonal IgG goat anti-duck IgY-H+L (anti-duck IgY secondary antibody), conjugated with alkaline phosphatase, 0.1 mg/mL (Kirkegaard & Perry LB 261–06) was obtained from Kirkegaard & Perry Laboratories, Inc (Gaithersburg, MD. USA). Polyclonal IgG goat anti-macaw IgY-H+L (anti-macaw IgY secondary antibody), conjugated with alkaline phosphatase, 1.0 mg/mL (Bethyl A140-116AP) and polyclonal IgG goat anti-bird IgY-H+L (anti-bird IgY secondary antibody), conjugated with alkaline phosphatase, 1.0 mg/mL (Bethyl A140-110F) were obtained from Bethyl Laboratories, Inc. (Montgomery, TX. USA).
Sample Collection
The experimental protocol was reviewed and approved by the Texas A&M University Bio-safety and Animal Use Committees (IACUC 2016-0274, 2014-0010, 2016-0054 and 2017-0217), which, complies with the guidelines included in the National Research Council of the National Academies’ publication Guide for the Care and Use of Laboratory Animals, 8th edition. Blood samples equivalent to 1% body weight were collected by jugular venipuncture. Blood was collected into lithium heparin tubes and stored at 4°C prior to centrifugation (5000 x g, 10 mins). Plasma was collected and stored at −20°C prior to analysis. Two Blue and gold macaws, one Cockatiel, one Monk parakeet and two Mallards were sampled. Blue and gold macaw blood samples were collected from one bird naturally infected with ABV that routinely tested positive for ABV mRNA by RT-PCR in its urofeces and from one bird that was not known to be exposed to ABV and routinely tested negative by RT-PCR. Cockatiel and Monk parakeet blood samples were collected prior to and following experimental infection; the birds were tested routinely by RT-PCR. The Mallard samples were collected from an experimentally infected, RT-PCR positive Mallard and from a non-infected, RT-PCR negative Mallard.
Recombinant Nucleoprotein Expression And Purification
Recombinant nucleoprotein (N-protein), purified from E. coli, was produced following the method of Hameed et al (2018).26 Briefly, the procedure was as follows. Total RNA was extracted from frozen brain tissue of a Yellow-collared macaw (Primolius auricollis) infected with PaBV-4 using Qiagen RNeasy Mini kit (Qiagen, Hilden, Germany). The RNA was used to generate cDNA using reverse transcription kits (High Capacity Reverse Transcription Kit, Applied Biosystems, Foster City, CA, USA) and random hexamers. Subsequent PCR was performed to amplify the N-protein gene with primers Forward 5ʹ-CATG CAT ATG CCA CCC AAG AGA CAA AGA AGC-3ʹ and Reverse 5ʹ-GTAC CTC GAG GTT TGC GAA TCC GGT TAC ACC-3ʹ. The resulting PCR products were cloned, sequenced, and inserted into pET21a vector to generate a His-tagged fusion protein for expression in Escherichia coli (Rosetta, Sigma-Aldrich, St. Louis, MO, USA). Recombinant E. coli was incubated for 12 hrs in Luria broth fortified with ampicillin; the culture was continuously mixed at 150 rpm at room temperature. Recombinant E. coli was transferred to fresh media of Luria broth, ampicillin, and Isopropyl β-D-1-thiogalactopyranoside to induce protein expression and incubated for 6 hrs, while being continuously stirred at 200 rpm at room temperature. The solution was centrifuged at 3500 x g for 30 mins and the supernatant was removed. The bacterial pellet was resuspended in 40 mL of phosphate-buffered saline (PBS) and sonicated for 3 sets of 8 mins to lyse the bacteria. The sonicated solution was then centrifuged at 12,000 x g for 20 mins at 4°C. The supernatant was loaded on a Qiagen Ni-NTA Agarose column, which had been pre-conditioned with 10 mL of binding buffer (20mM sodium phosphate, 300mM NaCl, pH 7.4, 10mM imidazole); the Qiagen Ni-NTA Agarose column has a high affinity for His-tagged proteins. Ten mL of wash buffer (20mM sodium phosphate, 300mM NaCl, pH 7.4, 20mM imidazole) was loaded on the column and allowed gravity flow. The column was then eluted by gravity flow with 10 mL of elution buffer (20mM sodium phosphate, 300mM NaCl, pH 7.4, 200 mM imidazole) and the elutant was collected in 1mL fractions. The purity of each protein fraction was determined by sodium dodecyl sulfate polyacrylamide gel (SDS-PAGE) electrophoresis. Fractions containing the N-protein were combined and an Amico Ultra 15 mL centrifugal filter was used to concentrate the N-protein in 1 mL PBS. Finally, the protein concentration was measured using BCA™ Protein Assay Kit (Thermo Scientific™ PIERCE™, Waltham, MA. USA).
Western Blot
Western blot assays were performed according to Guo et al (2014),27 with the following modifications. Recombinant N-protein was separated using SDS-PAGE and the protein was electrophoretically transferred to a polyvinylidene difluoride (PVDF) membrane. The PVDF membrane was incubated in 5% dried skim milk/0.05%Tween/0.02M PBS overnight at room temperature. The membrane was then incubated for 2 hrs with plasma that had been diluted 1:200 with 3 mL of 2% dried skim milk/0.02M PBS/0.05%Tween, and followed with three 15 min washes of PBS/0.05% Tween. The membrane was then incubated for 1 hr with one of the four conjugated secondary antibodies. The anti-macaw and anti-bird IgY secondary antibodies, which had initial concentrations of 1.0 mg/mL, were diluted 1:50,000 with 3 mL of 2% dried skim milk/PBS/0.05% Tween; the anti-chicken and anti-duck IgY secondary antibodies, which had initial concentrations of 0.1 mg/mL, were diluted 1:5,000 with 3 mL of 2% dried skim milk/PBS/0.05% Tween. This was followed by three 15 min washes with PBS/0.05%Tween. The membrane was then incubated for approximately 5 mins, or until color change was observed, in a 5-bromo-4-chloro-3-indolyl phosphate (BCIP)/nitro blue tetrazolium (NBT) solution (SigmaFast BCIP/NBT substrate tablet, Sigma Aldrich, St. Louis, MO. USA) dissolved in 10 mL ultra-pure water. Finally, the membrane was rinsed with ultra-pure water.
Dot-Blot Enzyme-Linked Immunosorbent Assays
Dot-blot ELISAs were performed according to Guo et al (2014),27 with the following modifications. Briefly, 2.0 µl of a 0.15 mg/mL recombinant N-protein solution was dotted onto a nitrocellulose (NC) membrane strip and incubated in 5% skim dried milk/0.05% Tween/0.02M PBS overnight at room temperature. The membrane strip was incubated for 5 mins with plasma diluted 1:60 with 3 mL 2% dried skim milk/0.02M PBS/0.05% Tween solution, followed by three 1 min rinses with 3 mL of PBS/0.05%Tween. The membrane was incubated for five minutes in 3 mL of one of the diluted secondary antibodies, followed by three 1 min rinses with 3 mL of PBS/0.05%Tween. The membrane was then incubated for 5 mins in a solution containing SigmaFast BCIP/NBT substrate tablet dissolved in 10 mL ultra-pure water. Finally, the membrane was rinsed with ultra-pure water.
Semi-Quantitative Signal Intensity Of Dot-Blot ELISA
Membranes were scanned using an Epson Expression 100,000 XL flatbed scanner with 300 dpi resolution. The scan was saved in a digital format as a .jpeg image. An image analysis software program (ImageJ, National Institutes of Health; https://imagej.nih.gov/ij/) was used to obtain semi-quantitative intensity values of the dot-blot ELISA signals. Digitally formatted images were converted into 2-bit grey-scale by selecting Image, Type, 32-bit. Image brightness and contrast was adjusted by selecting Image, Adjust, Brightness/Contrast, Auto, Apply. An area of interest was delineated over individual signal dots using the rectangular selection tool, then selecting Analyse, Gel, Select First Lane. This delineated rectangular area was dragged to each of the other signal dots and then selecting Analysis, Gel, Select Next Lane. Use of a consistent delineated area provided equally sized areas of interest for analysis. A graphical depiction of dot signal intensity for each dot selected was acquired by selecting Analysis, Gel, Plot Lanes. The area representing the dot signal intensity was delineated using the straight line tool from the bar menu. After all dot areas were delineated, the wand tool from the bar menu was used to highlight these areas, which generated a signal intensity value. For each dot, three dot signal intensity values were independently generated with Image J and a mean dot signal intensity value was reported.
Statistical Analysis
Dot signal intensities were analyzed using Two Way Analysis of Variance (ANOVA) with the Holm-Sidak method for pairwise multiple comparisons. A P ≤ 0.05 was considered statistically significant. SigmaPlot version 10.0.1 was used for performing all statistical analyses (Systat Software, Inc., San Jose, CA).
Results
Western Blot
Western blot membranes using the different secondary antibodies with each of the bird species sampled are shown in Figure 1. The N-protein signal was located at approximately 38–41 kDa. A strong signal was detected for ABV antibodies in positive Blue and gold macaw plasma when using anti-macaw IgY secondary antibody. Negative Blue and gold macaw plasma resulted in no signal. A strong signal was detected for ABV antibodies in positive Cockatiel plasma when using anti-macaw IgY secondary antibody and no signal was seen in negative Cockatiel plasma. No signal was detected in either ABV positive nor negative Mallard plasma when using anti-macaw IgY secondary antibody.
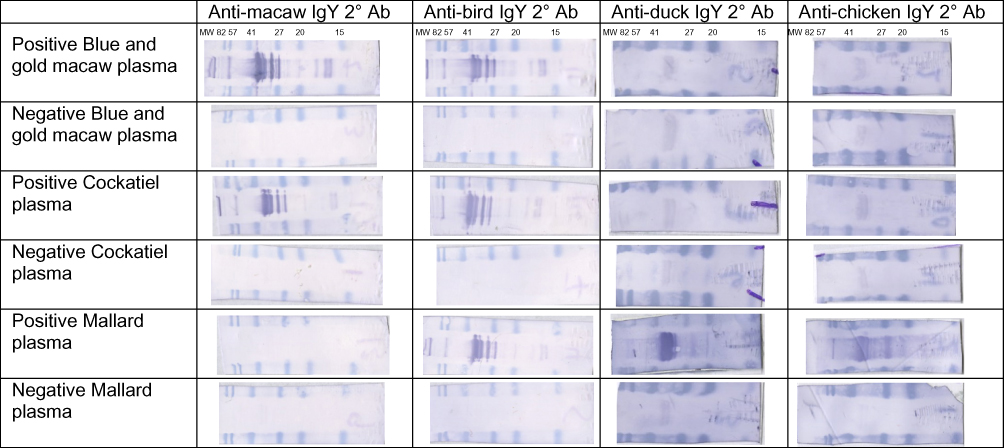 |
Figure 1 Representative membranes of Western blot results using anti-macaw, anti-bird, anti-duck, and anti-chicken IgY secondary antibody on ABV antibody positive and negative plasma from Blue and gold macaw (Ara ararauna), Cockatiel (Nymphicus hollandicus), and Mallard (Anas platyrhynchos). Notes: The N-protein signal was located at approximately 38–41 kDa.Abbreviations: 2° Ab, secondary antibody; MW, molecular weight. |
A strong signal was detected for ABV antibodies in positive Blue and gold macaw, Cockatiel, and Mallard plasma when using the anti-bird IgY secondary antibody. No signal was detected in any of the negative plasma.
A weak signal was detected for ABV antibodies in positive Blue and gold macaw plasma when using anti-duck IgY secondary antibody, however this signal was similar to that detected in the negative Blue and gold macaw, positive and negative Cockatiel, and negative Mallard plasma. A strong signal was detected for ABV antibodies in positive Mallard plasma when using anti-duck IgY secondary antibody.
A weak signal was detected when anti-chicken IgY secondary antibody was used with positive and negative Blue and gold macaw, positive and negative Cockatiel, and negative Mallard plasma. A strong signal was detected for ABV antibodies in positive Mallard plasma when using anti-chicken IgY secondary antibody.
Dot-Blot ELISA
Dot-blot ELISA results using the different secondary antibodies with each of the bird species sampled are shown in Figure 2. When anti-macaw IgY secondary antibody was used, a strong signal was detected for ABV antibodies with positive Blue and gold macaw and positive Cockatiel plasma, while a good signal was detected with positive Monk parakeet plasma. No signal was seen with positive Mallard plasma and negative plasma from Blue and gold macaw, Cockatiel, Monk parakeet and Mallard. A minimally visible signal was observed for ABV antibodies in positive Mallard plasma when using anti-macaw IgY secondary antibody.
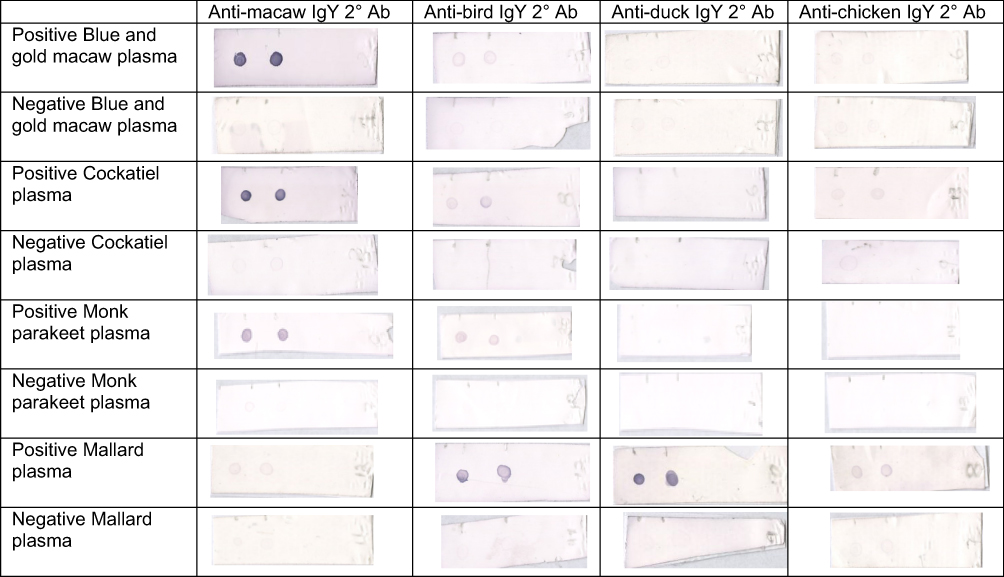 |
Figure 2 Representative membranes of dot-blot ELISA results using anti-macaw, anti-bird, anti-duck, and anti-chicken IgY secondary antibody on ABV antibody positive and negative plasma from Blue and gold macaw (Ara ararauna), Cockatiel (Nymphicus hollandicus), Monk parakeet (Myiopsitta monachus), and Mallard (Anas platyrhynchos). Abbreviation: 2° Ab, secondary antibody |
When anti-bird IgY secondary antibody was used, a weak signal was detected for ABV antibodies with positive Blue and gold macaw, Cockatiel, and Monk parakeet plasma. A good signal was detected for ABV antibodies with positive Mallard plasma when using anti-bird IgY secondary antibody. No signal was detected in any of the negative plasma samples when using anti-bird secondary antibody.
No signal was detected for ABV antibodies in positive and negative Blue and gold macaw, Cockatiel and Monk parakeet plasma when using anti-duck IgY secondary antibody. A strong signal was detected in positive Mallard plasma when using anti-duck IgY secondary antibody. Negative Mallard plasma resulted in no signal using anti-duck IgY secondary antibody.
A weak signal was detected when anti-chicken IgY secondary antibody was used with positive Blue and gold macaw, positive Cockatiel, and positive Mallard plasma. No signal was detected for ABV antibodies with negative plasma nor with positive Monk parakeet plasma when using anti-chicken IgY secondary antibody.
Semi-Quantification Of Dot-Blot ELISA
A representation of the dot-blot ELISA signals, the ImageJ graphic results, and the signal intensity values generated for the dot are shown in Figure 3. Signal intensities of the dot-blot ELISA using different secondary antibodies within each bird species sampled are shown in Table 1. For Blue and gold macaw plasma samples, the mean signal intensity of 19,461 obtained for the positive Blue and gold macaw plasma tested using anti-macaw IgY secondary antibody was significantly greater (P<0.05) than the signal intensity obtained when using any of the other three secondary antibodies. The signal intensity of the dots obtained for positive Blue and gold macaw plasma was significantly greater (P<0.05) than that obtained for negative Blue and gold macaw plasma when using anti-macaw IgY secondary antibody. The signal intensity values obtained for the positive Blue and gold macaw samples did not differ significantly from the negative Blue and gold macaw samples when anti-bird, anti-chicken, or anti-duck IgY secondary antibodies were used.
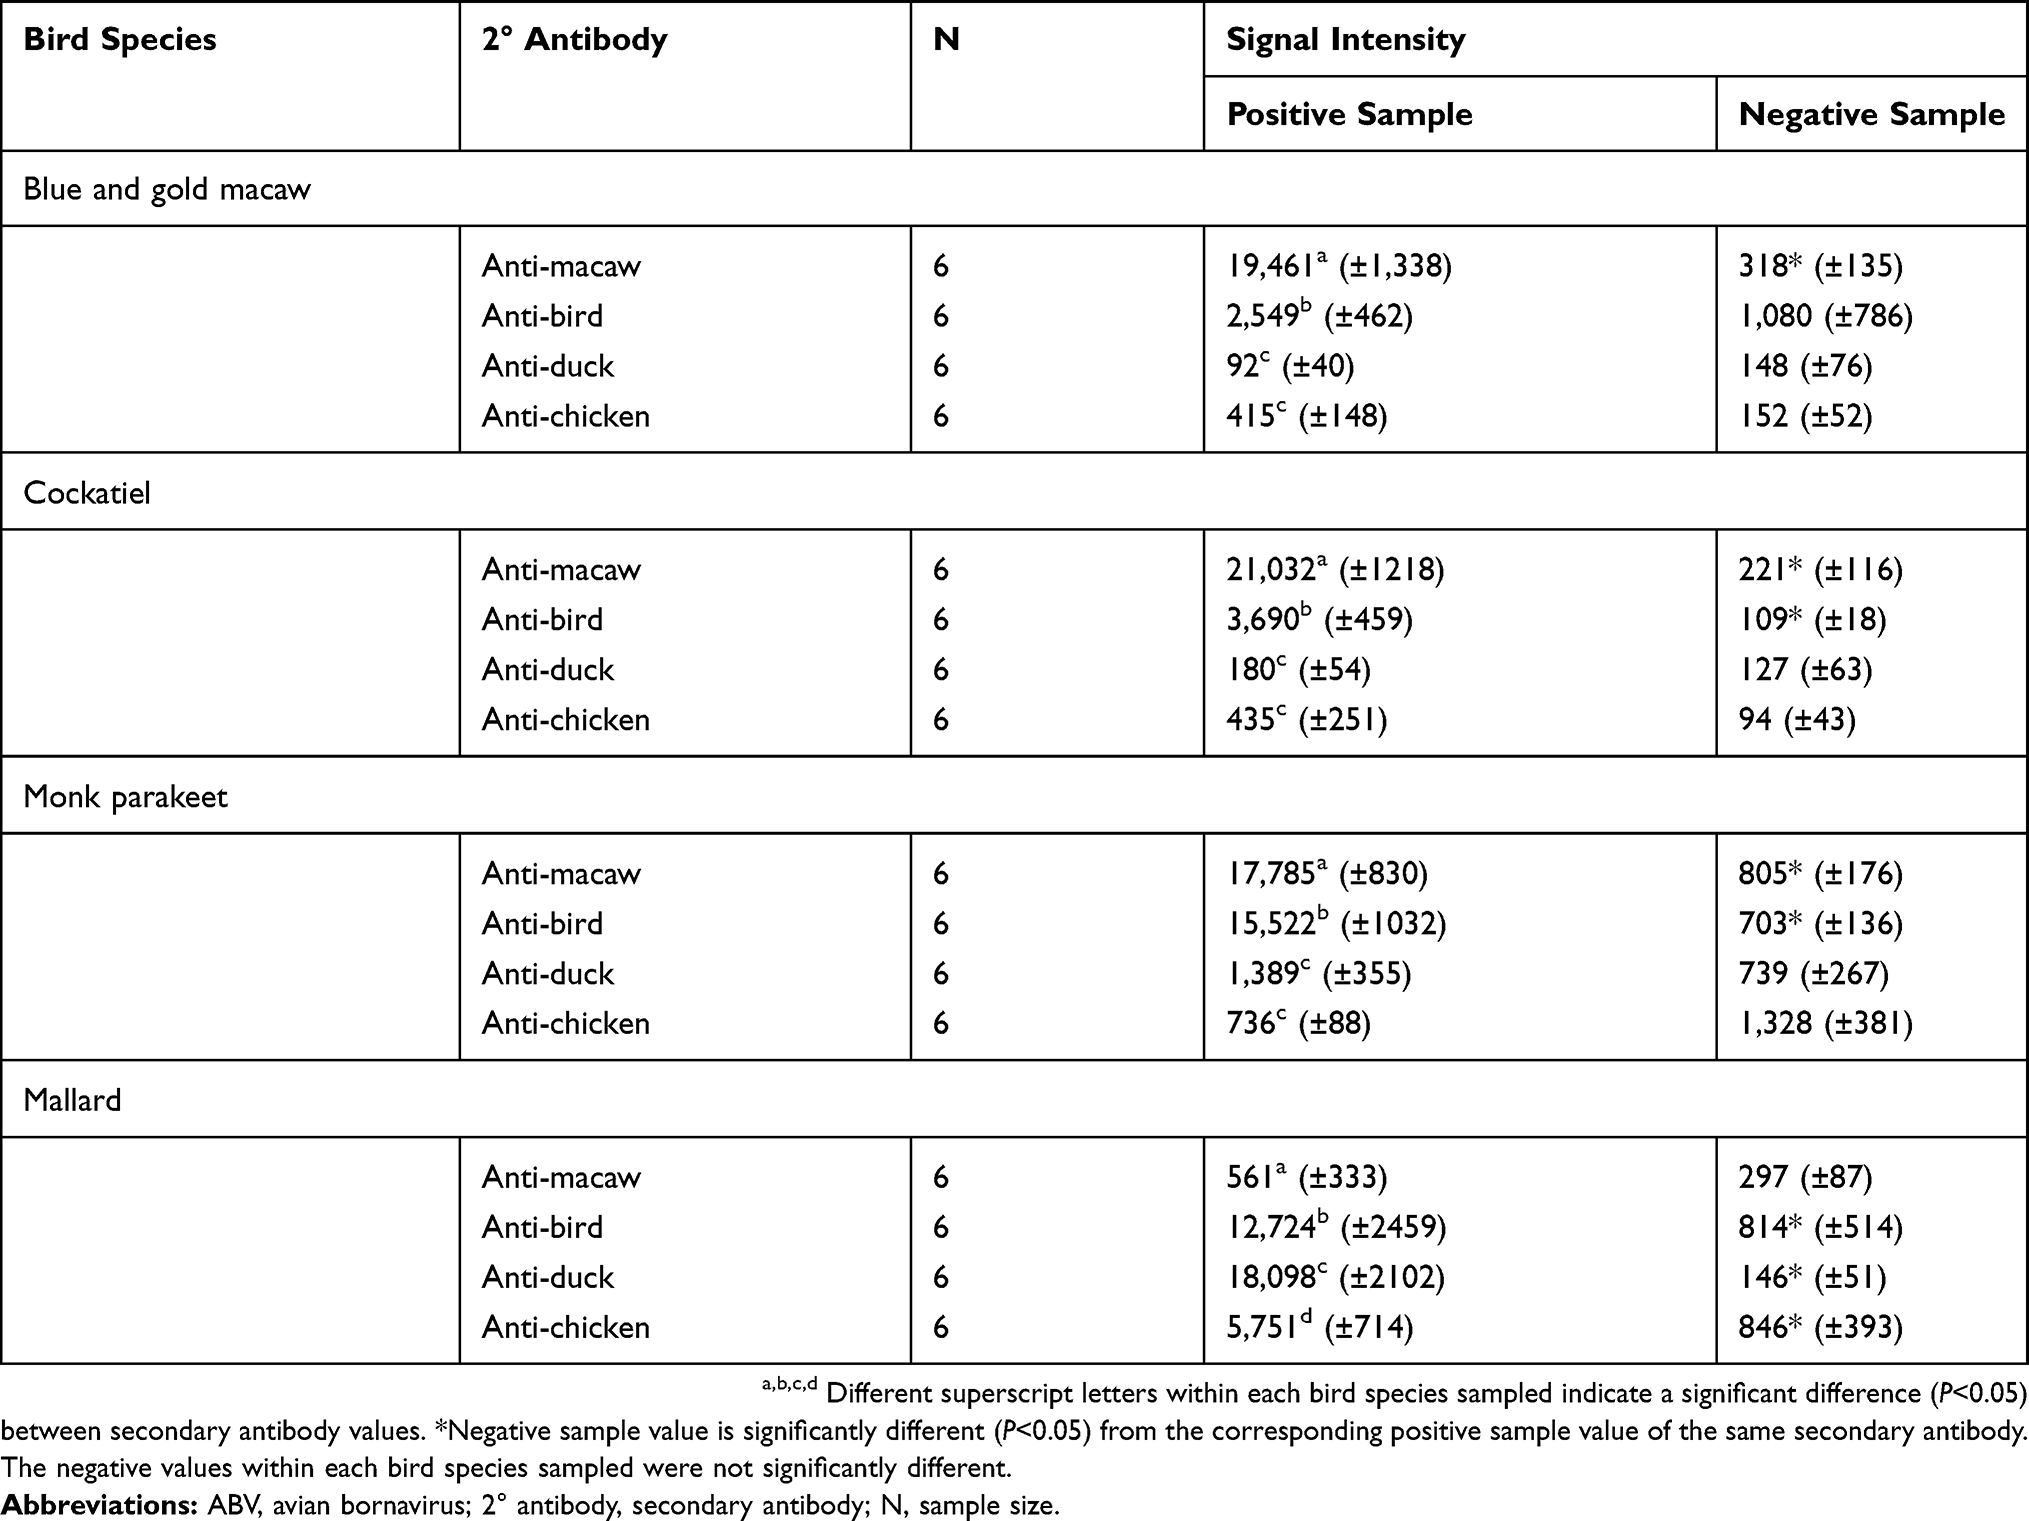 |
Table 1 Signal Intensities Obtained When Testing ABV Antibody Positive And Negative Plasma From Blue And Gold Macaw (Ara ararauna), Cockatiel (Nymphicus hollandicus), Monk Parakeet (Myiopsitta monachus), And Mallard (Anas platyrhynchos) With A Dot-Blot ELISA Using Anti-Macaw, Anti-Bird, Anti-Duck, And Anti-Chicken IgY Secondary Antibody |
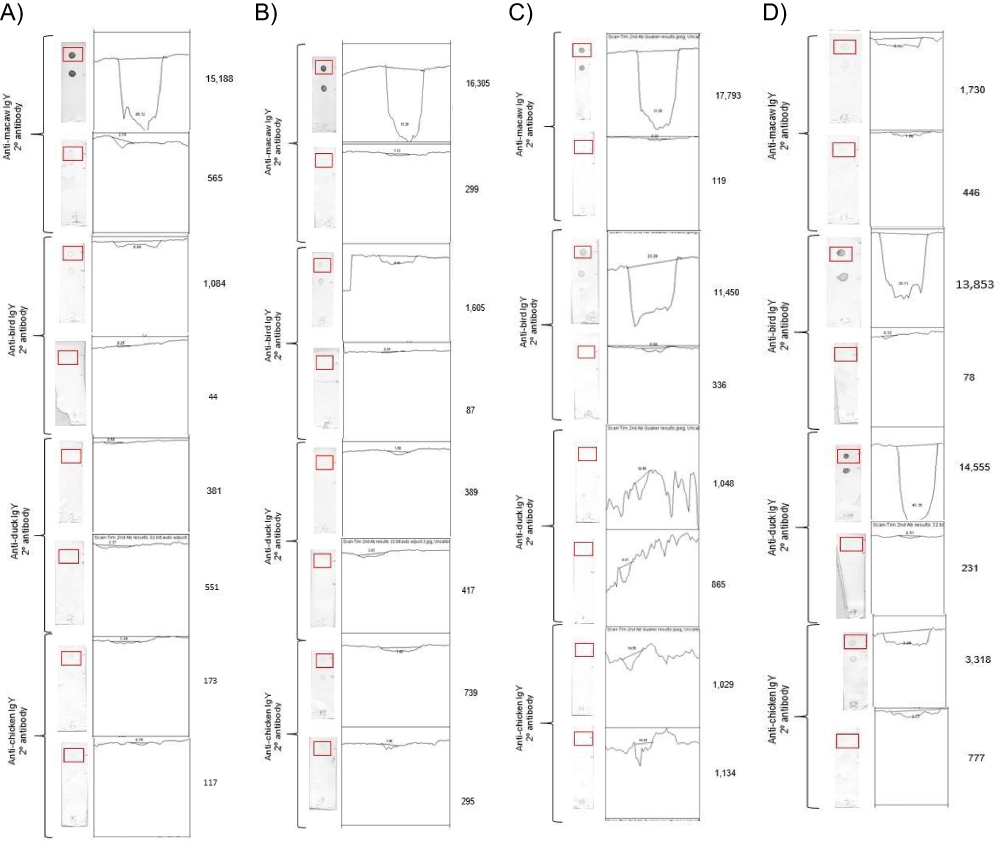 |
Figure 3 Digital image analysis of dot-blot ELISA used to generate the signal intensity value. Notes: The dot-blot ELISA with the delineated area of interest highlighted in the red rectangle, the graphic display, and the signal intensity value are displayed using samples from (A) Blue and gold macaw (Ara ararauna), (B) Cockatiel (Nymphicus hollandicus), (C) Monk parakeet (Myiopsitta monachus), and (D) Mallard (Anas platyrhynchos). |
For Cockatiel samples, the mean signal intensity of 21,032 was obtained for positive Cockatiel plasma tested using the anti-macaw IgY secondary antibody was significantly greater (P<0.05) than the signal intensity obtained when using any of the other three secondary antibodies. The signal intensity of the positive plasma dots obtained for positive Cockatiel plasma was significantly greater (P<0.05) than that obtained for negative Cockatiel plasma when using anti-macaw or anti-bird IgY secondary antibody. The signal intensity values did not significantly differ between the positive and negative samples when anti-chicken or anti-duck IgY secondary antibodies were used.
For Monk parakeet samples, the mean signal intensity of 17,785 obtained for the positive plasma tested using anti-macaw IgY secondary antibody was significantly greater (P<0.05) than the signal intensity when the other three secondary antibodies were used. The signal intensity of the positive plasma was significantly greater (P<0.05) than that of the negative plasma when using anti-macaw or anti-bird IgY secondary antibody. The signal intensity values did not differ significantly between the positive and negative samples when anti-chicken or anti-duck IgY secondary antibodies were used.
For Mallard samples, the mean dot signal intensity obtained using positive Mallard plasma was significantly different (P<0.05) between all the secondary antibodies; the anti-duck IgY secondary antibody generated the greatest signal intensity value of 18,098, while the anti-macaw IgY secondary antibody generated the least signal intensity value of 561. The signal intensity of the positive plasma dot was significantly greater (P<0.05) than that of the negative plasma dot when using anti-bird, anti-chicken, and anti-duck IgY secondary antibodies. The signal intensity value did not differ significantly between the positive and negative samples, 561 and 297, respectively, when using anti-macaw IgY secondary antibodies.
Mean dot signal intensity obtained using the negative plasma samples did not differ significantly within each bird species.
Discussion
In serologic testing of birds, variations in the specificity of the secondary antibody used can generate erroneous results. Our study demonstrated species specificity of secondary antibodies to bird IgY in Western blot and dot-blot ELISA. Our results suggest that rapid, patient-side serologic assays for ABV antibodies in psittacines, such as the dot-blot ELISA, should employ anti-IgY secondary antibody against a similar psittacine species. In this study, the use of anti-macaw IgY secondary antibody in the dot-blot ELISA for testing antibody-positive Blue and gold macaw plasma generated appreciably better visible signals with consistently higher signal intensity than the use of anti-bird, anti-duck, or anti-chicken IgY secondary antibodies (Figure 2; Table 1). Though some studies have used anti-chicken secondary antibody in serologic assays in wild birds,28,29 our results were in agreement with a study that found the use of anti-passerine IgY secondary antibody in a microplate ELISA performed better than anti-chicken and anti-bird secondary antibodies when testing passerines.25 In fact, we found that the use of anti-macaw IgY secondary antibody, in both the Western blot and the dot-blot ELISAs, showed strong species specificity for psittacines.
Conversely, the use of anti-macaw IgY secondary antibody showed no difference between positive and negative Mallard plasma in either of the immunological assays (Figures 1 and 2; Table 1). Due to the diversity of avian species that can be infected with ABV, specificity of the secondary antibody to the antiglobulin species being tested is critically important and must be considered in the development of ABV assays and in ABV research.
Western blot and immunofluorescence assays are considered gold standards in serologic testing for ABV. N-protein is the immunodominant antigen,9,27 thus a recombinant N-protein was utilized as the antigen of interest in our assays. The use of the Western blot in our study was two-fold: 1) to verify the seropositive/seronegative status of the plasma samples and 2) to evaluate the use of the different secondary antibodies as compared to the dot-blot ELISA. Anti-macaw and anti-bird IgY secondary antibodies produced strong reactions at 38–41 kDa, but additional bands were seen at 17, 27, and 30 kDa. These bands likely represent degraded N-protein to which the secondary antibodies were able to bind.
The use of anti-bird IgY secondary antibody in the Western blot worked well for Blue and gold macaw, Cockatiel, and Mallard plasmas, a result similar to that obtained in other studies using anti-bird IgY secondary antibody to detect ABV exposure.9,11,20 However using the anti-bird IgY secondary antibody in the dot-blot ELISA, the Blue and gold macaw and Cockatiel samples had poor positive responses while the Mallard samples were strongly positive. Monk parakeet plasma was not assayed by Western blotting due to the limited plasma volume available.
The dissimilar results obtained using anti-bird IgY secondary antibody in the Western blot and the dot-blot ELISAs may have been due to multiple factors, including; antigen-antibody reactions, the species used to generate the anti-bird antibody and the different procedural methods of the assays. Many factors influence antigen-antibody reactions, such as pH, temperature, antibody and antigen concentration, and incubation time.30 In this study, the Western blot procedure allowed for a longer duration of incubation for the antigen-antibody reactions between plasma IgY and the recombinant N-protein and between the anti-IgY secondary antibody and the plasma IgY. The commercially available anti-bird IgY secondary antibody was manufactured using White-crowned sparrow, Ringed turtle dove, domestic chicken, and Muscovy duck IgY and has been reported to react with dove, duck, sparrow, chicken, turkey, emu, ostrich, quail, macaw and cockatiel antiglobulins (Product insert, Bird IgG-heavy and light chain Antibody, Bethyl Laboratories).
This ability of anti-bird IgY secondary antibody to react with the antiglobulins of many bird species makes it a useful secondary antibody for assays that utilize long incubation periods; the anti-bird IgY secondary antibody has been used in ABV testing using, Western blot analysis, microplate ELISA, and indirect immunofluorescence assays.8,9,17–19 In our Western blots, strong signals were obtained using the anti-bird IgY secondary antibody with the positive samples from Blue and gold macaw, Cockatiel, and Mallard (Figure 1), however when used in our dot-blot ELISA, the use of anti-bird IgY secondary antibody produced weak signals with Blue and gold macaw and Cockatiel positive plasma (Figure 2). The polyclonal nature of the anti-bird IgY antibodies make it an ideal secondary antibody for immunodiagnostic assays due to its ability to recognize multiple epitopes on the target antiglobulin and on the different species antiglobulins. However, the varying affinities of the polyclonal IgY antibodies can cause differences in the signal strength obtained from assays with long or short incubation times, such as seen between the Western blot and dot-blot ELISA, respectively, in our study. In the dot-blot ELISA, mainly high affinity secondary antibodies, which bind quickly and with a greater stability than lower affinity secondary antibodies, produce the signal. Additionally, the polyclonal nature of the anti-bird IgY secondary antibody produced a higher avidity in the dot-blot ELISAs for Monk parakeet and Mallard antiglobulins, as observed by the stronger dot visibility and signal intensity, than the avidity for Blue and gold macaw and Cockatiel antiglobulins (Figure 2). Exactly what factors were involved and how they differed was beyond the scope of this project, but the issue of reaction incubation time and its effect on avidity should be explored further if a dot-blot ELISA is to be optimized as a rapid, patient-side diagnostic assay.
Background noise in all tests must also be considered. In this study, a faint signal was observed in the negative samples of Blue and gold macaw and Cockatiel samples when the anti-duck and anti-chicken IgY secondary antibodies were used in the Western blot and dot-blot ELISAs; the signals of the corresponding negative samples were visibly similar to those of the positive samples (Figures 1 and 2). However, when analyzing the signal intensities of the dot-blot ELISA, there was no significant difference between the signal intensity of the negative and positive Blue and gold macaw or Cockatiel samples when anti-duck or anti-chicken IgY secondary antibody was used (Table 1). This background signal may have been due to cross-reactions with antibodies to E. coli antigens in the samples. Antibodies against E. coli are found in human serum and can cause background noise in serologic assays that use recombinant proteins.31,32 Similar studies in birds show non-specific signals due to E. coli antibodies in plasma samples and to recombinant E. coli antigens in serologic tests.33,34 Affinity purification of the His-tagged recombinant N-protein with the Ni-NTA Agarose column may not have removed all E. coli antigens from the recombinant E. coli/N-protein solution. E.coli proteins can have some histidine conformation or during the generation of the recombinant N-protein,some His-tagged E.coli proteins may have been generated with the insertion of the pET21a vector into the E. coli. Thus, some E. coli antigens may have been present in the PVDF membranes and the NC membrane strips of the Western blot and dot-blot ELISAs, respectively, and able to react with antibodies in the sample. To reduce non-specific signals and background noise in the assays, procedures that will absorb or neutralize E. coli antibodies in plasma samples or that will increase the purity of the recombinant N-protein antigen need to be investigated. However even without these additional procedures, the dot-blot ELISA readily discriminated between ABV antibody positive and negative samples (Figure 2), especially in species most prone to natural infection. This suggests the possibility of developing a rapid, patient-side assay that will detect ABV antibodies in psittacine birds.
Conclusion
Our study shows that species-specific anti-IgY secondary antibodies provided more accurate results in serologic assays than the use of commercially available anti-chicken and anti-bird IgY secondary antibodies. Due to the large variety of avian species susceptible to ABV infection, the specificity of the secondary antibody must be considered when developing or performing serologic assays, such as dot-blot ELISA and Western blot.
Acknowledgements
The authors thank Debra Turner and Dr. Jeann Leal de Araujo for technical assistance. Supported in part by the Schubot Exotic Bird Health Center. The open access publishing fees for this article have been covered by the Texas A&M University Open Access to Knowledge Fund (OAKFund), supported by the University Libraries and the Office of the Vice President for Research.
Disclosure
The authors report no conflicts of interest in this work.
References
1. Kistler AL, Gancz A, Clubb S, et al. Recovery of divergent avian bornaviruses from cases of proventricular dialatation disease: identification of a candidate etiologic agent. Virol J. 2008;5:88–102. doi:10.1186/1743-422X-5-88
2. Honkavuori KS, Shivaprasad HL, Williams BL, et al. Novel borna virus in psittacine birds with proventricular dilatation disease. Emerg Infet Dis. 2008;14:1883–1886.
3. Gray P, Hoppes S, Suchodolski P, et al. Use of avian bornavirus isolated to induce proventicular dilatation disease in conures. Emerg Infec Dis. 2010;16:473–479. doi:10.3201/eid1603.091257
4. Kuhn JH, Dürrwald R, Bào Y, et al. Taxonomic reorganization of the family Bornaviridae. Arch Virol. 2015;160:621–632. doi:10.1007/s00705-014-2276-z
5. Raghav R, Taylor M, DeLay J, et al. Avian bornavirus is present in many tissues of psittacine birds with histopathologic evidence of proventicular dilatation disease. J Vet Diagn Invest. 2010;22:495–508. doi:10.1177/104063871002200402
6. Payne S, Shivaprasad HL, Mirhosseini N, et al. Unusual and severe lesions of proventricular dilatation disease in cockatiels (Nymphicus hollandicus) acting as healthy carriers of avian bornavirus (ABV) and subsequently infected with a virulent strain of ABV. Avian Pathol. 2011;40:15–22. doi:10.1080/03079457.2010.536978
7. Leal de Araujo J, Rech RR, Heatley JJ, et al. From nerves to brain to gastrointestinal tract: a time-based study of parrot bornavirus 2 (PaBV-2) pathogenesis in cockatiels (Nymphicus hollandicus). PLoS ONE. 2017;12:e0187797.
8. Piepenbring AK, Enderlein D, Herzog S, et al. Pathogenesis of avian bornavirus in experimentally infected Cockatiels. Emerg Infect Dis. 2012;18:234–241. doi:10.3201/eid1802.111525
9. de Kloet AH, Kerski A, de Kloet SR. Diagnosis of avian bornavirus infection in psittaciformes by serum antibody detection and reverse transcription polymerase chain reaction assay using feather calami. J Vet Diagn Invest. 2011;23:421–429. doi:10.1177/1040638711403406
10. Rubbenstroth D, Rinder M, Stein M, et al. Avian bornaviruses are widely distributed in canary birds (Serinus canaria f. domestica). Vet Microbiol. 2013;165:287–295. doi:10.1016/j.vetmic.2013.03.024
11. Delnatte P, Mak M, Ojkic D, et al. Detection of avian bornavirus in multiple tissues of infected psittacine birds using real-time reverse transcription polymerase chain reaction. J Vet Diagn Invest. 2014;26:266–271. doi:10.1177/1040638713519641
12. Reuter A, Ackermann A, Kothlow S, et al. Avian bornaviruses escape recognition by the innate immune system. Viruses. 2010;2:927–938. doi:10.3390/v2040927
13. Heatley JJ, Villalobos AR. Avian bornavirus in the urine of infected birds. Vet Med Res Rep. 2012;3:19–23.
14. Kistler AL, Smith JM, Alexander L, et al. Analysis of naturally occurring avian bornavirus infection and transmission during an outbreak of proventricular dilatation disease among captive psittacine birds. J Virol. 2010;84:2176–2179. doi:10.1128/JVI.02191-09
15. Rubbenstroth D, Schmidt V, Rinder M, et al. Phylogenetic analysis supports horizontal transmission as a driving force of the spread of avian bornavirus. PLoS ONE. 2016;11:e0160936. doi:10.1371/journal.pone.0160936
16. Zimmermann V, Rinder M, Kaspers B, et al. Impact of antigenic diversity on laboratory diagnosis of avian bornavirus infections in birds. J Vet Diagn Invest. 2014;26:769–777. doi:10.1177/1040638714547258
17. Lierz M, Hafez HM, Honkavuori KS, et al. Anatomical distribution of avian bornavirus in parrots, its occurrence in clinically healthy birds and ABV-antibody detection. Avian Pathol. 2009;38:491–496. doi:10.1080/03079450903349238
18. de Kloet SR, Dorrestein GM. Presence of avian bornavirus RNA and anti-avian bornavirus antibodies in apparently healthy macaws. Avian Dis. 2009;53:568–573. doi:10.1637/8828-040209-Reg.1
19. Herzog S, Enderlein D, Heffels-Redmann U, et al. Indirect immunofluorescence assay for intra vitam diagnosis of avian bornavirus infected in psittacine birds. J Clin Microbiol. 2010;48:2282–2284. doi:10.1128/JCM.00145-10
20. Fluck A, Enderlein D, Piepenbring A, et al. Correlation of avian bornavirus-specific antibodies and viral ribonucleic acid shedding with neurological signs and feather-damaging behavior in psittacine birds. Vet Rec. 2019;184:476–482. doi:10.1136/vr.104860
21. Chiles RE, Reisen WK. A new enzyme immunoassay to detect antibodies to arboviruses in the blood of wild birds. J Vector Ecol. 1998;23:123–135.
22. Hofmeister EK, Dusek RJ, Fassbinder-Orth C, et al. Susceptibility and antibody response of vesper sparrows (Pooecetes gramineus) to West Nile virus: a potential amplification host in sage-brush grassland habitat. J Wildl Dis. 2016;52:345–353. doi:10.7589/2015-06-148
23. Fassbinder-Orth CA, Barak VA, Brown CR. Immune response of a native and an invasive bird to Buggy Creek virus (Togaviridae: Alphavirus) and its arthropod vector, the swallow bug (Oeciacus vicarious). PLoS ONE. 2013;8:e58045. doi:10.1371/journal.pone.0058045
24. Ellison KS, Hofmeister EK, Ribic CA, et al. Relatively high prevalence of pox-like lesions in Henslow’s sparrows (Ammodrammus henslowii) among nine species of migratory grassland passerines in Wisconsin. J Wildl Dis. 2013;50:810–816. doi:10.7589/2013-09-252
25. Fassbinder-Orth CA, Wilcoxen TE, Tran T, et al. Immunoglobulin detection in wild birds: effectiveness of three secondary anti-avian IgY antibodies in direct ELISA in 41 avian species. Methods Ecol Evol. 2016;7:1174–1181. doi:10.1111/2041-210X.12583
26. Hameed SS, Guo J, Tizard I, et al. Studies on immunity and immunopathogenesis of parrot bornaviral disease in cockatiels. Virol. 2018;515:81–91. doi:10.1016/j.virol.2017.12.007
27. Guo J, Payne S, Zhang S, et al. Avian bornaviruses: diagnosis, isolation, and genotyping. Curr Protoc Microbiol. 2014;34:
28. Martínez J, Tomas G, Merino S, et al. Detection of serum immunoglobulins in wild birds by direct ELISA: a methodological study to validate the technique in different species using anti-chicken antibodies. Funct Ecol. 2003;17:700–706. doi:10.1046/j.1365-2435.2003.00771.x
29. Cray C, Villar D. Cross-reactivity of anti-chicken IgY antibody with immunoglobulins of exotic avian species. Vet Clin Path. 2008;37:328–331. doi:10.1111/j.1939-165X.2008.00055.x
30. Reverberi R, Reverberi L. Factors affecting the antigen-antibody reaction. J Blood Transfus. 2007;5:227–240.
31. Yip CW, Hon CC, Zeng F, et al. Naturally occurring anti-Escherichia coli protein antibodies in the sera of healthy humans cause analytical interference in a recombinant nucleocapsid protein-based enzyme-linked immunosorbent assay for serodiagnosis of severe acute respiratory syndrome. Clin Vaccine Immunol. 2007;14:99–101. doi:10.1128/CVI.00136-06
32. Hernandez P, Heimann M, Riera C, et al. Highly effective serodiagnosis for Chagas’ disease. Clin Vaccine Immunol. 2010;17:1598–1604.
33. Hadifar F, Ignjatovic J, Tarigan S, et al. Multimeric recombinant M2e protein-based ELISA: a significant improvement in differentiating avian influenza infected chickens from vaccinated ones. PLoS One. 2014;9:e108420. doi:10.1371/journal.pone.0108420
34. Zhao S, Jin M, Li H, et al. Detection of antibodies to the nonstructural protein (NS1) of avian influenza viruses allows distinction between vaccinated and infected chickens. Avian Dis. 2005;49:488–493. doi:10.1637/7321-010405R1.1
 © 2019 The Author(s). This work is published and licensed by Dove Medical Press Limited. The full terms of this license are available at https://www.dovepress.com/terms.php and incorporate the Creative Commons Attribution - Non Commercial (unported, v3.0) License.
By accessing the work you hereby accept the Terms. Non-commercial uses of the work are permitted without any further permission from Dove Medical Press Limited, provided the work is properly attributed. For permission for commercial use of this work, please see paragraphs 4.2 and 5 of our Terms.
© 2019 The Author(s). This work is published and licensed by Dove Medical Press Limited. The full terms of this license are available at https://www.dovepress.com/terms.php and incorporate the Creative Commons Attribution - Non Commercial (unported, v3.0) License.
By accessing the work you hereby accept the Terms. Non-commercial uses of the work are permitted without any further permission from Dove Medical Press Limited, provided the work is properly attributed. For permission for commercial use of this work, please see paragraphs 4.2 and 5 of our Terms.