")
Back to Journals » Patient Preference and Adherence » Volume 11
Comparison of EQ-5D-5L health state utilities using four country-specific tariffs on a breast cancer patient sample in mainland China
Authors Liu L, Li SP , Wang M, Chen G
Received 26 March 2017
Accepted for publication 29 May 2017
Published 23 June 2017 Volume 2017:11 Pages 1049—1056
DOI https://doi.org/10.2147/PPA.S138028
Checked for plagiarism Yes
Review by Single anonymous peer review
Peer reviewer comments 2
Editor who approved publication: Dr Naifeng Liu
Liu Liu,1,2 Shunping Li,1,2 Min Wang,3 Gang Chen4
1School of Health Care Management, Shandong University, Jinan, China; 2Key Laboratory of Health Economics and Policy Research, NHFPC (Shandong University), Jinan, China; 3Qingdao Municipal Hospital, Qingdao, China; 4Flinders Centre for Innovation in Cancer, School of Medicine, Flinders University, Adelaide, SA, Australia
Objective: The objective of this study was to compare the differences in the five-level EuroQol-5 dimensions (EQ-5D-5L) health state utility scores derived from Chinese, Japanese, Korean, and UK tariffs.
Methods: Six hundred and twenty-one breast cancer patients were invited for a face-to-face interview in Qingdao Municipal Hospital, China. EQ-5D-5L was scored using tariffs from China, Japan, Korea, and the UK. The null hypothesis of normal distribution of the EQ-5D-5L utility score was tested by the Shapiro–Wilk test. Nonparametric Friedman test and Wilcoxon signed-rank test were used to determine the difference among the four tariffs. The intraclass correlation coefficients (ICCs) and Bland–Altman plots were used to study the agreement among the four EQ-5D-5L scores. Known-groups validity was studied using a regression framework.
Results: There were 608 participants in the final analysis, with a mean ± standard deviation (SD) age of 48.0±9.6 years. EQ-5D-5L utility scores were non-normally distributed. The means (median) ± SD of EQ-5D-5L utilities derived from Chinese, Japanese, Korean, and UK tariffs were 0.828 (0.879) ±0.184, 0.802 (0.823) ±0.164, 0.831 (0.829) ±0.137, and 0.838 (0.866) ±0.154, respectively. Among pairwise comparisons, the difference of median EQ-5D-5L utility scores was only insignificant between Chinese and UK tariffs. Excellent agreements (with ICCs >0.9) were found among the four tariffs albeit the limits of agreement between each pair of tariffs were wide. Known-groups validity was supported.
Conclusion: Although four country-specific EQ-5D-5L tariffs have shown an overall high level of correlation and agreement, none of them could be regarded as interchangeable. The higher correlation and agreement between Chinese and UK tariffs may be due to the similar functions that were used in the tariff development. In the absence of Chinese-specific tariff, the UK tariff is the second-best option to be applied in the Chinese population. Results of this study further contribute to the explanation of variations among country-specific tariffs.
Keywords: breast cancer, EQ-5D-5L, multi-attribute utility instrument, preference weights, value sets, health state utility, China
Introduction
Given the limited health resources, cost–utility analysis (CUA) becomes increasingly important for decision makers to compare the effects of alternative health care interventions.1,2 The most common effectiveness measure in CUA is quality-adjusted life years (QALYs), expressed as health outcome in time (life years) combined with quality adjustments, that is, health state utility (HSU).3 HSU values range on a 0–1 (dead–full health) QALY scale; negative utilities also exist, representing health states are worse than death.4 The HSU scores can be elicited using both direct and indirect methods.5 The direct approach mainly includes the visual analog scale, time trade-off (TTO), and standard gamble. The indirect approach refers to the use of multi-attribute utility (MAU) instruments, such as the EuroQol-5 dimensions (EQ-5D) instruments,6 the short-form (SF) six dimensions derived from the SF-36,7 and the Health Utilities Index.8
The three-level version of EQ-5D (EQ-5D-3L) was introduced in the 1990s and has become the most widely used generic MAU instrument internationally.9,10 EQ-5D-3L includes five dimensions: mobility, self-care, usual activities, pain/discomfort, and anxiety/depression, with three levels in each dimension: no problems, some problems, and extreme problems. Although widely used in clinical trials, the EQ-5D-3L instrument is not without limitations; for example, it is not sensitive to mild health changes and it suffers from ceiling effects.11,12 To solve the issues previously mentioned, a new five-level EQ-5D (EQ-5D-5L) instrument was developed by the EuroQol Group.13 It retains the original dimension and expands the number of levels of severity in each dimension from three to five. The five levels in EQ-5D-5L include “no problems,” “slight problems,” “moderate problems,” and “severe problems” for all five items, and “unable to do” for mobility, self-care, and usual activities, or “extreme problems” for pain/discomfort and anxiety/depression, resulting in 3,125 (=55) unique health states.13,14
The MAU instrument contains two components, a descriptive system of the instrument and a tariff (also called “value sets,” “preference weights,” or “scoring algorithm”). It is commonly suggested that country-specific tariff better reflects the preference of a population in each country. When country-specific tariffs were unavailable, researchers opted to use the UK tariff9,15 or the tariff derived from a country that was geographically or culturally closer. However, previous studies suggest that there are substantial differences in different countries’ preference values for health states.16,17 It is unclear whether country-specific tariffs have high agreements or not for the new EQ-5D-5L instrument. This study aimed to empirically compare EQ-5D-5L HSU scores derived from Chinese, Japanese, Korean, and UK tariffs,15,18–20 based on a breast cancer patient sample in mainland China. Breast cancer is currently the most common cancer in Chinese women.21 By 2008, cases in China accounted for 12.2% of all newly diagnosed breast cancers and 9.6% of all deaths from breast cancer worldwide.22 A prediction suggested that in 2015, breast cancer accounted for 15% of all new cancers in women in China.21 To the best of our knowledge, this is the first study using the EQ-5D-5L Chinese value set in patients. The results of this study further contribute to the explanation of variations among country-specific tariffs.
Methods
Study sample
Participants were breast cancer patients who underwent inpatient treatment in Qingdao Municipal Hospital, China, between October 2014 and February 2015. Patients were excluded if they were unwilling to provide informed consent, or unable to understand the questionnaires, or diagnosed with other serious diseases, such as cardiovascular or cerebrovascular diseases, psychosis, or if the patient was <18 years at the time of the survey. All participants included were invited to a face-to-face interview, 1 day prior to discharge.
The face-to-face interviews included questions on sociodemographic characteristics and self-assessed quality of life. Clinical information for each participant was collected by the interviewer based on the medical record. Ethical approval (reference no 20131002) was obtained from the Ethics Review Board of the School of Public Health, Shandong University, and the research adhered to the tenets of the Declaration of Helsinki. Informed consent was obtained from all participants after a detailed explanation of the study.
EQ-5D-5L: China, Japan, Korea, and UK preference weights
In the Chinese valuation study,20 86 health states were valued by composite TTO (cTTO). To generate the tariff, the eight-parameter multiplicative model, including coefficients of the five dimensions (βMO, βSC, βUA, βPD, βAD) and parameters for levels 2, 3, and 4 (L2, L3, and L4), was chosen as the best model with random intercept variants.
The UK preference valuation for 86 health states was selected using cTTO and 196 pairs of health states using discrete choice experiments (DCE). A single combined-data value function for EQ-5D-5L, including 20 parameters (4 levels × 5 dimension), was developed by using the three-group model, the least restrictive model, and a hybrid modeling approach.15
In the Korean preference study,18 cTTO and DCE were used to estimate tariff for EQ-5D-5L health states. Because of being logically inconsistent, the final valuation model only used TTO data, which estimated 86 health state values for all EQ-5D-5L health states. The N4 model was selected as the final preferred model. The model included basic indicator variables with N4, which was added to the model to indicate if any of the five health dimensions contains a level ≥4.
The Japanese valuation study19 elicited 86 health states, which were valued by cTTO. The linear mixed model was adopted to predict all health states of EQ-5D-5L. The specific coefficients, functional model derived from four national preference weights, are shown in Table 1.
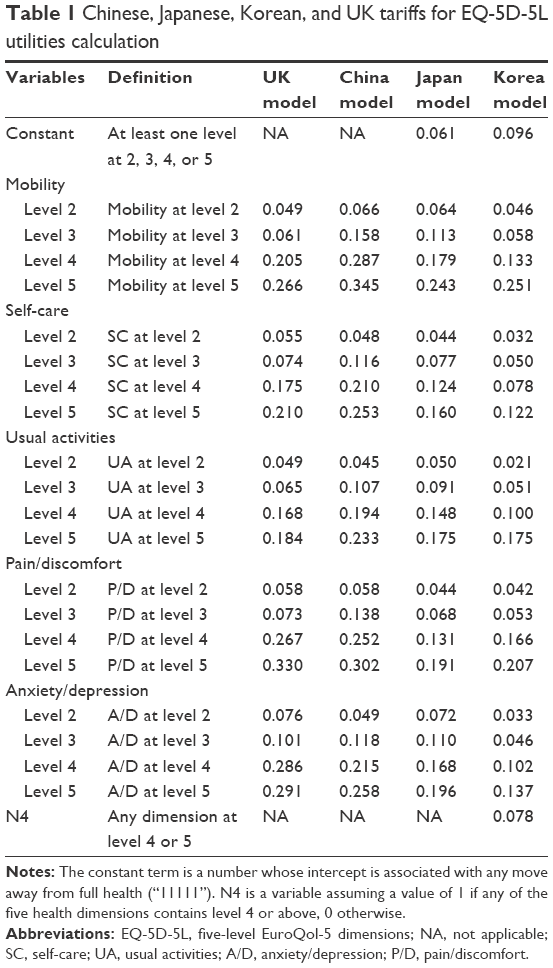 | Table 1 Chinese, Japanese, Korean, and UK tariffs for EQ-5D-5L utilities calculation |
Statistical analysis
EQ-5D-5L utility scores were calculated using the Chinese, Japanese, Korean, and UK tariffs. The null hypothesis of normal distribution of the EQ-5D-5L utility score was tested by the Shapiro–Wilk test. The nonparametric Friedman test and Wilcoxon signed-rank test were applied to examine the differences among the four HSU scores when the HSU scores were not normally distributed. Intraclass correlation coefficients (ICCs)23 and Bland–Altman plots24 were adopted to assess the agreements. An agreement was considered strong if the ICC value was >0.70.23 Known-groups validity was studied under a regression framework. It is hypothesized that breast cancer patients at a more advanced stage according to the tumor, node, and metastases classification of malignant tumors (TNM) or patients with metastatic breast cancer will have a significantly lower mean EQ-5D-5L utility score. Owing to a large proportion of patients were classified as in full health with HSU =1 according to the EQ-5D-5L classification system, a Tobit model was used in the regression analysis instead of the classical ordinary least squares estimator.25 Regressions controlled for patients’ sociodemographic characteristics. With the exception of the Bland–Altman plot, which was drawn using MedCalc version 16.8 (MedCalc Software, Ostend, Belgium), all other statistical analyses were conducted using Stata 14.0 (StataCorp LP, College Station, TX, USA).
Results
Characteristics of participants
Six hundred and twenty-one patients who were diagnosed with breast cancer were interviewed in this study. Among them, 13 participants were excluded due to incomplete answers to key questions. The final sample included 608 patients (97.9%).
Socio-demographic and clinical characteristics of the sample are shown in Table 2. The mean age of participants was 48.0 years (standard deviation [SD]: 9.6; range: 24–90), and 32.9% were either illiterate or completed only primary school education. The majority (88.7%) of participants were married, ~65% were urban employees, and 50.8% lived in the city. The mean ± SD duration of breast cancer was 38.2±40.9 months (range: 1–242 months). Also, ~48% of respondents were classified as TNM stage III and IV, and 23% breast cancers were metastatic.
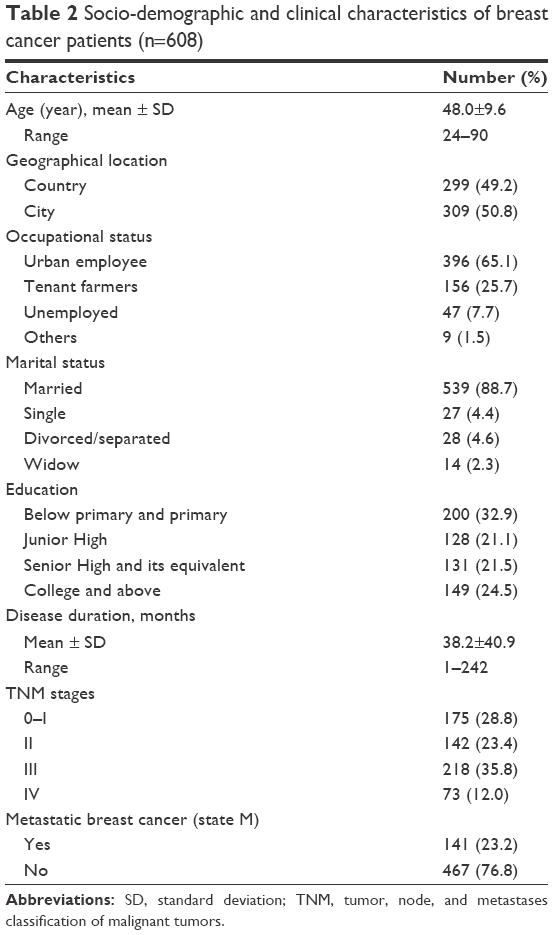 | Table 2 Socio-demographic and clinical characteristics of breast cancer patients (n=608) |
Comparison of health state utilities among four national tariffs
The mean (median) of EQ-5D-5L utility scores using the Chinese, Japanese, Korean, and UK preference weights was 0.828 (0.879), 0.802 (0.823), 0.831 (0.829), and 0.838 (0.866), respectively. Shapiro–Wilk test statistics suggested that regardless of the tariff used, the null hypothesis of normal distribution of EQ-5D-5L utility scores was rejected (P<0.001) (Figure 1). In all, ~28.6% breast cancer patients were classified to be in full health with EQ-5D-5L utility score of 1. Differences of EQ-5D-5L utilities derived from the four national tariffs were significantly different according to the Friedman test (χ2=438.952, P<0.001) (Table 3). Wilcoxon signed-rank tests were adopted in respective pairwise comparison of the four national EQ-5D-5L utility scores. The results showed that differences of median EQ-5D-5L utility scores were insignificant when scored using Chinese and UK tariffs (P>0.05) (Table 4).
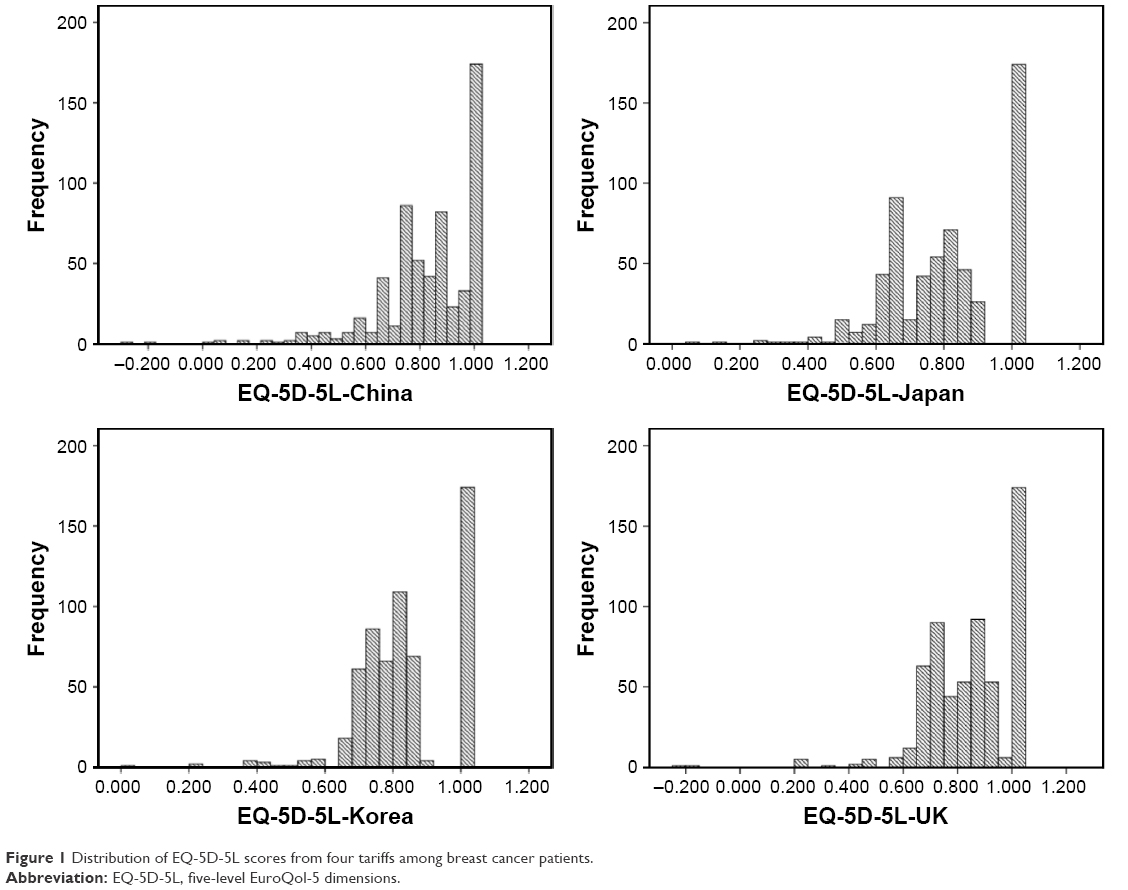 | Figure 1 Distribution of EQ-5D-5L scores from four tariffs among breast cancer patients. |
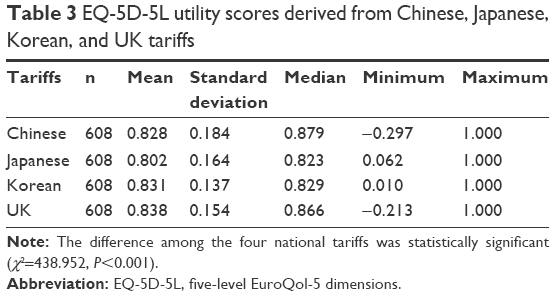 | Table 3 EQ-5D-5L utility scores derived from Chinese, Japanese, Korean, and UK tariffs |
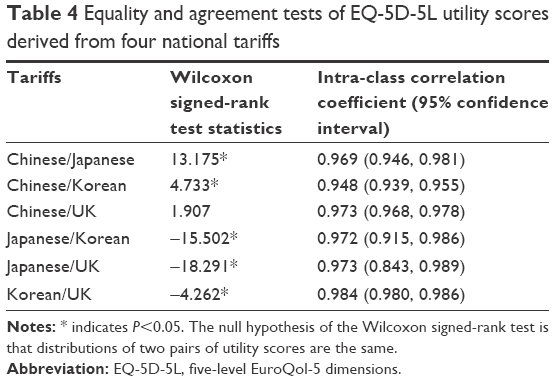 | Table 4 Equality and agreement tests of EQ-5D-5L utility scores derived from four national tariffs |
Agreement
The overall ICC was 0.984 (95% CI: 0.979–0.988), which indicates excellent agreement among the four national tariffs. The ICC values for pairwise comparisons ranged from 0.948 (between Chinese and Korean tariffs) to 0.984 (between Korean and UK tariffs) (Table 4). The Bland–Altman plots of each pair of the four EQ-5D-5L tariffs are presented in Figure 2. The mean of the utility differences and the limits of agreement are indicated by lines. As shown, the 95% limits of agreement among six pairs of comparison ranged from 0.14 to 0.28.
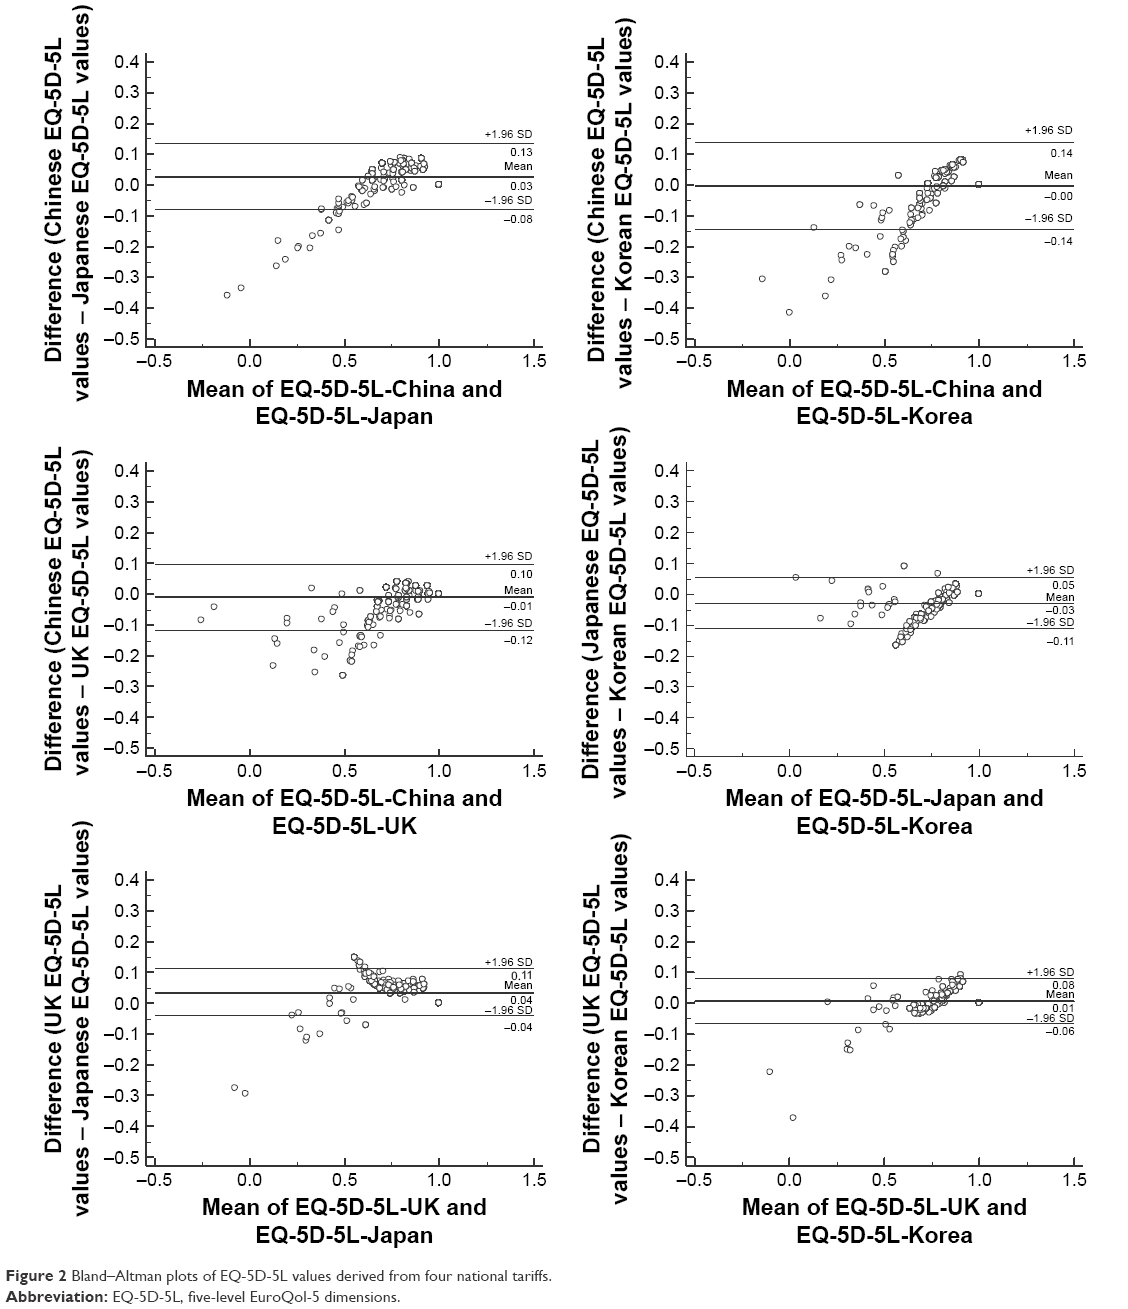 | Figure 2 Bland–Altman plots of EQ-5D-5L values derived from four national tariffs. |
Known-groups validity
Table 5 presents the Tobit model estimates for dummy variables of advanced TNM stages (panel A) and metastatic breast cancer (panel B). In panel A, as expected, breast cancer patients in TNM stages III/IV had significantly lower HSU (ranged from −0.032 to −0.040) regardless of which tariff was used (all P<0.05). Similarly, in panel B, metastatic breast cancer patients had significantly lower HSU (ranged from −0.045 to −0.067) (all P<0.05). In both panels, the magnitudes of absolute value of coefficients were the largest for Chinese tariff and the smallest for Korean tariff.
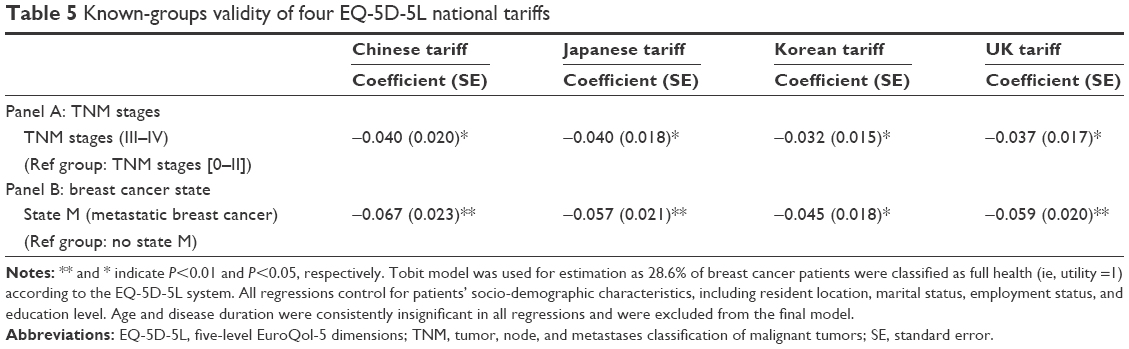 | Table 5 Known-groups validity of four EQ-5D-5L national tariffs |
Discussion
This study compared the Chinese EQ-5D-5L tariff against Japanese, Korean, and UK tariffs in a Chinese breast cancer patient sample. To our knowledge, this is the first study to apply Chinese EQ-5D-5L tariff in patients and examine the differences among the four country-specific tariffs in breast cancer patients.
The results firstly showed that the mean of the HSU score was the highest using the UK tariff, followed by Korean, Chinese, and Japanese tariffs. This finding differs from a previous study, based on the Chinese general population, using the EQ-5D-3L instrument (in which the HSU score was the highest using the Korean tariff, followed by Chinese, Japanese, and UK tariffs).26
Secondly, this study indicated excellent agreement among Chinese, Japanese, Korean, and UK EQ-5D-5L tariffs, with all ICCs >0.9. The finding is consistent with previous studies which adopted the EQ-5D-3L instrument and corresponding value sets. For example, a study based on the Chinese general population showed that the EQ-5D-3L utility scores derived using Chinese, Japanese, Korean, and UK tariffs have excellent agreement (ICC >0.75).26 In another study, the agreement between UK and Japanese tariffs was very high among Thai diabetes patients.27 Although, in general, good agreements have been reported among different country-specific tariffs, the 95% limits of agreement (0.14) from the Bland–Altman plots were still much wider than the minimally important difference (MID) of ~0.074, based on EQ-5D-3L,28 and also wider than the MID of ~0.069, based on the Chinese EQ-5D-5L tariff.29 This suggests that none of the four tariffs could be regarded as interchangeable.
Thirdly, it is found that the difference in median EQ-5D-5L utility scores was insignificant when scored using Chinese and UK tariffs. This may be because Chinese and UK tariffs were derived using similar function forms (in which 20 parameters were estimated). On the other hand, the estimated function forms of the Japanese and Korean tariffs were relatively similar, which additionally included a constant. The Korean tariff further included an N4 dummy variable which equals 1 if any of the five health dimensions contains level 4 or above, 0 otherwise.15,18–20
In an ideal scenario, the country-specific tariff should be adopted in conducting CUA.30 However, in practice, the country-specific tariff is not always available, and in such scenarios, tariffs derived from other countries can be adopted. Literature indicates that different cultures could influence the derived utility scores.31,32 Previous studies regarding the EQ-5D-3L instrument and its tariffs showed that it would be better to choose tariffs with similar cultural backgrounds.26,27,33 Our study supports previous findings about the excellent agreement on different country-specific tariffs, as well as the good known-groups validity in all four tariffs. However, the results from this study also highlight that these tariffs are not interchangeable.
There were three limitations in this study. First, the study was based on a patient sample with breast cancer; so, these results cannot be generalized to other patient populations. Second, the study was carried out in China, and the conclusion may not be generalized to other countries. Third, this is a cross-sectional study; so, we cannot assess test–retest reliability and the responsiveness to change among different country-specific tariffs.
In conclusion, there are excellent agreements among EQ-5D-5L HSU scores derived from Chinese, Japanese, Korean, and UK tariffs in breast cancer patients. However, none of them could be regarded as interchangeable. We recommend that the Chinese tariff be chosen, based on breast cancer patients in mainland China. In the absence of Chinese-specific tariff, the UK tariff is the second-best option to be applied in a Chinese population. The results of this study further contribute to the explanation of variations among country-specific tariffs.
Acknowledgments
The authors thank all the participants for their time and effort. Responsibility of any remaining errors lies solely with the authors. Financial support was provided by the Shandong Provincial Natural Science Foundation, China (ZR2013GM023).
Disclosure
The authors report no conflicts of interest in this work.
References
Earnshaw J, Lewis G. NICE guide to the methods of technology appraisal. PharmacoEconomics. 2008;26(9):725–727. | ||
Gold M, Russell L, Siegel J, Weinstein M. Cost-Effectiveness in Health and Medicine. New York: Oxford University Press; 1996. | ||
Drummond M, Sculpher M, Torrance G, O’Brien B, Stoddart G. Methods for the Economic Evaluation of Health Care Programmes. 3rd ed. New York: Oxford University Press; 2005. | ||
Torrance GW. Measurement of health state utilities for economic appraisal. J Health Econ. 1986;5(1):1–30. | ||
Brazier J, Ratcliffe J, Salomon J, Tsuchiya A. Measuring and Valuing Health Benefits for Economic Evaluation. New York: Oxford University Press; 2007. | ||
Brooks R. EuroQol: the current state of play. Health Policy. 1996;37(1):53–72. | ||
Brazier J, Roberts J, Deverill M. The estimation of a preference-based measure of health from the SF-36. J Health Econ. 2002;21(2):271–292. | ||
Feeny D, Furlong W, Torrance GW, et al. Multiattribute and single-attribute utility functions for the health utilities index mark 3 system. Med Care. 2002;40(2):113–128. | ||
Dolan P. Modeling valuations for EuroQol health states. Med Care. 1997;35(11):1095–1108. | ||
Kind P, Brooks R, Rabin R. EQ-5D Concepts and Methods: A Developmental History. The Netherlands: Springer; 2005. | ||
Zhou T, Guan H, Ma A, Liu G. Comparison between the EQ-5D-5l and the EQ-5D-3l for general population in China. Chinese Health Econ. 2016;35(3):17–20. | ||
Agborsangaya CB, Lahtinen M, Cooke T, Johnson JA. Comparing the EQ-5D 3L and 5L: measurement properties and association with chronic conditions and multimorbidity in the general population. Health Qual Life Outcomes. 2014;12(1):1–7. | ||
Herdman MC, Gudex C, Lloyd A, et al. Development and preliminary testing of the new five-level version of EQ-5D (EQ-5D-5L). Qual Life Res. 2011;20(10):1727–1736. | ||
Luo N, Li M, Liu GG, Lloyd A, de Charro F, Herdman M. Developing the Chinese version of the new 5-level EQ-5D descriptive system: the response scaling approach. Qual Life Res. 2013;22(4):885–890. | ||
Devlin N, Shah K, Feng Y, Mulhern B, Van Hout B. Valuing health-related quality of life: an EQ-5D-5L value set for England. 2016. Available from: https://www.ohe.org/publications/valuing-health-related-quality-life-eq-5d-5l-value-set-england. Accessed November 18, 2016. | ||
Badia X, Roset M, Herdman M, Kind P. A comparison of United Kingdom and Spanish general population time trade-off values for EQ-5D health states. Med Decis Making. 2001;21(1):7–16. | ||
Luo N, Johnson JA, Shaw JW, Coons SJ. A comparison of EQ-5D index scores derived from the US and UK population-based scoring functions. Med Decis Making. 2007;27(3):321–326. | ||
Kim SH, Ahn J, Ock M, et al. The EQ-5D-5L valuation study in Korea. Qual Life Res. 2016;25(7):1845–1852. | ||
Ikeda S, Shiroiwa T, Igarashi A, et al. Developing a Japanese version of the EQ-5D-5L value set. J Natl Inst Public Health. 2015;64(1):47–55. | ||
Luo N, Liu G, Li M, Guan H, Jin X, Rand-Hendriksen K. Estimating an EQ-5D-5L value set for China. Value Health. 2017;20(4):662–669. | ||
Chen W, Zheng R, Baade PD, et al. Cancer statistics in China, 2015. CA Cancer J Clin. 2016;66(2):115. | ||
Fan L, Strasser-Weippl K, Li JJ, et al. Breast cancer in China. Lancet Oncol. 2014;15(7):279–289. | ||
Fayers P, Machin D. Quality of Life: The Assessment, Analysis and Interpretation of Patient-Reported Outcomes. Wiley, Chichester, UK; 2013. | ||
Bland JM, Altman DG. Statistical methods for assessing agreement between two methods of clinical measurement. Lancet. 1986;1(8476):931–936. | ||
Zhou Z, Fang Y, Zhou Z, et al. Assessing income-related health inequality and horizontal inequity in China. Soc Indic Res. 2017;132(1):241–256. | ||
Wu C, Gong Y, Wu J, et al. Chinese version of the EQ-5D preference weights: applicability in a Chinese general population. PLoS One. 2016;11(10):e0164334. | ||
Sakthong P, Charoenvisuthiwongs R, Shabunthom R. A comparison of EQ-5D index scores using the UK, US, and Japan preference weights in a Thai sample with type 2 diabetes. Health Qual Life Outcomes. 2008;6(1):1–9. | ||
Brazier JE. Comparison of the minimally important difference for two health state utility measures: EQ-5D and SF-6D. Qual Life Res. 2005;14(6):1523–1532. | ||
McClure NS, Sayah FA, Xie F, Luo N, Johnson JA. Instrument-defined estimates of the minimally important difference for EQ-5D-5L index scores. Value Health. 2017;20(4):644–650. | ||
Galante J, Augustovski F, Colantonio L, et al. Estimation and comparison of EQ-5D health states’ utility weights for pneumococcal and human papillomavirus diseases in Argentina, Chile, and the United Kingdom. Value Health. 2011;14(5 Suppl 1):S60–S64. | ||
Bailey H, Kind P. Preliminary findings of an investigation into the relationship between national culture and EQ-5D value sets. Qual Life Res. 2010;19(8):1145–1154. | ||
Knies S, Evers SM, Candel MJ, Severens JL, Ament AJ. Utilities of the EQ-5D: transferable or not? Pharmacoeconomics. 2009;27(9):767–779. | ||
Wu YQ, Liu K, Tang X, et al. [Empirical research of measuring elderly health utility in the outskirts of Beijing by using European quality of life 5-dimensions]. Beijing Da Xue Xue Bao. 2012;44(3):397. Chinese. |
 © 2017 The Author(s). This work is published and licensed by Dove Medical Press Limited. The full terms of this license are available at https://www.dovepress.com/terms.php and incorporate the Creative Commons Attribution - Non Commercial (unported, v3.0) License.
By accessing the work you hereby accept the Terms. Non-commercial uses of the work are permitted without any further permission from Dove Medical Press Limited, provided the work is properly attributed. For permission for commercial use of this work, please see paragraphs 4.2 and 5 of our Terms.
© 2017 The Author(s). This work is published and licensed by Dove Medical Press Limited. The full terms of this license are available at https://www.dovepress.com/terms.php and incorporate the Creative Commons Attribution - Non Commercial (unported, v3.0) License.
By accessing the work you hereby accept the Terms. Non-commercial uses of the work are permitted without any further permission from Dove Medical Press Limited, provided the work is properly attributed. For permission for commercial use of this work, please see paragraphs 4.2 and 5 of our Terms.