")
Back to Journals » Clinical, Cosmetic and Investigational Dermatology » Volume 15
Comparison of Epidermal Gene Expression Profiles in Mice Aged 1 to 20 Months
Authors Wang X, Wen S, Ye L, Liu D, Man MQ , Yang B
Received 8 November 2021
Accepted for publication 20 December 2021
Published 16 January 2022 Volume 2022:15 Pages 69—76
DOI https://doi.org/10.2147/CCID.S346416
Checked for plagiarism Yes
Review by Single anonymous peer review
Peer reviewer comments 2
Editor who approved publication: Dr Jeffrey Weinberg
Xiaohua Wang,1,2 Si Wen,2 Li Ye,2 Dan Liu,2 Mao-Qiang Man,2 Bin Yang1,2
1Department of Dermatology, Jinan University, Guangzhou City, Guangdong Province, People’s Republic of China; 2The Dermatology Hospital, Southern Medical University, Guangdong, 510091, People’s Republic of China
Correspondence: Bin Yang
The Dermatology Hospital, Southern Medical University, 2 Lujing Road, Guangzhou, 510091, People’s Republic of China
Email [email protected]
Introduction: Although it is well known that epidermal function changes with aging, the transcriptomic basis and possible signaling pathways for aging-associated functional changes remain largely unknown.
Methods: Here, we employed RNA sequencing techniques to assess epidermal gene expression profiles in the epidermis of mice aged 1, 2, 6, 12 and 20 months.
Results: A total of 132 genes displayed reductions in expression levels with aging, while expression levels of 406 genes increased with aging. Epidermal gene expression was prominently upregulated in 2-month-old vs 1-month-old mice, while more genes were downregulated in 12-month-old mice. Upregulation of genes associated with immune/inflammatory responses was observed in the epidermis of aged mice in comparison to that of young mice, whereas downregulated signaling pathways in the epidermis of aged mice were primarily involved in metabolism, such as fatty acid elongation, glutathione metabolism and biosynthesis of antibiotics. Some signaling pathways, such as chemokine signaling, cytokine/cytokine receptor interaction signaling and IL-17 signaling pathways, were remarkably upregulated in 12-month-old mice. Steroid synthesis, metabolic pathway, thermogenesis and proteasome pathways were steadily downregulated, starting at 2 months old.
Conclusion: These results indicate that the epidermis of aged mice displays an upregulation of genes associated with inflammatory signaling pathways, and downregulation of genes related to metabolic signaling pathways.
Keywords: aging, epidermis, gene expression
Introduction
The epidermis provides an essential barrier, protecting the body from exogenous insults, including physical, chemical and biological insults, and preventing excessive loss of body fluid. Epidermal function changes over the lifetime. As compared to the epidermis of young individuals, the aged epidermis displays multiple changes in epidermal biophysical properties, including delayed recovery of the epidermal permeability barrier, reduced levels of stratum corneum hydration and elevated skin surface pH, resulting from reductions in the expression levels of mRNA, proteins and enzymes (and/or their activity) associated with the formation of epidermal structure and function.1 Epidermal functions are largely determined by keratinocyte functions, which are coregulated by a number of molecules and/or signaling pathways. However, the aging-associated changes in mRNA expression and signaling pathways are far less well known, although aging-associated changes in the expression levels of some genes in the epidermis have been reported.2,3 In the present study, we performed RNA sequencing analysis to elucidate gene expression profiles in the epidermis of mice at various ages.
Materials and Methods
Animals and Sample Collection
A total of 25 C57BL/6J female mice were purchased from Guangdong Medical Laboratory Animal Center, and were housed in the same room at the animal facility of the Dermatology Hospital of Southern Medical University, China. Because previous studies demonstrated that both stratum corneum hydration levels and sebum content in humans peak at the age of 30–40 years, followed by a decline,4 we performed RNA sequencing in the epidermis of mice aged 1, 2, 6, 12 and 20 months, which are approximately equivalent to 14, 20, 34, 58 and 70 years old, respectively, in humans.5 Five mice were used in each group, except in the 1-month-old group (N=3), because two mice died before the start of the experiment. Following collection of skin samples from both flanks of mice aged 1, 2, 6, 12 and 20 months, the epidermis was separated from the dermis by a method of heat separation, as described previously.6 About 50 mg of tissue was collected in a 2 mL tube filled with 1 mL of cooled trizol.
This work was reviewed and approved by the Institutional Review Board of the Dermatology Hospital before the study, and experiments were carried out in accordance with their guidelines for the welfare and treatment of animals.
Total RNA Extraction
Tissues were homogenized with an IKA T10 homogenizer on ice. According to the manufacturer’s instructions, Trizol (Thermo Fisher Scientific, USA; Lot: 252612) and RNeasy Plus mini kits (Qiagen, Germany; Lot: 166012799) were used to extract total RNA from the epidermis. The quantity and quality of total RNA were determined with a Nano Drop and Agilent 2100 bioanalyzer (Thermo Fisher Scientific, MA, USA).
mRNA Library Construction and Sequencing
After purification of mRNA with Oligo (dT)-attached magnetic beads, purified mRNA was fragmented into small pieces with fragmentation buffer at the appropriate temperature. The random hexamer-primed reverse transcription technique was used to generate first-strand cDNA, followed by synthesis of second-strand cDNA. Then, A-Tailing Mix and RNA Index Adapters were added with incubation for end repair. The product of cDNA fragments was amplified by PCR, followed by purification with Ampure XP Beads and dissolution in EB solution. An Agilent Technologies 2100 bioanalyzer was used to validate the quality of cDNA fragments. The double-stranded PCR products from the previous step were denatured by heat and circularized by the splint oligo sequence to generate the final library. The single-stranded circular DNA was formatted as the final library. Phi29 DNA polymerase was used to make DNA nanoballs, which have more than 300 copies per molecule. DNA nanoballs were loaded onto the patterned nanoarray, and single-end 50-base reads were generated on the BGIseq500 platform (BGI-Shenzhen, China).
Analysis of RNA-Seq Data
The sequencing data were filtered with SOAPnuke (v1.5.2)7 by 1) removing reads containing the sequencing adapter; 2) removing reads with a low-quality base ratio (base quality ≤5) of more than 20%; and 3) removing reads with an unknown base (“N” base) ratio of >5%. Afterwards, clean reads were obtained and stored in FASTQ format. The clean reads were mapped onto the current Mus musculus genome (GCF_000001635.26_GRCm38.p6) using HISAT2 (v2.0.4).8 Bowtie2 (v2.2.5) was applied to align the clean reads to the reference coding gene set.9 The expression levels of genes were calculated with RSEM (v1.2.12).10
Identification of Differentially Expressed Genes (DEGs)
The Bioconductor package DESeq2 (v1.4.5) was used to identify DEGs between the groups.11 Genes with a Q value ≤0.05 were considered as DEGs. |log2 (fold change)| ≥1 between the compared groups was set as the threshold for significantly differentially expressed mRNA. According to the gene expression in different samples, ClustVis 2.0 software (https://biit.cs.ut.ee/clustvis/) was used to draw heatmaps and to process data for principal component analysis (PCA).
Functional Enrichment Analysis of DEGs
In order to comprehensively analyze the biological functions of DEGs, Gene Ontology (GO) (http://www.geneontology.org/) and Kyoto Encyclopedia of Genes and Genomes (KEGG) (https://www.kegg.jp/) enrichment analysis of annotated DEGs were performed using Phyper (https://en.wikipedia.org/wiki/Hypergeometric_distribution) based on the hypergeometric test.12–14 All pathways and terms were grouped into different categories based on their physiological roles and functions. The enrichments of upregulated and downregulated genes were analyzed separately. The significance levels of pathways and terms were corrected by a false discovery rate (FDR)-adjusted P value (Q value) with a rigorous threshold (Q ≤0.05) by Bonferroni correction.15
Trend Analysis
Trend analysis was aimed at the expression of all mRNAs according to their temporal profiles (1, 2, 6, 12 and 20 months [1M/2M/6M/12M/20M]) to cluster genes with similar expression patterns. Trend analysis was performed using the software Mfuzz (v2.34.0),16 a package of the R programming language. The optimal number of clusters was determined using a combination of several cluster validation indices. Then, enrichment analyses of GO terms and KEGG pathways were carried out for each trend. Those GO terms and KEGG pathways with Q values ≤0.05 were defined as significant.
Results
Aging-Associated Changes in Epidermal Gene Expression
We first assessed gene expression in the epidermis of mice at various ages. After filtering the sequencing data with SOAPnuke (v1.5.2), excluding expression levels ≤0.5, the total numbers of genes detected in the epidermis of mice aged 1, 2, 6, 12 and 20 months were 12,960, 13,342, 13,426, 13,476 and 13,493, respectively. PCA showed that PCA1 and PCA2 comprised 51.9% and 11.7%, respectively (Figure 1). We next determined the changes in gene expression with aging. A total of 538 genes displayed changes in expression levels with aging, including 132 downregulated and 406 upregulated genes (Table S1 and Figure 2). Notably, aging-associated declines in expression levels of genes were primarily associated with protein synthesis (Yars), energy metabolism (Pank1), immune function (Carmil2) and permeability barrier (Spink7), while expression levels of genes related to cancer development (Prdm8, Steap2, Dpep1) and inflammation (Tnfsf18, Cytl1) were increased with aging (Table S1 and Figure 2).
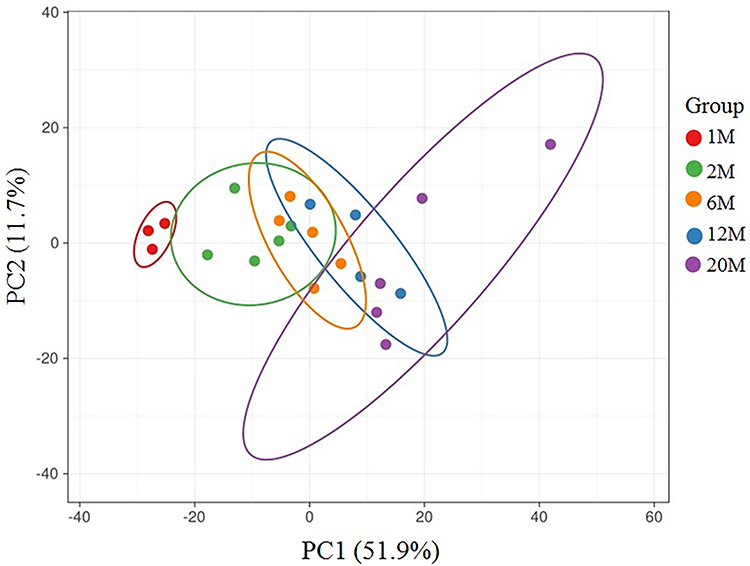 |
Figure 1 Results of the principal component analysis. |
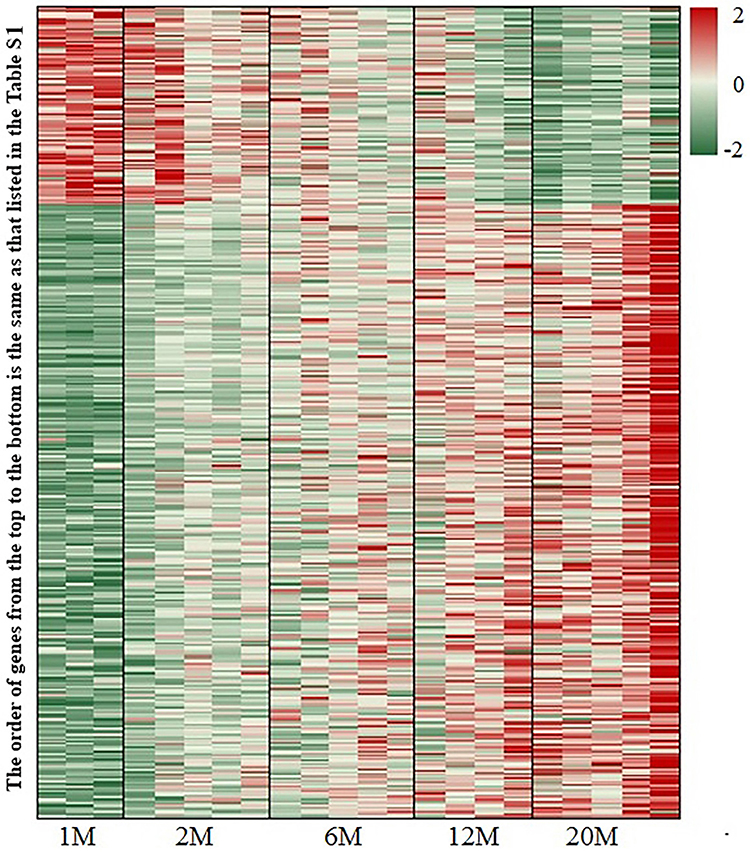 |
Figure 2 Changes in expression levels of genes in the epidermis of mice from 1 to 20 months old. The order of genes from the top to the bottom in the figure is the same as that listed in Table S1. N=3 for 1-month-old mice, N=5 for all other age groups. |
Most Prominent Changes in Number of Genes are Observed in 2-Month-Old vs 1-Month-Old Mice
We next identified DEGs between age groups. Only the genes with ≥2-fold changes in expression levels between the compared groups with adjusted p≤0.05 were assigned as DEGs. As shown in Figure 3, dramatic changes in DEGs were observed in the epidermis of 2-month-old vs 1-month-old mice (513 upregulated and 186 downregulated genes with adjusted p≤0.05). A small number of genes changed between 6-month-old and 12-month-old mice (68 upregulated and 26 downregulated genes with adjusted p≤0.05). From 12 to 20 months, more genes were downregulated than upregulated (121 upregulated and 182 downregulated genes with adjusted p≤0.05). These results demonstrate that epidermal gene expression was prominently upregulated in 2-month-old vs 1-month-old mice, while the increasing number of downregulated genes after 12 months of age likely contributed to an aging-associated decline in epidermal function.
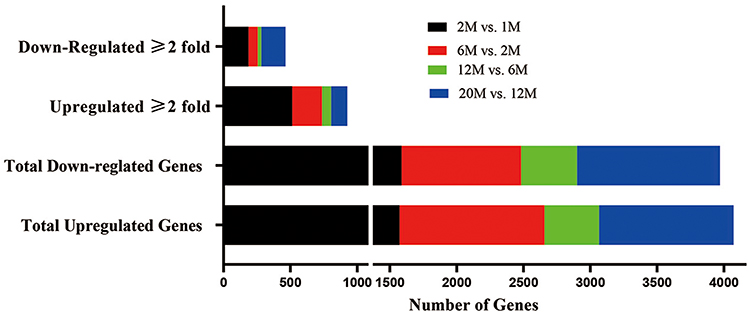 |
Figure 3 Changes in the number of expressed genes between groups. |
Trend of Aging-Associated Changes in Signaling Pathways
To reveal the biological significance of DEGs in the epidermis, we performed KEGG enrichment analysis. All pathways and terms were grouped into different categories based on their physiological roles and functions. The enrichments of upregulated and downregulated genes were analyzed separately. In comparison to 1-month-old mouse epidermis, most of the aging-associated upregulation of signaling pathways comprised immune/inflammatory responses such as chemokine signaling, cytokine–cytokine receptor interaction and cell adhesion, while downregulated signaling pathways were mainly involved in metabolism, such as fatty acid elongation, glutathione metabolism and biosynthesis of antibiotics (Figure 4A and B). Some signaling pathways, including chemokine signaling, cytokine/cytokine receptor interaction signaling and IL-17 signaling pathways, were remarkably upregulated in 12-month-old mice, followed by a lesser extent of upregulation. In contrast, the signaling pathway of cell adhesion was constantly upregulated, starting at 2 months old. Among the downregulated pathways, steroid synthesis, metabolic pathway, thermogenesis and proteasome pathways were steadily downregulated, starting at 2 months old. These results demonstrate the aging-associated upregulation of inflammatory signaling pathways and downregulation of metabolic signaling pathways.
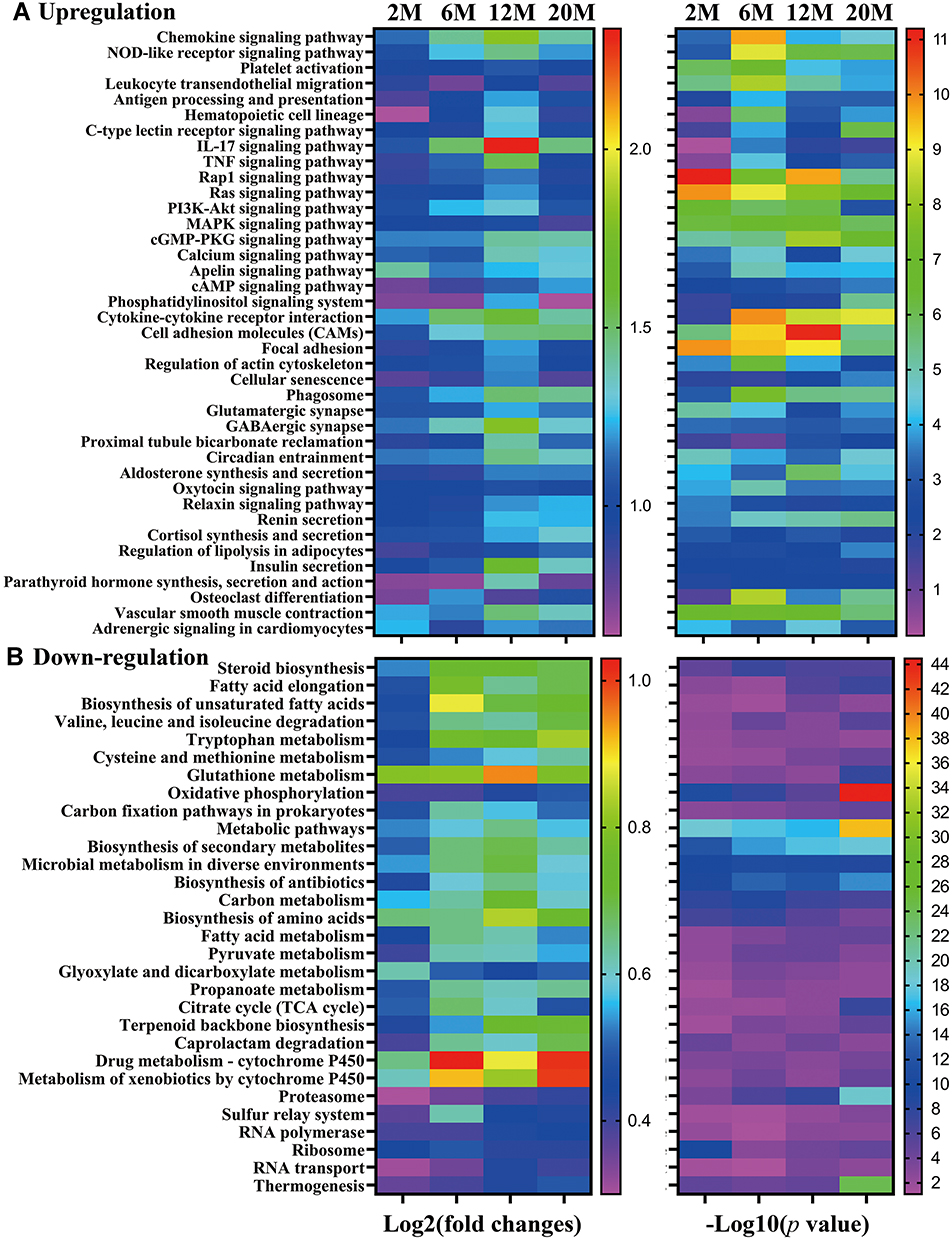 |
Figure 4 Trend of changes in signaling pathways in the epidermis of mice from 1 to 20 months old. Data are expressed as changes from 1-month-old mice. (A and B) Aging-associated upregulation and downregulation of signaling pathways, respectively. The left panel shows the fold changes over the 1-month-old mice, while the right panel indicates the significance of changes. N=3 for 1-month-old mice, N=5 for all other age groups. |
To determine the functional characteristics of genes changed with aging, we performed GO term enrichment analysis on those genes with ≥2-fold change and adjusted p<0.05. A greater increase in the number of upregulated genes involved in developmental, cellular and metabolic processes was observed in 2-month-old vs 1-month-old mice, followed by a lesser increase in other age groups (Tables 1, S2 and S3). In contrast, more downregulated genes were found in 12-month-old vs 6-month-old mice. These results indicate that upregulation of most genes occurs at 2 months, while downregulation of most genes starts at 12 months of age.
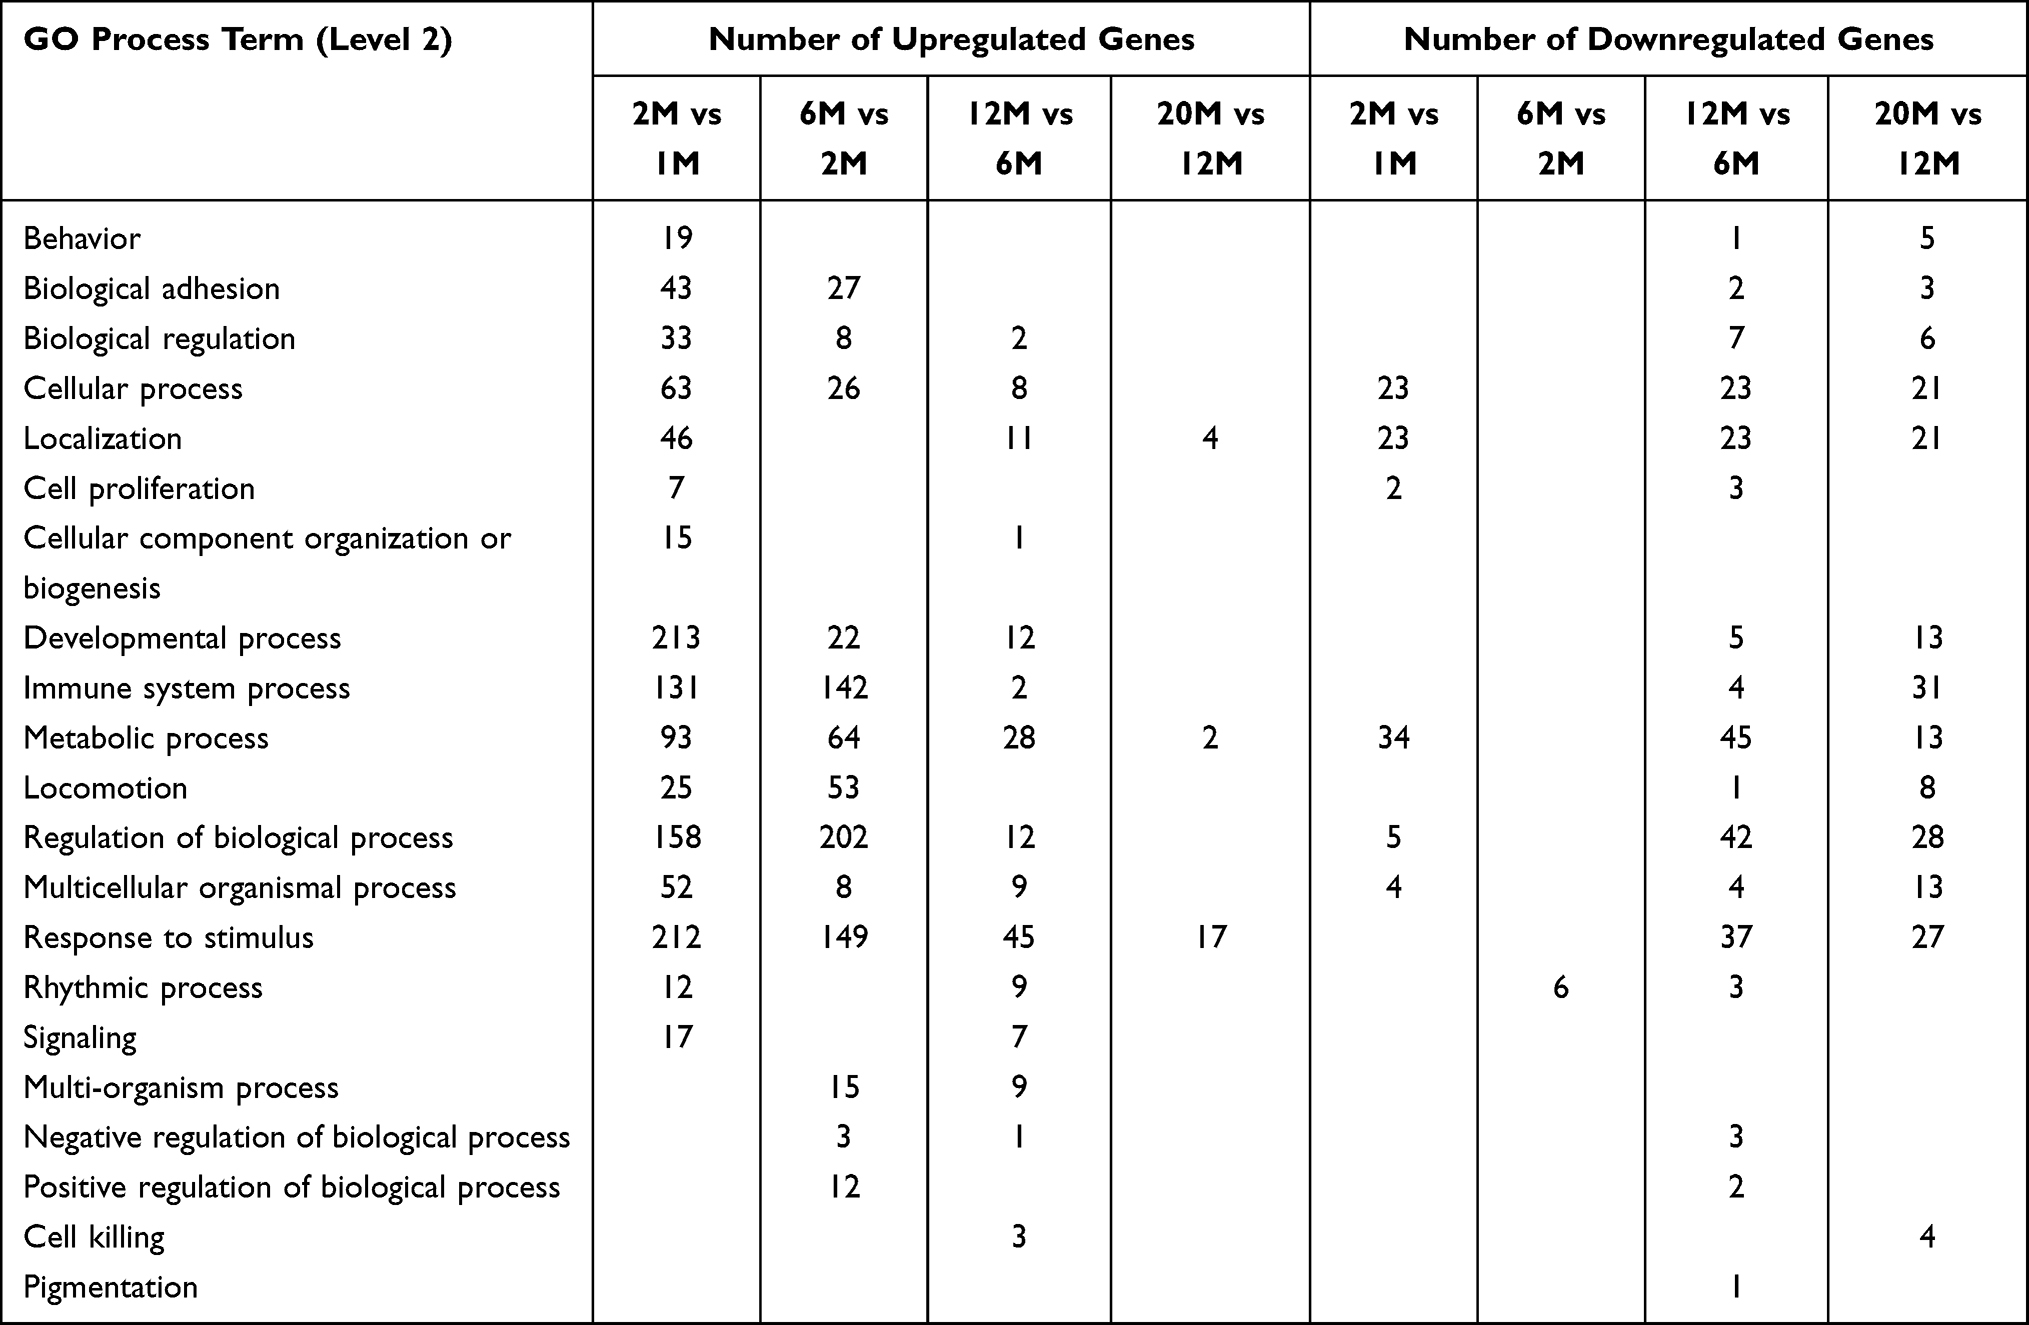 |
Table 1 GO Term Enrichment |
Discussion
Epidermal functions change over the lifetime. The more noticeable changes include increased expression levels of pro-inflammatory cytokines, delayed permeability barrier recovery, elevated skin surface pH and delayed wound healing.1,17,18 However, information about the transcriptomic basis for these functional changes is limited. Previous research showed that over 1600 genes were differentially expressed with chronological aging in the whole skin of human females.19 In contrast, we identified only 538 genes that were differentially expressed with aging in the mouse epidermis. The discrepant results may be due to the differences between humans and mice, and between the whole skin and the epidermis. We used the mouse epidermis here, whereas whole human skin was used in the other study. We demonstrated here that most of signaling pathways that were upregulated with aging are involved in inflammation, providing a transcriptomic basis for the elevated expression levels of pro-inflammatory cytokines in the aged epidermis. Signaling pathways related to metabolism, including fatty acid synthesis and antioxidation, were downregulated with aging. These results are consistent with previous findings in humans.19,20 Aging-associated downregulation of lipid synthesis can contribute, in part, to compromised epidermal function, such as delayed permeability barrier recovery in chronologically aged skin.1
The GO term enrichment analysis revealed that most of the significantly upregulated genes occurred in 2-month-old vs 1-month-old mice, followed by smaller increases, suggesting the accelerated maturation of epidermal function in 2-month-old vs 1-month-old mice. The appearance of most downregulated genes started at 12 months of age, which is in agreement with the previous findings that epidermal function declines from the age of 50 years in humans.4,21 These results further suggest that anti-skin aging regimens should be deployed before or at the age of 50 years. The underlying mechanisms through which gene expression is altered with aging are not clear. Because we used mice housed in a specific pathogen-free facility without exposure to sunlight or the environment outside the animal facility, the changes in gene expression with aging are unlikely attributable to either UV irradiation or other environmental factors, but are more likely a natural characteristic of chronological aging. However, aging-associated changes in gene expression caused by chronic exposure of the skin to exogenous insults, such as microbes and repeated physical and psychological stress, cannot be excluded. Nevertheless, the present study clearly demonstrates aging-associated changes in gene expression and signaling pathways.
Conclusions
Epidermal gene expression changes with aging in mice. Changes in inflammation-associated signaling pathways are upregulated, while metabolic signaling pathways are downregulated with aging. Whether modulation of the signaling pathways that change with aging can prevent and/or mitigate aging-associated alterations in epidermal function remains to be explored.
Ethics Approval
This work was reviewed and approved by the Institutional Review Board of the Dermatology Hospital before the study, and experiments were carried out in accordance with the guidelines for the ethical review of laboratory animal welfare People’s Republic of China National Standard GB/T 35892-2018.
Disclosure
All authors declare no conflicts of interest.
References
1. Wang Z, Man MQ, Li T, Elias PM, Mauro TM. Aging-associated alterations in epidermal function and their clinical significance. Aging. 2020;12(6):5551–5565. doi:10.18632/aging.102946
2. Ishii MA, Miyachi KJ, Cheng B, Sun BK. Aging-associated decline of epidermal PSMD8 contributes to impaired skin function. J Invest Dermatol. 2018;138(4):976–978. doi:10.1016/j.jid.2017.10.034
3. Rinnerthaler M, Streubel MK, Bischof J, Richter K. Skin aging, gene expression and calcium. Exp Gerontol. 2015;68:59–65. doi:10.1016/j.exger.2014.09.015
4. Man MQ, Xin SJ, Song SP, et al. Variation of skin surface pH, sebum content and stratum corneum hydration with age and gender in a large Chinese population. Skin Pharmacol Physiol. 2009;22(4):190–199. doi:10.1159/000231524
5. Age Converter. Mouse age calculator. Available from: http://www.age-converter.com/mouse-age-calculator.html.
6. Mao-Qiang M, Elias PM, Feingold KR. Fatty acids are required for epidermal permeability barrier function. J Clin Invest. 1993;92(2):791–798. doi:10.1172/JCI116652
7. Li R, Li Y, Kristiansen K, Wang J. SOAP: short oligonucleotide alignment program. Bioinformatics. 2008;24(5):713–714. doi:10.1093/bioinformatics/btn025
8. Kim D, Langmead B, Salzberg SL. HISAT: a fast spliced aligner with low memory requirements. Nat Methods. 2015;12(4):357–360. doi:10.1038/nmeth.3317
9. Langmead B, Salzberg SL. Fast gapped-read alignment with Bowtie 2. Nat Methods. 2012;9(4):357–359. doi:10.1038/nmeth.1923
10. Li B, Dewey CN. RSEM: accurate transcript quantification from RNA-Seq data with or without a reference genome. BMC Bioinform. 2011;12:323. doi:10.1186/1471-2105-12-323
11. Love MI, Huber W, Anders S. Moderated estimation of fold change and dispersion for RNA-seq data with DESeq2. Genome Biol. 2014;15(2):550. doi:10.1186/s13059-014-0550-8
12. Kanehisa M, Araki M, Goto S, et al. KEGG for linking genomes to life and the environment. Nucleic Acids Res. 2008;36(Databaseissue):D480–4. doi:10.1093/nar/gkm882
13. Ashburner M, Ball CA, Blake JA, et al. Gene ontology: tool for the unification of biology. The Gene Ontology Consortium. Nat Genet. 2000;25(1):25–29. doi:10.1038/75556
14. Zhong S, Xie D. Gene Ontology analysis in multiple gene clusters under multiple hypothesis testing framework. Artif Intell Med. 2007;41(2):105–115. doi:10.1016/j.artmed.2007.08.002
15. Abdi H. Bonferroni and Šidák corrections for multiple comparisons. Encycl Meas Stat. 2007;3:103–107.
16. Kumar L, Futschik ME. Mfuzz: a software package for soft clustering of microarray data. Bioinformation. 2007;2(1):5–7. doi:10.6026/97320630002005
17. Hu LZ, Mauro TM, Dang E, et al. Epidermal dysfunction leads to an age-associated increase in levels of serum inflammatory cytokines. J Invest Dermatol. 2017;137(6):1277–1285. doi:10.1016/j.jid.2017.01.007
18. Gerstein AD, Phillips TJ, Rogers GS, Gilchrest BA. Wound healing and aging. Dermatol Clin. 1993;11(4):749–757. doi:10.1016/S0733-8635(18)30227-4
19. Glass D, Viñuela A, Davies MN, et al. Gene expression changes with age in skin, adipose tissue, blood and brain. Genome Biol. 2013;14(7):R75. doi:10.1186/gb-2013-14-7-r75
20. Viñuela A, Brown AA, Buil A, et al. Age-dependent changes in mean and variance of gene expression across tissues in a twin cohort. Hum Mol Genet. 2018;27(4):732–741. doi:10.1093/hmg/ddx424
21. Choi EH, Man MQ, Xu P, et al. Stratum corneum acidification is impaired in moderately aged human and murine skin. J Invest Dermatol. 2007;127(12):2847–2856. doi:10.1038/sj.jid.5700913
 © 2022 The Author(s). This work is published and licensed by Dove Medical Press Limited. The full terms of this license are available at https://www.dovepress.com/terms.php and incorporate the Creative Commons Attribution - Non Commercial (unported, v3.0) License.
By accessing the work you hereby accept the Terms. Non-commercial uses of the work are permitted without any further permission from Dove Medical Press Limited, provided the work is properly attributed. For permission for commercial use of this work, please see paragraphs 4.2 and 5 of our Terms.
© 2022 The Author(s). This work is published and licensed by Dove Medical Press Limited. The full terms of this license are available at https://www.dovepress.com/terms.php and incorporate the Creative Commons Attribution - Non Commercial (unported, v3.0) License.
By accessing the work you hereby accept the Terms. Non-commercial uses of the work are permitted without any further permission from Dove Medical Press Limited, provided the work is properly attributed. For permission for commercial use of this work, please see paragraphs 4.2 and 5 of our Terms.