")
Back to Journals » Clinical Ophthalmology » Volume 10
Comparison of choroidal thickness measurements between spectral-domain OCT and swept-source OCT in normal and diseased eyes
Authors Zafar S, Siddiqui MAR, Shahzad R
Received 12 July 2016
Accepted for publication 27 September 2016
Published 14 November 2016 Volume 2016:10 Pages 2271—2276
DOI https://doi.org/10.2147/OPTH.S117022
Checked for plagiarism Yes
Review by Single anonymous peer review
Peer reviewer comments 3
Editor who approved publication: Dr Scott Fraser
Sidra Zafar,1 MA Rehman Siddiqui,2,3 Rida Shahzad1
1Medical College, Aga Khan University Hospital, 2Department of Ophthalmology, Shahzad Eye Hospital, 3South City Hospital, Karachi, Pakistan
Purpose: Sub-foveal choroidal thickness (SFCT) is affected in many ocular diseases. The aim of this study was to compare SFCT measurements between Topcon 3D 2000 spectral-domain optical coherence tomography (SD-OCT) and Topcon swept-source OCT (SS-OCT), with different laser wavelengths, in normal and diseased populations.
Materials and methods: This was a prospective, cross-sectional, noninterventional study including 27 normal volunteers and 27 participants with retinal disease. OCT scans were performed sequentially and under standardized conditions using both SD-OCT and SS-OCT. The OCT scans were evaluated by two independent graders. Paired t-tests and intraclass correlation coefficients (ICCs) were used to assess the statistically significant difference between SFCT measurements as measured by the two devices.
Results: Mean SFCT measurements for all 54 participants were 264.9±103.1 µm using SD-OCT (range: 47–470 µm) and 278.5±110.5 µm using SS-OCT (range: 56–502 µm), with an inter-device ICC of 0.850. Greater variability was noted in the diseased eyes. Inter-device ICCs were 0.870 (95% CI; 0.760–0.924) and 0.840 (95% CI; 0.654–0.930) for normal and diseased eyes, respectively. However, the difference was not statistically significant (P=0.132).
Conclusion: Both machines reliably measure SFCT. Larger studies are needed to confirm these findings.
Keywords: choroidal imaging, diseased, normal, SD-OCT, SS-OCT
Introduction
The choroid is a thin, highly vascularized layer between the sclera and retina, which plays an important role in ocular metabolism and temperature regulation.1,2 Choroidal changes such as thickening, thinning and hyperpermeability are known to play a role in the pathophysiology of various ocular diseases including age-related macular degeneration (ARMD), glaucoma, central serous chorioretinopathy and pathological myopia.3 Therefore, evaluation of sub-foveal choroidal thickness (SFCT) as well as information about topographical variation of choroidal thickness in various diseases is important in understanding their pathophysiology. Traditional modalities such as ultrasonography, because of their limited resolution and low repeatability, have limited role in the assessment of the choroid.4,5
A significant development in ocular imaging was the introduction of optical coherence tomography (OCT) that allowed high-quality imaging of ocular structures. The enhanced depth imaging (EDI) protocol was first introduced by Spaide et al6 in 2008 that allowed better visualization of the choroid.5,6 They showed that by placing the zero-delay line closer to the eye, an inverted image of the choroid may be produced. However, the enhanced choroidal resolution comes at the expense of decreased retinal clarity.
Swept-source OCT (SS-OCT) uses a longer wavelength of 1,050 nm laser that allows deeper penetration because of low light scattering. In addition, the ability of SS-OCT to accommodate more A-scans per frame results in a much faster rate of image acquisition. Faster sweeping rates decrease imaging artifacts due to eye movements and also allow evaluation of a large area/volume. Commercially available SS-OCT machines are also capable of creating automatic choroidal volumes and thickness measurements, which was not possible with spectral-domain (SD-OCT) machines.3,7,14
The aim of this study was to compare the differences in SFCT measurements between SD-OCT and SS-OCT in normal and diseased eyes.
Materials and methods
This was a prospective, cross-sectional, noninterventional study carried out at Shahzad Eye Hospital, Karachi, Pakistan, from May 2015 to September 2015. The hospital’s ethics review committee reviewed and approved the study. All the procedures performed in this study were in accordance with the ethical standards of the institutional research committee and the Declaration of Helsinki. Written informed consent was obtained from all the participants. A total of 54 participants were included, comprising normal volunteers and patients with posterior segment diseases.
For normal participants, the inclusion criteria were an age range of 20–60 years, normal visual acuity and a normal fundus on OCT examination. The exclusion criteria were history of ocular and systemic diseases and prior intraocular surgery or intraocular injections.
The OCT devices compared in our study were as follows: 1) SD-OCT machine (Topcon 3D 2000; Topcon Inc., Tokyo, Japan) and 2) SS-OCT machine (Triton; Topcon Inc.). The SS-OCT has a scanning speed of 100,000 A-scans/sec. Using a wavelength of 1,050 nm, it can penetrate deeper, visualizing ocular tissues such as the choroid or even the sclera. In comparison, the conventional SD-OCT utilizes a wavelength of 850 nm and has an image acquisition rate of 50,000 A-scans/sec.
All scans were performed by a single trained operator under standardized conditions and at a fixed time range (14:00–18:00) to reduce the influence of diurnal variation on choroidal thickness. All participants underwent sequential scanning by the two machines at the same sitting. The machines were used in random order. Right eye scans were performed first. Scans were read by trained medical staff.
A standardized imaging protocol was followed for all scans. For manual estimation of choroidal thickness, line scans were performed on both SD-OCT and SS-OCT. The single-“line” protocol averages 50 B-scans and generates a 6 mm line on the SD-OCT device and a 12 mm line with 96 B-scans on the SS-OCT device. Only on the SS-OCT device, an additional 7×7 scanning protocol was performed. This was used for automatic choroidal thickness measurements.
Acquired images were required to have a minimum score of 45. Poor quality images that did not meet expectations were immediately repeated. SFCT was defined as a perpendicular distance from the lower border of retinal pigment epithelium–Bruch’s membrane complex to the sclerochoroidal interface (SCI), which was measured sub-foveally. SFCT was measured independently by two graders using built-in caliper tool available on both the OCT devices. Automatic choroidal thickness measurements were ascertained using the built-in software on the SS-OCT device.
For statistical analysis, one eye of each patient was selected. In normal volunteers, this was performed randomly. In patients with ocular diseases, the more severely affected eye or the one with active disease was chosen. SPSS 20 (SPSS Inc., Chicago, IL, USA) was used for statistical analysis. The differences in choroidal thickness between the two machines were analyzed using paired t-tests. A P-value <0.05 was considered statistically significant. Intraclass correlation coefficients (ICCs) with 95% confidence interval (CI) were used to assess intra-grader, inter-grader and inter-device reliability.
Results
A total of 54 eyes of 54 patients were evaluated, of which 24 were right eyes (12 normal and 12 diseased). The mean age of all the participants was 42.6±14.7 years (range: 20–75 years) and 32 were male (Table 1). A total of 27 normal volunteers and 27 patients with retinal disease were included; nine had diabetic macular edema, seven had ARMD, four had epiretinal membranes, three had cystoid macular edema, two had central serous retinopathy (CSR) and one each with full-thickness macular hole and rhegmatogenous retinal detachment.
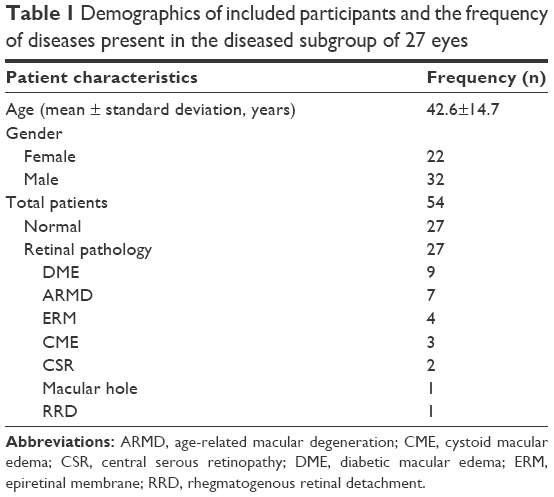 | Table 1 Demographics of included participants and the frequency of diseases present in the diseased subgroup of 27 eyes |
Evaluating all 54 eyes using manual measurements, the mean SFCT was calculated as 264.9±103.1 μm using SD-OCT (range: 47–470 μm) and 278.5±110.5 μm using SS-OCT (range: 56–502 μm). However, the differences in choroidal thickness measured by SD-OCT and SS-OCT were not statistically significant (P=0.132). Intra-reader and inter-reader reliability coefficients were high for both devices. Intra-reader ICCs for normal eyes were 0.988 (95% CI: 0.981–0.993) and 0.966 (95% CI: 0.948–0.979) for SD-OCT, and 0.992 (95% CI: 0.987–0.995) and 0.985 (95% CI: 0.975–0.992) for SS-OCT. For diseased eyes, intra-reader ICCs were 0.957 (95% CI: 0.918–0.980) and 0.956 (95% CI: 0.916–0.978) for SD-OCT and 0.988 (95% CI: 0.980–0.993) and 0.998 (95% CI: 0.996–0.999) for SS-OCT. Inter-reader ICCs for normal eyes were 0.920 (95% CI: 0.862–0.953) and 0.923 (95% CI: 0.857–0.958) for SD-OCT and SS-OCT, respectively. In diseased eyes, inter-reader ICCs were 0.842 (95% CI: 0.654–0.928) for SD-OCT and 0.90 (95% CI: 0.790–0.953) for SS-OCT. Inter-device ICCs were 0.870 (0.760–0.924) and 0.840 (95% CI: 0.654–0.930) for normal and diseased eyes, respectively (Table 2).
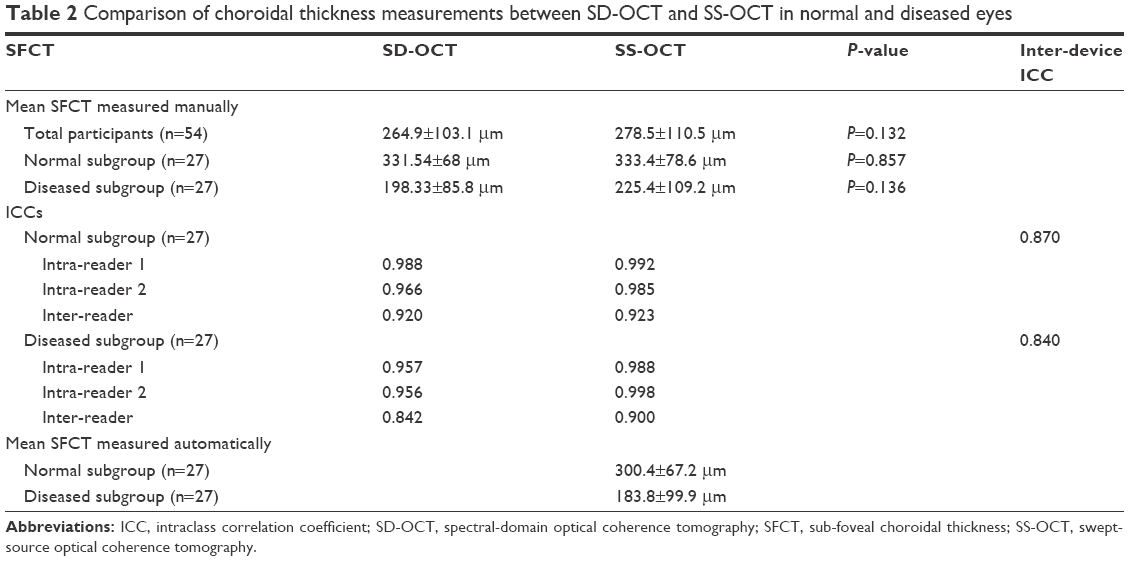 | Table 2 Comparison of choroidal thickness measurements between SD-OCT and SS-OCT in normal and diseased eyes |
For normal participants, mean SFCT measured manually with SD-OCT was 331.54±68 μm (range; 175–470 μm) and with SS-OCT was 333.4±78.6 μm (166–502 μm; P=0.857). Mean SFCT in diseased eyes was 198.33±85.8 μm with the SD-OCT device (47–369 μm) and 225.4±109.2 μm with the SS-OCT device (56–492 μm; P=0.136).
Mean automatic SFCT measured by SS-OCT in the normal subjects was 300.4±67.2 μm. In the diseased participants, it was measured at 183.8±99.9 μm. The ICCs for manual and automatic choroidal thickness using SS-OCT were 0.932 (95% CI; 0.834–0.980) for normal eyes and 0.919 for diseased eyes (0.828–0.962). Bland–Altman plots comparing choroidal thickness measurements for the normal and diseased groups are shown in Figure 1.
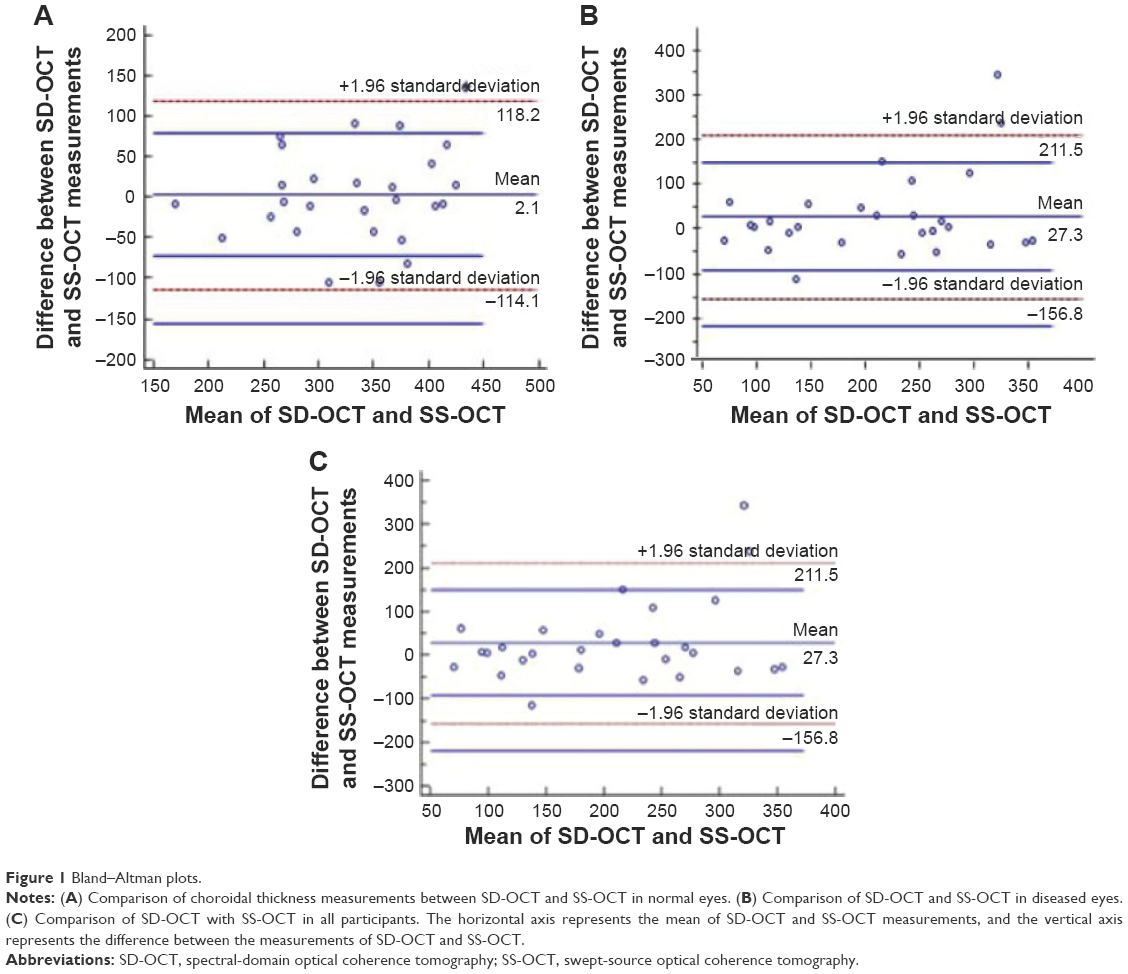 | Figure 1 Bland–Altman plots. |
Discussion
The choroid is a highly vascularized structure that plays an essential role in ocular nourishment.1,2 It consists of five layers; the innermost Bruch’s membrane, choriocapillaris, Sattler’s layer, Haller’s layer and SCI.8 Measuring choroidal thickness can be challenging because of the variability that exists with diurnal influences, age and ocular pathology. Although the use of SD-OCT with EDI technique improved the quality of choroidal OCT,6 the introduction of SS-OCT was a significant development for consistent visualization of deeper ocular structures.8 Various studies in recent years have used both SD-OCT and SS-OCT devices for comparison of choroidal thickness and reported good inter-observer and inter-device reproducibility.1,9–11,13
To the best of our knowledge, this is the first study comparing choroidal thickness between normal and diseased populations using SD-OCT and commercially available SS-OCT machines in a South Asian population. Our study is also unique because it compared automatic measurements of choroidal thickness with manual measurements in healthy and diseased participants.
Michalewski et al3 had earlier presented automatic choroid thickness measurements in a normal population (15–79 years). Choroidal thickness reported in their study with SS-OCT (221 μm) was lower than the thickness measured manually (259 μm). They postulated that the difference could be explained by the fact that the manual measurement is a focal measurement and that the automatic measurement measures the mean thickness in a circle with a diameter of 1,000 μm. Their study also reported a discrepancy in 16% of cases between the examiners’ estimation and the automated measurement. Similarly, choroidal thickness measured automatically by SS-OCT in our diseased population was 184 μm, lower than that determined with manual measurements on either of the two devices. A possible reason for this could be automatic detection, and segmentation of the choroid by the software may not represent the actual SCI. This discrepancy was also noted by us while recording measurements. We noticed that SCI identified by the software was significantly higher in some participants. Automatic choroidal thickness measurement is a relatively new feature that became available with the introduction of SS-OCT machines.3,7,14 Further studies are thus required to assess its reliability especially in diseased populations, where a greater variation in choroidal thickness exists.
In a similar study, Tan et al1 measured choroidal thickness between normal and diseased populations using SD-OCT (Spectralis SD-OCT; Heidelberg Engineering Inc., Heidelberg, Germany) and SS-OCT (Topcon DRI OCT-1; Topcon Inc.). They reported SD-OCT and SS-OCT choroidal thickness measurements of 272.4 μm and 264.3 μm, respectively, for all 100 participants combined. At 264.9 μm for SD-OCT and 279.5 μm for SS-OCT, our results of choroidal thickness are comparable with their study. The differences in choroidal thickness between the two studies may be attributed to differences in age of the participants, ethnicity, axial length, severity of the disease process and perhaps diurnal influences. In our study, choroidal measurements were higher with SS-OCT for both normal and diseased populations, a finding that was also reported by Matsuo et al9 (269.1 μm for Topcon 3D OCT 1,000 versus 280.5 μm for DRI OCT) and Ikuno et al10 in normal subjects (283.7 μm versus 292.7 μm). Matsuo et al hypothesized that the choroidal thickness measurements were thicker using SS-OCT, because the SCI seen on SD-OCT scans may not be the true border. A similar discrepancy regarding the true border of SCI was also observed by us for SD-OCT images. SS-OCT images of the same eye, however, allowed visualization of the SCI more distinctly, therefore allowing more accurate measurements. This observation has also been made by other authors.12,13 Our study compared SD-OCT and SS-OCT among patients with retinal diseases. The results of our study demonstrated a larger variability in choroidal thickness measurement in diseased eyes compared with normal eyes, a finding consistent with Tan et al.1 Mean SFCT in the diseased group was 198.33±85.8 μm with SD-OCT and 225.4±109.2 μm with SS-OCT. Different variables may have contributed including disease severity causing greater variability between the graders when measuring the SFCT. Disease severity can also affect clear visibility of posterior boundaries, making it difficult to demarcate the SCI interface. We recommend choroidal thickness measurements for most retinal diseases. For example, even though most ARMD types show thin choroid, idiopathic polypoidal choroidal vasculopathy subtype shows a thicker choroid. Both conditions respond differently to anti-vascular endothelial growth factor (VEGF). Similarly, the late-onset chronic CSR, which mimics ARMD, shows thicker choroid. Treatment with half-fluence photodynamic therapy instead of anti-VEGF may show a markedly different response in this condition.
The strengths of our study include a sufficient sample, inclusion of only one eye per patient to reduce statistical variance and consistent evaluation of normal and abnormal eyes by the same graders.
Conclusion
Both SD-OCT and SS-OCT can measure choroidal thickness. SD-OCT requires switching to EDI mode before measurements can be recorded. SS-OCT gives less variability in choroidal thickness measurements particularly when the retinal architecture is abnormal such as that in diseased eyes. Larger studies are needed to confirm these findings.
Abbreviations
EDI, enhanced depth imaging; OCT, optical coherence tomography; SD, spectral domain; SS, swept source; SFCT, sub foveal choroidal thickness; SCI, sclerochoroidal interface.
Acknowledgments
The authors would like to acknowledge Mr Syed Iqbal Azam, Assistant Professor, Department of Community Health Sciences, Aga Khan University Hospital, Karachi, Pakistan, for his assistance with statistical analysis; Mr Adnan Sheikh, Shahzad Eye Hospital, Karachi, Pakistan, for his assistance with this project and Dr MH Shahzad, FRCS, MBBS, Consultant Ophthalmologist, Shahzad Eye Hospital, for the use of facilities at Shahzad Eye Hospital.
Disclosure
The authors report no conflicts of interest in this work.
References
Tan CS, Ngo W, Cheong KX. Comparison of choroidal thicknesses using swept source and spectral domain optical coherence tomography in diseased and normal eyes. Br J Ophthalmol. 2014;99(3):354–358. | ||
Feldkaemper MP, Wang HY, Schaeffel F. Changes in retinal and choroidal gene expression during development of refractive errors in chicks. Invest Ophthalmol Vis Sci. 2000;41(7):1623–1628. | ||
Michalewski J, Michalewska Z, Nawrocka Z, Bednarski M, Nawrocki J. Correlation of choroidal thickness and volume measurements with axial length and age using swept source optical coherence tomography and optical low-coherence reflectometry. Biomed Res Int. 2014;2014:639160. | ||
Mansouri K, Medeiros FA, Tatham AJ, Marchase N, Weinreb RN. Evaluation of retinal and choroidal thickness by swept-source optical coherence tomography: repeatability and assessment of artifacts. Am J Ophthalmol. 2014;157(5):1022–1032. | ||
Mansouri K, Leite MT, Medeiros FA, Leung CK, Weinreb RN. Assessment of rates of structural change in glaucoma using imaging technologies. Eye. 2011;25(3):269–277. | ||
Spaide RF, Koizumi H, Pozzoni MC. Enhanced depth imaging spectral-domain optical coherence tomography. Am J Ophthalmol. 2008;146(4):496–500. | ||
Ruiz-Medrano J, Flores-Moreno I, Pena-Garcia P, Montero JA, Duker JS, Ruiz-Moreno JM. Macular choroidal thickness profile in a healthy population measured by swept-source optical coherence tomography. Invest Ophthalmol Vis Sci. 2014;55(6):3532–3542. | ||
Piasecka K, Michalewska Z. Choroidal imaging with swept source optical coherence tomography-a review. Eur Ophthalmic Rev. 2014;8(2):132–136. | ||
Matsuo Y, Sakamoto T, Yamashita T, Tomita M, Shirasawa M, Terasaki H. Comparisons of choroidal thickness of normal eyes obtained by two different spectral-domain OCT instruments and one swept-source OCT instrument. Invest Ophthalmol Vis Sci. 2013;54(12):7630–7636. | ||
Ikuno Y, Maruko I, Yasuno Y, et al. Reproducibility of retinal and choroidal thickness measurements in enhanced depth imaging and high-penetration optical coherence tomography. Invest Ophthalmol Vis Sci. 2011;52(8):5536–5540. | ||
Copete S, Flores-Moreno I, Montero JA, Duker JS, Ruiz-Moreno JM. Direct comparison of spectral-domain and swept-source OCT in the measurement of choroidal thickness in normal eyes. Br J Ophthalmol. 2014;98(3):334–338. | ||
Hirata M, Tsujikawa A, Matsumoto A, et al. Macular choroidal thickness and volume in normal subjects measured by swept-source optical coherence tomography. Invest Ophthalmol Vis Sci. 2011;52(8):4971–4978. | ||
Adhi M, Liu JJ, Qavi AH, et al. Choroidal analysis in healthy eyes using swept-source optical coherence tomography compared to spectral domain optical coherence tomography. Am J Ophthalmol. 2014;157(6):1272–1281. | ||
Michalewska Z, Michalewski J, Nawrocka Z, Dulczewska-Cichecka K, Nawrocki J. Suprachoroidal layer and suprachoroidal space delineating the outer margin of the choroid in swept-source optical coherence tomography. Retina. 2015;35(2):244–249. |
 © 2016 The Author(s). This work is published and licensed by Dove Medical Press Limited. The full terms of this license are available at https://www.dovepress.com/terms.php and incorporate the Creative Commons Attribution - Non Commercial (unported, v3.0) License.
By accessing the work you hereby accept the Terms. Non-commercial uses of the work are permitted without any further permission from Dove Medical Press Limited, provided the work is properly attributed. For permission for commercial use of this work, please see paragraphs 4.2 and 5 of our Terms.
© 2016 The Author(s). This work is published and licensed by Dove Medical Press Limited. The full terms of this license are available at https://www.dovepress.com/terms.php and incorporate the Creative Commons Attribution - Non Commercial (unported, v3.0) License.
By accessing the work you hereby accept the Terms. Non-commercial uses of the work are permitted without any further permission from Dove Medical Press Limited, provided the work is properly attributed. For permission for commercial use of this work, please see paragraphs 4.2 and 5 of our Terms.