")
Back to Journals » Clinical Ophthalmology » Volume 9
Comparison of central corneal thickness: ultrasound pachymetry versus slit-lamp optical coherence tomography, specular microscopy, and Orbscan
Authors Khaja W, Grover S, Kelmenson A, Ferguson L, Sambhav K, Chalam K
Received 22 January 2015
Accepted for publication 7 April 2015
Published 12 June 2015 Volume 2015:9 Pages 1065—1070
DOI https://doi.org/10.2147/OPTH.S81376
Checked for plagiarism Yes
Review by Single anonymous peer review
Peer reviewer comments 3
Editor who approved publication: Dr Scott Fraser
Wassia A Khaja, Sandeep Grover, Amy T Kelmenson, Lee R Ferguson, Kumar Sambhav, Kakarla V Chalam
Department of Ophthalmology, University of Florida, College of Medicine, Jacksonville, FL, USA
Background: Central corneal thickness (CCT) can be measured by using contact and non-contact methods. Ultrasound pachymetry (US pachymetry) is a contact method for measuring CCT and is perhaps the most commonly used method. However, non-contact methods like scanning slit topography (Orbscan II), slit-lamp optical coherence tomography (SL-OCT), and specular microscopy are also used. Not many studies have correlated the measurement of CCT with all four modalities. The purpose of this study was to compare and correlate the CCT measurements obtained by US pachymetry with SL-OCT, specular microscopy, and Orbscan.
Method: This is a prospective, comparative study done in an institutional setting. Thirty-two eyes of 32 subjects with no known ocular disease and best-corrected visual acuity of 20/20 were enrolled. CCT measurements were obtained using SL-OCT, specular microscopy, scanning slit topography (Orbscan), and US pachymetry. Three measurements were made with each instrument by the same operator. Mean, standard deviation, and coefficient of variation were calculated for CCT measurements acquired by the four measurement devices. Bland–Altman plot was constructed to determine the agreements between the CCT measurements obtained by different equipment.
Results: The mean CCT was 548.16±48.68 µm by US pachymetry. In comparison, CCT averaged 546.36±44.17 µm by SL-OCT, 557.61±49.92 µm by specular microscopy, and 551.03±48.96 µm by Orbscan for all subjects. Measurements by the various modalities were strongly correlated. Correlations (r2) of CCT, as measured by US pachymetry compared with other modalities, were: SL-OCT (r2=0.98, P<0.0001), specular microscopy (r2=0.98, P<0.0001), and Orbscan (r2=0.96, P<0.0001). All modalities had a linear correlation with US pachymetry measurements.
Conclusion: In subjects with healthy corneas, SL-OCT, specular microscopy, and Orbscan (with correction factor) can be used interchangeably with US pachymetry in certain clinical settings. The four modalities showed significant linear correlations with one another.
Keywords: central corneal thickness, pachymetry, slit-lamp optical coherence tomography, specular microscopy, Orbscan
Background
Central corneal thickness (CCT) is an important biometric measurement in several ocular conditions such as corneal edema, corneal dystrophies, and corneal endothelial diseases. CCT is even preferred in patients whose corneas are otherwise healthy, eg, in those undergoing LASIK procedure. It has become an important measurement to establish accurate intraocular pressure (IOP) readings. Ultrasound pachymetry (US pachymetry) is the most common method used for CCT measurements.1 This is performed by direct apposition of an ultrasound probe to the anterior corneal surface.2 However, limitations of this method include contact with the corneal surface, misalignment of ultrasound probe perpendicularly to corneal surface, and insufficient tear film displacement after probe compression.
Non-contact techniques such as Orbscan (Bausch & Lomb Incorporated, Bridgewater, NJ, USA),3 specular microscopy, and optical coherence tomography (OCT)4 have been used to measure CCT with varying success. Orbscan II2 uses a scanning-slit principle in order to measure the corneal thickness. Specular microscopy uses reflections of light from the anterior and posterior corneal surface as a means to distinguish corneal layers and measure corneal thickness.5 The slit-lamp OCT (SL-OCT) combines slit-lamp biomicroscopy6 and imaging technology of OCT and it can also be used to measure the corneal thickness. There have been several studies done in the past comparing two or more of these modalities for the measurement of CCT.1–10 However, very few studies have compared all four modalities. In this prospective study, we measured corneal thickness with non-contact Orbscan II, specular microscopy, and SL-OCT, and compared these modalities to US pachymetry in subjects with no ocular disease.
Materials and methods
Subjects
In this comparative, prospective study, 32 individuals were recruited from the Department of Ophthalmology at the University of Florida at Jacksonville. The inclusion criteria were: best-corrected visual acuity (BCVA) of 20/20 or better, absence of ocular pathology by history and undilated eye exam, and IOP of less than 21 mmHg. If the subject was a contact lens wearer (n=2), then measurements were taken at least 24 hours after being off the contact lens. Exclusion criteria included history of any ocular surgery or anterior segment pathology and refractive error more than or equal to ±6 diopters. Written informed consent was obtained from all the subjects after the protocol and possible risks were explained; the consent form was approved by the Institutional Review Board at the University of Florida. All participants were subjected to comprehensive eye examinations which included BCVA, pupil examination, IOP measurements, slit-lamp biomicroscopy, and undilated fundus examination. Individuals enrolled were from different races, and subset analysis comparing CCT among races was not performed due to small sample size.
Devices
Kerasonix KSX-1000 ultrasound pachymeter (DGH Technology, Exton, PA, USA) utilizes ultrasound energy to measure CCT. When ultrasound energy is emitted from the probe tip, some of the energy is reflected back in the form of an echo. Based on velocity and time for the energy to travel back to the receiver, the measurements are obtained. Measurements were made with the ultrasound velocity (acoustic index) set to 1,640 m/s.
The SL-OCT (Heidelberg Engineering, Heidelberg, Germany) employs an internal, short coherent, infrared light source (super-luminescent light emitting diode) with a central wavelength approximately 1,310 nm. The SL-OCT is capable of 15 mm scan sizes with a scan depth of 7 mm. The lateral optical resolution capacity is less than 100 μm and the lateral digitalized resolution capacity is 75 μm. The axial resolution capacity is less than 25 μm for optical resolution and 10 μm for digitalized resolution. The slit-beam produces a reflex that appears on both the outer and inner corneal surface as well as a sharp reflex beam through the anterior chamber. Scans were saved and analyzed for CCT via the Heidelberg Eye Explorer (HEYEX) SL-OCT (Heidelberg Engineering) viewing software.
The Konan Noncon Robo Pachy (Konan Medical Corporation, Fairlawn, NJ, USA) is comprised of a non-contact microscope and camera. This device obtains a specular image of the corneal endothelium and also measures the corneal thickness. Subjects were positioned to focus on fixation target, and the corneal image was captured using the Noncon Robo specular microscope. The KSS-300 Image Storage System was used to acquire and save the image and subsequently analyze the CCT.
Orbscan II (Bausch and Lomb, Rochester, NY, USA) analyzes reflected images from multiple concentric rings projected on the anterior surface of the cornea. A high-resolution video camera captures multiple light slits projected through the cornea similarly as seen during slit-lamp examination. The instrument’s software analyzes multiple data points per slit and calculates the corneal thickness. The anterior and posterior corneal surfaces were automatically detected with the system software. Once the images were recorded, calculations of the CCT were performed. The final reading was automatically adjusted using an acoustic correction factor (AF) of 0.92, as recommended by the manufacturer.
Procedure
By default, data were obtained from the right eye in all the participants. The CCT was obtained using the four modalities and analyzed, as outlined below. CCT measurements were taken in triplicate for each study instrument by the same examiner during a single morning or afternoon visit. Triplicate measurements were taken to reduce intra-observer variability. The order of testing was randomized. For US pachymetry measurements after instillation of topical anesthetic (0.5% proparacaine), the probe tip was gently applied to the central cornea overlying the pupil. For the other three non-contact modalities guidelines were followed and images were analyzed with the respective software of the respective machines.
Statistical analysis
For statistical analysis the GraphPad Instat 3 (GraphPad Software, Inc., La Jolla, CA, USA) was used. Mean, standard deviation (SD), and coefficient of variation were calculated for CCT measurements acquired by the four measurement devices. Bland–Altman plot was constructed to determine the agreements between the CCT measurements acquired by different equipment and the P-value was obtained. Pearson’s correlation coefficient (r2) was also obtained for CCT, as measured by US pachymetry compared with other modalities. Intra-class correlations coefficient was also calculated to assess degree of relatedness between CCT measurements obtained between various apparatus.
Results
Thirty-two eyes of 32 normal subjects (15 men and 17 women) were included in this study. Their mean age was 31.2 years (range: 19–54 years) (Table 1). Although triplicate measurements were obtained on all subjects with Orbscan, one data point each from two subjects were excluded due to poor scan quality.
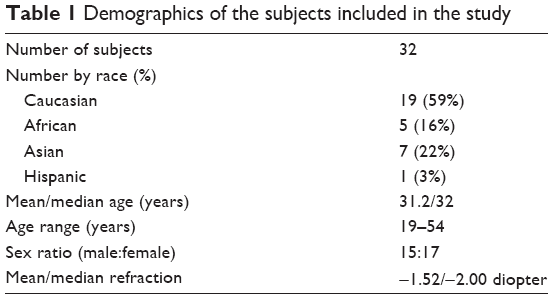 | Table 1 Demographics of the subjects included in the study |
The mean CCT measured by US pachymetry from the 32 subjects was 548.16±48.68 μm. In comparison, the CCT averaged 546.36±44.17 μm by SL-OCT, 557.61±49.92 μm by specular microscopy, and 551.03±48.96 μm by Orbscan II (with AF of 0.92) for all the subjects (Table 2).
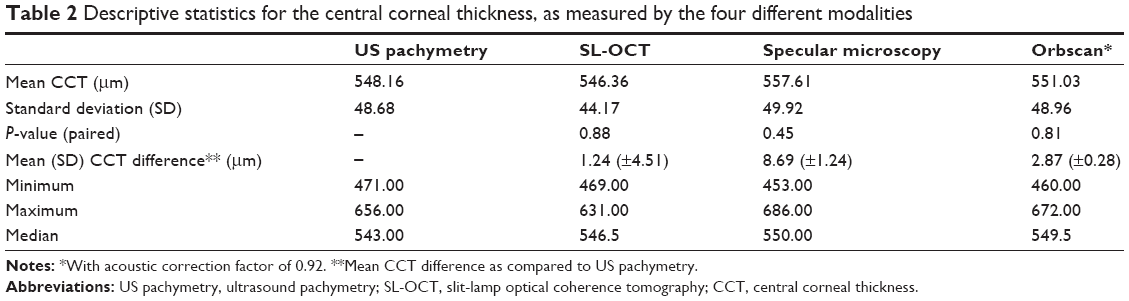 | Table 2 Descriptive statistics for the central corneal thickness, as measured by the four different modalities |
The Bland–Altman plot showed that the measurements acquired via US pachymetry were greater than those obtained by SL-OCT for mean CCT values from 475–550 μm (Figure 1). For CCT values beyond 550 μm SL-OCT measurements were higher than US pachymetry. The mean (± SD) CCT measurement difference between the two methods was 1.24 (±4.51) μm, and the 95% limits of agreement (LOA) were between −21.76 and 18.18 μm. US pachymetry measurements when compared to specular microscopy, showed an overall decrease in measurement values for CCT when values ranged from 500 to 650 μm (Figure 2). In this case mean (±SD) difference was 8.69 (±1.24) μm while the 95% LOA range was −8.82 to 27.4 μm (Figure 2). Bland–Altman plot comparison of CCT measurements obtained by US pachymetry vs Orbscan II (Figure 3) demonstrated that US pachymetry showed little relative difference in CCT measurements within the range of 500–650 μm as compared to Orbscan. Table 2 shows that the mean (±SD) difference between US pachymetry and Orbscan II was 2.8 (±0.28) μm with a 95% LOA range between −30.15 and 24.40 μm. Among the three methods for CCT measurement US pachymetry had the best agreement with the SL-OCT; the mean difference was the smallest (Table 2). Conversely, the comparison between US pachymetry and specular microscopy measurements had the least agreement; the mean difference was the largest (Table 2). Correlations (r2) of CCT, as measured by US pachymetry compared with other modalities, were: SL-OCT (r2=0.98, P<0.0001) (Figure 4), specular microscopy (r2=0.98, P<0.0001) (Figure 5), and Orbscan (r2=0.96, P<0.0001) (Figure 6). Measurements by the various modalities were strongly correlated. Intra-class correlations of CCT, as measured by US pachymetry when compared with the other modalities, conveyed a strong and positive intra-class correlation coefficient (ICC =0.95).
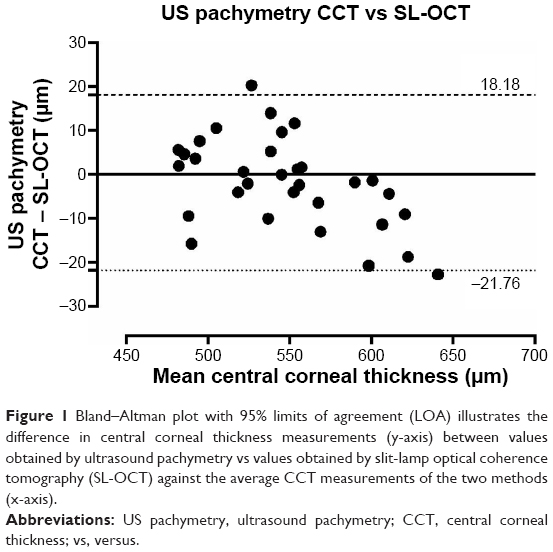 | Figure 1 Bland–Altman plot with 95% limits of agreement (LOA) illustrates the difference in central corneal thickness measurements (y-axis) between values obtained by ultrasound pachymetry vs values obtained by slit-lamp optical coherence tomography (SL-OCT) against the average CCT measurements of the two methods (x-axis). |
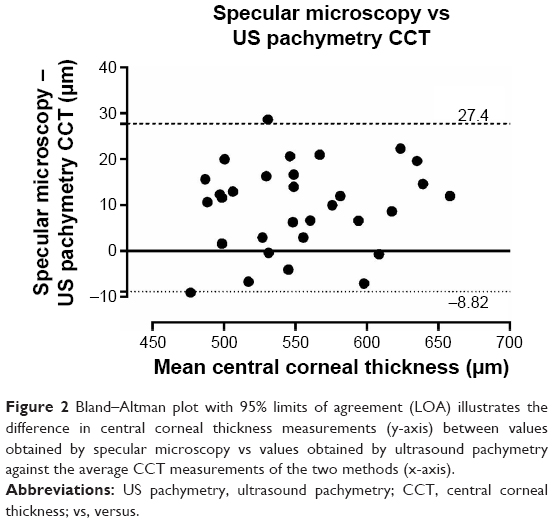 | Figure 2 Bland–Altman plot with 95% limits of agreement (LOA) illustrates the difference in central corneal thickness measurements (y-axis) between values obtained by specular microscopy vs values obtained by ultrasound pachymetry against the average CCT measurements of the two methods (x-axis). |
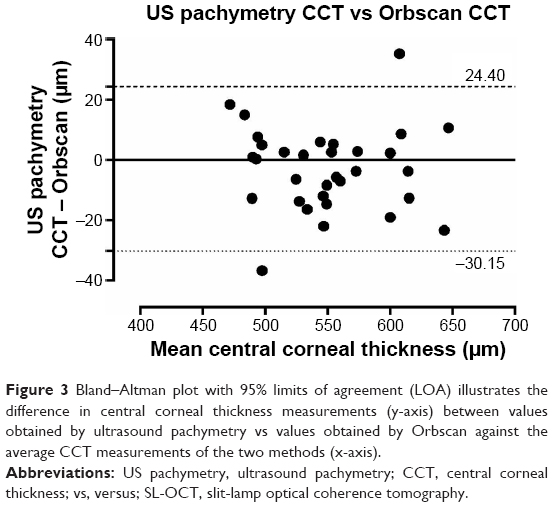 | Figure 3 Bland–Altman plot with 95% limits of agreement (LOA) illustrates the difference in central corneal thickness measurements (y-axis) between values obtained by ultrasound pachymetry vs values obtained by Orbscan against the average CCT measurements of the two methods (x-axis). |
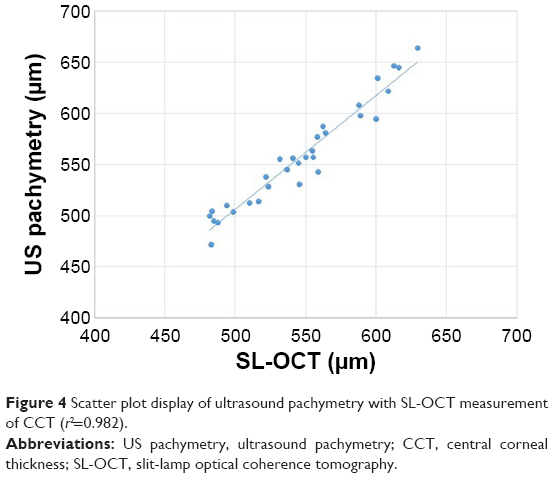 | Figure 4 Scatter plot display of ultrasound pachymetry with SL-OCT measurement of CCT (r2=0.982). |
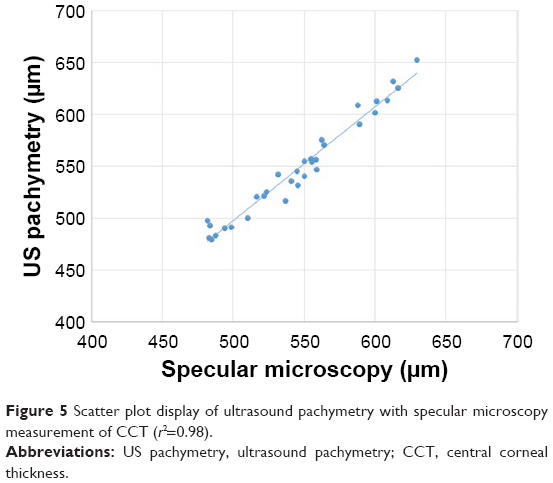 | Figure 5 Scatter plot display of ultrasound pachymetry with specular microscopy measurement of CCT (r2=0.98). |
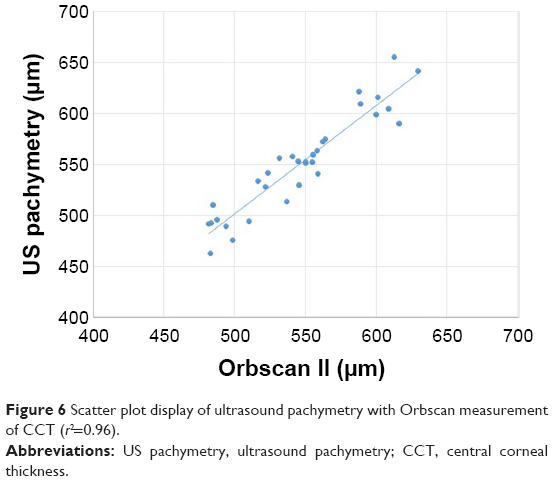 | Figure 6 Scatter plot display of ultrasound pachymetry with Orbscan measurement of CCT (r2=0.96). |
Discussion
The mean CCT measured by the US pachymetry from the 32 subjects was 548.16±48.68 μm, which is similar to previously published results in the literature. In studies by Al-Farhan and Al-Otaibi,1 Williams et al,2 and Christensen et al3 mean CCT was recorded as 530.1±30.5 μm, 532.94±37.96 μm, and 552.36±37.6 μm, respectively.
In comparison to US pachymetry, the mean CCT measured by SL-OCT was 546.36±44.17 μm and it showed the best agreement compared to all other methods. Other studies by Li et al4 and Beutelspacher et al8 showed no significant difference between these two modalities. This high correlation of measurement values between the two modalities may be due to the similar mechanism of the two instruments – both use reflection of waves to determine the anterior and posterior boundaries of the cornea. It is possible that SL-OCT measures CCT from the same corneal surface or interface as US pachymetry.
The mean CCT, as obtained by specular microscopy, was 557.61±49.92 μm and was similar to mean CCT found in previous studies. A study by Wu et al5 found mean CCT using Konan specular microscope to be 554.78±32.61 μm. Doughty et al7 compared CCT using slit-lamp-based pachymetry which was 0.530 mm (median 0.525 mm) compared to ultrasound-based methods 0.544 mm (median 0.544 mm). Jonuscheit and Doughty8 have reported that the slit-scanning pachymeter can substantially overestimate more peripheral thickness measurements of the cornea than specular microscopy or US pachymetry, and therefore, cannot be used interchangeably. Similarly again a study by Jonuscheit and Doughty9 reports that Orbscan II provides the clinician with a repeatable noninvasive method of measuring corneal thickness that is not necessarily any better than US pachymetry, and should not be considered as interchangeable with ultrasound. However there was no difference noted in our study which could be due to the ultrasound device used (Kerasonix KSX-1000). A study by Martin et al10 appreciated the repeatability of Orbscan pachymetry compared to ultrasound to measure corneas with and without corneal swelling and suggested that it could be useful to study central and peripheral corneal swelling variations in contact lens users. Módis et al11 found mean CCT to be 549±33 μm with Tomey specular microscope. Our findings show that specular microscopy overestimated CCT by 8.69 μm. Previous studies measuring CCT by US pachymetry vs specular microscopy have also shown a strong correlation and also demonstrated that CCT can be overestimated11 or underestimated12 by specular microscopy. However, different brands of specular microscopes were used in each of these studies and this variability in measurements may be inherent to the instrument. Different types of specular microscopes may record corneal parameters such as magnification, refractive index, and anterior corneal curvature, etc differently, which will affect the final specular image.
The mean CCT by Orbscan measured 551.03±48.96 μm in our study and showed good agreement with US pachymetry. Using the suggested correction factor of 0.92, Orbscan overestimated CCT by an average of 2.88 μm in our study in comparison to US pachymetry. Different studies have also shown an overestimation, underestimation, or even no difference between CCT measurements.13–16 Initial studies looking at the Orbscan found that it overestimated CCT when compared to US pachymetry.16,17 Hence, the development of an AF of 0.92. Doughty and Jonuscheit18 performed a meta-analysis of 46 studies evaluating Orbscan measurements with and without the correction factor; results showed that Orbscan may yield CCT measurement which is approximately 7% higher than US pachymetry. Some studies have suggested that universal use of correction factor of 0.92 may be inaccurate, and CCT measurements with Orbscan should be reported without any adjustment factor.13–15,18 This discrepancy between studies may be due to the fact that Orbscan measures thickness between air-tear interface and posterior corneal surface. The tear film surface can add 7–30 μm to the total CCT measurement.19 In addition, the exact posterior corneal reflection point for Orbscan is not known; it may be anywhere between Descemet’s membrane and anterior chamber (3–10 μm).19
Although individuals enrolled in this study were different races, we did not perform a subset analysis comparing CCT among races due to small sample size. The comparison between our study and other studies reported above has limitations too. Our study had a small sample size and measurements were randomly done, however non-contact methods should be performed before the contact methods. These studies have different population demographic profiles than ours. Future studies comparing CCT measurements among different ethnic origins could be more informative.
Conclusion
To our knowledge, this is one of the few studies comparing four common modalities for measuring CCT; we compared SL-OCT, specular microscopy, and Orbscan to the most commonly used modality, US pachymetry in individuals with healthy corneas. Since there was a strong correlation of these modalities with US pachymetry, any one can be used in a certain clinical setting.
Disclosure
All the authors declare that they have no competing interests. No financial support was received for this submission.
References
Al-Farhan HM, Al-Otaibi WM. Comparison of central corneal thickness measurements using ultrasound pachymetry, ultrasound biomicroscopy, and the Artemis-2 VHF scanner in normal eyes. Clin Ophthalmol. 2012; 6:1037–1043. | ||
Williams R, Fink BA, King-Smith PE, Mitchell GL. Central corneal thickness measurements: using an ultrasonic instrument and 4 optical instruments. Cornea. 2011;30(11):1238–1243. | ||
Christensen A, Narváez J, Zimmerman G. Comparison of central corneal thickness measurements by ultrasound pachymetry, konan noncontact optical pachymetry, and orbscan pachymetry. Cornea. 2008;27(8): 862–865. | ||
Li H, Leung CK, Wong L, et al. Comparative study of central corneal thickness measurement with slit-lamp optical coherence tomography and visante optical coherence tomography. Ophthalmology. 2008;115(5): 796–801. | ||
Wu Q, Duan X, Jiang Y, et al. [Normal value of the central corneal thickness measured by non-contact specular microscope]. Yan Ke Xue Bao. 2004;20(4):229–232. Chinese. | ||
Beutelspacher SC, Serbecic N, Scheuerle AF. Assessment of central corneal thickness using OCT, ultrasound, optical low coherence reflectometry and Scheimpflug pachymetry. Eur J Ophthalmol. 2011;21(2):132–137. | ||
Doughty MJ, Zaman ML. Human corneal thickness and its impact on intraocular pressure measures: a review and meta-analysis approach. Surv Ophthalmol. 2000;44(5):367–408. | ||
Jonuscheit S, Doughty MJ. Discrepancy between central and midperipheral corneal thickness measurements obtained with slit-scanning pachymetry and noncontact specular microscopy. J Cataract Refract Surg. 2009;35(12):2127–2135. | ||
Jonuscheit S, Doughty MJ. Regional repeatability measures of corneal thickness: Orbscan II and ultrasound. Optom Vis Sci. 2007;84(1):52–58. | ||
Martin R, de Juan V, Rodriguez G, Fonseca S, Martin S. Contact lens-induced corneal peripheral swelling: Orbscan repeatability. Optom Vis Sci. 2009;86(4):340–349. | ||
Módis L Jr, Szalai E, Németh G, Berta A. Evaluation of a recently developed noncontact specular microscope in comparison with conventional pachymetry devices. Eur J Ophthalmol. 2010;20(5):831–838. | ||
Bovelle R, Kaufman SC, Thompson HW, Hamano H. Corneal thickness measurements with the Topcon SP-2000P specular microscope and an ultrasound pachymeter. Arch Ophthalmol. 1999;117(7):868–870. | ||
Lackner B, Schmidinger G, Pieh S, Funovics MA, Skorpik C. Repeatability and reproducibility of central corneal thickness measurement with Pentacam, Orbscan and ultrasound. Optom Vis Sci. 2005;82(10):892–899. | ||
Amano S, Honda N, Amano Y, et al. Comparison of central corneal thickness measurements by rotating Scheimpflug camera, ultrasonic pachymetry and scanning-slit corneal topography. Ophthalmology. 2006;13(6):937–941. | ||
Suzuki S, Oshika T, Oki K, et al. Corneal thickness measurements: scanning-lit corneal topography and noncontact specular microscopy versus ultrasonic pachymetry. J Cataract Refract Surg. 2003;29(7):1313–1318. | ||
Yaylali V, Kaufman SC, Thompson HW. Corneal thickness measurements with the Orbscan topography system and ultrasonic pachymetry. J Cataract Refract Surg. 1997;23(9):1345–1350. | ||
Marsich MM, Bullimore MA. The repeatability of corneal thickness measures. Cornea. 2000;19(6):792–795. | ||
Doughty MJ, Jonuscheit S. The orbscan acoustic (correction) factor for central corneal thickness measures of normal human corneas. Eye Contact Lens. 2010;36(2):106–115. | ||
Li EY, Mohamed S, Leung CK, et al. Agreement among 3 methods to measure corneal thickness: Ultrasound pachymetry, orbscan II, and visante anterior segment optical coherence tomography. Ophthalmology. 2007;114(10):1842–1847. |
 © 2015 The Author(s). This work is published and licensed by Dove Medical Press Limited. The full terms of this license are available at https://www.dovepress.com/terms.php and incorporate the Creative Commons Attribution - Non Commercial (unported, v3.0) License.
By accessing the work you hereby accept the Terms. Non-commercial uses of the work are permitted without any further permission from Dove Medical Press Limited, provided the work is properly attributed. For permission for commercial use of this work, please see paragraphs 4.2 and 5 of our Terms.
© 2015 The Author(s). This work is published and licensed by Dove Medical Press Limited. The full terms of this license are available at https://www.dovepress.com/terms.php and incorporate the Creative Commons Attribution - Non Commercial (unported, v3.0) License.
By accessing the work you hereby accept the Terms. Non-commercial uses of the work are permitted without any further permission from Dove Medical Press Limited, provided the work is properly attributed. For permission for commercial use of this work, please see paragraphs 4.2 and 5 of our Terms.