")
Back to Journals » Risk Management and Healthcare Policy » Volume 14
Comparison of Back-Propagation Neural Network, LACE Index and HOSPITAL Score in Predicting All-Cause Risk of 30-Day Readmission
Authors Lin C, Hsu S, Lu HF, Pan LF , Yan YH
Received 5 May 2021
Accepted for publication 27 August 2021
Published 14 September 2021 Volume 2021:14 Pages 3853—3864
DOI https://doi.org/10.2147/RMHP.S318806
Checked for plagiarism Yes
Review by Single anonymous peer review
Peer reviewer comments 2
Editor who approved publication: Dr Jongwha Chang
Chaohsin Lin,1 Shuofen Hsu,1 Hsiao-Feng Lu,2,3 Li-Fei Pan,4 Yu-Hua Yan5
1Department of Risk Management and Insurance, National Kaohsiung University of Science and Technology, Kaohsiung, Taiwan; 2Department of Anesthesiology, Kaohsiung Chang Gung Memorial Hospital, Kaohsiung, Taiwan; 3College of Medicine, Chang Gung University, Kaohsiung, Taiwan; 4Department of Medical Affair Administration, Kaohsiung Veterans General Hospital, Kaohsiung, Taiwan; 5Department of Medical Research, Tainan Municipal Hospital (Managed by Show Chwan Medical Care Corporation), Tainan, Taiwan
Correspondence: Yu-Hua Yan; Li-Fei Pan Tel +886-6-260-9617
Fax +886-6-260-6351
Email [email protected]; [email protected]
Background: The main purpose of this study is to predict the all-cause risk of 30-day readmission by employing the back-propagation neural network (BPNN) in comparison with traditional risk assessment tools of LACE index and HOSPITAL scores.
Methods: This was a retrospective cohort study from January 1st, 2018 to December 31st, 2019. A total of 55,688 hospitalizations from a medical center in Taiwan were examined. The LACE index (length of stay, acute admission, Charlson comorbidity index score, emergency department visits in previous 6 months) and HOSPITAL score (hemoglobin level at discharge, discharge from an Oncology service, sodium level at discharge, procedure during hospital stay, Index admission type, number of hospital admissions during the previous year, length of stay) are calculated. We employed variables from LACE index and HOSPITAL score as the input vector of BPNN for comparison purposes.
Results: The BPNN constructed in the current study has a considerably better ability with a C statistics achieved 0.74 (95% CI 0.73 to 0.75), which is statistically significant larger than that of the other two models using DeLong’s test. Also, it was possible to achieve higher sensitivity (70.32%) without penalizing the specificity (71.76%) and accuracy (71.68%) at its optimal threshold, which is at the 20% of patients with the highest predicted risk. Moreover, it is much more informative than the other two methods because of a considerably higher LR+ and a lower LR-.
Conclusion: Our findings suggest that more attention should be paid to methods based on non-linear classification systems, as they lead to substantial differences in risk-scores.
Keywords: healthcare quality, 30-day readmission, back-propagation neural network, BPNN, LACE, HOSPITAL
Introduction
The important goal for health policy and hospital management under the National Health Insurance (NHI) scheme is to contain the over-utilization of medical resources from both demand and supply side of healthcare on the one hand while without sacrificing the quality of healthcare on the other hand. Thus, the cost-saving and quality-improving constituted the two main pillars for NHI. The 30-day readmissions are considered as an accountability measure and quality indicator in the United States since 2014. In line with this, the Centers for Medicare and Medicaid Services (CMS) adjusts reimbursements to hospitals according to readmission rates. Some policy analysts worry that reductions in readmissions are being achieved by keeping returning patients in observation units or by simply labeling returning patients as outpatients instead of formally readmitting them to the hospital.1,2 However, it has been found that the readmission rate declined quickly shortly after passage of the Affordable Care Act (ACA) and then continued to fall at a slower rate without significant association between changes in observation-unit stays and readmissions after the implementation of the ACA.3 This indicated that the financial penalties for readmissions under the ACA served as an efficient incentive mechanism for reducing readmissions.
In Taiwan, after the implementation of NHI in 1995, an organization of the Joint Commission of Taiwan (JCT) was established in 1999. The purpose of JCT is to promote, execute and certify the nation’s healthcare quality policies. Among which, reducing readmissions is a priority to the Ministry of Health and Welfare (MHW) because it represents a unique opportunity to simultaneously improve care and reduce costs. Similar to the readmission penalty conducted by CMS in the US, Taiwan’s MHW applies financial penalties through the reduction of reimbursement for NHI coverages to hospitals that have patients who are readmitted with the same or related diagnosis after discharge within a short period of time.
Hospital readmissions are a burden on the health-care system, and put a strain on hospital resources. A model to predict patients at risk of readmission will help health-care administrators and providers to allocate appropriate resources to patients at highest risk of readmission. Several countries have developed predictive models for readmission. Of these, the most cited readmission risk assessment tools are the HOSPITAL score,4 LACE index5 and LACE+ index.6 The LACE index has been internally and externally validated only in Ontario,5 while HOSPITAL score has been internationally validated in US, Canada, Israel, and Switzerland.7 However, the LACE index was developed from middle-aged Canadian patients free of serious comorbidities. Likewise, the HOSPITAL score is derived in the US. The literature on 30-day readmission prediction tools emphasizes the importance of local validation before implementation, since each hospital has a patient casemix that reflects their surrounding population and may require a locally calibrated score threshold.8,9 Yet, most of the studies focused on 30-day readmission were performed in the US with very few exceptions in other countries.10–12 Little is known about the applicability of LACE index and HOSPITAL score to Asian population and health systems. Moreover, if there is a nonlinear relationship between predicting factors and 30-day readmissions, linear models such as logistic regression most often fail to predict the patient’s risk of readmission with high accuracy. As such, the prediction performance of traditional statistical models for readmissions has been generally poor.12 For example, existing methods that rely on regression-based models report area under the curve (AUC) for the receiver operating characteristic (ROC) in the range of 0.63 to 0.68, suggesting limited discrimination for prediction.12–14 Recent use of more flexible prediction models that leverage machine learning (ML) algorithms, such as random forest (RF), support vector machines (SVM) and artificial neural network (ANN) models, have attempted to address this limitation.15–18 Nonetheless, existing dedicated efforts employing ML for predicting 30-day risk of readmission are mostly tailored to particular cohort or to a specific disease, such as congestive heart failure,15,19–21 chronic obstructive pulmonary disease (COPD),22 patients discharged from intensive care unit,23,24 emergency readmissions.25 As has been noted in previous studies, predicting risk of readmissions for a general cohort is a completely different medical and data mining problem involving large, heterogeneous patient population sizes compared to disease-specific cohorts.16,26 It has been pointed out that there is a lot of value in having readmission models that are not tied to a specific disease for patients who do not belong to any of the well-studied cohorts, or for incoming patients for which we do not know which cohort they belong to.11,16
Among few that predicts risk of readmissions for the entire population employed is SVM.16,26 However, it is well known that the medical utilization with patients’ risk factors exist nonlinear relation12 and the dataset is often of large-scale, which leads to the increased difficulties of training SVM that focused on supervised binary classification.27 Moreover, in a readmission prediction where the occurred cases are usually quite rare as compared with the rest of the non-occurrences, a favorable classification model therefore is one that provides a higher identification rate on the minority class under a reasonably good prediction rate on the majority.17 It has been confirmed that although the prediction accuracy of SVM is greater than the ANN in some cases, the specificity and sensitivity of SVM were found to be lower than that of ANN.28,29 Thus, the usage of ANN over SVM as the best classifier has been suggested for prediction with skewed data of a large-scale.28,29 There is limited information on comparing the LACE index, HOSPITAL score and ANN model as risk assessment tools against readmission for Asian population under a compulsory NHI scheme. As there is no single prediction model that works well in all scenarios, most readmission prediction models require validation and evaluation using real-world data in different settings.8,30 The goal of this study is therefore to evaluate how well the LACE index, HOSPITAL score and ANN model predict risk for all-cause unplanned readmissions within 30 days of discharge using administrative claims data provided by a large medical center in Taiwan.
Materials and Methods
Setting, Data Source, and Ethical Concerns
This was a retrospective cohort study from January 1st, 2018 to December 31st, 2019, using data extracted from the electronic hospital management system of Kaohsiung Veterans General Hospital (KVGH), a medical center in Taiwan. Ethical approval was obtained from the Institutional Review Board (IRB) of KVGH (IRB # KSVGH20-CT4-11).
Study Cohort, Enrolled Hospitalizations, and 30-Day Readmissions
We leverage the detailed clinical data, including ICD-10-CM/PCS (International Statistical Classification of Disease and Related Health Problems, Tenth Revision, Clinical Modification/Procedure Coding System) codes assigned at discharge using the hospital computer system. We employed two datasets for ANN model construction. One is from January 1st to December 31st, 2018 as the training sample. The other is from January 1st to December 31st, 2019 as the testing set, which period is the same with that for HOSPITAL score and LACE index to allow for a direct comparison.
The dependent variable, ie, a 30-day readmission, was defined as a readmission for any diagnosis following an index hospitalization with the same department at hospital. Any cause readmission within 30 days of hospital discharge endpoint was selected because it is the measure used by the MHW in Taiwan. Exclusion criteria were observation, inpatient admissions for psychiatry or rare disease (eg, ICD 10 CM codes E76.X), preterm labor without delivery (ICD10 CM codes O60.02, O60.03), elective readmission, hereditary factor deficiency (ICD 10 CM codes D66, D67, D68.1, D68.2), transferred to another acute care hospital, hospice, nursing home or other home care facilities, leaving the hospital against medical advice. We also delete the hospital stays if the patient died within the hospital, since dead patients cannot be readmitted.
Data on age, gender, ICD 10 CM/PCS codes, and the variables in the HOSPITAL score and LACE index (Table 1) were extracted from the electronic health record in a de-identified manner for analysis. Laboratory tests were obtained on the day of hospital discharge for hemoglobin and sodium. The comorbidities were identified using ICD 10 codes, which coding algorithms are developed by Quan et al,31 in any primary or secondary diagnosis fields dating back to one year preceding the index admission. The Charlson comorbidity index (CCI) was then computed for each patient.
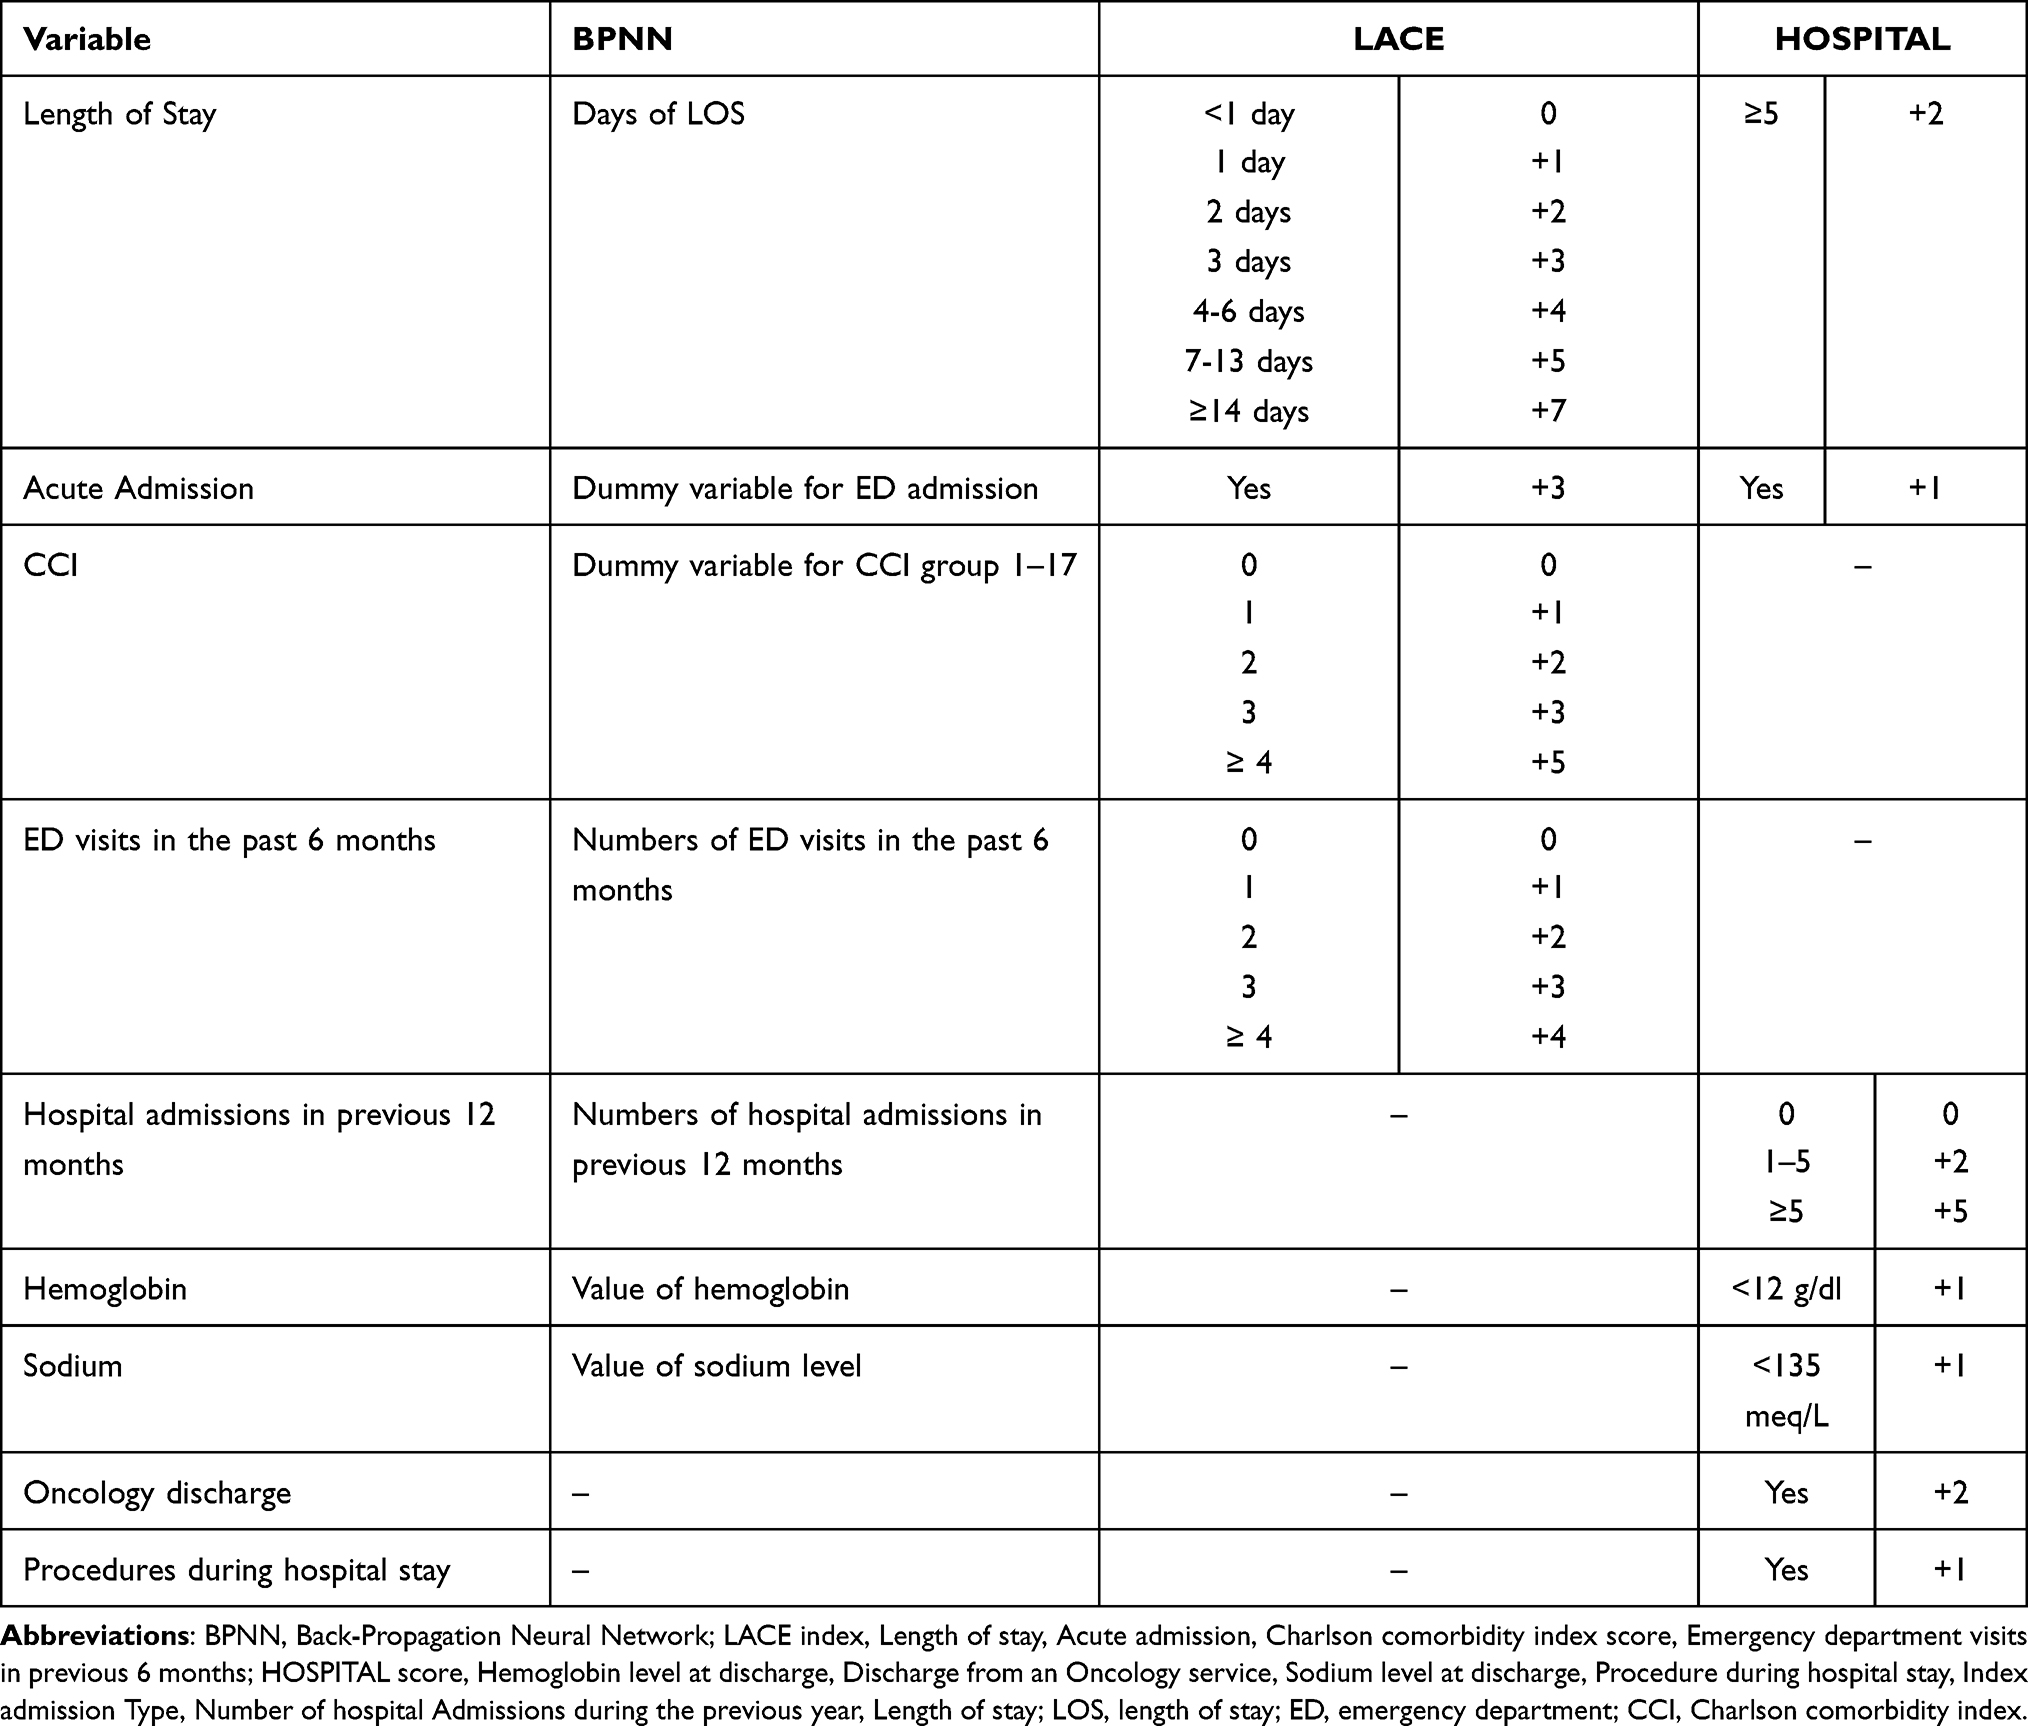 |
Table 1 Risk Factors in BPNN, LACE and HOSPITAL |
The LACE Index, HOSPITAL Score and Backpropagation Neural Network (BPNN) Model
Both scores for LACE and HOSPITAL were calculated for each hospitalization using the variables summarized in Table 1. In the current study, we employed BPNN as a classifier to predict patient’s risk of all-cause 30-day readmission due to the advantages of its fast, simple and easy to program. The BPNN is constructed using the same variables in the LACE index and HOSPITAL scores as the input vector in order to allow for a direct comparison (Table 1). The BPNN is a typical multilayer forward neural network using a supervised learning algorithm with the architecture of an input layer, 1 or multiple hidden layers, and an output layer. The basic idea of BPNN is to learn a certain number of sample pairs (input and expected output). Specifically, the input data of the sample are sent to each neuron in the input layer, and after being calculated by the hidden layer and the output layer, each neuron of the output layer works out a corresponding forecast. BPNN needs to train the sample data before forecasting, and the network acquires associative memory and forecasting ability via training.
In specific, the output H of hidden layer is calculated as follows.
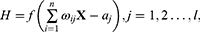
where X is the input vector,  is the connection weight between the input layer and the output layer,
  is the hidden layer threshold, l is the number of neurons in hidden layer, and f is the activation function of the hidden layer. In order to increase network learning efficiency, the logistic function with the form f(
 )=1/(1+
 ) is employed as the activation function, where
  is the input net of the hidden node, ie the sum of weighted risk adjusters
 .
.
Based on the hidden layer output H, the predicted output  of the BPNN is calculated as follows.
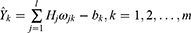
Where  is the connection weight, and
  is the output layer threshold.
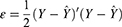
The prediction error  , which is the difference between the network prediction output
  and the expected output
 , is calculated as follows.
The stopping criterion for a training iteration of BPNN is the root mean squared error (RMSE) of the sum of the difference between the actual and the forecasted 30-day readmission. In addition, across channel normalization is used to rescale the data in the range [0, 1] to obtain the stability of the neural networks. The transfer of signal in neurons of single input, hidden, and output layer obeyed the sigmoid function while the training of BPNN adopted the gradient steepest descent method. We follow the usual way in determining the remaining parameters, ie, the learning and momentum rates are 0.01 and 0.5, respectively.
Statistical Analysis and Evaluation
Statistical analyses and BPNN implementation were performed using language programming and STATA, version 16.1.32 The differences between discharge w/ and w/o 30-day readmission for demographics and the factors that used to calculate LACE index and HOSPITAL scores were examined with independent t-tests for continuous interval data variables and Chi-squared test for categorical variables. Following the most common procedure for evaluating models for early predicting readmission, we constructed the ROC curves for LACE, HOSPITAL and BPNN model respectively. The ROC curve plots the probability of detecting a true signal (sensitivity) and false signal (1-specificity) for the entire range of possible cut-off points. We compared discrimination with the areas under ROC curves (AUC) using an algorithm suggested by DeLong et al.33 It is suggested that an AUC value of 0.5 indicates no ability to discriminate (might as well toss a coin), while a value less than 0.60 reflects poor discrimination, a value between 0.60 and 0.75 indicates possibly helpful discrimination and a value more than 0.75 is considered clearly useful.34 Moreover, measuring a model’s performance cannot be completely separated from its intended use. Therefore, in addition to AUC, the clinical utility was also evaluated in terms of true positive rate (TPR, sensitivity), true negative rate (TNR, specificity), accuracy, positive (LR+) and negative (LR-) likelihood ratio. However, these metrics require a yes/no intervention threshold before they can even be computed, something that is lacking in the BPNN model as it is not slated for a specific clinical program.20 For the purpose of comparison with LACE and HOSPITAL, we constructed the cut points for BPNN according to every ten percentile of the network prediction as the risk scores. The Youden’s index rule35 was used to determine the optimal cut point for the model in deciding the threshold of high-risk patients that deserved intervention. At this point, the sum of sensitivity and specificity as well as the differences between the true positive rate (TPR) and false-positive rate (FPR) are maximized.
Results
Study Population and 30-Day Readmission Rates
A total of 55,688 hospitalizations from a medical center during two years of 2018 and 2019 met the inclusion criteria described in section 2.1 and constituted the study population. Deletions of 43,529 include 2695 deaths during hospitalization (2 suicides), 424 for transit or critically ill discharge, 40,410 for planned readmission and omission data. Among the 55,688 hospitalizations, 2557 (4.6%) were readmitted to the same division at the hospital within 30 days while the rest of 53,131 (95.4%) were hospitalization without 30-day readmission.
Table 2 shows that the baseline characteristics of all variables between patients w/ and w/o 30-day readmission were different with statistical significance. It is obvious from Table 2 that patients who readmitted within 30 days are mostly male (59.4% and 59.1%) and older with average age of 64.2 and 65.4 in 2018 and 2019, respectively. Also, patients with 30-day readmission are characterized by higher risk with a larger HOSPITAL score (5.09 vs 3.38) and LACE index values (11.16 vs 7.44), longer average length of stays (13.43 vs 8.59), more index admission from ED, almost 2 times higher CCI comorbidities, more frequent visits to ED during the past six months (average 2.29 vs 0.87), nearly 3 times proportion of discharge from an oncology service, higher numbers of hospital admissions in the previous year (1.79 vs 0.87) and lower blood hemoglobin and sodium level at discharge. However, patients w/o 30-day readmission have more procedures during the hospital stay (0.53 vs 0.42).
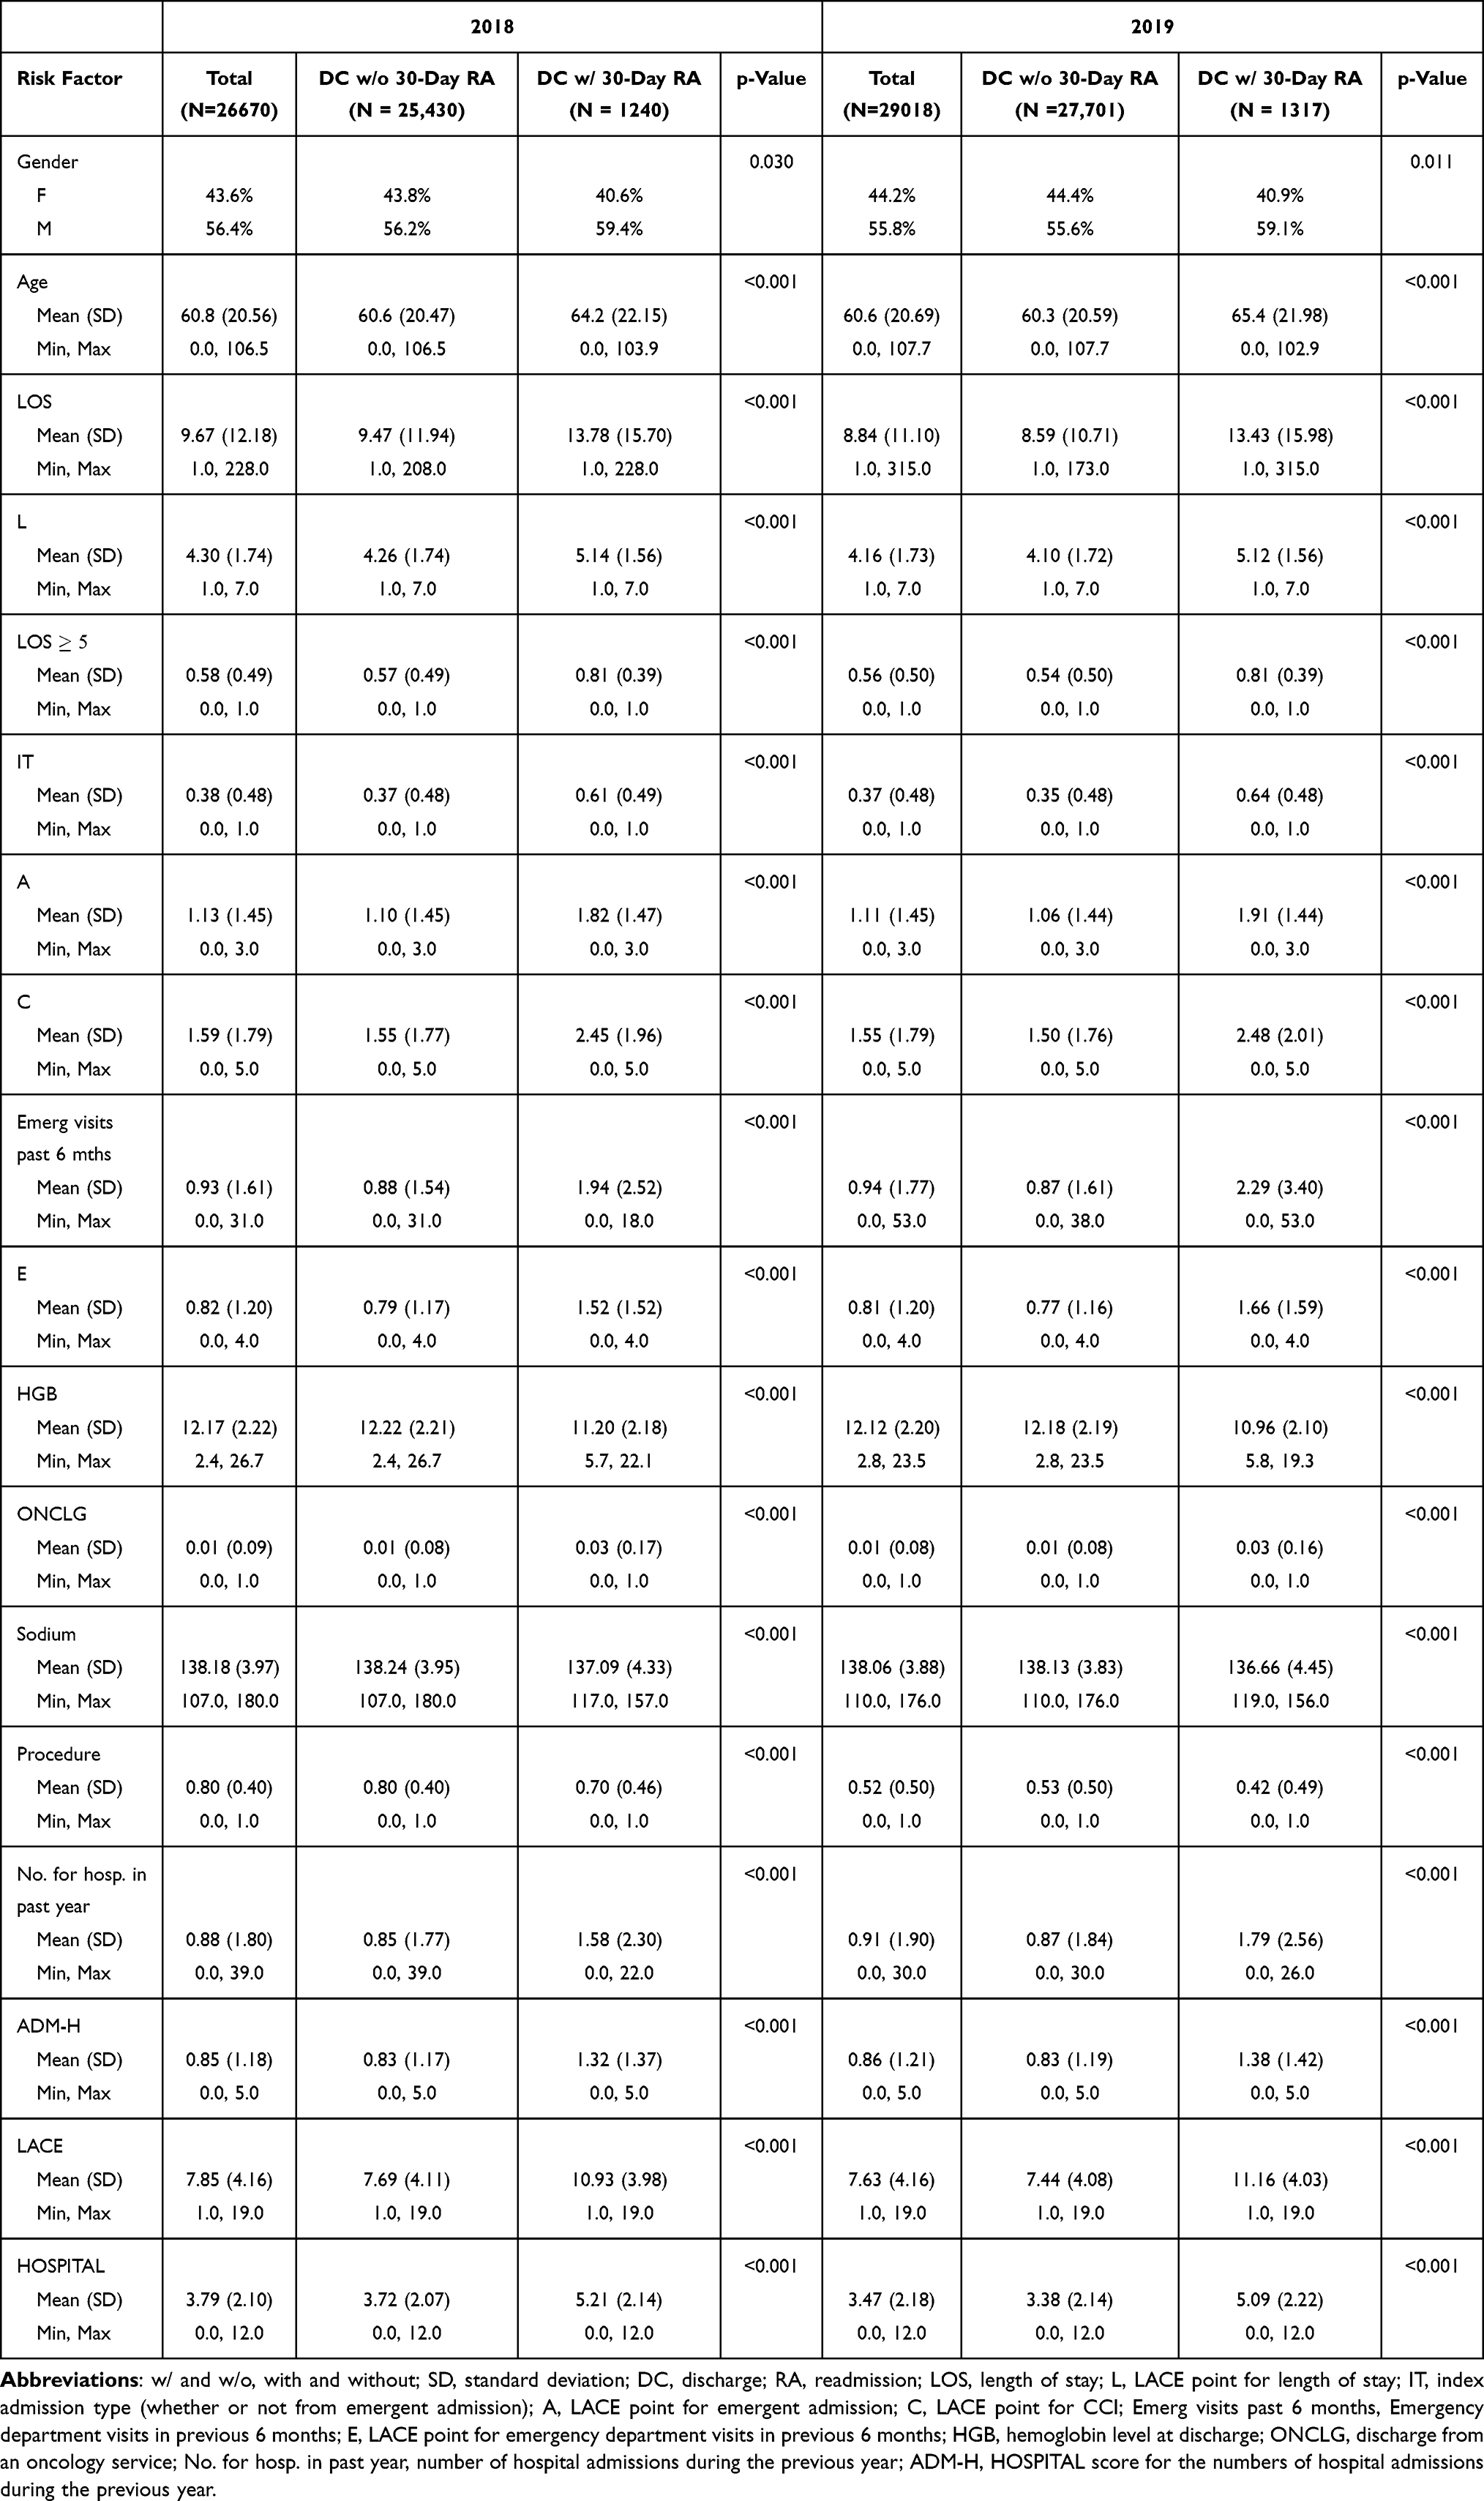 |
Table 2 Descriptive Statistics for Patients w/ and w/o 30-Day Readmission |
Discrimination Abilities for BPNN, LACE Index and HOSPITAL Scores
Variables contained in the input vector of BPNN with the best performance are summarized in Table 1. Except for discharge from an oncology service and numbers of procedures during hospital stay, the rest variables of HOSPITAL and all variables of LACE are included in the input vector of BPNN. After evaluating a variety of neural network architectures, we found the best-performing model to be a three-layer neural network, containing single input, hidden and output layer. It has been suggested that 10 nodes in a hidden layer are usually sufficient for most forecasting problems while more nodes can be used but usually result in slower learning without an improvement in result.36 We found a marginal improvement for a hidden layer with 15 nodes while the time spent in training is almost triple than that of a hidden layer with 10 nodes. In addition, we also found that a hidden layer with 20 nodes results in an overfitting in the holdout sample. We chose 1000 times of training since the network always converges to stable when the amount of training reaches 1000.
Table 3 shows that the AUCs, expressed as a C statistic, of BPNN, LACE index and HOSPITAL score for this population are 0.74 (95% CI 0.73 to 0.75), 0.73 (95% CI 0.71 to 0.74) and 0.70 (95% CI 0.68 to 0.71), respectively. Figure 1 shows that the ROC curve of BPNN lies completely above those of the other two, indicating that BPNN is clearly a better prediction tool. Moreover, DeLong’s test demonstrated that the differences of the AUC value between BPNN with LACE index and HOSPITAL score are both statistically significant at 0.01 level. According to Youden’s index rule,35 the optimal cut-off for the LACE index is a score of 10 or more with a sensitivity of 68.16% and specificity of 66.26%. The optimal threshold for BPNN is at the 20% of patients for the highest predicted risk with a sensitivity and a specificity of 70.32% and 71.76%, respectively. Both of which are substantially higher than those of LACE index. On the other hand, the optimal cut-off for the HOSPITAL score is 4 or more with a comparable sensitivity of 78.18% but a low specificity of 51.37%. Furthermore, BPNN has the highest accuracy (71.68%) than either LACE index (66.35%) or HOSPITAL scores (52.66%). Also, BPNN is much more informative than the other two methods because of a considerably higher LR+ of 2.49 and a lower LR- of 0.41 compared to LACE index (LR+=2.02, LR-=0.48) and HOSPITAL scores (LR+=1.61, LR-=0.43). Moreover, BPNN is more powerful in ruling-in than ruling-out readmission as its LR+ is greater than the inverse of LR-.
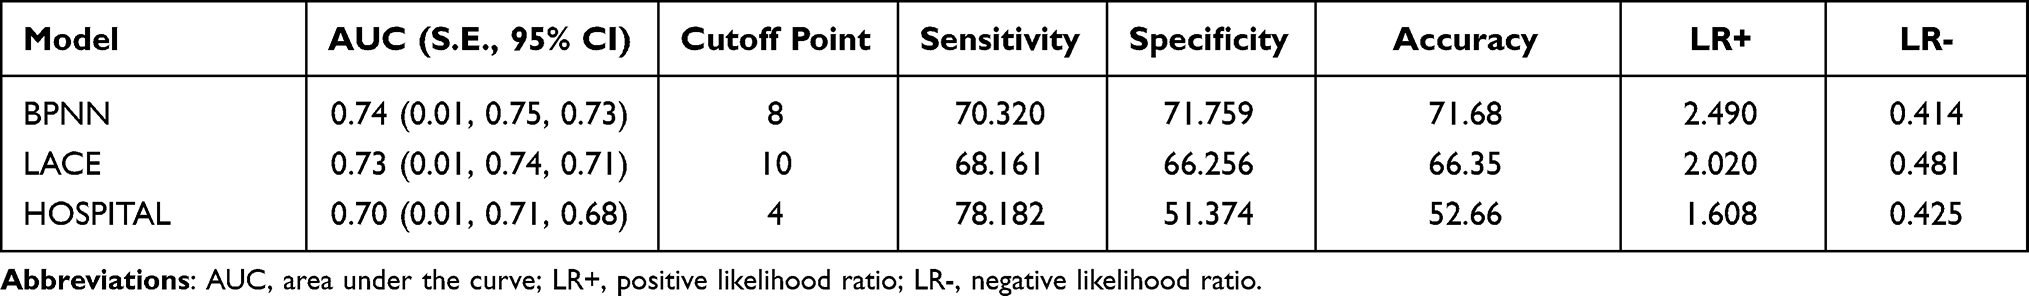 |
Table 3 AUC, Cutoff Point, Sensitivity, Specificity, LR+ and LR- of LACE, HOSPITAL and BPNN |
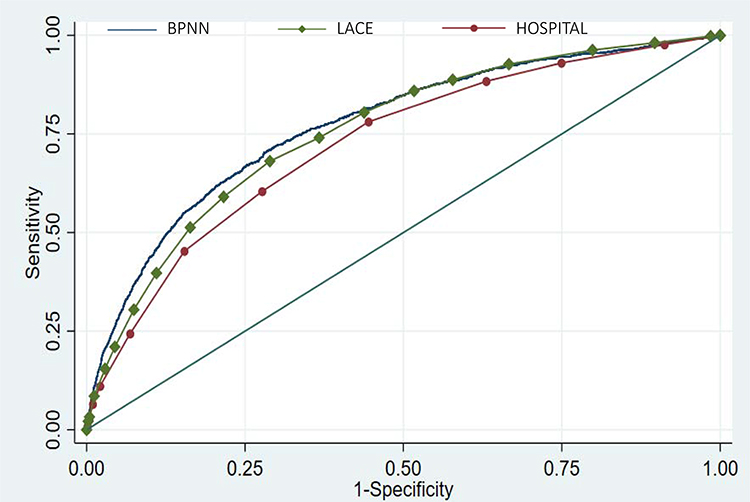 |
Figure 1 ROC curve for the LACE index, BPNN and HOSPITAL. Abbreviations: ROC, receiver operator characteristic; AUC, area under the curve; BPNN, BackPropagation Neural Network; LACE index, Length of stay, Acute admission, Charlson comorbidity index score, Emergency department visits in previous 6 months; HOSPITAL score, Hemoglobin level at discharge, Discharge from an Oncology service, Sodium level at discharge, Procedure during hospital stay, Index admission Type, Number of hospital Admissions during the previous year, Length of stay. Notes: The ROC curve illustrates the performance of the BPNN, LACE index and HOSPITAL scores for predicting all-cause 30-day readmission at different cutoff points. BPNN AUC: 0.74 (95% CI 0.73 to 0.75), LACE AUC: 0.73 (95% CI 0.71 to 0.74), HOSPITAL AUC: 0.70 (95% CI 0.68 to 0.71). |
Discussion
In this single-institution study, we found that the proposed BPNN works better for the risk prediction of the all-cause 30-day readmission than the standardized risk prediction tool of LACE index and HOSPITAL score in all predictive criteria. The performance of the HOSPITAL score in this population was similar (0.70 vs 0.72) to what was reported in the multicenter international validation study and the initial derivation study.4,7 On the other hand, performance of the LACE index in this study was considerably better (C-statistic of 0.73 vs 0.684) when compared with the derivation study.5
The 4.6% 30-day readmission rate in our study seems considerably lower than that of studies performed in other countries.4,37–39 Explanations for this comparatively lower readmission can be considered as follows. First, we define the 30-day readmission as patients with the same or related diagnosis who readmitted to the same department at the hospital after discharge. We use this definition because it is the way that the hospital management held each department accountable under the MHW’s financial penalties. The criteria applied thus may lead to a relatively low readmission rate. Second, local factors may contribute to this relatively low readmission rate since the KVGH is the tertiary care center with a multidisciplinary healthcare management and a high proportion of patients with positive social determinants of health, such as better healthcare access and urban residence. Compared to the average unplanned readmission rates of 7.5%, 5.83% and 5.87% for the year 2016, 2017 and 2018, respectively, in Taiwan,40 the readmission rate is lower in the current study cohort. Moreover, this low 30-day all-cause readmission rate may also be explained by the coverage provided by NHI in Taiwan since, according to Gusmano et al,41 inadequate insurance coverage may result in more severe illness and consequently more hospitalizations. Similar finding has been reported in a recent study carried out in France where the readmission rate was 3.5% under a universal insurance system.11 However, several studies have shown mixed results regarding the effect of insurance types (public or private) on readmission.42–46 Future work is necessary to investigate the consequences of the disparity by insurance status on readmission.
In line with this, other factors including the presence of a complex chronic health condition, insurance type, demographic and socioeconomic factors are important in examining the rate of hospital readmission since the causes for readmissions are multidimensional reflecting demographics, disease severity, utilization, and psychosocial factors.11 For comparison purposes, the current study employed variables only from LACE index and HOSPITAL score. Several regression-based studies have demonstrated better prognostic capability using other combinations of clinical or patient variables. Even the LACE index itself was later improved by adding other covariates including patient age and sex, teaching status of discharge institution, number of urgent and elective admissions in previous year, case-mix group score and number of days on alternative level of care status.6 Although some factors, such as prior utilization, comorbidities, and age, are very predictive by themselves, improving the predictive power beyond LACE or HOSPITAL requires models that capture the interdependencies and non-linearity of those factors more efficiently.12,20 A recent study conducted in Belgium has proved that a model with a sufficient predictive performance can be derived from structured pathology data using ML techniques.18 The BPNN, by modeling nonlinear interactions between factors and learning a feature representation from raw data automatically, provides an opportunity to capture those complexities. Further investigations on the trade-off between model complexity and goodness-of-fit are needed to determine a model that is well balanced between prediction performance and practical application as a clinical decision support system for health-care providers.
For the purpose of performance comparison on the same basis, we evaluated models using area under the ROC curve (AUROC), which is also adopted in the original derivations of LACE and HOSPITAL. The ROC curve is commonly preferred over other measures in situations where the data is skewed as in this study and other health-care datasets.18,20 However, a growing literature has favored the use of precision-recall (PR) curves for binary decision problems in ML or data mining.18,47 Precision or confidence (as it is called in data mining) denotes the proportion of predicted positive cases that are correctly real positives, which is what ML, data mining and information retrieval focus on.48 Nonetheless, evaluation of readmission prediction is a matter of concern in medical care not only for confirming the presence of readmitted but also to rule out the possibilities in non-readmitted patients.16,17 Moreover, the key difference between these two measures is that ROC curves will be the same no matter what the baseline probability is whereas precision is a probability conditioned on the estimate of the class label and will thus vary if the classifier is in different populations with different baseline probabilities.49 This indicated that AUROC is more applicable to the generalizability of the current BPNN to other medical centers since different populations have different baseline probabilities of readmission. To serve these purposes, we deemed that an AUROC is suitable to illustrate the error tradeoffs available with the model. Nevertheless, it should be noted that although AUROC provides a standard way to report results and compare studies, for some specific disease or situations where the consequences of readmitted is grave or fatal, the area under the precision-recall curve (AUCPR) may be useful. For example, in some cases such as in-hospital mortality or heart failure readmission, too many false positives appear in the more imbalanced-class data will inevitably increase the clinicians’ burden.18,50,51 Under such circumstances, the strategy to minimize the number of false positives, and thus the precision is of paramount importance. In contrast to the usual interventions to prevent readmissions, such as medical reconciliation, patient education, arranging timely outpatient appointments, and providing telephone follow-up, reducing fatal readmissions or in-hospital mortality needs much more adequately and timely intensive, even futile care by health-care providers.18,50,51 In such cases, where the unusual or interesting class is rare and as the class distribution becomes more skewed and to avoid unnecessary treatment or over-allocation of hospital resources due to a false-positive result, evaluation based on AUCPR18,47 or a partial AUROC52 may be preferred. The way to decide on which curve is better to optimize is context-dependent. It requires healthcare expertise in order to determine on where the algorithm should stand in the trade-off.
While AUC measures model performance across the full range of possible uses, in practice it is of great importance for providers or health policy makers to flag a patient with high risk of 30-day readmission with a threshold, which subsequently determines the rates of true positive (TP), true negative (TN), false positive (FP), and false negative (FN) prediction results. Choosing an appropriate cut-off value is of crucial importance for high-risk readmission since there is a tradeoff between sensitivity and specificity. Several criteria, mostly based on ROC analysis, have so far been proposed for choosing the most appropriate cut-off value.53 For the current scenario in predicting risk of the 30-day readmission, higher sensitivity is more desirable since the cost of false negatives (which correspond to readmitted patients incorrectly predicted as non-readmitted) is usually much higher than the cost of false positives (which correspond to non-readmitted patients incorrectly predicted as readmitted cases) from the perspective of a hospital.16,54 Especially when providers face the financial penalties on higher-than-average 30-day readmission rates, sensitivity is more important than specificity to correctly identify patients at risk of readmission. This is because the penalties that have to be paid through the reduction of reimbursement for NHI coverages may be larger than the costs of interventions to prevent 30-day readmission. However, on the other hand, in the circumstances where providers may consider the subsequent interventions being too resource-intensive to be arranged or the intervention costs being extraordinarily larger than the financial penalties, specificity may be preferred over sensitivity. In such situations, a lower threshold decided for a higher specificity will inevitably be compromised with a lower sensitivity. This in turn may result in a poor prediction ability of the model, which may fail to serve as an early warning for identifying patients at high risk of readmission. The current study shows that BPNN is possible to achieve higher sensitivity without penalizing the specificity and accuracy at its optimal threshold.
This study had several limitations. First, deaths outside hospital stays are not included in the current dataset since this information is not available. Ideally, if out-of-hospital deaths could be identified, models would consider death as a competing risk for readmission. Second, all data are from a single institution in Taiwan and the results need to be validated externally with other datasets in future studies. Third, as discussed above, we did not include hospital-specific or patient-related characteristics, which may further increase the AUC in practice for certain hospitals and patient cohort. Notwithstanding the limitations, we believe that the results are meaningful for practical use in hospitals. The ease of implementation, as well as the relatively high reliability of predictions by BPNN brings new possibilities for decision makers in the health-care system.
Conclusion
The BPNN with more sophisticated classification techniques can offer superior nonlinear feature to increase performance. Our findings suggest that more attention should be paid to methods based on non-linear classification systems, as they lead to substantial differences in risk-scores.
Abbreviations
NHI, National Health Insurance; CMS, Centers for Medicare and Medicaid Services; BPNN, Back-Propagation Neural Network; LR, Likelihood Ratio; ACA, Affordable Care Act; JCT, Joint Commission of Taiwan; MHW, Ministry of Health and Welfare; LACE, Length of stay, Acuity of admission, Comorbidities based on Charlson comorbidity score and number of Emergency visits in the last 6 months; AUC, Area Under the Curve; ROC, Receiver Operating Characteristic; AUROC, Area Under the ROC Curve; PR, Precision Recall; AUCPR, Area Under the Precision-Recall Curve; ML, Machine Learning; RF, Random Forest; SVM, Support Vector Machines; ANN, Artificial Neural Network; COPD, Chronic Obstructive Pulmonary Disease; CCI, Charlson Comorbidity Index; TPR, True Positive Rate; TNR, True Negative Rate; TP, True Positive; TN, True Negative; FP, False Positive; FN, False Negative.
Ethics Approval and Consent to Participate
This study is approved by the Kaohsiung Veterans General Hospital (KVGH), a medical center in Taiwan. Ethical approval was obtained from the Institutional Review Board (IRB) of KVGH (IRB # KSVGH20-CT4-11). The IRB waived the requirement of written informed consent from each patient involved in our study because the research is retrospective that meets the criteria of involving no more than minimal risk to the subjects. This study involved no identifiable private information or human biospecimens and is conducted in accordance with the ethical standards of the IRB and with the Declaration of Helsinki.
Acknowledgments
The authors thank personnel at the Research Center of Medical Informatics of KVGH for providing information in response to inquiries and assistance in data processing.
Role of the Funding Source
The funder had no role in the design and conduct of the study; collection, management, analysis, and interpretation of the data; preparation, review, or approval of the manuscript; and decision to submit the manuscript for publication.
Funding
This study was partly supported by KVGH (Grant No.: VGHKS109-D10).
Disclosure
The authors declare that they have no competing interests.
References
1. Himmelstein D, Woolhandler S. Quality improvement: ‘Become good at cheating and you never need to become good at anything else’. Health affairs blog; 2015. Available from: https://healthaffairs.org/blog/2015/08/27/quality-improvement-become-good-at-cheating-and-you-never-need-to-become-good-at-anything-else/.
2. Lind KD, Noel-Miller CM, Sangaralingham LR, et al. Increasing trends in the use of hospital observation services for older medicare advantage and privately insured patients. MCRR. 2019;76(2):229–239. doi:10.1177/1077558717718026.
3. Zuckerman RB, Sheingold SH, Orav EJ, Ruhter J, Epstein AM. Readmissions, observation, and the hospital readmissions reduction program. N Engl J Med. 2016;374(16):1543–1551. doi:10.1056/NEJMsa1513024.
4. Donzé J, Aujesky D, Williams D, Schnipper JL. Potentially avoidable 30-day hospital readmissions in medical patients: derivation and validation of a prediction model. JAMA Intern Med. 2013;173(8):632–638. doi:10.1001/jamainternmed.2013.3023.
5. van Walraven C, Dhalla IA, Bell C, et al. Derivation and validation of an index to predict early death or unplanned readmission after discharge from hospital to the community. CMAJ. 2010;182(6):551–557. doi:10.1503/cmaj.091117.
6. van Walraven C, Wong J, Forster AJ. LACE+ index: extension of a validated index to predict early death or urgent readmission after hospital discharge using administrative data. Open Med. 2012;6(3):e80–e90.
7. Donzé JD, Williams MV, Robinson EJ, et al. International validity of the HOSPITAL score to predict 30-day potentially avoidable hospital readmissions. JAMA Intern Med. 2016;176(4):496–502. doi:10.1001/jamainternmed.2015.8462
8. Damery S, Combes G. Evaluating the predictive strength of the LACE index in identifying patients at high risk of hospital readmission following an inpatient episode: a retrospective cohort study. BMJ Open. 2017;7(7):e016921.
9. Kreilkamp R. Application of the LACE risk assessment tool at Chinese hospital. The advisory board group; 2011. Available from: http://www.avoidreadmissions.com/wwwroot/userfiles/documents/55/lace-risk-assessmenttool.pdf.
10. Kansagara D, Englander H, Salanitro A, et al. Risk prediction models for hospital readmission: a systematic review. JAMA. 2011;306(15):1688–1698. doi:10.1001/jama.2011.1515.
11. Pauly V, Mendizabal H, Gentile S, Auquier P, Boyer L. Predictive risk score for unplanned 30-day rehospitalizations in the French universal health care system based on a medico-administrative database. PLoS One. 2019;14(3):e0210714. doi:10.1371/journal.pone.021071.
12. Garrison GM, Robelia PM, Pecina JL, Dawson NL. Comparing performance of 30-day readmission risk classifiers among hospitalized primary care patients. J Eval Clin Pract. 2017;23(3):524–529. doi:10.1111/jep.12656.
13. Krumholz HM, Lin Z, Drye EE, et al. An administrative claims measure suitable for profiling hospital performance based on 30-day all-cause readmission rates among patients with acute myocardial infarction. Circ Cardiovasc Qual Outcomes. 2011;4(2):243–252. doi:10.1161/CIRCOUTCOMES.110.957498.
14. Sukul D, Sinha SS, Ryan AM, Sjoding MW, Hummel SL, Nallamothu BK. Patterns of readmissions for three common conditions among younger US adults. Am J Med. 2017;130(10):
15. Liu W, Stansbury C, Singh K, et al. Predicting 30-day hospital readmissions using artificial neural networks with medical code embedding. PLoS One. 2020;15(4):e0221606. doi:10.1371/journal.pone.0221606.
16. Sushmita S, Khulbe G, Hasan A, et al.. Predicting 30-day risk and cost of “all-cause” hospital readmissions. In
17. Wang H, Cui Z, Chen Y, Avidan M, Abdallah AB, Kronzer A. Predicting hospital readmission via cost-sensitive deep learning. IEEE/ACM Transact Computat Biol Bioinformat. 2018;15(6):1968–1978. doi:10.1109/TCBB.2018.2827029.
18. Deschepper M, Waegeman W, Vogelaers D, Eeckloo K. Using structured pathology data to predict hospital-wide mortality at admission. PLoS One. 2020;15(6):e0235117. doi:10.1371/journal.pone.0235117.
19. Awan SE, Bennamoun M, Sohel F, Sanfilippo FM, Dwivedi G. Machine learning-based prediction of heart failure readmission or death: implications of choosing the right model and the right metrics. ESC Heart Failure. 2019;6(2):428–435. doi:10.1002/ehf2.12419.
20. Jamei M, Nisnevich A, Wetchler E, Sudat S, Liu E. Predicting all-cause risk of 30-day hospital readmission using artificial neural networks. PLoS One. 2017;12(7):e0181173. doi:10.1371/journal.pone.0181173.
21. Mortazavi BJ, Downing NS, Bucholz EM, et al. Analysis of machine learning techniques for heart failure readmissions. Circ Cardiovasc Qual Outcomes. 2016;9(6):629–640. doi:10.1161/CIRCOUTCOMES.116.003039.
22. Min X, Yu B, Wang F. Predictive modeling of the hospital readmission risk from patients’ claims data using machine learning: a case study on COPD. Sci Rep. 2019;9(1):2362. doi:10.1038/s41598-019-39071-y.
23. Barbieri S, Kemp J, Perez-Concha O, et al. Benchmarking deep learning architectures for predicting readmission to the ICU and describing patients-at-risk. Sci Rep. 2020;10(1):1111. doi:10.1038/s41598-020-58053-z.
24. Xue Y, Klabjan D, Luo Y. Predicting ICU readmission using grouped physiological and medication trends. Artif Intell Med. 2019;95:27–37. doi:10.1016/j.artmed.2018.08.004.
25. Ben-Assuli O, Padman R. Analysing repeated hospital readmissions using data mining techniques. Health Syst. 2017;7(2):120–134. doi:10.1080/20476965.2017.1390635.
26. Futoma J, Morris J, Lucas J. A comparison of models for predicting early hospital readmissions. J Biomed Inform. 2015;56:229–238. doi:10.1016/j.jbi.2015.05.016.
27. Nalepa J, Kawulok M. Selecting training sets for support vector machines: a review. Artif Intell Rev. 2019;52:857–900. doi:10.1007/s10462-017-9611-1.
28. Lee MC, To C. Comparison of support vector machine and back propagation neural network in evaluating the enterprise financial distress. Int J Artif Intell Appl. 2010;1(3):31–43. doi:10.5121/ijaia.2010.1303
29. Thirunavukkarasu M, Dinakaran K, Sathishkumar EN, Gnanendra S. Comparison of support vector machine (SVM) and backpropagation network (BPN) methods in predicting the protein virulence factors. J Indust Pollut Cont. 2017;33:1519–1527.
30. Zhou H, Della PR, Roberts P, Goh L, Dhaliwal SS. Utility of models to predict 28-day or 30-day unplanned hospital readmissions: an updated systematic review. BMJ Open. 2016;6(6):e011060.
31. Quan H, Sundararajan V, Halfon P, et al. Coding algorithms for defining comorbidities in ICD-9-CM and ICD-10 administrative data. Med Care. 2005;43(11):1130–1139. doi:10.1097/01.mlr.0000182534.19832.83
32. StataCorp. Stata Statistical Software: Release 16. College Station, TX: StataCorp LLC; 2019.
33. DeLong ER, DeLong DM, Clarke-Pearson DL. Comparing the areas under two or more correlated receiver operating characteristic curves: a nonparametric approach. Biometrics. 1988;44(3):837–845. doi:10.2307/2531595
34. Alba AC, Agoritsas T, Walsh M, et al. Discrimination and calibration of clinical prediction models: users’ guides to the medical literature. JAMA. 2017;318(14):1377–1384. doi:10.1001/jama.2017.12126
35. Youden WJ. Index for rating diagnostic tests. Cancer. 1950;3(1):32–35. doi:10.1002/1097-0142(1950)3:1<32::aid-cncr2820030106>3.0.co;2-3
36. Hsu S, Lin C, Yang Y. Integrating Neural Networks for Risk‐Adjustment Models. Journal of Risk & Insurance. 2008;75(3):617–642. doi:10.1111/j.1539-6975.2008.00277.x
37. Jencks SF, Williams MV, Coleman EA. Rehospitalizations among patients in the Medicare fee-for-service program. N Engl J Med. 2009;360(14):1418–1428. doi:10.1056/NEJMsa0803563
38. Halfon P, Eggli Y, Prêtre-Rohrbach I, Meylan D, Marazzi A, Burnand B. Validation of the potentially avoidable hospital readmission rate as a routine indicator of the quality of hospital care. Med Care. 2006;44(11):972–981. doi:10.1097/01.mlr.0000228002.43688.c2
39. Wong EL, Cheung AW, Leung MC, et al. Unplanned readmission rates, length of hospital stay, mortality, and medical costs of ten common medical conditions: a retrospective analysis of Hong Kong hospital data. BMC Health Serv Res. 2011;11:149. doi:10.1186/1472-6963-11-149
40. National Health Insurance Administration, Ministry of Health and Welfare. 2019–2020 handbook of Taiwan’s national health insurance; 2020. Available from: https://www.nhi.gov.tw/Content_List.aspx?n=488A9382D99296C0&topn=23C660CAACAA159D.
41. Gusmano MK, Rodwin VG, Weisz D. A new way to compare health systems: avoidable hospital conditions in Manhattan and Paris. Health Affairs. 2006;25(2):510–520. doi:10.1377/hlthaff.25.2.510
42. Horwitz L. The insurance-readmission paradox: why increasing insurance coverage may not reduce hospital-level readmission rates. J Hosp Med. 2014;9(11):743–744. doi:10.1002/jhm.2271.
43. Lasser KE, Hanchate AD, McCormick D, Manze MG, Chu C, Kressin NR. The effect of Massachusetts health reform on 30 day hospital readmissions: retrospective analysis of hospital episode statistics. BMJ. 2014;348:g2329. doi:10.1136/bmj.g2329
44. Chen C, Scheffler G, Chandra A. Readmission penalties and health insurance expansions: a dispatch from Massachusetts. J Hosp Med. 2014;9(11):681–687. doi:10.1002/jhm.2213.
45. Schiltz NK, Finkelstein Rosenthal B, Crowley MA, et al. Rehospitalization during the first year of life by insurance status. Clin Pediatr (Phila). 2014;53(9):845–853. doi:10.1177/0009922814536924.
46. Ferro EG, Secemsky EA, Wadhera RK, et al. Patient readmission rates for all insurance types after implementation of the hospital readmissions reduction program. Health Affairs. 2019;38(4):585–593. doi:10.1377/hlthaff.2018.05412.
47. Saito T, Rehmsmeier M, Brock G. The precision-recall plot is more informative than the ROC plot when evaluating binary classifiers on imbalanced datasets. PLoS One. 2015;10(3):e0118432. doi:10.1371/journal.pone.0118432.
48. Powers DM. Evaluation: from precision, recall and F-measure to ROC, informedness, markedness and correlation. arXiv preprint arXiv; 2020: 16061. Available from: https://arxiv.org/abs/2010.16061.
49. Provost F, Fawcett T. Robust classification for imprecise environments. Mach Learn. 2001;42(3):203–231. doi:10.1023/A:1007601015854
50. Locey KJ, Webb TA, Hota B. An evidence-based data science perspective on the prediction of heart failure readmissions. medRxiv. 2021. doi:10.1101/2021.05.10.21256926
51. Tey SF, Liu CF, Chien TW, et al. Predicting the 14-day hospital readmission of patients with pneumonia using Artificial Neural Networks (ANN). Int J Environ Res Public Health. 2021;18(10):5110. doi:10.3390/ijerph18105110
52. Carrington AM, Fieguth PW, Qazi H, et al. A new concordant partial AUC and partial c statistic for imbalanced data in the evaluation of machine learning algorithms. BMC Med Inform Decis Mak. 2020;20(1):1–12. doi:10.1186/s12911-019-1014-6
53. Sox HC, Higgins MC, Owens DK. Medical Decision Making.
54. Shams I, Ajorlou S, Yang K. A predictive analytics approach to reducing 30-day avoidable readmissions among patients with heart failure, acute myocardial infarction, pneumonia, or COPD. Health Care Manag Sci. 2015;18(1):19–34. doi:10.1007/s10729-014-9278-y
 © 2021 The Author(s). This work is published and licensed by Dove Medical Press Limited. The full terms of this license are available at https://www.dovepress.com/terms.php and incorporate the Creative Commons Attribution - Non Commercial (unported, v3.0) License.
By accessing the work you hereby accept the Terms. Non-commercial uses of the work are permitted without any further permission from Dove Medical Press Limited, provided the work is properly attributed. For permission for commercial use of this work, please see paragraphs 4.2 and 5 of our Terms.
© 2021 The Author(s). This work is published and licensed by Dove Medical Press Limited. The full terms of this license are available at https://www.dovepress.com/terms.php and incorporate the Creative Commons Attribution - Non Commercial (unported, v3.0) License.
By accessing the work you hereby accept the Terms. Non-commercial uses of the work are permitted without any further permission from Dove Medical Press Limited, provided the work is properly attributed. For permission for commercial use of this work, please see paragraphs 4.2 and 5 of our Terms.