")
Back to Journals » Patient Preference and Adherence » Volume 15
Comparing the Sensitivities of Measures of Adherence to Antihypertensive Drugs Using Korean National Health Insurance Claims Data
Authors Choo E , Jung M , Shin J, Lee S
Received 31 May 2021
Accepted for publication 29 July 2021
Published 8 August 2021 Volume 2021:15 Pages 1717—1728
DOI https://doi.org/10.2147/PPA.S322745
Checked for plagiarism Yes
Review by Single anonymous peer review
Peer reviewer comments 3
Editor who approved publication: Dr Johnny Chen
Eunjung Choo,1,* Minji Jung,1,* Jaekyu Shin,2 Sukhyang Lee1
1Division of Clinical Pharmacy, College of Pharmacy, Ajou University, Suwon, Republic of Korea; 2Department of Clinical Pharmacy, School of Pharmacy, University of California, San Francisco, CA, USA
*These authors contributed equally to this work
Correspondence: Sukhyang Lee
Division of Clinical Pharmacy, College of Pharmacy, Ajou University, 206 Worldcup-ro Yeongtong-gu, Suwon, 16499, Republic of Korea
Tel +82-31-219-3443
Fax +82-31-219-3435
Email [email protected]
Purpose: Numerous studies have utilized various forms of adherence measures. However, methods for measuring adherence are inconsistent. Moreover, few studies are available that have compared sensitivities of the effects of several criteria on medication adherence. This study aims to compare measures of adherence using varied analytical decisions.
Materials and Methods: We included three measures for adherence: proportion of days covered with one or more medications (PDCwith≥ 1), duration weighted mean PDC (PDCwm), and daily polypharmacy possession ratio (DPPR). We compared the sensitivities of the measures by changing parameters in the Korean nationwide claims database. First, we used PDCwith≥ 1 as our base model. Then, we divided an adherence measure algorithm into three categories: (1) definition of data cleaning, (2) inclusion criteria and observation period, and (3) calculation methods of medication adherence. The categories included eight decision nodes that incorporated 25 alternative options. Finally, we assessed the medication adherence for the base-case with commonly used values and then varied to measure with each alternative option.
Results: The base-case included 14,288 beneficiaries with antihypertensives. Among eight decisions, both handling an end-date-of-study and overlaps had the strongest impacts on measuring PDCwith≥ 1, PDCwm, and DPPR, with small differences in sample size. Instead of the estimates of adherence from PDCwm, those of PDCwith≥ 1 and DPPR were similar. Furthermore, a tendency toward a higher medication adherence was observed with a smaller study population.
Conclusion: The decisions regarding identifying an end-date-of-study and overlaps showed meaningful impacts of all three measures including PDCwith≥ 1, PDCwm, and DPPR on measuring medication adherence.
Keywords: medication adherence, proportion of days covered, PDC, daily polypharmacy possession ratio, DPPR, sensitivity analysis, pharmacoepidemiology
Introduction
Medication adherence affects clinical outcomes and healthcare costs for different individuals.1 High levels of adherence to medications have been associated with decreased rates of morbidity and mortality compared to non-adherence.2 Furthermore, improving medication adherence could reduce annual medical costs by between US$5271 and US$52,341, thereby relieving healthcare burden and saving on healthcare resources.3
Meanwhile, using accurate measures of medication adherence is important for both researchers and practitioners. This is because such accurate measures enable researchers to identify possible predictors related to the improvement and maximization of adherence. At the same time, these are important for practitioners in evaluating medication-taking, clinical outcomes, and cost-effectiveness, which can eventually resolve healthcare problems. Previous studies have demonstrated that the definition of medication adherence could influence the estimates of exposure risks, which could affect study outcomes.4–6 Moreover, the quality of data on medication adherence can influence the interpretation of the results of epidemiologic studies and clinical trials.7,8 Hence, it is critical to define medication adherence with accurate measures.
Although numerous studies have utilized adherence measures, inconsistent definitions, approaches, or methods for measuring adherence among these works remain.9–11 Furthermore, the measured medication adherences depend on different modeling decisions.12–14 A previous sensitivity analysis also revealed that the varying assumptions made during medication adherence estimation can impact the results of analyses.12 Most researchers have emphasized the importance of standardization for measuring medication adherence.10,15
As part of understanding how to measure adherence related to chronic drug use, in the current study, patients with antihypertensive medications were examined for representative therapies with a conventional drug use of both monotherapy and combination therapy. Patients with hypertension commonly use the regimens to control their diseases with different mechanisms of actions for the drugs, with the expectation that the combination of these drugs can exert synergistic effects when used together.16 However, little is known in terms of standardizing these approaches regarding measuring medication adherence. Related to this, a previous study emphasized the need to explore varied decisions on adherence with respect to combination therapy as well as monotherapy.13
The proportion of days covered (PDC) is one of the more commonly used metrics to estimate medication adherence during the implementation phase of the adherence.17 According to the Pharmacy Quality Alliance, measures of PDC result in a more reliable and conservative value, particularly in cases of chronic drug therapies.18 A recent systematic review of 147 studies (including observational studies, randomized controlled trials, and a validation study) has reported that PDC (17.7%) was the most frequently used concept of adherence to a combination therapy, although it did not have a uniformly defined or calculated standard.10
With the goal of analyzing the comparative impacts of varied options for medication adherence using claims data, PDC identified as considering one or more medications (PDCwith≥1) was defined as the basic concept of PDC in the current study. Additionally, to investigate the robustness of our results, two more measures, namely, duration weighted mean PDC (PDCwm) and daily polypharmacy possession ratio (DPPR) were compared to PDCwith≥1.
Materials and Methods
Setting and Design
We used the population-based claim data between 2005 and 2015 from the Korean National Health Insurance Service–National Sample Cohort (NHIS-NSC) database (NHIS-2019-2-081).19 First, we performed a sensitivity analysis using the NHIS-NSC data covering the following criteria: nationwide insured subjects aged over 20 years, had been diagnosed with hypertension, and had newly started antihypertensive medications, with at least one prescription in the index year of 2007. Hypertension diagnosis was identified with the International Statistical Classification of Diseases and Related Health Problems, Tenth Revision codes (I10-I15). The following five antihypertensive drug classes were included: angiotensin-converting enzyme inhibitors, angiotensin II receptor blockers, beta blockers, calcium channel blockers, and diuretics (Supplemental Table 1). The index date was identified as the first date of antihypertensive prescriptions in the year 2007.
To ensure privacy, the NHIS removed and encrypted the private and identifiable information of all subjects before providing the data. Thus, our study was exempted from acquiring patients’ informed consent. Nevertheless, we still sought the approval of the Institutional Review Board of Ajou University (IRB No. 201905-HB-EX-001).
Medication Adherence
Proportion of Days Covered with One or More Drugs (PDCwith≥1)
In this study, PDCwith≥1 is defined as the ratio of the number of days a patient is covered by one or more medications to the total number of days within a certain period. PDCwith≥1 was calculated as a ratio of two quantities, namely, the number of days covered by one or more prescriptions during the observation period, divided by the number of days from the first prescription to the end of the observation period (Figure 1).20,21
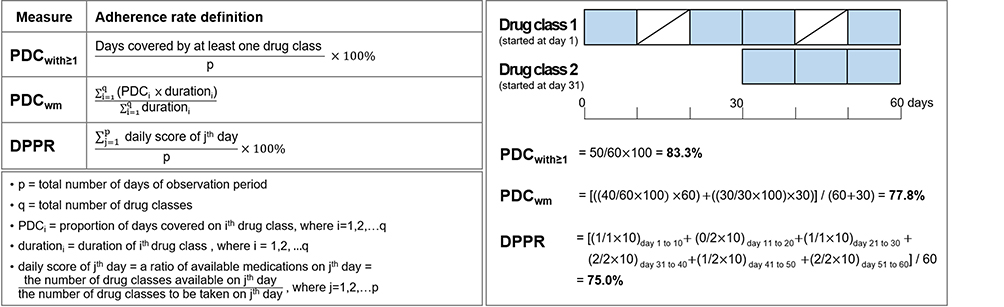 |
Figure 1 Descriptive definitions of medication adherence measures including PDCwith≥1, PDCwm, and DPPR. Abbreviations: PDCwith≥1, proportion of days covered with one or more medications; PDCwm, duration weighted mean PDC; DPPR, daily polypharmacy possession ratio. Notes: The right part describes how three measures are calculated and applied to derive medication adherences as hypothetical scenarios of claim data. Each box covers 10 days and a box with blue color means days’ supply. |
Duration Weighted Mean PDC (PDCwm)
PDCwm refers to the duration weighted mean of PDC, where some values contributed more than others, according to the duration of drug use.22 PDCwm was calculated as the sum of each value of multiplication of each drug’s duration weight by its PDC, divided by the sum of the weights (Figure 1).
Daily Polypharmacy Possession Ratio (DPPR)
DPPR is defined here as the proportion of all medications available for daily use. We calculated the DPPR by dividing the sum of each day’s score by the number of days in the study period. Each day’s score was estimated as a ratio of the number of drugs available for the day to the number of drugs to be taken for the day (Figure 1).11,23
Among various measures of medication adherence, as PDCwm and DPPR, which were commonly used, novel and considered more probable and elaborate than PDCwith≥1, we compared both measures compared to PDCwith≥1.10,14,23,24 We identified 80% as the threshold above which subjects were considered adherent to chronic medications.21,22,25
Algorithm Definition
In order to compare various decisions related to antihypertensive medication adherence including both monotherapy and combination therapy using claims data, we divided the adherence-measuring algorithm into three categories: (1) “definition of data cleaning,” (2) “inclusion criteria and observation period,” and (3) “calculation methods of medication adherence.” These three categories comprised eight decision nodes incorporating a total of 25 alternative options. Each decision node included two or more options. Next, we defined a base-case with the most commonly used values, against which all other alternative options were compared. Then, medication adherence was measured by changing one alternative option in one decision node, keeping the base-case fixed at all but one option. Finally, to perform a sensitivity analysis that aimed to compare the various decisions, we identified which decision nodes and alternative options showed maximum variations in adherence measures, along with the sample size compared to a base-case.
Category (1): “Definition of Data Cleaning”
The first category, “definition of data cleaning,” aimed to handle the claims data to fit our study design. To calculate antihypertensive medication adherences, we analyzed differences of each alternative option selected in terms of irregular antihypertensive prescriptions and duplicate redundant claims. We considered in-hospital medication initiation, use of injectable agents, and short-term prescribing under seven days as the irregular antihypertensive medication uses. In addition, due to the nature of claims database, we considered duplicate claims as administrative error.12
Category (2): “Inclusion Criteria and Observation Period”
This category included decisions pertaining to study designs of inclusion criteria including a minimum number of prescriptions, pre-index period, minimum cumulative number of days’ supply and observation period.26 In our study, a minimum of two prescriptions was identified as the base-case.27,28 To align with the first prescribed episode, we defined a pre-index period or the prescription-free period before the index date. A pre-index of 365 days, our base-case, is quite common in previous studies on chronic medications.29–31 In addition, we defined the base-case for the minimum period of medication use, which was referred to how long medications were taken, as 90 days and set the observation period of 3 years in the current study.32
Category (3): “Calculation Methods of Medication Adherence”
The last category sought to define medication adherence calculations by identifying the end-date-of-study and the overlaps. In case of handling an end-date-of-study, we compared two options: the prescription-based and the fixed period-based approach.4,22 The prescription-based approach considers the end-date-of-study as the last prescription plus the supply for the inclusive days. Alternatively, the fixed period-based defines the end-date-of-study as the last day of the observation period. We also observed how different decisions made regarding overlaps of the same drug class can affect the measures used. Here, we defined the unconditional carryover of overlaps from a previous prescription to the following prescription as our base-case. Alternative approaches were considered carried over: (1) if the carryover of surplus days from the earlier prescription overlaps within a period of under 14 days, (2) if the carryover of those prescriptions was issued by the same institution, and (3) no carryover was granted. The underlying assumption for the option of the carryover was that the following prescription was taken earlier before the end of the first prescription.13,20 We assumed the option of being left as it was meant being concurrently used at the same time. As combination therapies among the different drug classes are common, the carryover of overlaps was not granted for inter-classes.
Statistical Analysis
Categorical variables were compared by using the chi-square test and were described as numbers and percentages. Continuous variables were compared by using the Kruskal–Wallis test. In spite of a large population, the variables were determined to be non-normally distributed. Thus, they were reported as medians with quantile 1–quantile 3 (Q1–Q3) and also as means with standardized deviations (SDs). The rate of adherent patients was calculated on the basis of the percentage of number of patients with over 80% adherence. When comparing three measures, percentage changes were calculated by dividing differences in the estimates including medians and means or rates of adherent patients measured using PDCwm and DPPR by those of PDCwith≥1, respectively. A p-value of <0.01 was considered statistically significant. All data analyses were conducted using SAS Version 9.4 (SAS Institute, Cary, NC, USA).
Results
Baseline Characteristics
To compare sensitivities of the adherence using varied analytical decisions, we examined antihypertensive medication adherence including both monotherapy and combination therapy. The study population consisted of 117,771 adults who had a diagnosis of hypertension and had recently started on at least one prescription for any study antihypertensive medication in the index year of 2007 in Korea. From these, a sample of 14,288 patients with both monotherapy and combination therapy was finalized following the base-case criteria: conditions including each prescription over 7 days’ supply, de-duplication of redundant prescriptions, patients with at least two prescriptions, a total of over 90 days’ supply, a 365 days pre-index period, at least a 3-year observation period, identifying an end-date-of-study by a prescription-based way, and handling the carryover of overlaps from the earlier prescription for the same drug class unconditionally (Supplemental Table 2). In accordance with the base-case, the mean (SD) age of the subjects was 57.42 (12.86) years. There were 7440 (52.1%) male patients and 1219 (8.5%) disabled persons. The antihypertensive therapy at index date consisted of monotherapy (60.9%), dual therapy (29.9%), and more than triple therapy (9.3%). A total of 9857 (69.0%) patients had visited 1 or 2 medical care institutions during the observation period, whereas 4431 (31.0%) patients had visited 3 or more than institutions (Table 1). In the following sections, our results reveal the sensitivity of PDCwith≥1 for each decision node, followed by a comparison of the results of PDCwm and DPPR with those of PDCwith≥1, respectively. Additionally, we identified medication adherence while dividing monotherapy and combination therapy at the index date in Supplemental Tables 3–5.
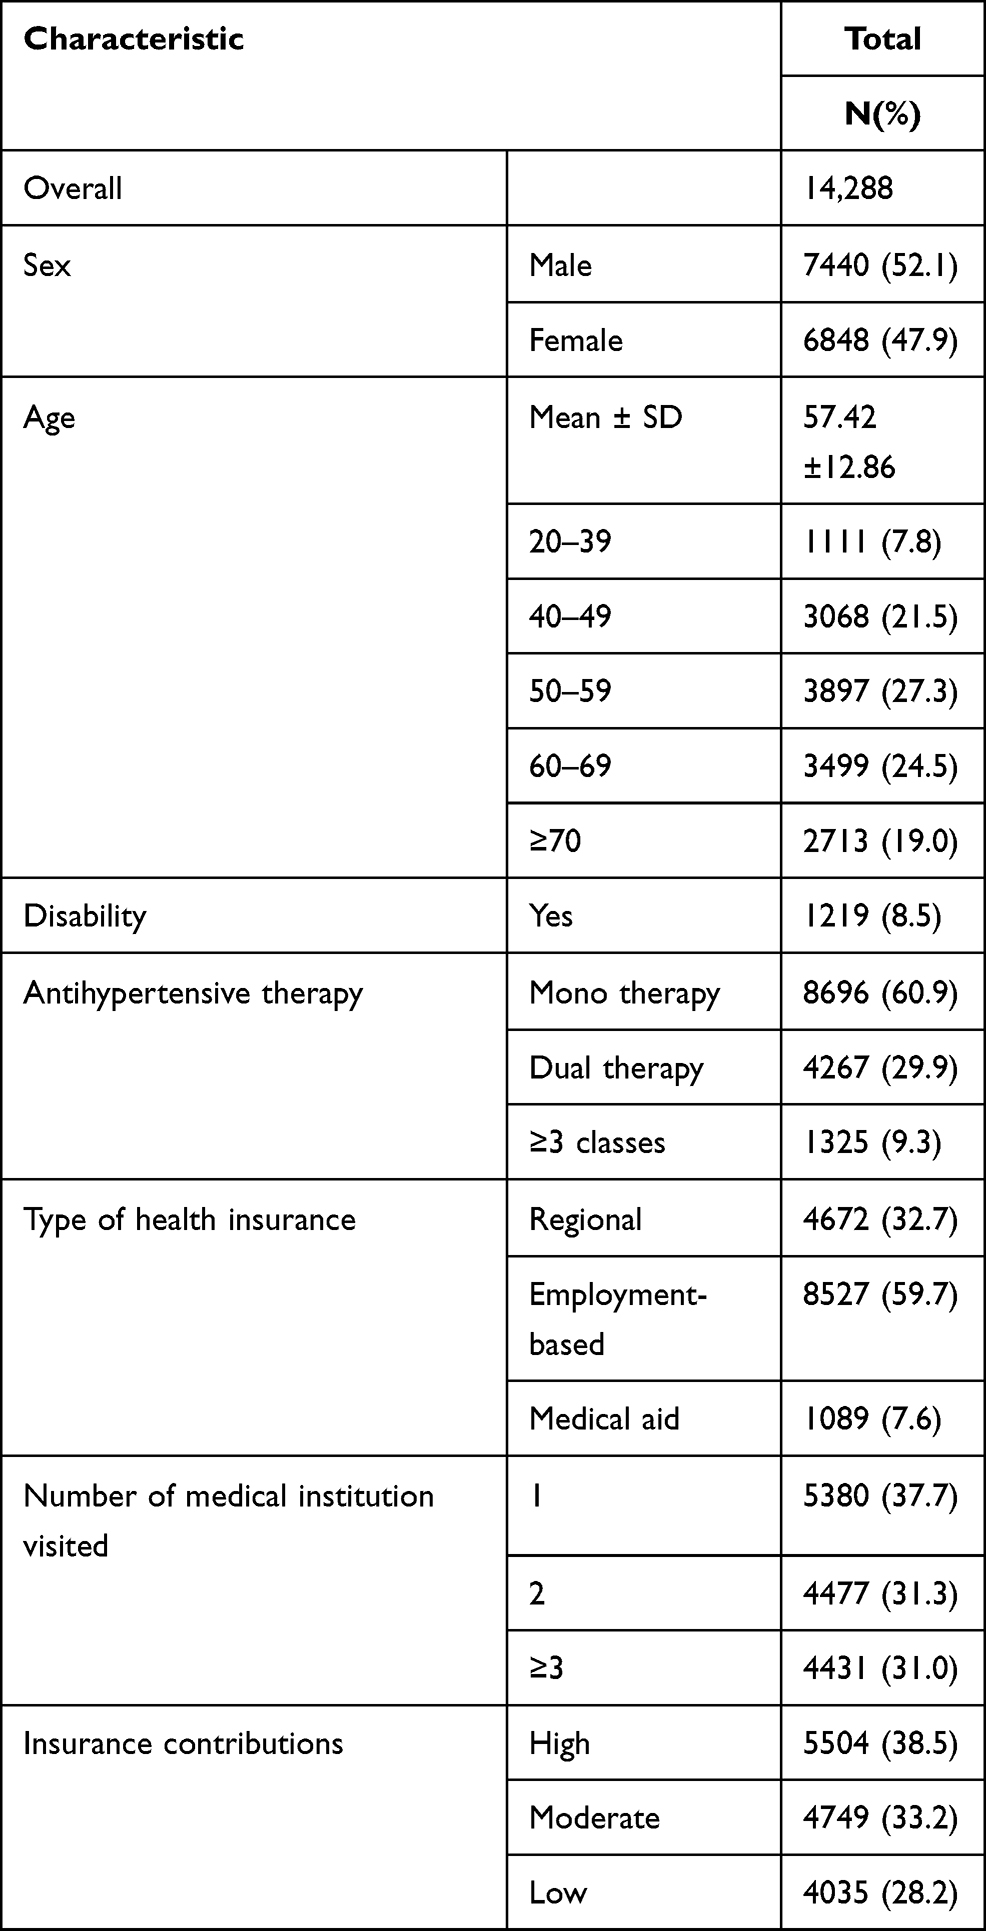 |
Table 1 Baseline Characteristics of Study Population in the Base-Case Setting |
Category (1): “Definition of Data Cleaning”
For the base-case of our sensitivity analysis, the sample had a mean (SD) and median (Q1–Q3) PDCwith≥1 of 76.70% (24.59) and 86.80% (63.05–96.15), respectively, with 8549 (59.8%) adherent patients. After comparing the elimination of prescriptions with irregular use of antihypertensive medications in the base-case (the short-term users were defined as subjects with under 7 days’ supply), the other alternative options (including in-hospital medication initiation and in-hospital prescription or use of injectable agents) produced similar results (0.79% and 0.84%, respectively). Furthermore, the options of whether duplicate claims were removed or retained showed the same results for PDCwith≥1 (differences of mean and median were 0.33% and 0.57%, respectively), with a slight difference in sample size (12 individuals), as shown in Table 2.
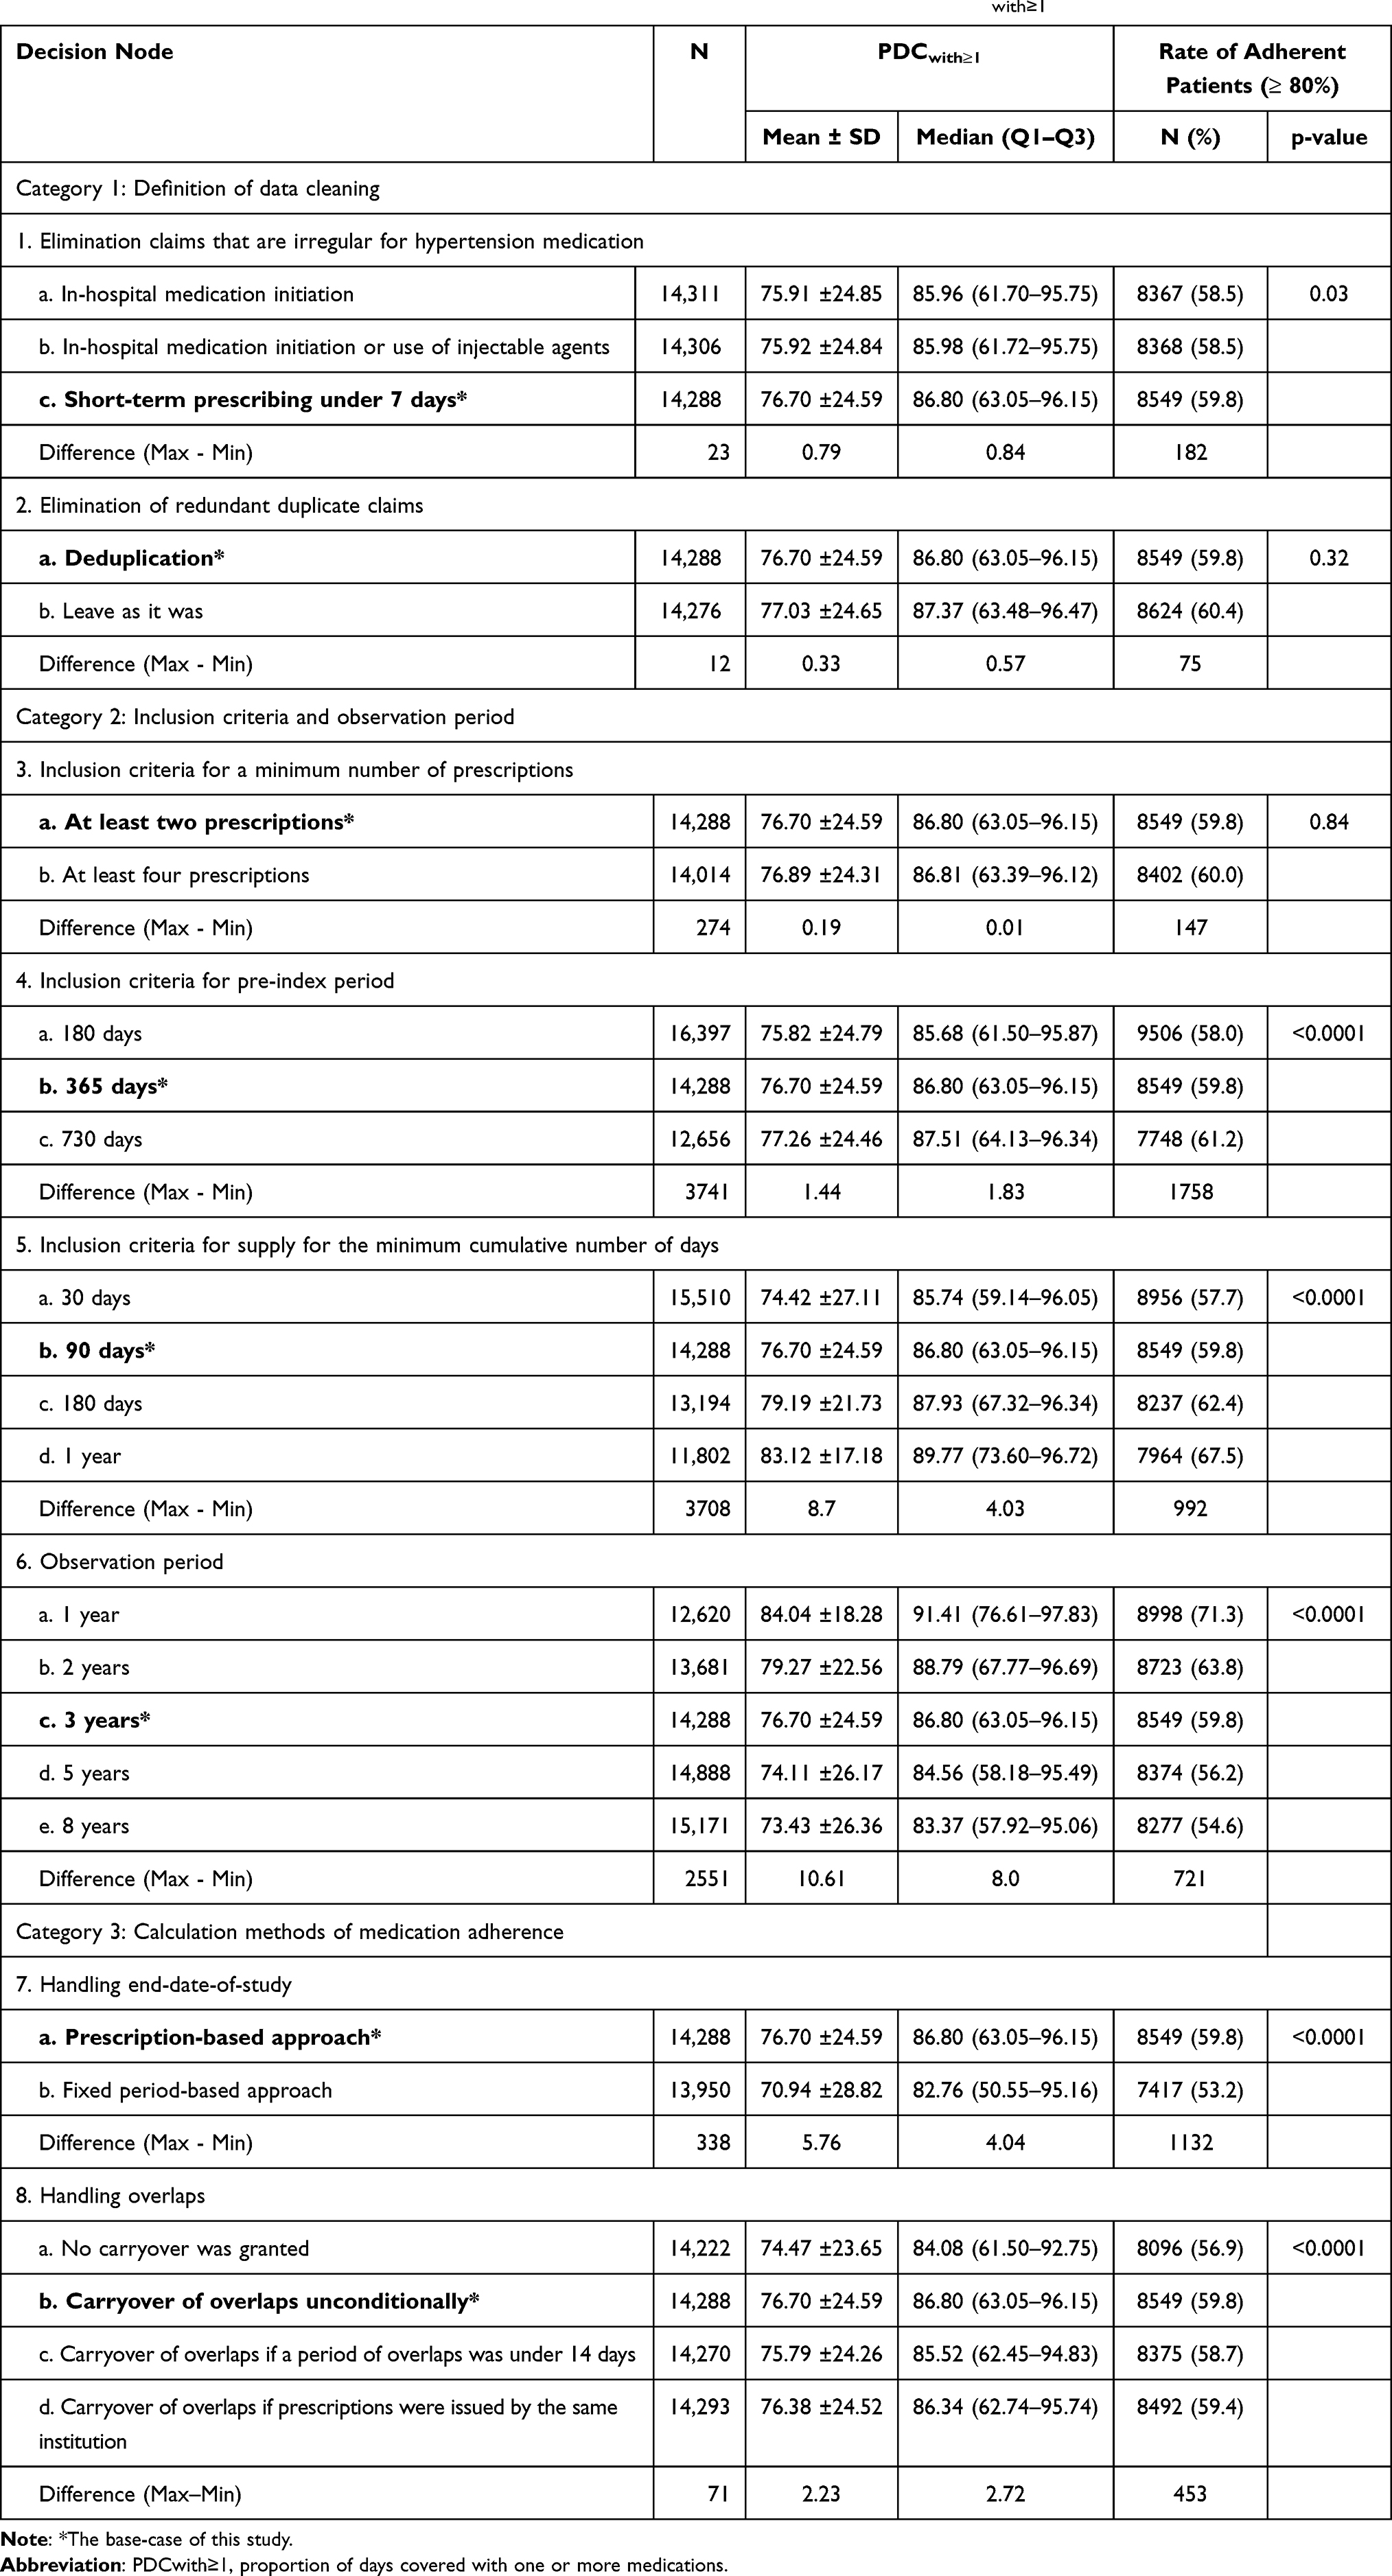 |
Table 2 Diverse Impacts of Measures of Medication Adherence with Varied Options on PDCwith≥1 |
Category (2): “Inclusion Criteria and Observation Period”
In our study, three node-related inclusion criteria and one node-related observation period were identified sensitively to assess the medication adherence. As can be seen, the results of PDCwith≥1 were similar when minimum numbers of prescriptions were 2 or 4, with only 0.19% of mean difference PDCwith≥1 and with decreasing population size of 274 people. For the second decision node, compared to the 365-day pre-index period, the median PDCwith≥1 decreased by 1.12% with the reduced 180-day pre-index period, and the median PDCwith≥1 increased by 0.71% with the increased 730-day pre-index period. In addition, as the minimum cumulative number of days’ supply increased from 30 days to 1 year, the study sample size decreased from 15,510 to 11,802 patients, and the percentages of adherent patients increased from 57.7% to 67.5% with the change of mean (SD) PDCwith≥1 from 74.42% (27.11) to 83.12% (17.18). Moreover, we found that the mean (SD) PDCwith≥1 decreased as the observation period became longer from the largest value of 84.04% (18.28) during the 1-year observation period to the smallest value of 73.43% (26.36) during the 8-year observation period. The differences between the largest and smallest values for the number of included patients and the rate of adherent patients were 2551 and 16.7%, respectively (Table 2 and Supplemental Table 6).
Category (3): “Calculation Methods of Medication Adherence”
Table 2 presents the comparisons of PDCwith≥1 concerned with an end-date-of study and overlaps for the same drug class. As can be seen, the mean PDCwith≥1 decreased by 5.8% when we defined the end-date-of-study as a fixed period-based concept (70.94%) compared to the base-case of prescription-based concept (76.70%). The percentage of adherent patients was higher in the base-case than that in the alternative option (59.8% vs 53.2%), with a small difference in sample size (14,288 vs 13,950). Furthermore, the overlapped two prescriptions were observed to be quite common with the chronic use of antihypertensive medications. In terms of handling the overlapped days of the same drugs, the three other approaches including the base-case, carryover when overlaps were under 14 days, or carryover when issued by the same institution had similar results, with higher than the option of left as it was. The highest median PDCwith≥1 was 86.80% in the base-case, and the lowest median PDCwith≥1 was 84.08% in left as it was, with similar number of included patients (14,288 vs 14,222). The results of three categories related to PDCwith≥1 are plotted in Figure 2.
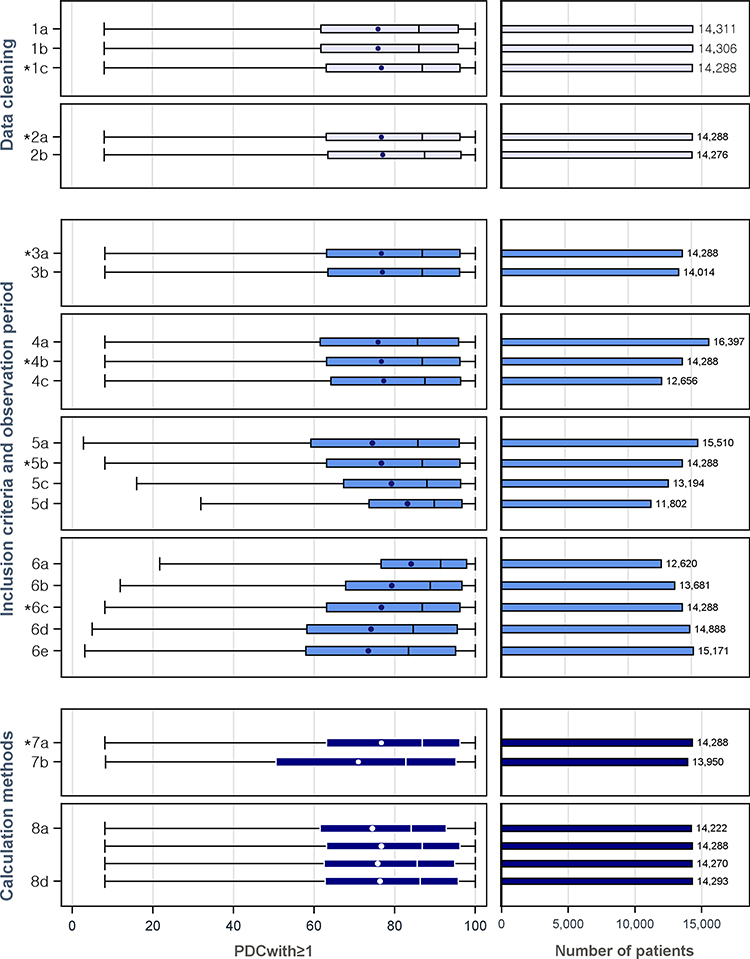 |
Figure 2 Diverse impacts of measures of medication adherence and rates of adherent patients with varied options on PDCwith≥1. Abbreviation: PDCwith≥1, proportion of days covered with one or more medications. Notes: Among the eight decision nodes measured, the two choices that had the most impact were handling the end-date-of-study and overlaps in the third category, with few differences in the sample size. Decision node 1. Elimination claims that are irregular (1a: In-hospital medication initiation, 1b: In-hospital medication initiation or use of injectable agents, 1c: Short-term prescribing under 7 days). Decision node 2. Elimination of duplicate claims (2a: Deduplication, 2b: Leave as it was). Decision node 3. Minimum number of prescriptions (3a: At least two prescriptions, 3b: At least four prescriptions). Decision node 4 Pre-index period (4a: 180 days,4b: 365 days, 4c: 730 days). Decision node 5. Minimum cumulative number of days’ supply (5a: 30 days,5b: 90 days, 5c: 180 days, 5d: 1 year). Decision node 6. Observation period (6a: 1 year, 6b: 2 years, 6c: 3 years, 6d: 5 years, 6e: 8 years). Decision node 7. Handling end-date-of-study (7a: Prescription-based, 7b: Fixed period-based). Decision node 8. Handling overlaps (8a: No carryover was granted, 8b: Carryover of overlaps unconditionally, 8c: Carryover of overlaps if a period of overlaps was under 14 days, 8d: Carryover of overlaps if prescriptions were issued by the same institution). *The base-case of this study. |
Comparison with PDCwm and DPPR to PDCwith≥1
Thus far, we have described the relative effects on PDCwith≥1 of different options in each decision node. However, considering the nature of antihypertensive medications, such as combination therapy, more conservative measures, such as PDCwm and DPPR, were comparatively evaluated. The corresponding results from these measures were compared with those of PDCwith≥1. As revealed by the results, the overall trends of the abovementioned two measures were similar to those of PDCwith≥1 in every single choice. At the base-case, we found that the estimates for DPPR were more similar to those for PDCwith≥1 and larger than the results for PDCwm. The percentage changes in mean (SD), median (Q1–Q3), and the rate of adherent patients between PDCwm and PDCwith≥1 and between DPPR and PDCwith≥1 were −2.76% vs −0.46%, −3.70% vs −0.47%, and −7.85% vs −0.69%, respectively (Table 3 and Supplemental Figure 1).
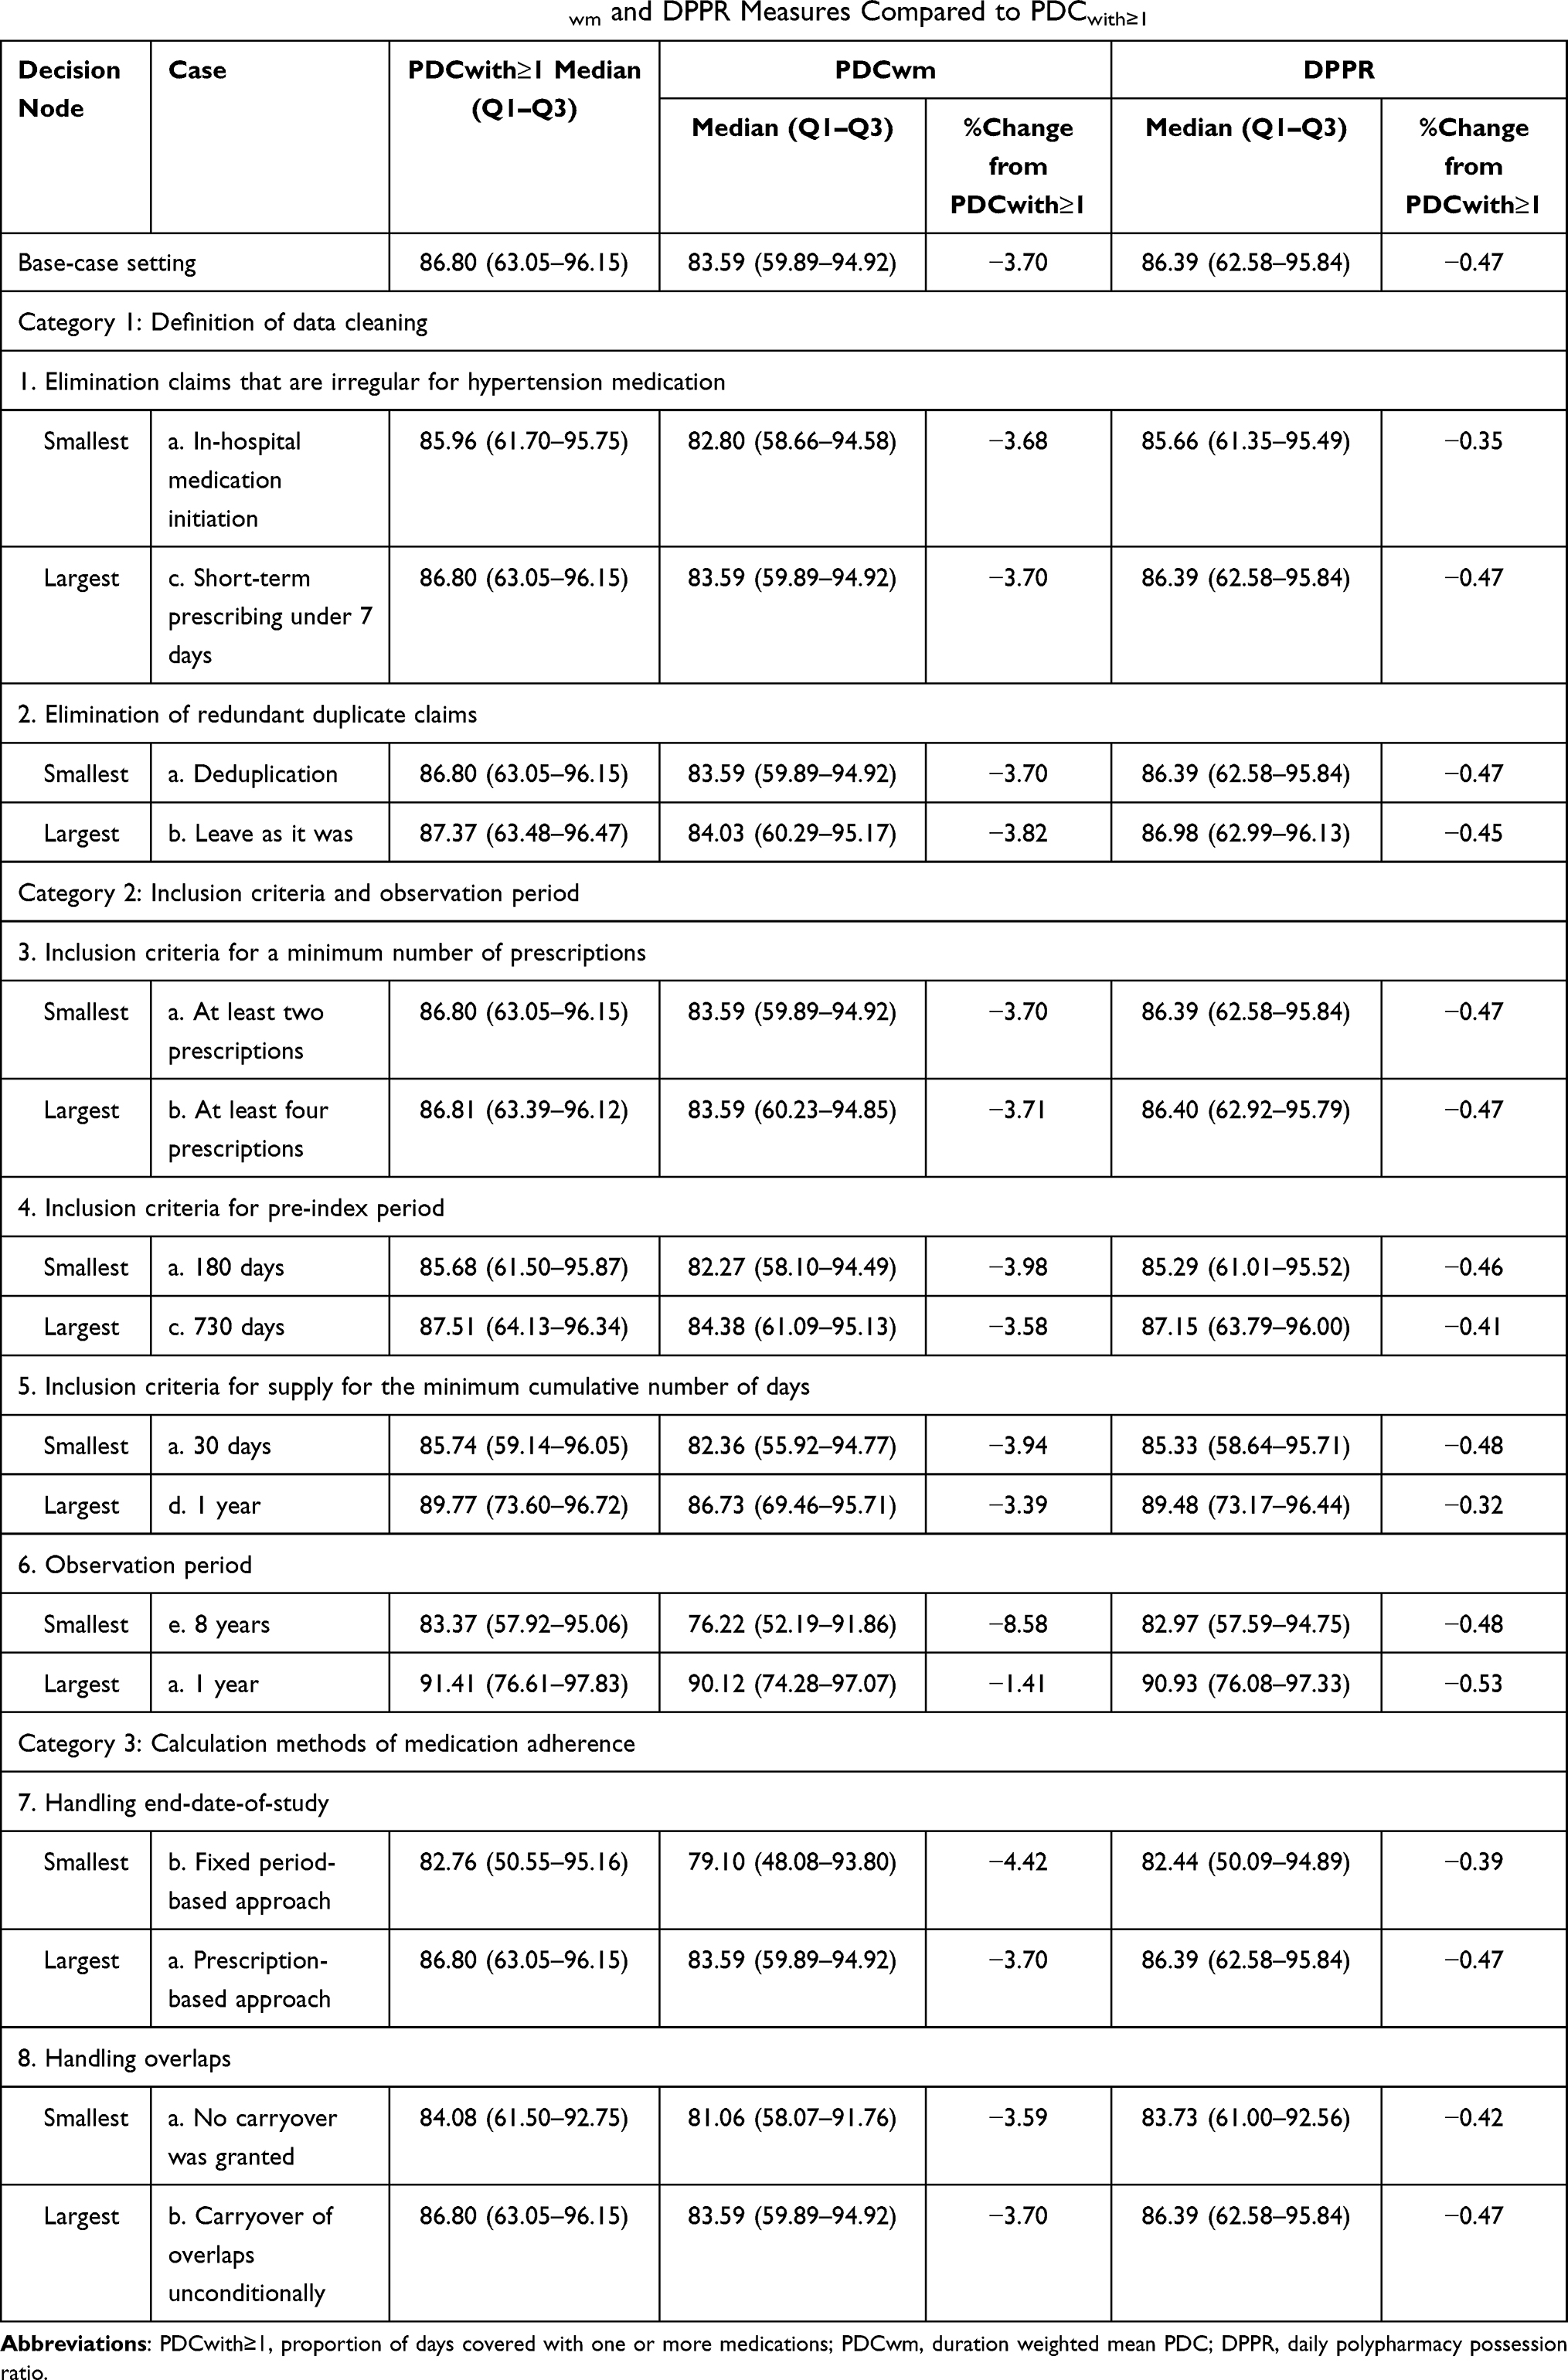 |
Table 3 Comparing the Varied Impacts of PDCwm and DPPR Measures Compared to PDCwith≥1 |
Discussion
In this study, we examined the relative impacts of diverse methodological decisions on medication adherence using claims data, the results of which are relevant in studies that examine health or cost-effectiveness outcomes. We compared the influences of diverse options for PDCwith≥1, PDCwm, and DPPR by measuring medication adherence while considering both monotherapy and combination therapy. Although our findings are small absolute differences with statistical significances, we could provide evidence regarding which decision is proper depending on research purposes and clinical situations. To the best of our knowledge, this is the first sensitivity analysis with different options, with the aim of comparing three adherence measures of antihypertensive medications in Korea.
We calculated medication adherence in the base-case with commonly used values and then varied each alternative option individually to compare their impacts on the adherence. While less variation was observed when comparing most of the alternatives to the base-case, certain decision nodes seemed to have had meaningful impacts on measures of adherence. Among the eight decision nodes measured, the two choices that had the most impact were handling the end-date-of-study and overlaps in the third category. These two nodes showed influential impacts on adherence measures, with few differences in the sample size. For our results, diverse options for handling end-date-of-study and overlaps varied in terms of sample size only: 338 (2.4%) and 71 (0.5%), respectively. The small difference between the numbers of study samples could mean that each population of each option is similar, resulting in little selection bias and revealing the impacts of decisions. Furthermore, the impacts of these decisions on medication adherence might be related to methodological approaches, rather than data sources or study purposes, thus ruling out the possibility of bias related to the study cohort. On the basis of our findings, we demonstrated that two nodes must be taken into account when performing analyses, interpreting the research outcomes, and comparing them to others. Consistent with our findings, the results of recent sensitivity analyses highlighted the importance of using an analytical approach in examining the end-date-of-study and overlaps.12,13 Previous studies also supported our findings, which indicated that PDCwith≥1 from the fixed period-based approach was lower than that of the prescription-based approach.22,24 As for the carryover, the values of PDCwith≥1 between the condition with under 14 days and the same institution were similar. This can be inferred to mean that most prescriptions regarding overlaps were issued by the same institution.
Moreover, a tendency toward a higher medication adherence was observed with a smaller study population. Previous studies supported our finding that the longer observation period with the larger study population led to the smaller PDCwith≥1 observed.9,33 We assumed that more requirements for inclusion would be relevant to a smaller sample size remaining a sample with a higher adherence. Moreover, selection bias from different samples may affect to broaden diversity of medication adherence estimates, thus indicating the importance of controlling the bias.34 These findings are in line with those reported by a previous study, which examined the impacts of the medication possession ratio for a single drug to modeling decisions in large claims databases.13
One outstanding finding of our study is that the three measures of PDCwith≥1, PDCwm, and DPPR had similar results that handling the end-date-of-study and overlaps in the third category were impactful, thus ensuring the robustness of this study. Especially, the estimates for PDCwith≥1 and DPPR had similar results. This could mean that, among the three, the conceptually simplest approach (PDCwith≥1) was almost the same as the most theoretically precise and complicated approach (DPPR) in measuring antihypertensive medication adherence while tracking combination therapy. Meanwhile, PDCwm was adjusted by the average duration; thus, it seemed to be lower than those two measures. Choosing a simple and accurate method can provide efficient processes and results for both researchers and clinicians, considering both the factors of reliability and applicability. In this study, we verified that applying PDCwith≥1, instead of DPPR, is sufficient when measuring antihypertensive medication adherence. The findings of this study may, therefore, provide better insights in identifying an easier approach for measuring adherence.
However, a careful interpretation of our findings is needed due to some limitations. First, we did not examine all the impacts of different decisions simultaneously, but only identified those of each decision given that there were 5760 cases. Thus, our findings might be conservative, and further research is warranted. Second, we did not examine medication adherence upon the antihypertensive therapy or dosage change, as treatment regimens of antihypertensive medications tend to change frequently.16 Moreover, a previous study showed that different methods of assuming antihypertensive medications’ prescribed daily dose had significant differences on calculating PDC in patients with chronic heart failure using claims data.35 Further research is warranted to validate these factors. Third, each antihypertensive drug class has a specific indication and regimen.36 However, as we mainly focused on the methodological impacts of each decision on adherence, we did not perform analyses according to drug classes. Previous studies have shown associations between antihypertensive medication adherence and drug classes, with lower adherence to diuretics and highest adherence to angiotensin II receptor blockers.37,38 Finally, our results regarding antihypertensive prescriptions based on claims data, representing proxy measures of adherence, might be altered according to different types of drugs, patterns of use, or data sources. According to these factors, as sensitivities of measures of medication adherence could be different,12 additional research is warranted to validate the outcomes on each occasion.
Despite these limitations, our study reflects the real-world setting based on a Korean representative claims database, the NHIS-NSC. Although a large number of medication adherence measurement methods exist, no standard has yet to be identified.10 Imprecise measures of medication adherence can induce misinterpreted efficacy or safety of therapy, thus leading to possibly costly and hazardous problems. To help resolve these problems, the present study examined various approaches for measuring adherence and provided evidence on which factor was the most impactful. Our results could add more insights into the measures of medication adherence, reflecting patterns of antihypertensive medication use in Korea.
Conclusion
We identified the comparative impacts of different options for medication adherence measures including PDCwith≥1, PDCwm, and DPPR using a Korean nationwide claims database with antihypertensive prescriptions. The decisions regarding identifying an end-date-of-study and overlaps showed meaningful impacts of all three measures on measuring medication adherence. Our findings suggest that researchers focus on these decisions when deciding on a proper approach for their research. Further sensitivity studies are needed to examine the validity and reliability of measuring adherence for antihypertensive drugs.
Acknowledgment
This research was supported by a grant (21153MFDS602) from the Ministry of Food and Drug Safety in 2021.
Disclosure
The authors report no conflicts of interest in this work.
References
1. Brown MT, Bussell JK. Medication Adherence: WHO Cares? Elsevier; 2011:304–314.
2. Roebuck MC, Liberman JN, Gemmill-Toyama M, Brennan TA. Medication adherence leads to lower health care use and costs despite increased drug spending. Health Aff. 2011;30(1):91–99. doi:10.1377/hlthaff.2009.1087
3. Cutler RL, Fernandez-Llimos F, Frommer M, Benrimoj C, Garcia-Cardenas V. Economic impact of medication non-adherence by disease groups: a systematic review. BMJ Open. 2018;8(1):e016982. doi:10.1136/bmjopen-2017-016982
4. Van Staa T-P, Abenhaim L, Leufkens H. A study of the effects of exposure misclassification due to the time-window design in pharmacoepidemiologic studies. J Clin Epidemiol. 1994;47(2):183–189. doi:10.1016/0895-4356(94)90023-X
5. Steiner JF, Prochazka AV. The assessment of refill compliance using pharmacy records: methods, validity, and applications. J Clin Epidemiol. 1997;50(1):105–116. doi:10.1016/S0895-4356(96)00268-5
6. Blais L, Vilain A, Kettani F-Z, et al. Accuracy of the days’ supply and the number of refills allowed recorded in Québec prescription claims databases for inhaled corticosteroids. BMJ Open. 2014;4(11):11. doi:10.1136/bmjopen-2014-005903
7. Farmer KC. Methods for measuring and monitoring medication regimen adherence in clinical trials and clinical practice. Clin Ther. 1999;21(6):1074–1090. doi:10.1016/S0149-2918(99)80026-5
8. Spilker B, Cramer J. Patient Compliance in Medical Practice and Clinical Trials. Raven Press; 1991.
9. Vollmer WM, Xu M, Feldstein A, Smith D, Waterbury A, Rand C. Comparison of pharmacy-based measures of medication adherence. BMC Health Serv Res. 2012;12(1):155. doi:10.1186/1472-6963-12-155
10. Pednekar PP, Agh T, Malmenäs M, et al. Methods for measuring multiple medication adherence: a systematic review–report of the ISPOR medication adherence and persistence special interest group. Value Health. 2019;22(2):139–156. doi:10.1016/j.jval.2018.08.006
11. Zongo A, Grégoire J-P, Moisan J, Guénette L. Measuring adherence to oral antidiabetic multi-drug treatment: comparative validity of prescription claims-based adherence measures against hospitalization. Res Social Adm Pharm. 2019;15(6):738–743. doi:10.1016/j.sapharm.2018.09.005
12. Pye SR, Sheppard T, Joseph RM, et al. Assumptions made when preparing drug exposure data for analysis have an impact on results: a n unreported step in pharmacoepidemiology studies. Pharmacoepidemiol Drug Saf. 2018;27(7):781–788. doi:10.1002/pds.4440
13. Bjarnadottir MV, Czerwinski D, Onukwugha E. Sensitivity of the medication possession ratio to modelling decisions in large claims databases. PharmacoEconomics. 2018;36(3):369–380. doi:10.1007/s40273-017-0597-y
14. Arnet I, Abraham I, Messerli M, Hersberger KE. A method for calculating adherence to polypharmacy from dispensing data records. Int J Clin Pharm. 2014;36(1):192–201. doi:10.1007/s11096-013-9891-8
15. Hess LM, Raebel MA, Conner DA, Malone DC. Measurement of adherence in pharmacy administrative databases: a proposal for standard definitions and preferred measures. Ann Pharmacother. 2006;40(7–8):1280–1288. doi:10.1345/aph.1H018
16. Jung M, Choo E, Lee S. Comprehensive trends and patterns of antihypertensive prescriptions using a nationwide claims database in Korea. Clin Epidemiol. 2020;12:963. doi:10.2147/CLEP.S265966
17. Geest SD, Zullig LL, Dunbar-Jacob J, et al. ESPACOMP medication adherence reporting guideline (EMERGE). Ann Intern Med. 2018;169(1):
18. Nau DP. Proportion of Days Covered (PDC) as a Preferred Method of Measuring Medication Adherence. Springfield, VA: Pharmacy Quality Alliance; 2012.
19. Lee J, Lee JS, Park S-H, Shin SA, Kim K. Cohort profile: the national health insurance service–national sample cohort (NHIS-NSC), South Korea. Int J Epidemiol. 2017;46(2):e15–e15.
20. Vink N, Klungel O, Stolk R, Denig P. Comparison of various measures for assessing medication refill adherence using prescription data. Pharmacoepidemiol Drug Saf. 2009;18(2):159–165. doi:10.1002/pds.1698
21. Hedna K, Hakkarainen KM, Gyllensten H, et al. Adherence to antihypertensive therapy and elevated blood pressure: should we consider the use of multiple medications? PLoS One. 2015;10(9):e0137451. doi:10.1371/journal.pone.0137451
22. Quisel T, Foschini L, Zbikowski SM, Juusola JL. The association between medication adherence for chronic conditions and digital health activity tracking: retrospective analysis. J Med Internet Res. 2019;21(3):e11486. doi:10.2196/11486
23. Arnet I, Greenland M, Knuiman MW, et al. Operationalization and validation of a novel method to calculate adherence to polypharmacy with refill data from the Australian pharmaceutical benefits scheme (PBS) database. Clin Epidemiol. 2018;10:1181. doi:10.2147/CLEP.S153496
24. Choudhry NK, Shrank WH, Levin RL, et al. Measuring concurrent adherence to multiple related medications. Am J Manag Care. 2009;15(7):457.
25. Hansen RA, Kim MM, Song L, Tu W, Wu J, Murray MD. Adherence: comparison of methods to assess medication adherence and classify nonadherence. Ann Pharmacother. 2009;43(3):413–422. doi:10.1345/aph.1L496
26. Schneeweiss S, Patrick AR, Stürmer T, et al. Increasing levels of restriction in pharmacoepidemiologic database studies of elderly and comparison with randomized trial results. Med Care. 2007;45(10SUPL):S131. doi:10.1097/MLR.0b013e318070c08e
27. Baggarly SA, Kemp RJ, Wang X, Magoun AD. Factors associated with medication adherence and persistence of treatment for hypertension in a Medicaid population. Res Social Adm Pharm. 2014;10(6):e99–e112. doi:10.1016/j.sapharm.2014.02.002
28. Krousel-Wood M, Elizabeth H, Joyce C, et al. Differences in cardiovascular disease risk when antihypertensive medication adherence is assessed by pharmacy fill versus self-report: the Cohort Study of medication adherence among older adults (CoSMO). J Hypertens. 2015;33(2):412. doi:10.1097/HJH.0000000000000382
29. Chapman RH, Liu LZ, Girase PG, Straka RJ. Determining initial and follow-up costs of cardiovascular events in a US managed care population. BMC Cardiovasc Disord. 2011;11(1):1–10. doi:10.1186/1471-2261-11-11
30. Jung M, Lee S. Efficacy of aspirin in the primary prevention of cardiovascular diseases and cancer in the elderly: a Population-Based Cohort Study in Korea. Drugs Aging. 2020;37(1):43–55. doi:10.1007/s40266-019-00723-3
31. Jung M, Lee S. Effects of statin therapy on the risk of intracerebral hemorrhage in Korean patients with hyperlipidemia. Pharmacotherapy. 2019;39(2):129–139. doi:10.1002/phar.2211
32. Alfian SD, Denig P, Coelho A, Hak E. Pharmacy-based predictors of non-adherence, non-persistence and reinitiation of antihypertensive drugs among patients on oral diabetes drugs in the Netherlands. PLoS One. 2019;14(11):e0225390. doi:10.1371/journal.pone.0225390
33. Park E, Ryu DH, Kam S. Medication adherence trends and its related factors in newly diagnosed hypertensive patients. J Health Info Stat. 2019;44(2):141–151. doi:10.21032/jhis.2019.44.2.141
34. Pourhoseingholi MA, Baghestani AR, Vahedi M. How to control confounding effects by statistical analysis. Gastroenterol Hepatol Bed Bench. 2012;5(2):79.
35. Ihle P, Krueger K, Schubert I, et al. Comparison of different strategies to measure medication adherence via claims data in patients with chronic heart failure. Clin Pharmacol Ther. 2019;106(1):211–218. doi:10.1002/cpt.1378
36. Lee H-Y, Shin J, Kim G-H, et al. 2018 Korean society of hypertension guidelines for the management of hypertension: part II-diagnosis and treatment of hypertension. Clin Hypertens. 2019;25(1):1–24. doi:10.1186/s40885-019-0124-x
37. Kronish IM, Woodward M, Sergie Z, Ogedegbe G, Falzon L, Mann DM. Meta-analysis: impact of drug class on adherence to antihypertensives. Circulation. 2011;123(15):1611–1621. doi:10.1161/CIRCULATIONAHA.110.983874
38. Erkens JA, Panneman MM, Klungel OH, Boom GVD, Prescott MF, Herings RM. Differences in antihypertensive drug persistence associated with drug class and gender: a PHARMO Study. Pharmacoepidemiol Drug Saf. 2005;14(11):795–803. doi:10.1002/pds.1156
 © 2021 The Author(s). This work is published and licensed by Dove Medical Press Limited. The full terms of this license are available at https://www.dovepress.com/terms.php and incorporate the Creative Commons Attribution - Non Commercial (unported, v3.0) License.
By accessing the work you hereby accept the Terms. Non-commercial uses of the work are permitted without any further permission from Dove Medical Press Limited, provided the work is properly attributed. For permission for commercial use of this work, please see paragraphs 4.2 and 5 of our Terms.
© 2021 The Author(s). This work is published and licensed by Dove Medical Press Limited. The full terms of this license are available at https://www.dovepress.com/terms.php and incorporate the Creative Commons Attribution - Non Commercial (unported, v3.0) License.
By accessing the work you hereby accept the Terms. Non-commercial uses of the work are permitted without any further permission from Dove Medical Press Limited, provided the work is properly attributed. For permission for commercial use of this work, please see paragraphs 4.2 and 5 of our Terms.