")
Back to Journals » Vascular Health and Risk Management » Volume 16
Comparing the Heart–Thigh and Thigh–Ankle Arteries with the Heart–Ankle Arterial Segment for Arterial Stiffness Measurements
Authors Watahiki M, Horinaka S , Ishimitsu T, Toyoda S, Inoue T
Received 28 September 2020
Accepted for publication 21 November 2020
Published 17 December 2020 Volume 2020:16 Pages 561—570
DOI https://doi.org/10.2147/VHRM.S284248
Checked for plagiarism Yes
Review by Single anonymous peer review
Peer reviewer comments 2
Editor who approved publication: Prof. Dr. Pietro Scicchitano
Manami Watahiki,1 Shigeo Horinaka,1 Toshihiko Ishimitsu,2 Shigeru Toyoda,1 Teruo Inoue1
1Department of Cardiovascular Medicine, Dokkyo Medical University, Mibu, Japan; 2Department of Kidney and Hypertension, Dokkyo Medical University, Mibu, Japan
Correspondence: Shigeo Horinaka
Department of Cardiovascular Medicine, Dokkyo Medical University, 880 Kitakobayashi, Mibu, Shimotsuga, Tochigi 321-0293, Japan
Email [email protected]
Purpose: The cardio-ankle vascular index, applying the stiffness parameter β theory, was calculated using the pulse-wave velocity and blood pressure from the aortic orifice to the ankle. Accordingly, the impact of the stiffness of the aorta [heart–thigh β (htBETA)] and medium-sized muscular artery [thigh–ankle β (taBETA)] on the stiffness of the heart–ankle β (haBETA) was investigated; further, whether the htBETA (haBETA − taBETA) improved the power of diagnosis of coronary artery disease (CAD) was examined.
Materials and Methods: Segmental βs were calculated using VaSela with an additional thigh cuff and compared using the receiver operating characteristic (ROC) curve analysis to evaluate CAD.
Results: Overall, 90 healthy subjects and 41 patients with CAD were included. In both groups, haBETA and htBETA, but not taBETA, correlated with age, and taBETA was three times higher than htBETA (p < 0.01). Multiple regression analysis revealed that haBETA can be estimated using htBETA and taBETA in healthy subjects and patients with CAD (r = 0.86, r = 0.67, respectively, p < 0.01), and two-thirds of the haBETA components can be estimated by htBETA using the component analysis. The area under the ROC curve (AUC) for CAD in taBETA (0.493, p = n.s.) was smaller than that in haBETA (0.731, p < 0.01) or htBETA (0.757, p < 0.01); no difference was observed in AUC between haBETA and htBETA.
Conclusion: The stiffness of medium-sized muscular arteries of the age-independent thigh–ankle segment (taBETA) was constant, which was three times greater than that of the elastic artery of the heart–thigh artery (htBETA). Two-thirds of the haBETA components could be estimated using htBETA. The ROC curve analysis revealed that the AUC of haBETA could be replaced by that of htBETA, prolonging the measurement segment without affecting the diagnostic power for CAD.
Keywords: arterial stiffness, stiffness parameter, cardio-ankle vascular index, coronary artery disease
Introduction
Carotid-femoral pulse-wave velocity (cfPWV) is typically considered the most simple, noninvasive, and popular method to determine arterial stiffness worldwide, as evidenced by the epidemiological studies that have demonstrated its predictive value for cardiovascular events.1,2 By contrast, PWV measured outside the aortic trunk at the limb (from femoral to posterior tibial arteries) has no predictive value for end-stage renal disease.3 Therefore, cfPWV is considered the gold standard for arterial stiffness measurement because most elastic arteries are located here.4 However, PWV is intrinsically pressure dependent considering that arterial compliance (dV/dP) decreases with increasing pressure owing to the curvilinear relationship between arterial pressure and volume and volume (V) increases with increasing pressure, thereby directly increasing PWV, as shown in the Bramwell–Hill derived equation.5
For incompressible blood in a compressible elastic artery,
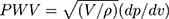
where PWV is in cm/s, V (cm3) is the volume per unit length, P (dyne/cm2) is the pressure, and ρ (g/cm3) is the blood density.
Spronk et al6 demonstrated that short-term changes in local carotid PWV—calculated based on the relationship between echo-acquired cross-sectional area and tonometric blood pressure measurement—that are concurrent with a decrease in blood pressure can be deemed blood pressure dependent at a rate of approximately 1 m/s per 10 mmHg diastolic blood pressure. To overcome this limitation, the cardio-ankle vascular index (CAVI) is used considering that it is less pressure dependent and derived from stiffness parameter β,7 which is calculated based on the blood pressure and PWV8 as follows:

where a and b are coefficients,9 Ps (dyne/cm2) is the systolic blood pressure, Pd is the diastolic blood pressure,  P is Ps – Pd, ρ (g/cm3) is the density of the blood, and PWV (cm/s) is measured by the transient time from the aortic orifice to the ankle. However, the main issue associated with CAVI is that it is calculated from PWV, including the measurement segment of the lower limb (from femoral to posterior tibial arteries), which has no predictive value.3 In clinical practice, CAVI has widely been used as a surrogate arteriosclerosis maker,10 and this equation includes the coefficients “a” and “b” to adjust it to the value of Hasegawa’s PWV, which is compensated for 80 mmHg of diastolic pressure.11 Recently, Takahashi et al9 demonstrated that CAVI can interpret heart–ankle β (haBETA) in epidemiological and clinical studies; it can be considered that application of CAVI without the coefficients “a” and “b” is more reasonable in various arterial segments.
Therefore, the segmental stiffness parameter β was applied to compare the clinical and physiological implications in the present study using an additional thigh cuff. Although cfPWV can be measured using a thigh cuff,12,13 to the best of our knowledge, only one study has analyzed the segmental β as heart–thigh β (htBETA) and thigh–ankle β (taBETA) separately, which was mainly evaluated as an acute effect of nitroglycerin.14
The present study aimed to compare the clinical and physiological implications between the stiffness of elastic aortic arteries (htBETA) and medium-sized limb muscular arteries (taBETA) and to investigate the effects of htBETA and taBETA on haBETA as well as evaluate whether diagnostic power for coronary artery disease (CAD) differed between haBETA and htBETA.
Materials and Methods
Healthy Subject and Patient Selection
Community residents and employees of companies and governments who underwent a periodic health examination from April 2015 to March 2016 in Sano City, Tochigi Prefecture, Japan, were included in the study. Informed consent was obtained from all participants. The study design was approved by the ethics community of the Sano Medical Association Hospital, and data were collected from the database of this institution. The details of data collection and definition have previously been reported,15 and data regarding current medications, including antihypertensive, hypoglycemic, and hypolipidemic drugs, were collected via a questionnaire. The study protocol was approved by the ethics committee of Dokkyo Medical University according to the Declaration of Helsinki.
Patients were referred to Dokkyo Medical University Hospital from April 2015 to March 2016 to undergo their first coronary angiography. All patients who underwent coronary angiography presented with chest pain and exhibited at least 75% stenosis of the proximal left anterior descending or right coronary artery on coronary angiography. The therapeutic goals for patients with suspicious CAD for primary prevention were as follows: systolic and diastolic blood pressure of <130/85 mmHg, fasting blood glucose level of <129 mg/dL, glycated hemoglobin (HbA1c) level of <6.9%, serum low-density lipoprotein (LDL) cholesterol level of <100 mg/dL, high-density lipoprotein (HDL) cholesterol level of >40 mg/dL, and triglyceride level of <150 mg/dL. Written informed consent was obtained from all patients after the study protocol approval from the Institutional Review Board of Dokkyo Medical University. Participants with acute coronary syndrome, distinct aortic aneurysm, arteriosclerosis obliterans (ankle-brachial index, ≤0.90),16 and atrial fibrillation were excluded.
According to our previous data,17 the area under the curve (AUC) of CAVI, instead of segmental β, which has not been reported in single coronary vessel disease, was 0.648; the type I error rate was 0.05 in the one-side test, and the type II error rate was ≤0.15 (power ≥85% power). The number of healthy subjects was two times as that of patients with CAD, and with 5% attrition, it was determined that 81 healthy subjects and 41 patients with CAD were required to detect for equivalence or difference in diagnostic accuracy using the receiver operating characteristic (ROC) curve analysis.18 For exclusion owing to CAD complications, such as ischemic electrocardiographic change in healthy subjects, a larger sample size was used to ensure the necessary number of healthy subjects. Ultimately, 90 healthy subjects and 41 patients with CAD who agreed to participate were included in the study.
BETA Measurement
To measure the volume change of the femoral artery in the inguinal area, a prototype of the thigh cuff that can be used for volume plethysmography was produced in collaboration with Fukuda Denshi, as shown in Figure S1. The local volume change was accurately reflected when the cuff was wrapped around both thighs at a shorter distance of approximately 20 mm than the thigh circumference in the supine position.
The vascular length from the aortic valve to the thigh was calculated as the total distance from the second intercostal space of the parasternal position to the femoral artery in the inguinal area (Lpf) × 1.3, defined as AF,19 and the measured length from the femoral artery in the inguinal area to the middle of the thigh cuff (L1), ie, AF + L1. Moreover, the vascular length from the thigh to the ankle was measured from the middle of the thigh cuff to the middle of the ankle cuff (L2). Thereafter, the vascular length from the aortic valve to the ankle was calculated as follows: AF + L1 + L2.
Considering the difficulty in determining the transient time from the aortic valve to the brachial from the valve opening sound, the time is determined based on the time between the aortic valve closing sound (IIA) of the phonocardiogram and notch of the brachial pulse wave (dicrotic notch). Therefore, the traveling time of heart–thigh (Tht), thigh–ankle (Tta), and heart–ankle (Tha) was automatically calculated using the VS-1500 vascular screening system (Fukuda Denshi Co., Tokyo, Japan).
PWV was calculated by dividing the vascular length by the traveling time and was recorded in the comma-separated value format as follows:
htPWV = (AF + L1)/Tht
taPWV = L2/Tta
haPWV = (AF + L1 + L2)/Tha
Using the original CAVI formula8 and removing the coefficient values of a and b,9 segmental β was calculated as follows:14
Segmental β = ln (Ps/Pd) × 2ρ/ P × PWV2
where Ps and Pd are the systolic and diastolic blood pressures, respectively,  P = Ps − PD,
  is the blood density, and PWV is the value calculated for each segment.
Accordingly, the following were determined:
htBETA = ln (Ps/Pd) × 2ρ/ P × htPWV2
taBETA = ln (Ps/Pd) × 2ρ/ P × taPWV2
haBETA = ln (Ps/Pd) × 2ρ/ P × haPWV2
First, to clarify the characteristics of htBETA, taBETA, and haBETA, their correlation was evaluated, and their relationship with the clinical characteristics was examined in healthy subjects and patients with CAD who underwent arterial stiffness measurements using volume plethysmography 10 mins before coronary angiography in the catheter laboratory. Thereafter, we compared htBETA, taBETA, and haBETA between healthy subjects and patients with CAD to determine the superior index for discerning the presence of CAD.
Statistical Analysis
Results were presented as mean ± standard deviation for continuous data and as numbers and percentages for categorical data. Data were compared using Student’s t-test or analysis of variance for continuous variables and using chi-square test for categorical variables. Correlation coefficients were calculated for paired data. Furthermore, multiple regression analysis was performed, and principal component analysis was conducted.
ROC curves were used to visualize the sensitivity and specificity depending on the threshold. AUC and its standard error (SE) were obtained. The statistical comparison of the areas under two ROC curves was derived by the method described by Hanley and McNeil,20 who demonstrated that the difference in AUC of two ROC curves derived from the same set of patients can be determined to be random or real from the critical ratio Z, which is defined as follows:
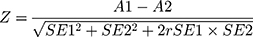
where A1 and SE1 are the observed area and estimated SE of AUC associated with test 1, respectively; A2 and SE2 refer to the corresponding quantities for test 2. In addition, r was derived from (A1 + A2)/2 and (rn + ra)/2, wherein rn and ra are correlation coefficients between measurement values of tests 1 and 2 in the control groups and those of tests 1 and 2 in the diseased groups, respectively. Then, the obtained Z value was above the cutoff value, it was referred to the table of the normal distribution, which was considered as evidence that the AUC was truly different.
A P-value of <0.05 was considered statistically significant. All calculations were performed using JMP version 10.0 (SAS Institute, Cary, NC, USA).
Results
Baseline Characteristics and Treatments
Overall, 90 healthy subjects and 41 patients with CAD were included in this study. The healthy subjects were 10 years younger than the patients with CAD [mean age, 54.0 (range, 23–84) and 64.1 (range 46–86) years, respectively]. Table 1 shows that patients with CAD were more frequently men and obese. Although antihypertensive and hypoglycemic drugs were more frequently used in patients with CAD than in healthy subjects, systolic and diastolic blood pressures and serum glucose and HbA1c levels remained high (Table 1). By contrast, serum total cholesterol and LDL cholesterol levels were lower and HDL cholesterol level was higher in patients with CAD who were more frequently treated with the hypolipidemic drugs compared with the healthy subjects (Table 1).
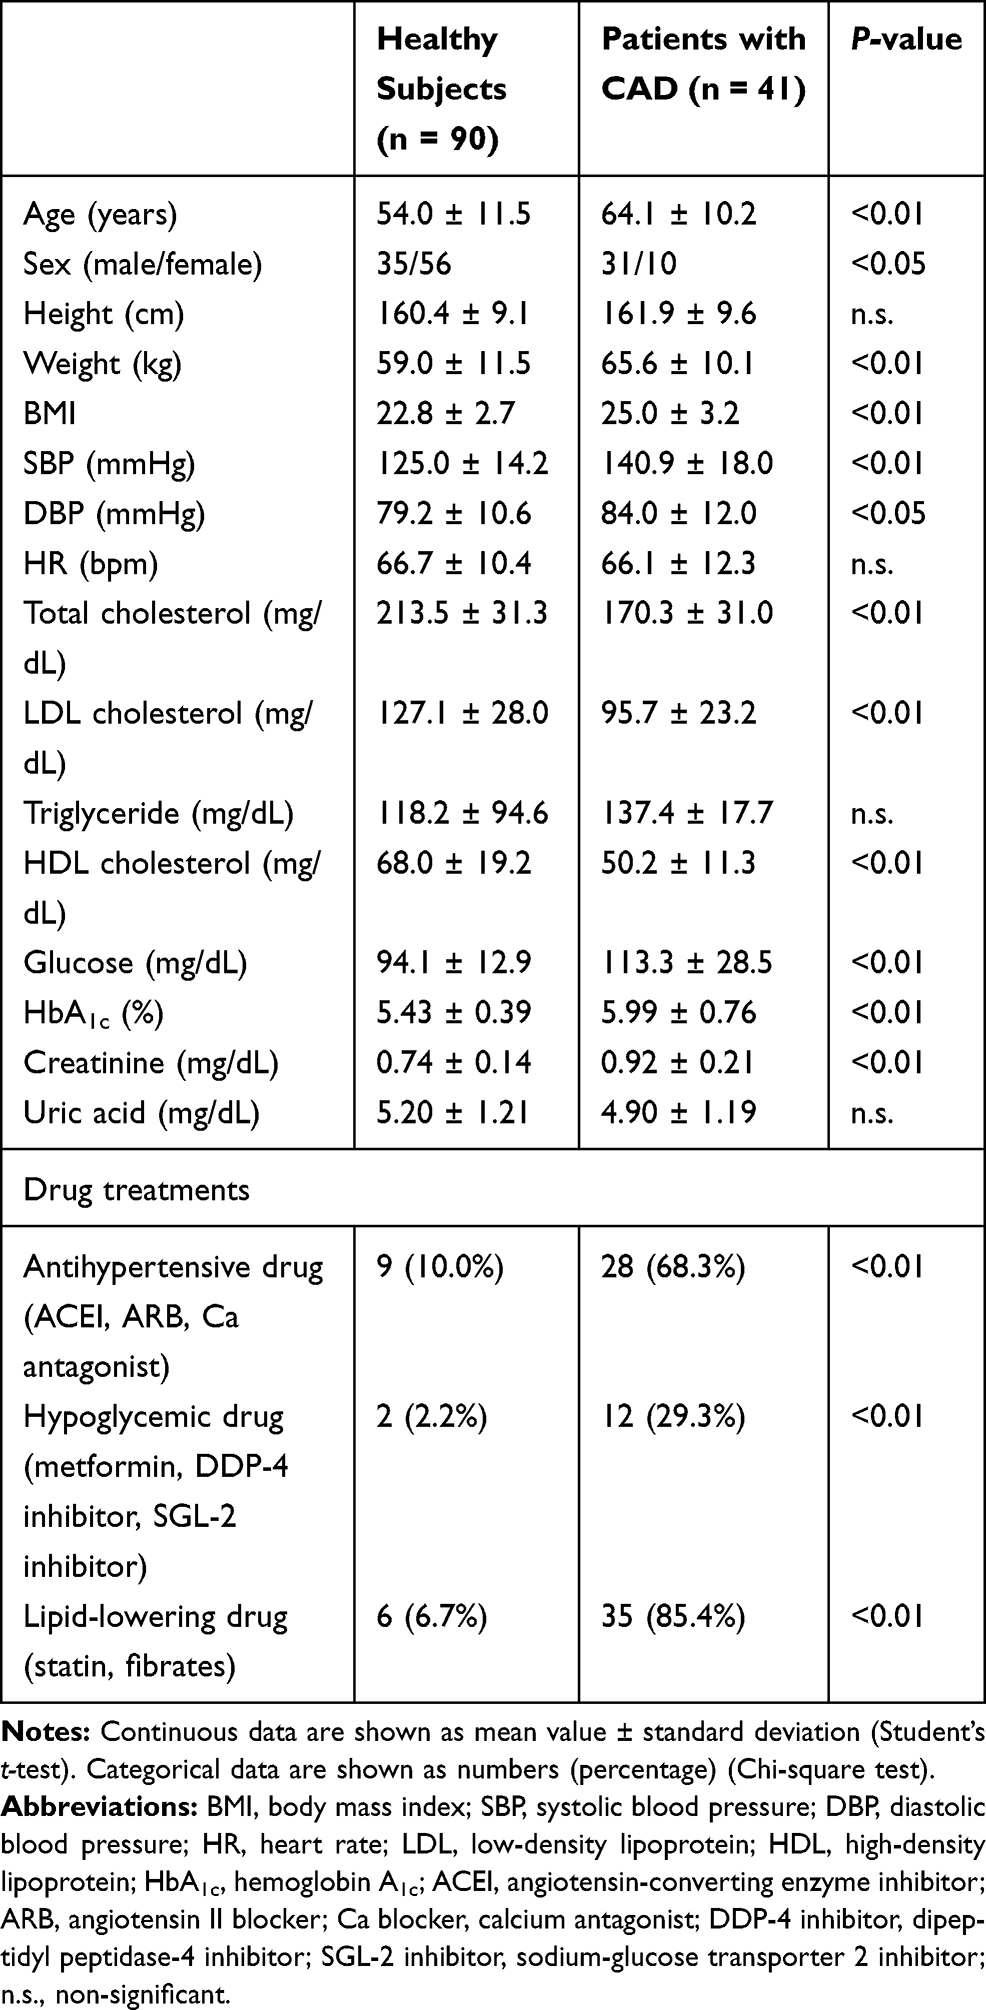 |
Table 1 Characteristics of the Study Population and Drug Treatments |
Relationship Among htBETA, taBETA, and haBETA in Healthy Subjects and Patients with CAD
HaBETA was correlated with htBETA (r = 0.78, p < 0.01) and taBETA (r = 0.46, p < 0.01) in healthy subjects (Figure 1). In patients with CAD, haBETA was correlated only with htBETA (r = 0.56, p < 0.01, Figure 2). Moreover, htBETA and taBETA were unrelated in healthy subjects and patients with CAD (Figures 1 and 2).
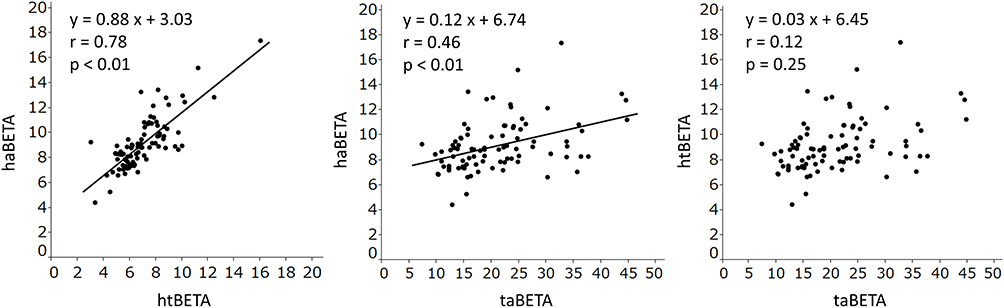 |
Figure 1 Correlation between each segmental β in healthy subjects. Abbreviations: haBETA, heart–ankle β; htBETA, heart–thigh β; taBETA, thigh–ankle β; r, correlation coefficient. |
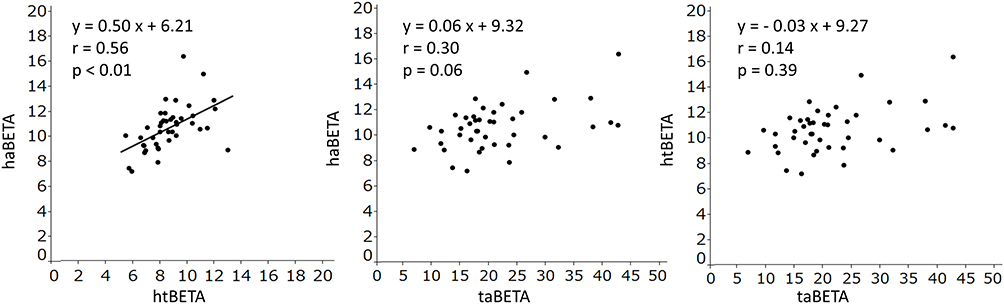 |
Figure 2 Correlation between each segmental β in patients with coronary artery disease. |
Multiple regression analysis revealed that haBETA can be estimated using htBETA and ta htBETA in healthy subjects (haBETA = 0.828 htBETA + 0.094 taBETA + 1.406, r = 0.86, p < 0.01, Figure 3) and patients with CAD (haBETA = 0.546 htBETA + 0.073 taBETA + 4.259, r = 0.67, p < 0.01, Figure 3). Moreover, principal component analysis indicated that the plots were horizontally distributed for healthy subjects, whereas the plots were equally distributed in horizontal and vertical directions for patients with CAD (Figure 4). The proportions of variance of htBETA and taBETA to haBETA were 65.4% (component 1, relationship between htBETA and haBETA) and 29.7% (component 2, relationship between taBETA and haBETA) in healthy subjects and 52.7% (component 1) and 37.2% (component 2) in patients with CAD (Figure 4).
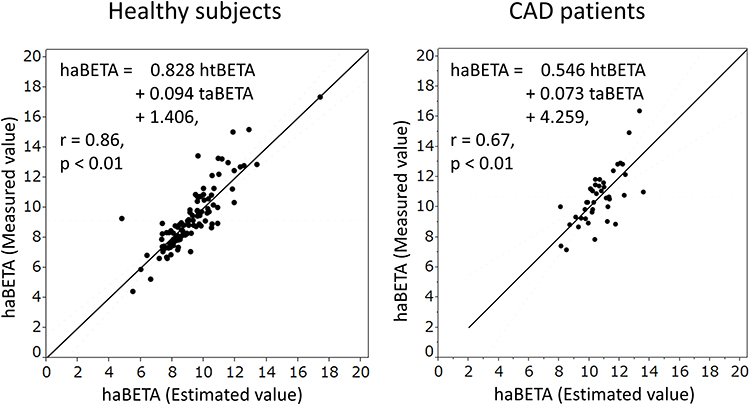 |
Figure 3 Multiple linear regression model for haBETA with htBETA and taBETA in healthy subjects and patients with coronary artery disease. Abbreviations: haBETA, heart–ankle β; htBETA, heart–thigh β; taBETA, thigh–ankle β. |
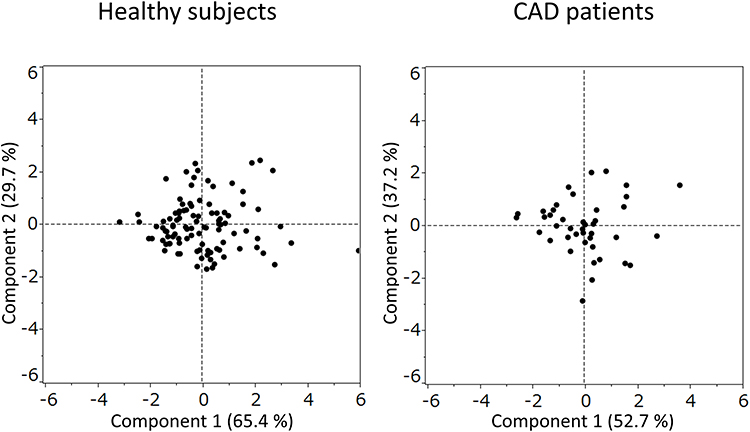 |
Figure 4 Principal component analysis in healthy subjects and patients with coronary artery disease. Component 1: horizontal (relationship between htBETA and haBETA). Component 2: vertical (relationship between taBETA and haBETA). Abbreviations: haBETA, heart–ankle β; htBETA, heart–thigh β; taBETA, thigh–ankle β. |
These data suggested that compared with patients with CAD, healthy subjects had a greater effect on the variance of htBETA to haBETA.
Relationship Between htBETA, taBETA, haBETA, and Clinical Characteristics in Healthy Subjects and Patients with CAD
Table 2 shows that the thigh circumference, height, and body weight were not related to all segmental βs. In healthy subjects and patients with CAD, age was correlated with haBETA (r = 0.626 and r = 0.387, respectively) and htBETA (r = 0.560 and r = 0.406, respectively) but not taBETA (p < 0.01). Systolic and diastolic blood pressures were significantly correlated with taBETA in healthy subjects (r = 0.338, p < 0.01, and r = 0.273, p < 0.05, respectively) and patients with CAD (r = 0.361, p < 0.05, and r = 0.395, p < 0.05, respectively). Moreover, in healthy subjects, systolic (r = 0.331, p < 0.01) and diastolic (r = 0.224, p < 0.05) blood pressures were correlated with haBETA and only the systolic blood pressure was correlated with htBETA (r = 0.297, p < 0.01). In patients with CAD, the body mass index was correlated with haBETA (r = 0.372, p < 0.05) and heart rate was correlated with htBETA (r = 0.366, p < 0.05).
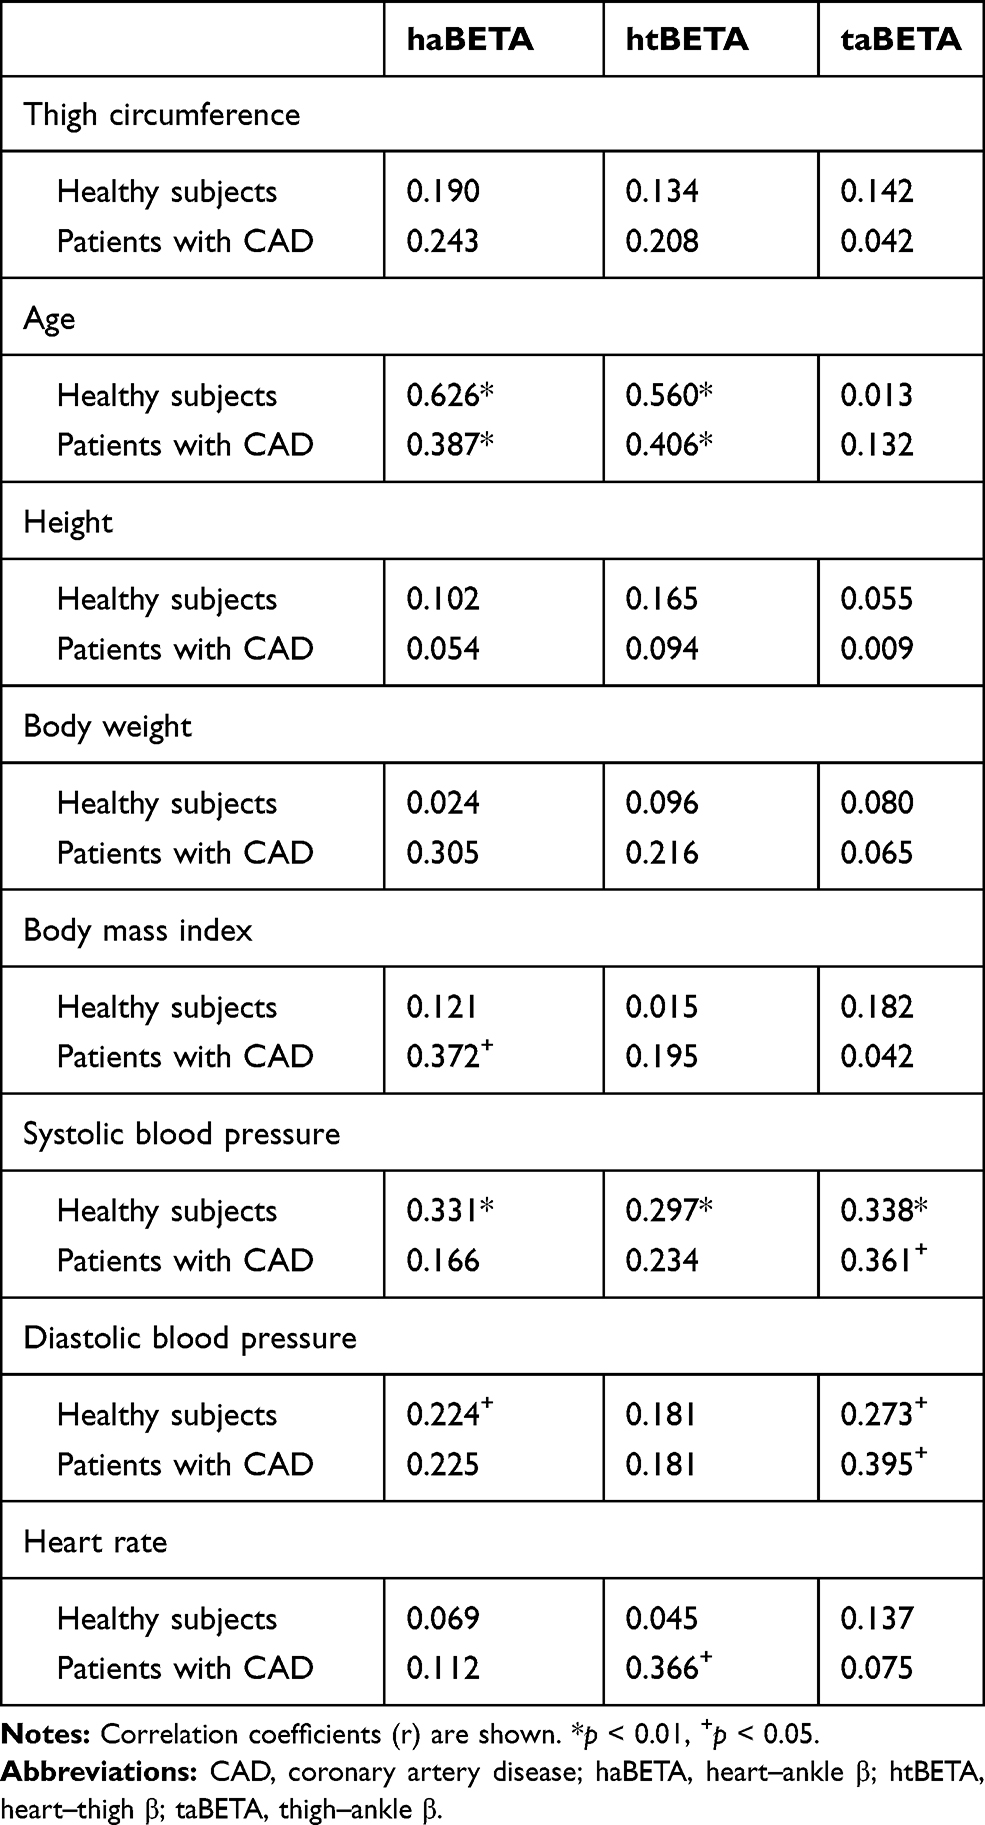 |
Table 2 Correlation Coefficient (r) Among htBETA, taBETA, haBETA, and Clinical Characteristics in Healthy Subjects and Patients with CAD |
In summary, haBETA and htBETA were significantly related to age, whereas taBETA was associated with systolic and diastolic blood pressures.
Comparison of htBETA, taBETA, and haBETA Between Healthy Subjects and Patients with CAD
As shown in Table 3, taBETA was three times higher than htBETA in healthy subjects and patients with CAD (p < 0.01). Moreover, haBETA and htBETA were significantly lower in healthy subjects compared with those in patients with CAD (p < 0.01). However, taBETA did not differ between the two groups.
ROC Curve of haBETA, htBETA, and taBETA in Diagnosis of CAD
The ROC curves of haBETA (black line), htBETA (dark grey line), and taBETA (grey line) in the diagnosis of CAD were computed (Figure 5), and the ROC curves of haBETA and htBETA were more upward and shifted to the left side compared with that of taBETA. The AUC ± SE value of haBETA (0.731 ± 0.046) and htBETA (0.757 ± 0.043) was significantly higher than that of taBETA (0.493 ± 0.054) (p < 0.01, respectively), although that of haBETA did not differ with that of htBETA (p = 0.49). Therefore, haBETA and htBETA were superior to taBETA in discerning the presence of CAD, because taBETA exhibited no discerning ability.
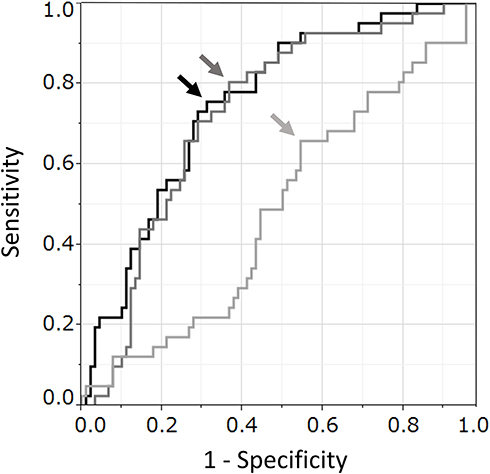 |
Figure 5 Reciever operating characteristic (ROC) curves of haBETA, htBETA, and taBETA in coronary artery disease (CAD). haBETA: cutoff value 9.20 (black arrow), sensitivity 80.5, specificity 63.3%. htBETA: cutoff value 7.72 (dark grey arrow), sensitivity 75.6, specificity 68.9%. taBETA: cutoff value 21.0 (grey arrow), sensitivity 65.6, specificity 45.6%. Each arrow indicates the optimal threshold (cutoff value) of haBETA, htBETA, and taBETA for the discernment of the presence of CAD, respectively. The area under the ROC curve (AUC ± SE) of haBETA, htBETA, and taBETA were 0.731 ± 0.046 (p < 0.01), 0.757 ± 0.043 (p < 0.01), and 0.493 ± 0.054 (p = 0.49), respectively. Abbreviations: SE, standard error; haBETA, heart–ankle β; htBETA, heart–thigh β; taBETA, thigh–ankle β. |
Diagnostic Power for CAD with a Threshold of haBETA, htBETA, and taBETA
To determine the optimal threshold for discerning the presence of CAD, the optimal intersection point between sensitivity and 1-specificity curves of haBETA, htBETA, and taBETA in CAD was computed. The optimal cutoff points were 9.20, 7.72, and 21.0 for haBETA, htBETA, and taBETA, respectively (Figure 5). Using the threshold of 9.20 in haBETA, 7.72 in htBETA, and 21.0 in taBETA, sensitivity of 80.5%, 75.6%, and 65.9% and specificity of 63.3%, 68.9%, and 45.6%, respectively, were obtained (arrows indicate each threshold in Figure 5). Therefore, sensitivity and specificity for discerning the presence of CAD were higher in haBETA and htBETA than in taBETA. However, haBETA and htBETA were not significant (p = 0.49).
Discussion
The present study demonstrated that segmental βs, such as htBETA and taBETA, were different. In the healthy subjects and patients with CAD, htBETA was age dependent but taBETA was not (Table 2). Moreover, taBETA was three times higher than htBETA in healthy subjects as well as patients with CAD, suggesting that the stiffness of the medium-sized extremity muscle artery from the thigh–ankle artery was significantly higher than that of the elastic artery in the aorta and that the muscle artery was independent of age. Nichols et al21 suggested that stiffness of elastic arteries increased with age, which has primarily been attributed to the degeneration of the medial layer of the arterial walls. By contrast, compared with the elastic arteries, the medium-sized muscular arteries are barely affected by age and less distensible.22,23 Moreover, the stiffness of medium-sized muscular arteries is modulated by the vasomotor tone depending on either the endothelial function, sympathetic nervous system,24,25 or renin–angiotensin system.26 Moreover, Wohlfahrt et al27 reported that the stiffness of the lower-extremity artery, which was determined using PWV from the femoral artery to dorsal pedal/posterior tibial arteries, was affected to a lesser extent by age and cardiovascular risk factors than aortic stiffness (cfPWV); further, increased ankle systolic blood pressure was associated with the stiffness of the lower-extremity artery in a random sample from the Czech population. Because PWV is dependent on blood pressure, these associations may be observed; our taBETA was less dependent on blood pressure. However, the measurement segment of taBETA is a functional medium-sized muscular artery, which is modulated by the vasomotor tone, particularly at young age. The association between blood pressure and stiffness of the lower-extremity artery, which was calculated by the stiffness parameter β theory, was observed in the present study, suggesting that blood pressure is one of the important factors associated with the stiffness of medium-sized muscular arteries.
Data regarding the aging of the lower-extremity arteries are discrepant: in some studies,23,28 no increase in stiffness with age was observed, whereas in other studies,29,30 stiffness was found to increase with age. This discrepancy may be explained by the minor effect of age on the stiffness of the lower-extremity arteries and by the different methods of arterial stiffness measurement.
The stiffness of the muscle artery (taBETA) did not differ between the healthy subjects and patients with CAD in the present study. By contrast, Yamamoto et al14 reported lower taBETA in their healthy group (14.10 ± 4.14) than that in our healthy subjects (21.27 ± 6.68), and it was higher in their patients with atherosclerosis (25.45 ± 22.31) than in our patients with CAD (21.14 ± 8.36). These discrepancies may be explained by the age and sex differences between both studies, considering that the age of the healthy subjects and patients were 30.9 vs 54.0 and 72.0 vs 64.1 years and the proportion of men were 100% vs 39% and 84% vs 76% (Yamamoto et al’s data vs our data), respectively. Therefore, although taBETA may be lower in younger healthy subjects aged approximately 30 years, the changes in the stiffness of the muscular artery (taBETA) appear to be extremely small in elderly individuals aged >50 years who are predominantly at risk of atherosclerosis.
Furthermore, haBETA was more strongly correlated with htBETA (r = 0.78) than with taBETA (r =0.46) in healthy subjects (Figure 1), and the multiple regression analysis revealed that haBETA can be almost precisely estimated using htBETA and taBETA (Figure 3). However, these relationships were weakened in patients with CAD (Figure 3). Furthermore, the proportion of the variance of htBETA to haBETA was greater and that of taBETA to haBETA was smaller in healthy subjects compared with the proportions in patients with CAD (Figure 4). Therefore, the nonuniformity of the arterial system between elastic and medium-sized muscular arteries would disappear in patients with CAD, which is typically observed in healthy young subjects.
Previously, we have demonstrated that CAVI, which includes the coefficients “a” and “b” on the haBETA formula, was significantly correlated with the regional stiffness parameter β of the ascending and descending aorta calculated from electrocardiogram-gated multidetector row computed tomography and that the ratio of the thoracic aorta pulse-wave propagation time (heart–thigh) to the entire pulse-wave propagation time from the heart to the ankle was large, which may substantially impact the entire PWV (heart–ankle).31 In addition, Wohlfahrt et al32 reported that cfPWV was positively correlated with carotid–ankle PWV, and the addition of thigh–ankle PWV to cfPWV decreased the association with age, which can only be explained by the minor effect of this factor on the arterial stiffness of medium-sized extremity muscular artery. Accordingly, these studies suggested that CAVI (haBETA) shows the highest dependence on the stiffness of the central artery, such as thoracic aortas, and age is a major confounder of this stiffness.
Recently, Fico et al33 determined cfPWV using an automatic vascular screening device (VP-1000 Plus, Omron Healthcare, Kyoto, Japan), and the heart–thigh PWV (htPWV) was determined with the same device in our study of 50 healthy subjects (18–79 years old). The mean values of cfPWV (713 ± 145 cm/s) and htPWV (699 ± 150) did not differ (p = 0.43), and these correlations were high (r = 0.64, p < 0.001). The regression line was derived from the line of identity in the Bland–Altman plot. Further, these results suggested that htBETA has good potential for assessing arterial stiffness in the clinical setting in comparison to cfPWV.
The comparison of the segmental βs shows that htBETA, but not taBETA, was significantly higher in patients with CAD than in healthy subjects (Table 3). However, the ROC curve analysis showed that htBETA did not improve the diagnostic power for CAD compared with haBETA, which comprises htBETA and taBETA. These data may be extremely important because the lengthening of the measurement site from the heart–thigh distance (elastic artery) to the heart–ankle distance (elastic artery plus medium-sized muscular artery) does not decrease the diagnostic power for middle-aged patients with CAD.
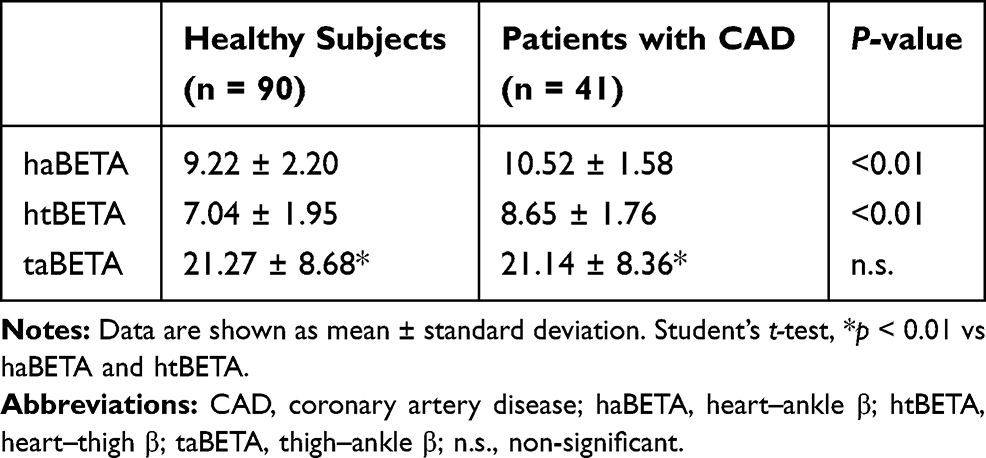 |
Table 3 htBETA, taBETA, and haBETA in the Healthy Subjects and Patients with CAD |
Study Limitations
Several healthy subjects were using antihypertensive (10%), hypoglycemic (2.2%), and hypolipidemic (6.7%) drugs, and patients with CAD were using some medications, which may have influenced our results.
Moreover, although coronary arteriography or computed tomography of the coronary artery was not performed, the ischemic change in the electrocardiogram at rest for all healthy subjects was not observed. For comparing each β between healthy subjects and patients with CAD, both study populations were heterogeneous. However, the characteristics of healthy subjects appear to represent the status of the subjects undergoing general medical examinations in Japan.
Conclusion
The stiffness of the medium-sized thigh–ankle artery was three times greater than the elastic heart–thigh artery. Its stiffness was constant and that of the elastic aorta correlated with age. It was possible to estimate two-thirds of the components of the stiffness of the heart–ankle artery using the stiffness of the heart–thigh artery. The ROC curve analysis revealed that the stiffness of the heart–ankle artery could be replaced by that of the heart–thigh artery, prolonging the measurement segment without affecting the diagnostic power for CAD.
Disclosure
Toshihiko Ishimitsu reports grants from Daiichi Sankyo, Torii Pharmaceutical, and personal fees from Takeda Pharmaceutical, outside the submitted work. Other authors report no potential conflicts of interest for this work.
References
1. Shokawa T, Imazu M, Yamamoto H, et al. Pulse wave velocity predicts cardiovascular mortality: findings from the Hawaii-Los Angeles-Hiroshima study. Circ J. 2005;69(3):259–264. doi:10.1253/circj.69.259
2. Willum-Hansen T, Staessen JA, Torp-Pedersen C, et al. Prognostic value of aortic pulse wave velocity as index of arterial stiffness in the general population. Circulation. 2006;113(5):664–670. doi:10.1161/CIRCULATIONAHA.105.579342
3. Pannier B, Guérin AP, Marchais SJ, Safar ME, London GM. Stiffness of capacitive and conduit arteries: prognostic significance for end-stage renal disease patients. Hypertension. 2005;45(4):592–596. doi:10.1161/01.HYP.0000159190.71253.c3
4. Laurent S, Cockcroft J, Van Bortel L, et al. European network for non-invasive investigation of large arteries. Expert consensus document on arterial stiffness: methodological issues and clinical applications. Eur Heart J. 2006;27(21):2588–2605. doi:10.1093/eurheartj/ehl254
5. Bramwell JC, Hill AV. Velocity of transmission of the pulse and elasticity of arteries. Lancet. 1922;1(5149):891. doi:10.1016/S0140-6736(00)95580-6
6. Spronck B, Heusinkveld MH, Vanmolkot FH, et al. Pressure-dependence of arterial stiffness: potential clinical implications. J Hypertens. 2015;33(2):330–338. doi:10.1097/HJH.0000000000000407
7. Hayashi K, Handa H, Nagasawa S, Okumura A, Moritake K. Stiffness and elastic behavior of human intracranial and extracranial arteries. J Biomech. 1980;13(2):175–184. doi:10.1016/0021-9290(80)90191-8
8. Shirai K, Utino J, Otsuka K, Takata M. A novel blood pressure-independent arterial wall stiffness parameter; cardio-ankle vascular index (CAVI). J Atheroscler Thromb. 2006;13(2):101–107. doi:10.5551/jat.13.101
9. Takahashi K, Yamamoto T, Tsuda S, et al. Coefficients in the CAVI equation and the comparison between CAVI with and without the coefficients using clinical data. J Atheroscler Thromb. 2019;26(5):465–475. doi:10.5551/jat.44834
10. Hayashi K, Yamamoto T, Takahara A, Shirai K. Clinical assessment of arterial stiffness with cardio-ankle vascular index: theory and applications. J Hypertens. 2015;33(9):1742–1757. doi:10.1097/HJH.0000000000000651
11. Hasegawa M, Arai C. Clinical estimation of vascular elastic function and practical application. Connect Tissue. 1995;27(2):149–157.
12. Hickson SS, Butlin M, Broad J, Avolio AP, Wilkinson IB, McEniery CM. Validity and repeatability of the Vicorder apparatus: a comparison with the SphygmoCor device. Hypertens Res. 2009;32(12):1079–1085. doi:10.1038/hr.2009.154
13. Butlin M, Qasem A, Battista F, et al. Carotid-femoral pulse wave velocity assessment using novel cuff-based techniques: comparison with tonometric measurement. J Hypertens. 2013;31(11):2237–2243. doi:10.1097/HJH.0b013e328363c789
14. Yamamoto T, Shimizu K, Takahashi M, Tatsuno I, Shirai K. The effect of nitroglycerin on arterial stiffness of the aorta and the femoral-tibial arteries. J Atheroscler Thromb. 2017;24(10):1048–1057. doi:10.5551/jat.38646
15. Yonezawa Y, Horinaka S, Shirakawa C, Kogure Y. Estimated glomerular filtration ratio is a better index than creatinine clearance (Cockcroft-Gault) for predicting the prevalence of atrial fibrillation in the general Japanese population. Hypertens Res. 2018;41(6):451–459. doi:10.1038/s41440-018-0032-6
16. Gerhard-Herman MD, Gornik HL, Barrett C, et al. 2016 AHA/ACC guideline on the management of patients with lower extremity peripheral artery disease: a report of the American college of cardiology/American heart association task force on clinical practice guidelines. Circulation. 2017;135(12):e726–e779.
17. Horinaka S, Yabe A, Yagi H, et al. Comparison of atherosclerotic indicators between cardio ankle vascular index and brachial ankle pulse wave velocity. Angiology. 2009;60(4):468–476. doi:10.1177/0003319708325443
18. Obuchowski NA, Lieber ML, Wians FH
19. Nye ER. The effect of blood pressure alteration on the pulse wave velocity. Br Heart J. 1964;26(2):261–265.
20. Hanley JA, McNeil BJ. The meaning and use of the area under a receiver operating characteristic (ROC) curve. Radiology. 1982;143(1):29–36. doi:10.1148/radiology.143.1.7063747
21. Nichols WW, Valchopoulos C, O’Rourke MF. McDonald’s Blood Flow in Arteries: Theoretical, Experimental and Clinical Principles.
22. van der Heijden-spek JJ, Staessen JA, Fagard RH, Hoeks AP, Boudier HA, van Bortel LM. Effect of age on brachial artery wall properties differs from the aorta and is gender dependent: a population study. Hypertension. 2000;35(2):637–642. doi:10.1161/01.HYP.35.2.637
23. Boutouyrie P, Laurent S, Benetos A, Girerd XJ, Hoeks AP, Safar ME. Opposing effects of ageing on distal and proximal large arteries in hypertensives. J Hypertens. 1992;10(6):S87–S91. doi:10.1097/00004872-199208001-00023
24. Boutouyrie P, Lacolley P, Girerd X, Beck L, Safar M, Laurent S. Sympathetic activation decreases medium-sized arterial compliance in humans. Am J Physiol. 1994;267(4 Pt 2):H1368–H1376.
25. Giannattasio C, Failla M, Lucchina S, et al. Arterial stiffening influence of sympathetic nerve activity: evidence from hand transplantation in humans. Hypertension. 2005;45(4):608–611. doi:10.1161/01.HYP.0000157368.09939.88
26. Giannattasio C, Failla M, Stella ML, et al. Angiotensin-converting enzyme inhibition and radial artery compliance in patients with congestive heart failure. Hypertension. 1995;26(3):491–496. doi:10.1161/01.HYP.26.3.491
27. Wohlfahrt P, Krajčoviechová A, Seidlerová J, et al. Lower-extremity arterial stiffness vs aortic stiffness in the general population. Hypertens Res. 2013;36(8):718–724. doi:10.1038/hr.2013.21
28. Benetos A, Laurent S, Hoeks AP, Boutouyrie PH, Safar ME. Arterial alterations with aging and high blood pressure. A noninvasive study of carotid and femoral arteries. Arterioscler Thromb. 1993;13(1):90–97. doi:10.1161/01.ATV.13.1.90
29. Lo CS, Relf IR, Myers KA, Wahlqvist ML. Doppler ultrasound recognition of preclinical changes in arterial wall in diabetic subjects: compliance and pulse-wave damping. Diabetes Care. 1986;9(1):27–31. doi:10.2337/diacare.9.1.27
30. Blacher J, Demuth K, Guerin AP, Safar ME, Moatti N, London GM. Influence of biochemical alterations on arterial stiffness in patients with end-stage renal disease. Arterioscler Thromb Vasc Biol. 1998;18(4):535–541. doi:10.1161/01.ATV.18.4.535
31. Horinaka S, Yagi H, Ishimura K, et al. Cardio-ankle vascular index (CAVI) correlates with aortic stiffness in the thoracic aorta using ECG-gated multi-detector row computed tomography. Atherosclerosis. 2014;235(1):239–245. doi:10.1016/j.atherosclerosis.2014.04.034
32. Wohlfahrt P, Krajčoviechová A, Seidlerová J, et al. Arterial stiffness parameters: how do they differ? Atherosclerosis. 2013;231(2):359–364. doi:10.1016/j.atherosclerosis.2013.10.006
33. Fico BG, Gourley DD, Wooten SV, Tanaka H. Heart-thigh cuff pulse wave velocity: a novel nontechnical measure of arterial stiffness. Am J Hypertens. 2019;32(11):1051–1053. doi:10.1093/ajh/hpz124
 © 2020 The Author(s). This work is published and licensed by Dove Medical Press Limited. The full terms of this license are available at https://www.dovepress.com/terms.php and incorporate the Creative Commons Attribution - Non Commercial (unported, v3.0) License.
By accessing the work you hereby accept the Terms. Non-commercial uses of the work are permitted without any further permission from Dove Medical Press Limited, provided the work is properly attributed. For permission for commercial use of this work, please see paragraphs 4.2 and 5 of our Terms.
© 2020 The Author(s). This work is published and licensed by Dove Medical Press Limited. The full terms of this license are available at https://www.dovepress.com/terms.php and incorporate the Creative Commons Attribution - Non Commercial (unported, v3.0) License.
By accessing the work you hereby accept the Terms. Non-commercial uses of the work are permitted without any further permission from Dove Medical Press Limited, provided the work is properly attributed. For permission for commercial use of this work, please see paragraphs 4.2 and 5 of our Terms.