")
Back to Journals » Clinical Epidemiology » Volume 10
Comparative performance of a modified landmark approach when no time of treatment data are available within oncological databases: exemplary cohort study among resected pancreatic cancer patients
Authors Weberpals J , Jansen L , Silversmit G, Verbeeck J, van der Geest LG , Vissers PAJ, Zadnik V , Brenner H
Received 28 December 2017
Accepted for publication 2 May 2018
Published 30 August 2018 Volume 2018:10 Pages 1109—1125
DOI https://doi.org/10.2147/CLEP.S160973
Checked for plagiarism Yes
Review by Single anonymous peer review
Peer reviewer comments 5
Editor who approved publication: Professor Vera Ehrenstein
Janick Weberpals,1 Lina Jansen,1 Geert Silversmit,2 Julie Verbeeck,2 Lydia van der Geest,3 Pauline AJ Vissers,3 Vesna Zadnik,4 Hermann Brenner1,5,6
1Division of Clinical Epidemiology and Aging Research, German Cancer Research Center (DKFZ), Heidelberg, Germany; 2Belgian Cancer Registry (BCR), Brussels, Belgium; 3Netherlands Comprehensive Cancer Organization (IKNL), Utrecht, The Netherlands; 4Epidemiology and Cancer Registry, Institute of Oncology Ljubljana, Ljubljana, Slovenia; 5Division of Preventive Oncology, National Center for Tumor Diseases (NCT) and German Cancer Research Center (DKFZ), Heidelberg, Germany; 6German Cancer Consortium (DKTK), German Cancer Research Center (DKFZ), Heidelberg, Germany
Purpose: The Mantel–Byar method is the gold standard analytical approach to avoid immortal time bias, but requires information on the time between start of follow-up and exposure initiation. Alternatively, a modified landmark approach might be used to mitigate the amount of immortal time bias, which assumes exposure initiation at a predefined landmark time. In the context of an expected positive association between adjuvant chemotherapy (ACT) and overall survival among resected pancreatic cancer (PCa) patients, this study aims to empirically assess the performance of this approach relative to the Mantel–Byar method.
Patients and methods: Data from resected PCa patients diagnosed between 2003 and 2014 and registered in the national cancer registries of Belgium, the Netherlands, and Slovenia were used to estimate the association between ACT and overall survival using a Cox proportional hazards model by country and overall. Results derived from the immortal time bias (misclassifying the time to ACT initiation), Mantel–Byar method, and conventional and modified landmark analyses with assumed cutoff times of ACT initiation at 9, 12 and 15 weeks post-diagnosis were compared.
Results: In total, 5,668 patients with a total of 10,921 person-years of follow-up were eligible. All analytical approaches showed a significant survival benefit for resected PCa patients who received ACT, but immortal time bias analyses led to strong overestimation of ACT benefits compared to the Mantel–Byar method (immortal time bias: overall HR [95% CI] 0.68 [0.62–0.75] vs Mantel–Byar method: 0.82 [0.71–0.93]), whereas the conventional landmark approach generally provided rather conservative estimates (0.86 [0.75–1.00], 15 weeks landmark). HRs derived from modified landmark analyses depended on the cutoff time, but were similar compared to the Mantel–Byar method at 15 weeks (0.81 [0.70–0.94]).
Conclusion: A modified landmark approach might be a valid alternative to the Mantel–Byar method if no time of treatment information is available. The performance depends on the chosen cutoff time.
Keywords: immortal time bias, landmark analysis, pancreatic cancer, chemotherapy, population-based
Introduction
Associations between treatment interventions and outcomes such as mortality or recurrence are of major interest in observational cancer research. Therefore, studies are often conceptualized and analyzed as emulated target trials, which holds the potential of serious biases when the start of follow-up (time zero) and the time of treatment initiation are not aligned.1 This often leads to immortal time bias – a time-dependent bias still frequently seen in medical literature.2 In brief, immortal time bias refers to a cohort study design scenario where the exposure of a cohort starts after the start of follow-up, so that patients who received treatment are “immortal” up to that time, which results in a biased mortality rate ratio between the exposed and unexposed in favor of the exposure. The bias is introduced when the unexposed person-time between start of follow-up and exposure initiation is not modeled as such.3,4
However, immortal time bias can be avoided if appropriate statistical models are used. Recent studies confirmed that the Mantel–Byar method – a time-dependent approach to model each patient’s person-time under exposure – is the gold standard when analyzing time-varying interventions.5–7 However, depending on the available data source, the time of treatment information is often not registered, which precludes a time-dependent approach. In this case, a landmark analysis may be considered as an alternative analytical strategy.
The conventional landmark approach, introduced by Anderson et al,8 stratifies patients into two cohorts according to whether they have initiated the treatment before a predefined landmark time and follows them from this cutoff time whereas patients who died before are excluded. However, this still requires the temporal information about the exposure status of each patient at the landmark time. An alternative approach –referred to, in the following, as a modified landmark approach – might still give the opportunity to assess treatment associations without requiring any time of treatment data. Using this approach, clinical criteria (e.g., guidelines) can be exploited to make assumptions on possible landmark cutoff times and the patient’s probability to have initiated the treatment at this time.
As only little is known about the validity of the derived results relative to the Mantel–Byar method as the gold standard, this study aims to assess and illustrate the comparative performance of a modified landmark approach using an exemplary population-based study with the Mantel–Byar approach as gold standard to which all other analytical approaches will be compared to. Therefore, the different analytical approaches are applied within a population-based setting to assess the well-known positive clinical benefit of adjuvant chemotherapy (ACT) for resected pancreatic cancer (PCa) patients, for which randomized controlled trials (RCTs) have found a significant reduction in mortality.9
Patients and methods
Data sources
For this methodological study, data from three different European population-based cancer registries (Belgium, the Netherlands, and Slovenia) were used.
The registries provided data for the years of diagnosis between 2003 and 2014 with end of follow-up between February 2015 and May 2016. According to a predefined protocol, all registries collected information on treatment, date of diagnosis, start date of ACT, and further possible confounder variables and prognostic factors including age at diagnosis, sex, calendar year, tumor location, morphology, staging, previous other tumors, and harvested lymph nodes. All of the important variables were categorized and harmonized for statistical analysis, and a detailed overview of these variables is provided in Table S1.
Ethical approval for the analysis of the study data was granted by the Medical Faculty of the University of Heidelberg (code S-319/2015).
Study population
Eligible patients were included in the study if they had a diagnosis of PCa (ICD-10 code C25.x) throughout any of the available calendar years and underwent surgery. The date of diagnosis was defined as either the date of pathological or clinical diagnosis (whichever was available). Patients with diagnosis of a neuroendocrine tumor (C25.4) or who survived less than a week after the diagnosis were excluded. Patients with missing or implausible values on important variables were excluded (8.9%; details are shown in Table S1).
Clinical research question and study design
Major RCTs have shown that the only potentially curative treatment approach in PCa is the employment of surgical tumor resection followed by ACT with either 5-fluorouracil (5-FU) or gemcitabine.9–15 To emulate these trials, a retrospective cohort design was used within all analytical approaches, with ACT as the exposure variable of interest. Because the ESPAC-3 v2 trial showed that with regard to the efficacy of ACT there is no sufficient difference between 5-FU and gemcitabine, exposure was not restricted to any specific antineoplastic compound.16 The outcome was defined as time to death due to any reason.
Analytical approaches
The different analytical approaches to model exposure are described in detail in the following sections and are graphically summarized in Figure 1.
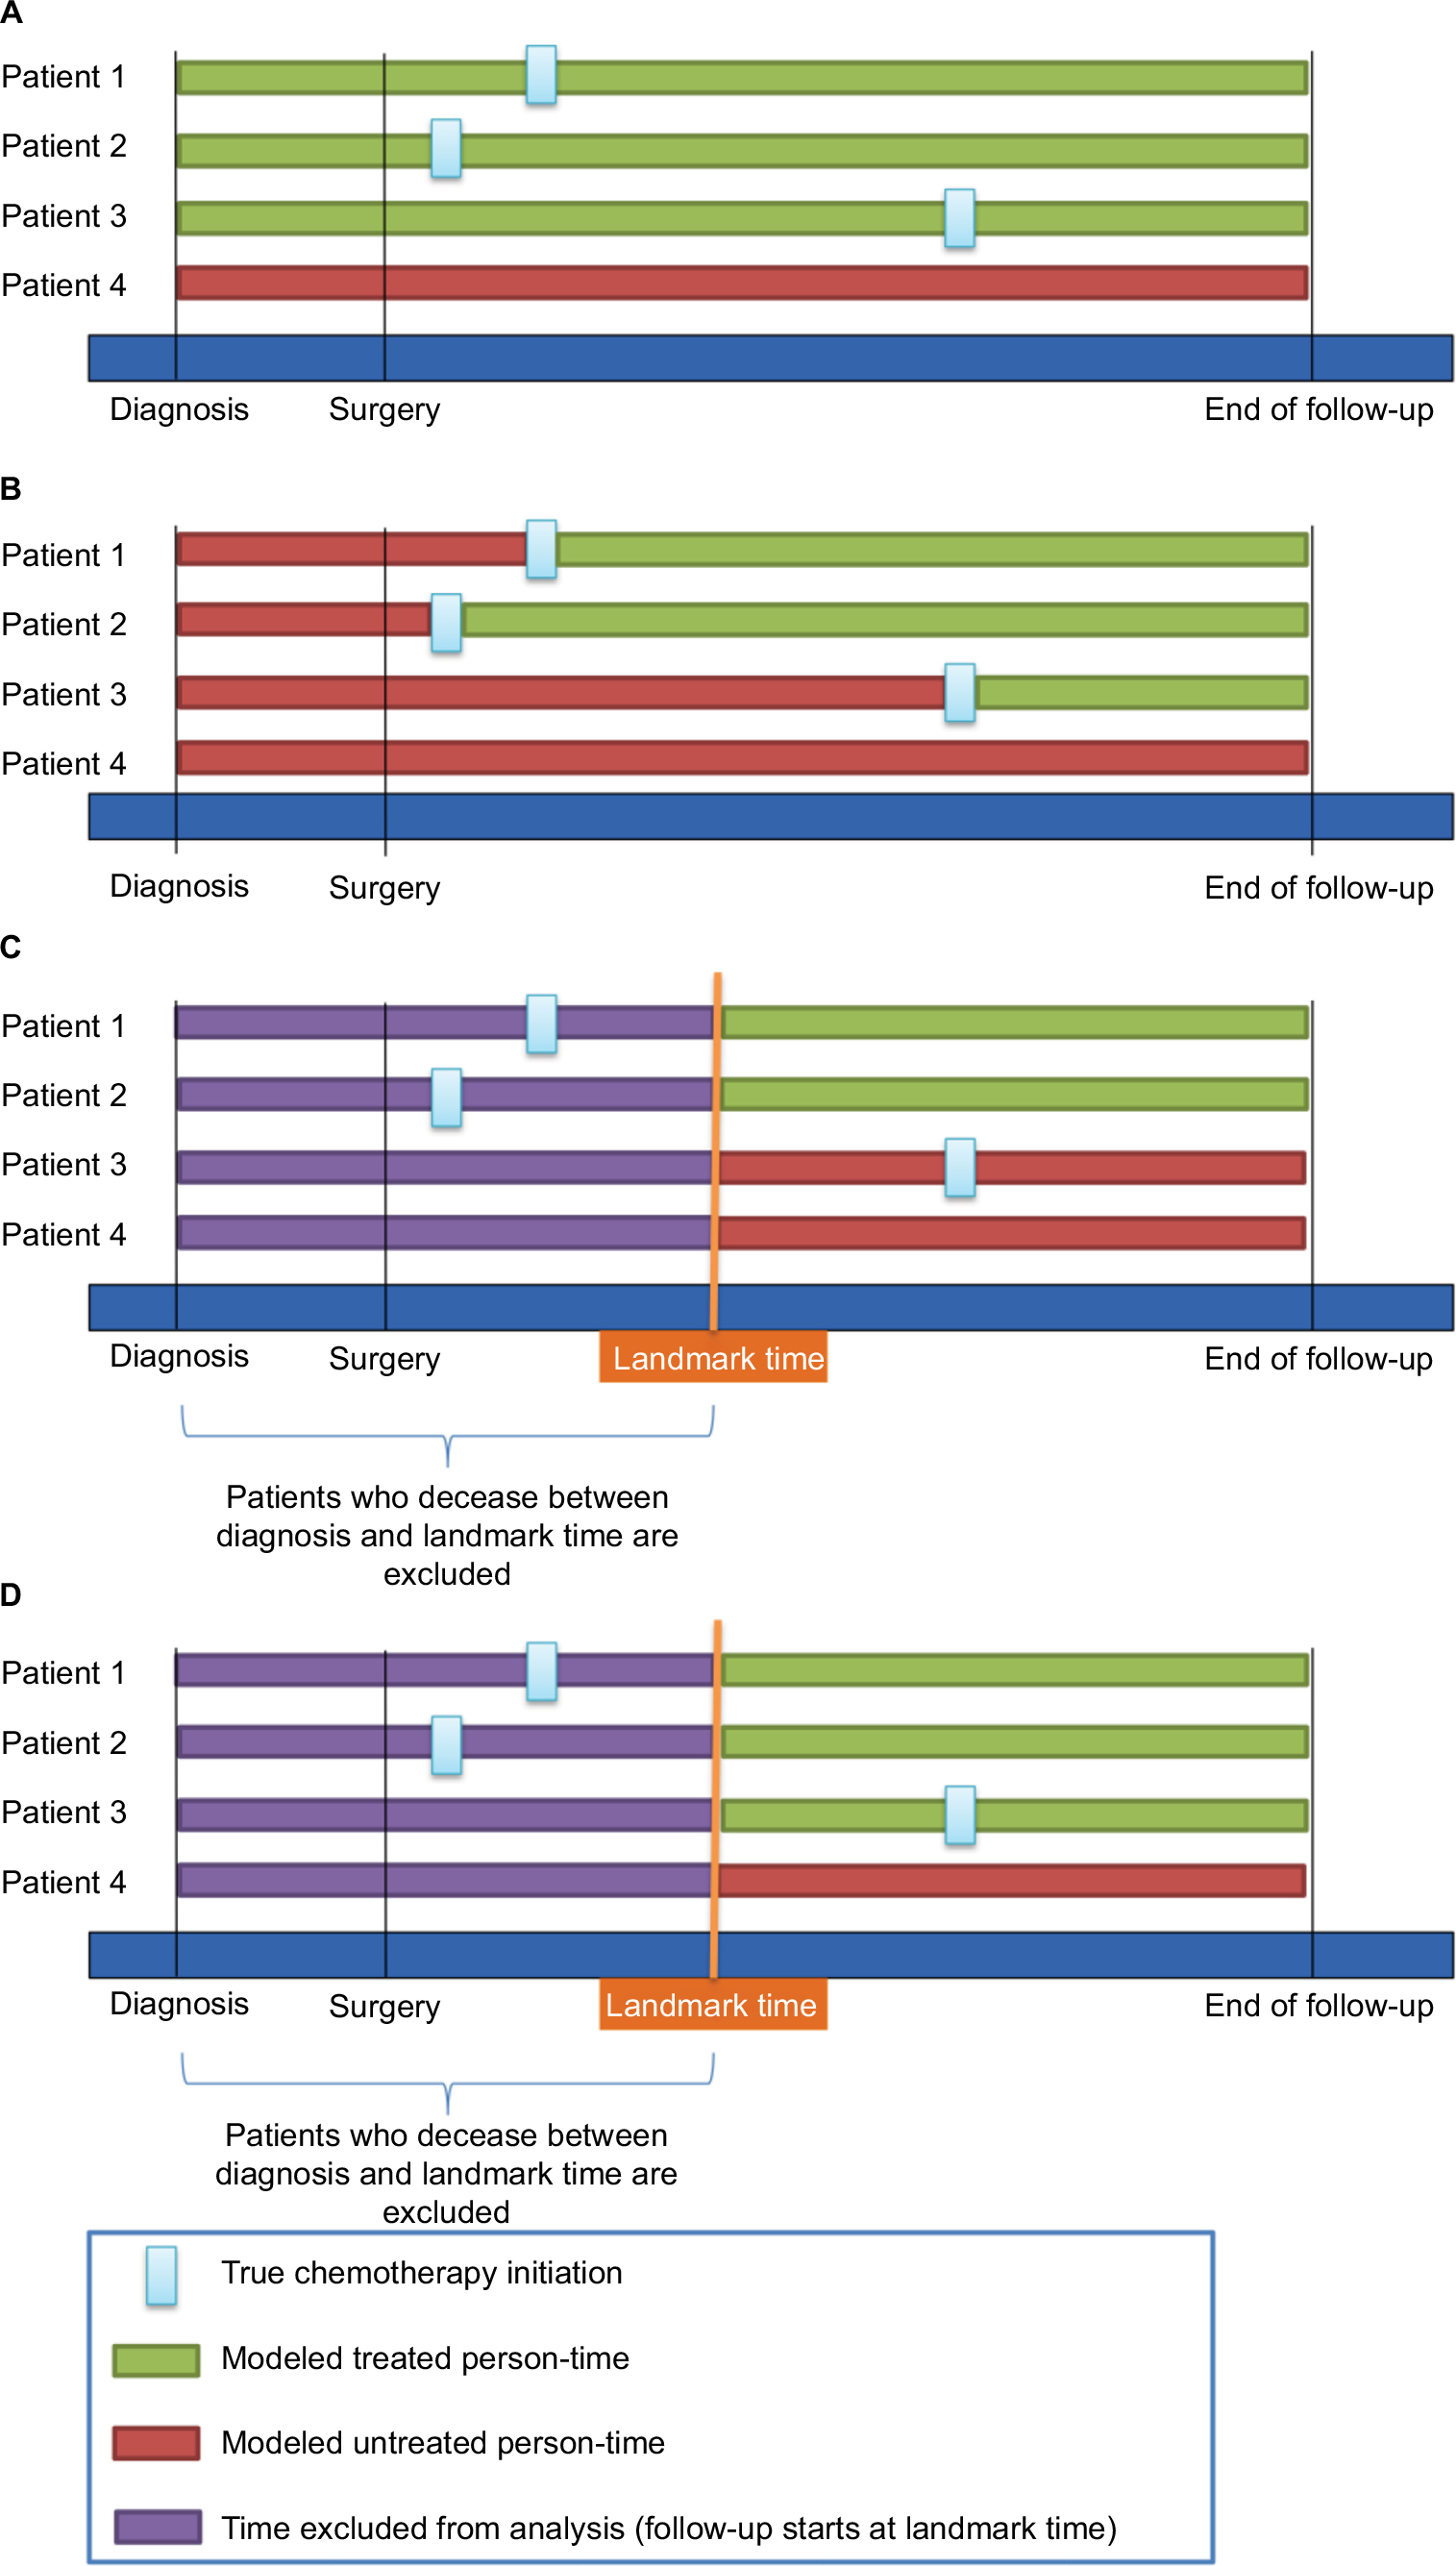 | Figure 1 Illustration of study design choices including the immortal time-biased model (A), the Mantel–Byar model (B), the conventional landmark model (C), and the modified landmark model (D). |
Analysis model 1: immortal time-biased approach
In order to assess the magnitude of how much an immortal time bias might have affected the results of the above-described study by neither considering a time-dependent nor a landmark analysis, naive estimates were calculated using a time-fixed approach by defining the chemotherapy exposure as a dichotomous variable (chemotherapy vs no chemotherapy; Figure 1A). This artificially leads to a misclassification of the exposed person-time of those patients who received chemotherapy as they are considered “ever exposed” (Figure 1A continuous green line patients 1–3), whereas those who did not receive chemotherapy are considered “never exposed” (Figure 1A, continuous red line Patient 4). This leads to a biased rate ratio in favor of the chemotherapy, as those patients who received chemotherapy must have survived the time between surgery and chemotherapy initiation whereas those who did not might have died immediately after surgery.
Analysis model 2: Mantel–Byar approach
Using a time-dependent approach according to Mantel–Byar,5 every patient contributed unexposed and exposed person-time according to the patient’s exact exposure status at every time point during follow-up. Therefore, the whole follow-up time for every patient was divided into 1-week intervals, indicating the patient’s exposure status (chemotherapy vs no chemotherapy) in each of these intervals. This means that a patient who received chemotherapy, after a certain time after surgery, first contributed unexposed person-time from the start of follow-up until the interval when ACT was initiated, and was then modeled as exposed thereafter until the end of follow-up (Figure 1B).
Analysis models 3 and 4: conventional and modified landmark approaches with cutoff at 9, 12, and 15 weeks
If time of treatment information is available, conventional landmark analyses might be conducted alternatively to the Mantel–Byar approach, although precision might be lost and the derived results might be more prone to be biased toward the null due to exposure misclassification of patients who started the exposure after the landmark time but are falsely modeled as unexposed throughout the follow-up. In this study, analyses using a conventional landmark approach were undertaken by assigning each patient’s exposure status conditional on whether the patient had received the exposure before the respective landmark time (Figure 1C).8 The landmark cutoff time was then set as the new start of follow-up and patients who died before were excluded.
However, as time of treatment initiation is often not recorded within cancer registries, a modified landmark analysis was carried out defining landmark cutoff times at which it can be assumed that the majority of patients have initiated ACT. Thus, patients were modeled as exposed or unexposed starting from this landmark time based on the information as to whether they actually ever received ACT (yes/no), whereas patients who died before were excluded from the analysis. Contrary to the conventional landmark approach, patients who had started ACT after the landmark time were still modeled as exposed (Figure 1D).
The landmark cutoff times for both conventional and modified landmark analysis were predefined at 9, 12, and 15 weeks. The 9-week cutoff was chosen based on published literature,17 and the 12 weeks based on the ESPAC-3 trial which assessed the optimal timing of ACT initiation.18,19 Finally, the landmark cutoff time at 15 weeks was also chosen based on the ESPAC-3 trial but with an additional grace period of 25% of the time, resulting in 3 additional weeks.
Statistical analysis
For descriptive analyses, the median time and interquartile range (IQR) and mean time and SD between diagnosis and ACT initiation were calculated. Additionally, density functions of the distribution of this time interval were computed and plotted for every registry.
The association between ACT exposure and overall survival was described for all analytical approaches using hazard ratios (HR) and corresponding 95% confidence intervals (CI) derived from multivariable Cox proportional hazards regression. All resected patients were followed from diagnosis (time zero) until death due to any reason, censoring, or end of follow-up.
All analyses were conducted for each country individually and adjusted for the confounders and prognostic factors listed in Table S1. Additionally, analyses were carried out using the pooled data of all countries using all overlapping adjustment variables. To account for potential correlation due to clustering effects of selected patients from the same country, a robust sandwich estimation was used.20 This was repeated in a sensitivity analysis using a shared frailty model, introducing random effects.21 An additional sensitivity analysis was carried out for patients with known pathological TNM staging.
Moreover, the overall amount of possible misclassified and unobserved person-time and events coming from each analytical approach was analyzed and quantified. Therefore, “misclassified person-time” was computed as the sum of the wrongly modeled (un)exposed person-time, and “misclassified events” as the sum of deaths occurring in these misclassified person-time intervals. The “unobserved person-time” was calculated as the sum of (un)exposed person-times before each respective landmark cutoff, and “unobserved events” as the sum of deaths that occurred before the respective landmark cutoff times.
The proportional hazards assumption was assessed by plotting weighted Schoenfeld residuals for each variable included in the regression models according to Grambsch and Therneau.22
Statistical analyses were conducted with R (R Foundation for Statistical Computing, Vienna, Austria)23–26 and SAS software, version 9.4 (SAS Institute Inc., Cary, NC, USA). Statistical significance was defined by a two-sided P<0.05. Simplified exemplary SAS codes for all analytical approaches are attached as an additional appendix in the Supplementary materials.
Results
In total, 2,449 (Belgium), 2,563 (the Netherlands), and 656 (Slovenia) resected PCa patients with median survival times (IQR) of 1.5 (0.8–3.2), 1.4 (0.8–3.0), and 1.1 (0.6–2.5) years, respectively, were eligible to be included in the study (Table 1).
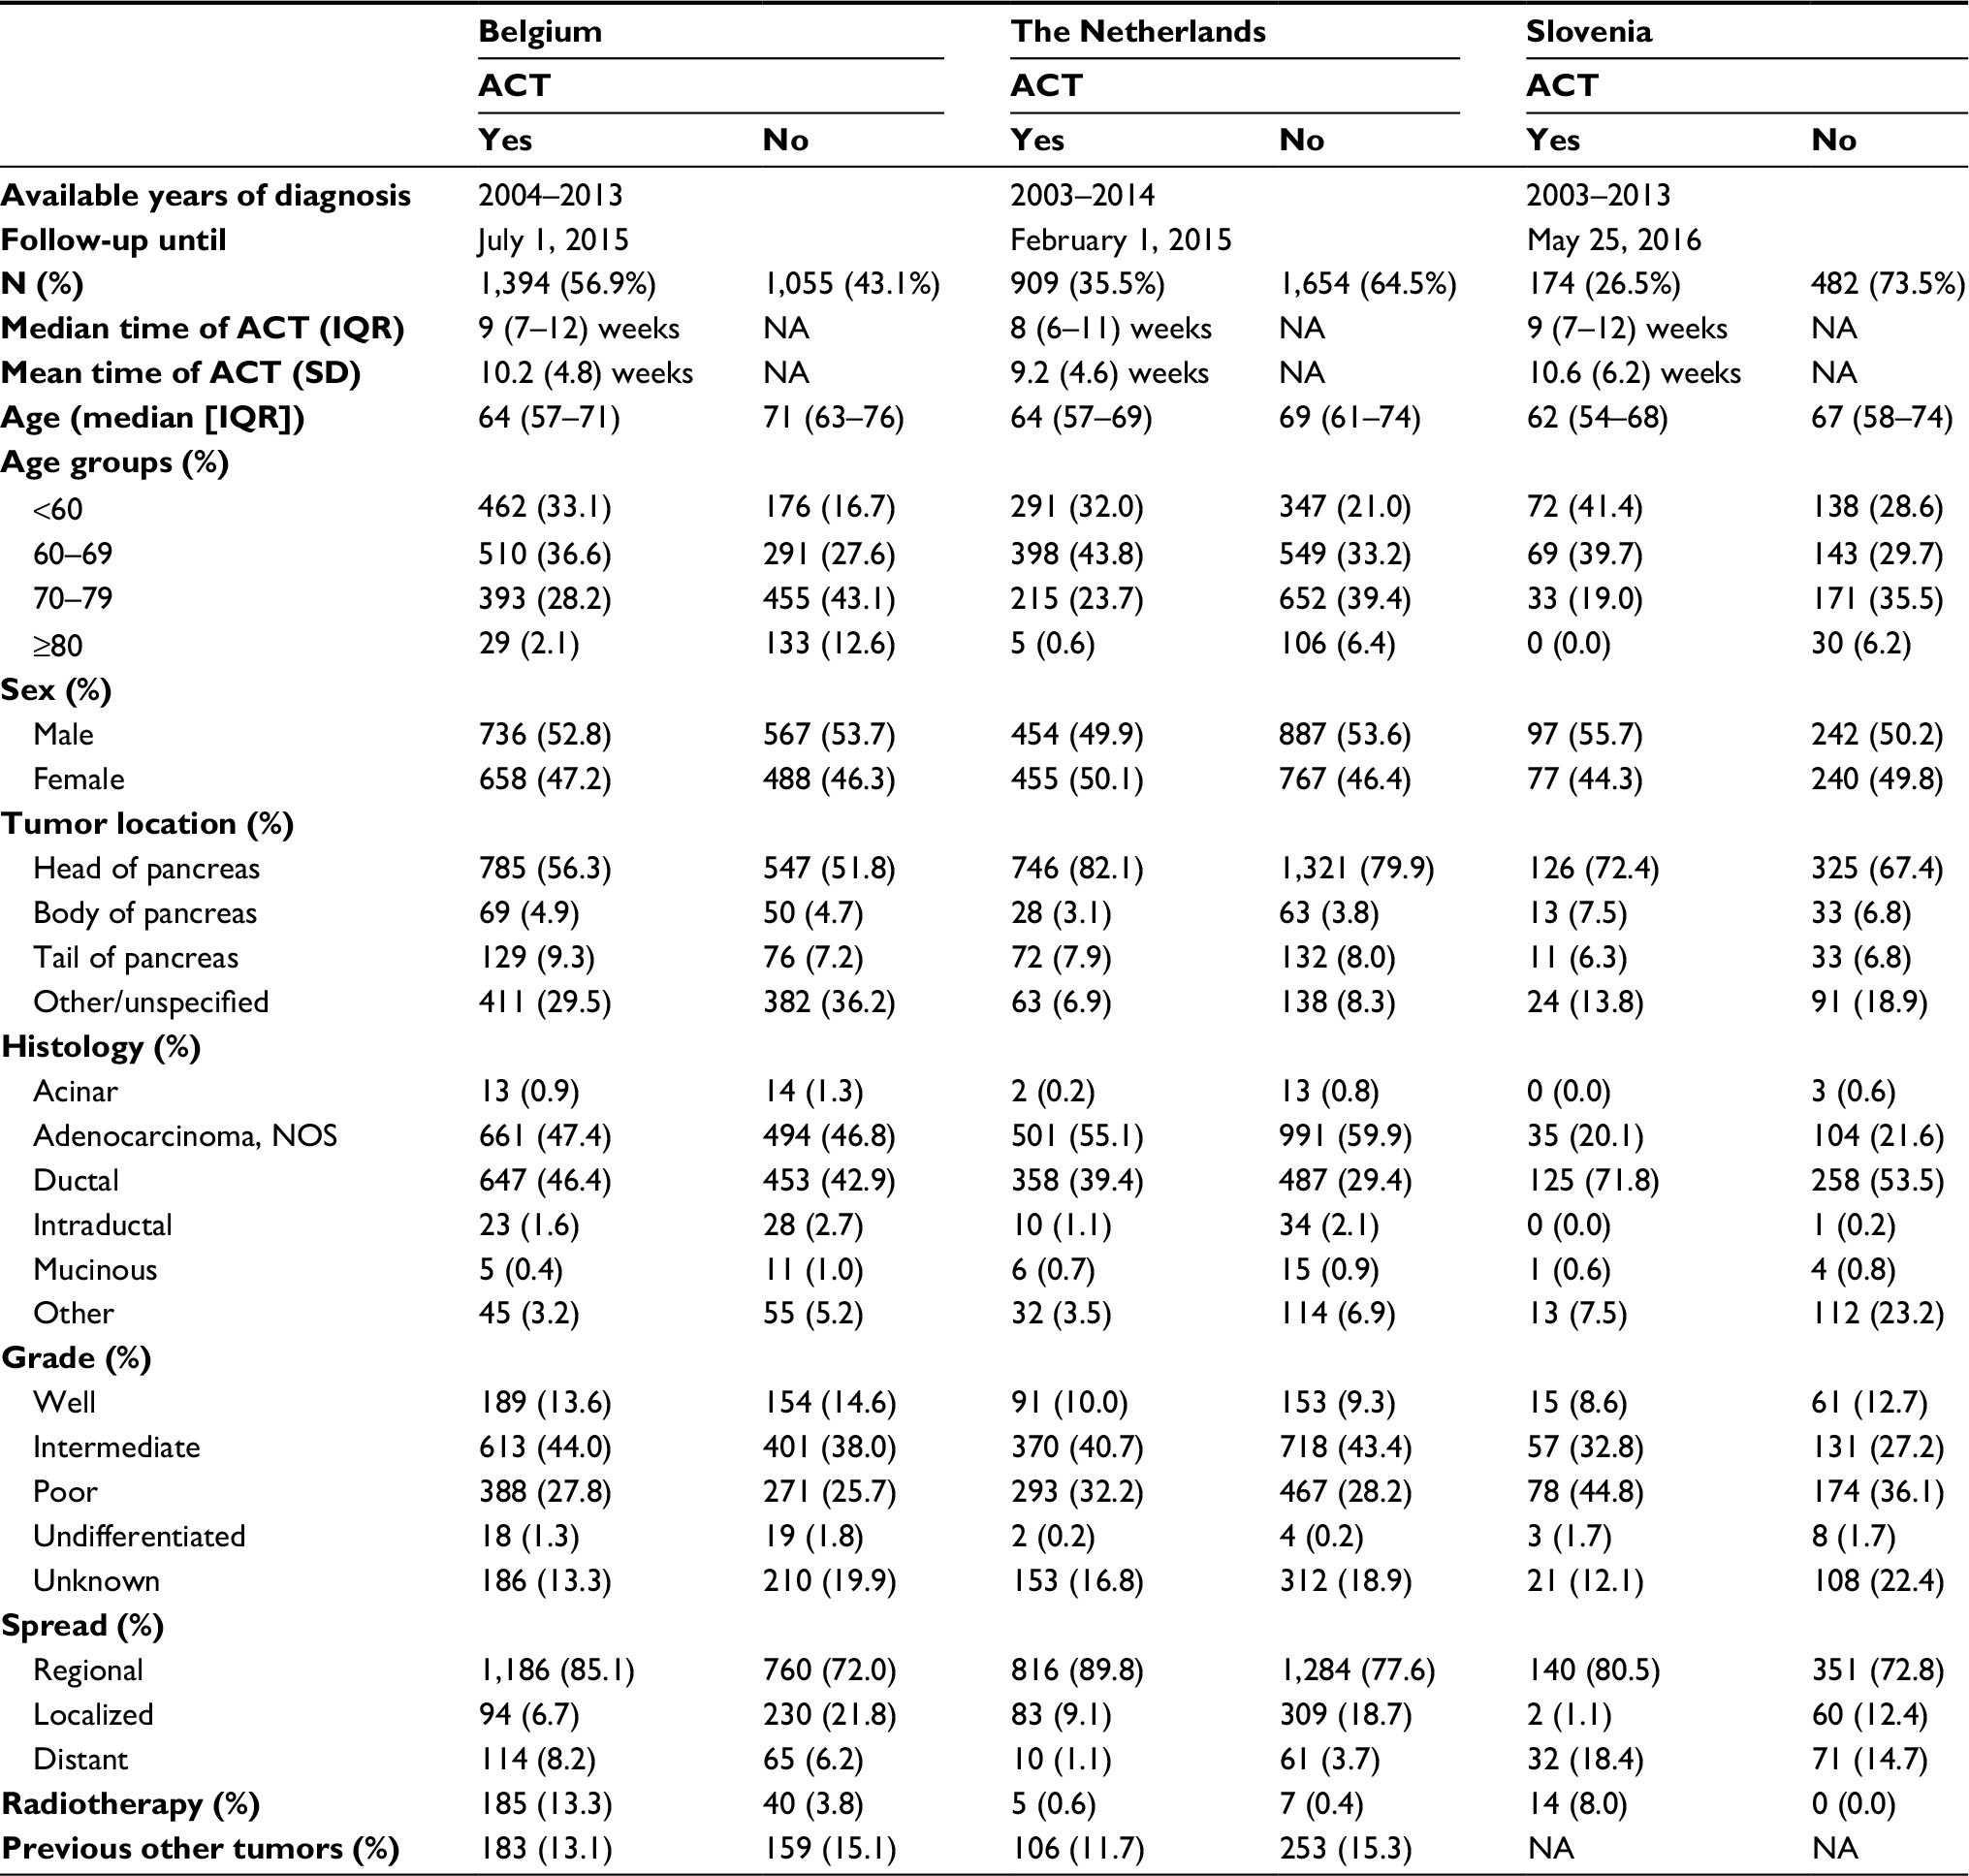 | Table 1 Basic characteristics of resected pancreatic cancer patients who were eligible to be included in the analysis Abbreviations: ACT, adjuvant chemotherapy; IQR, interquartile range; NOS, not otherwise specified; SD, standard deviation; NA, not available. |
The proportion of patients who received ACT following resection was highest in Belgium (56.9%), followed by the Netherlands (35.5%) and Slovenia (26.5%). The median age at diagnosis ranged from 62 (ACT patients Slovenia) to 71 (non-ACT patients Belgium) years. Patients who received ACT were, on average, approximately 5 years younger than patients not receiving ACT. The majority of tumors were located at the head of the pancreas (51.8%–82.1%), were intermediately differentiated (27.2%–44.0%), and exhibited regional spread (72.0%–85.1%). Radiotherapy administration was least often observed in the Netherlands (0.4%–0.6%), whereas 13.3% of the patients in Belgium who received chemotherapy were also radiated.
On average, patients initiated ACT between 9.2 (SD=4.6; the Netherlands) and 10.6 (6.2; Slovenia) weeks. The median (IQR) time from diagnosis to ACT initiation was found to be lower and quite consistent throughout all registries at 8 (6–11; the Netherlands) and 9 (7–12; Belgium and Slovenia) weeks, respectively (Figure 2). The probability density functions showed that, in all registries, the distribution of the time from diagnosis to ACT initiation was right skewed, indicating that the majority (75%) of PCa patients initiated chemotherapy within 11–12 weeks or less, but the upper quartile was distributed more broadly toward longer time intervals.
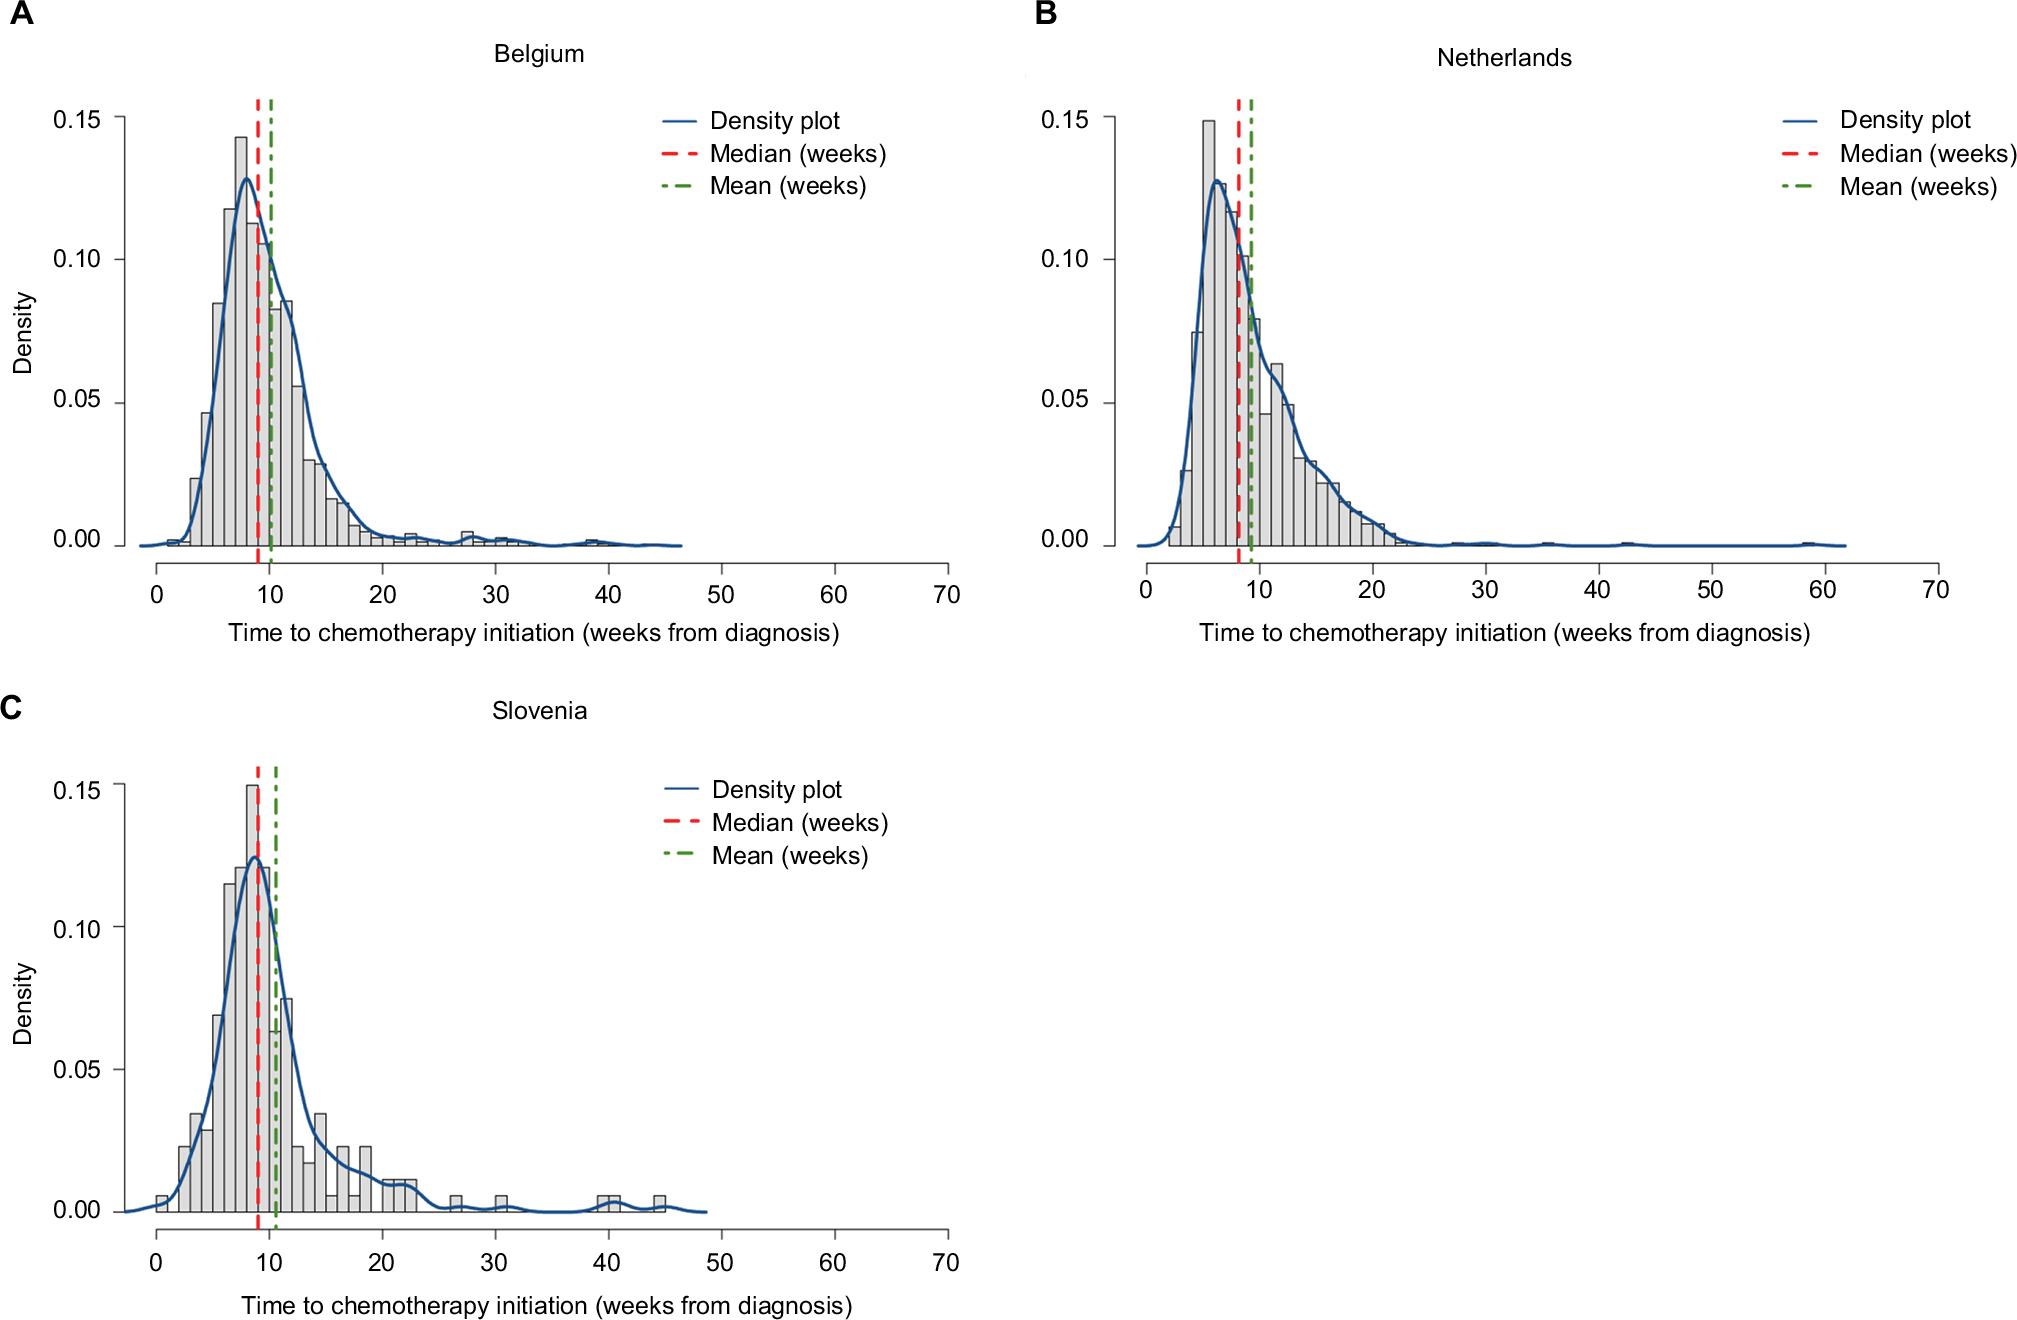 | Figure 2 Distribution of time between diagnosis and ACT initiation among resected pancreatic cancer patients (by country). Abbreviation: ACT, adjuvant chemotherapy. |
The results of the different analytical approaches for each country and overall for the study population are summarized in the forest plots displayed in Figure 3.
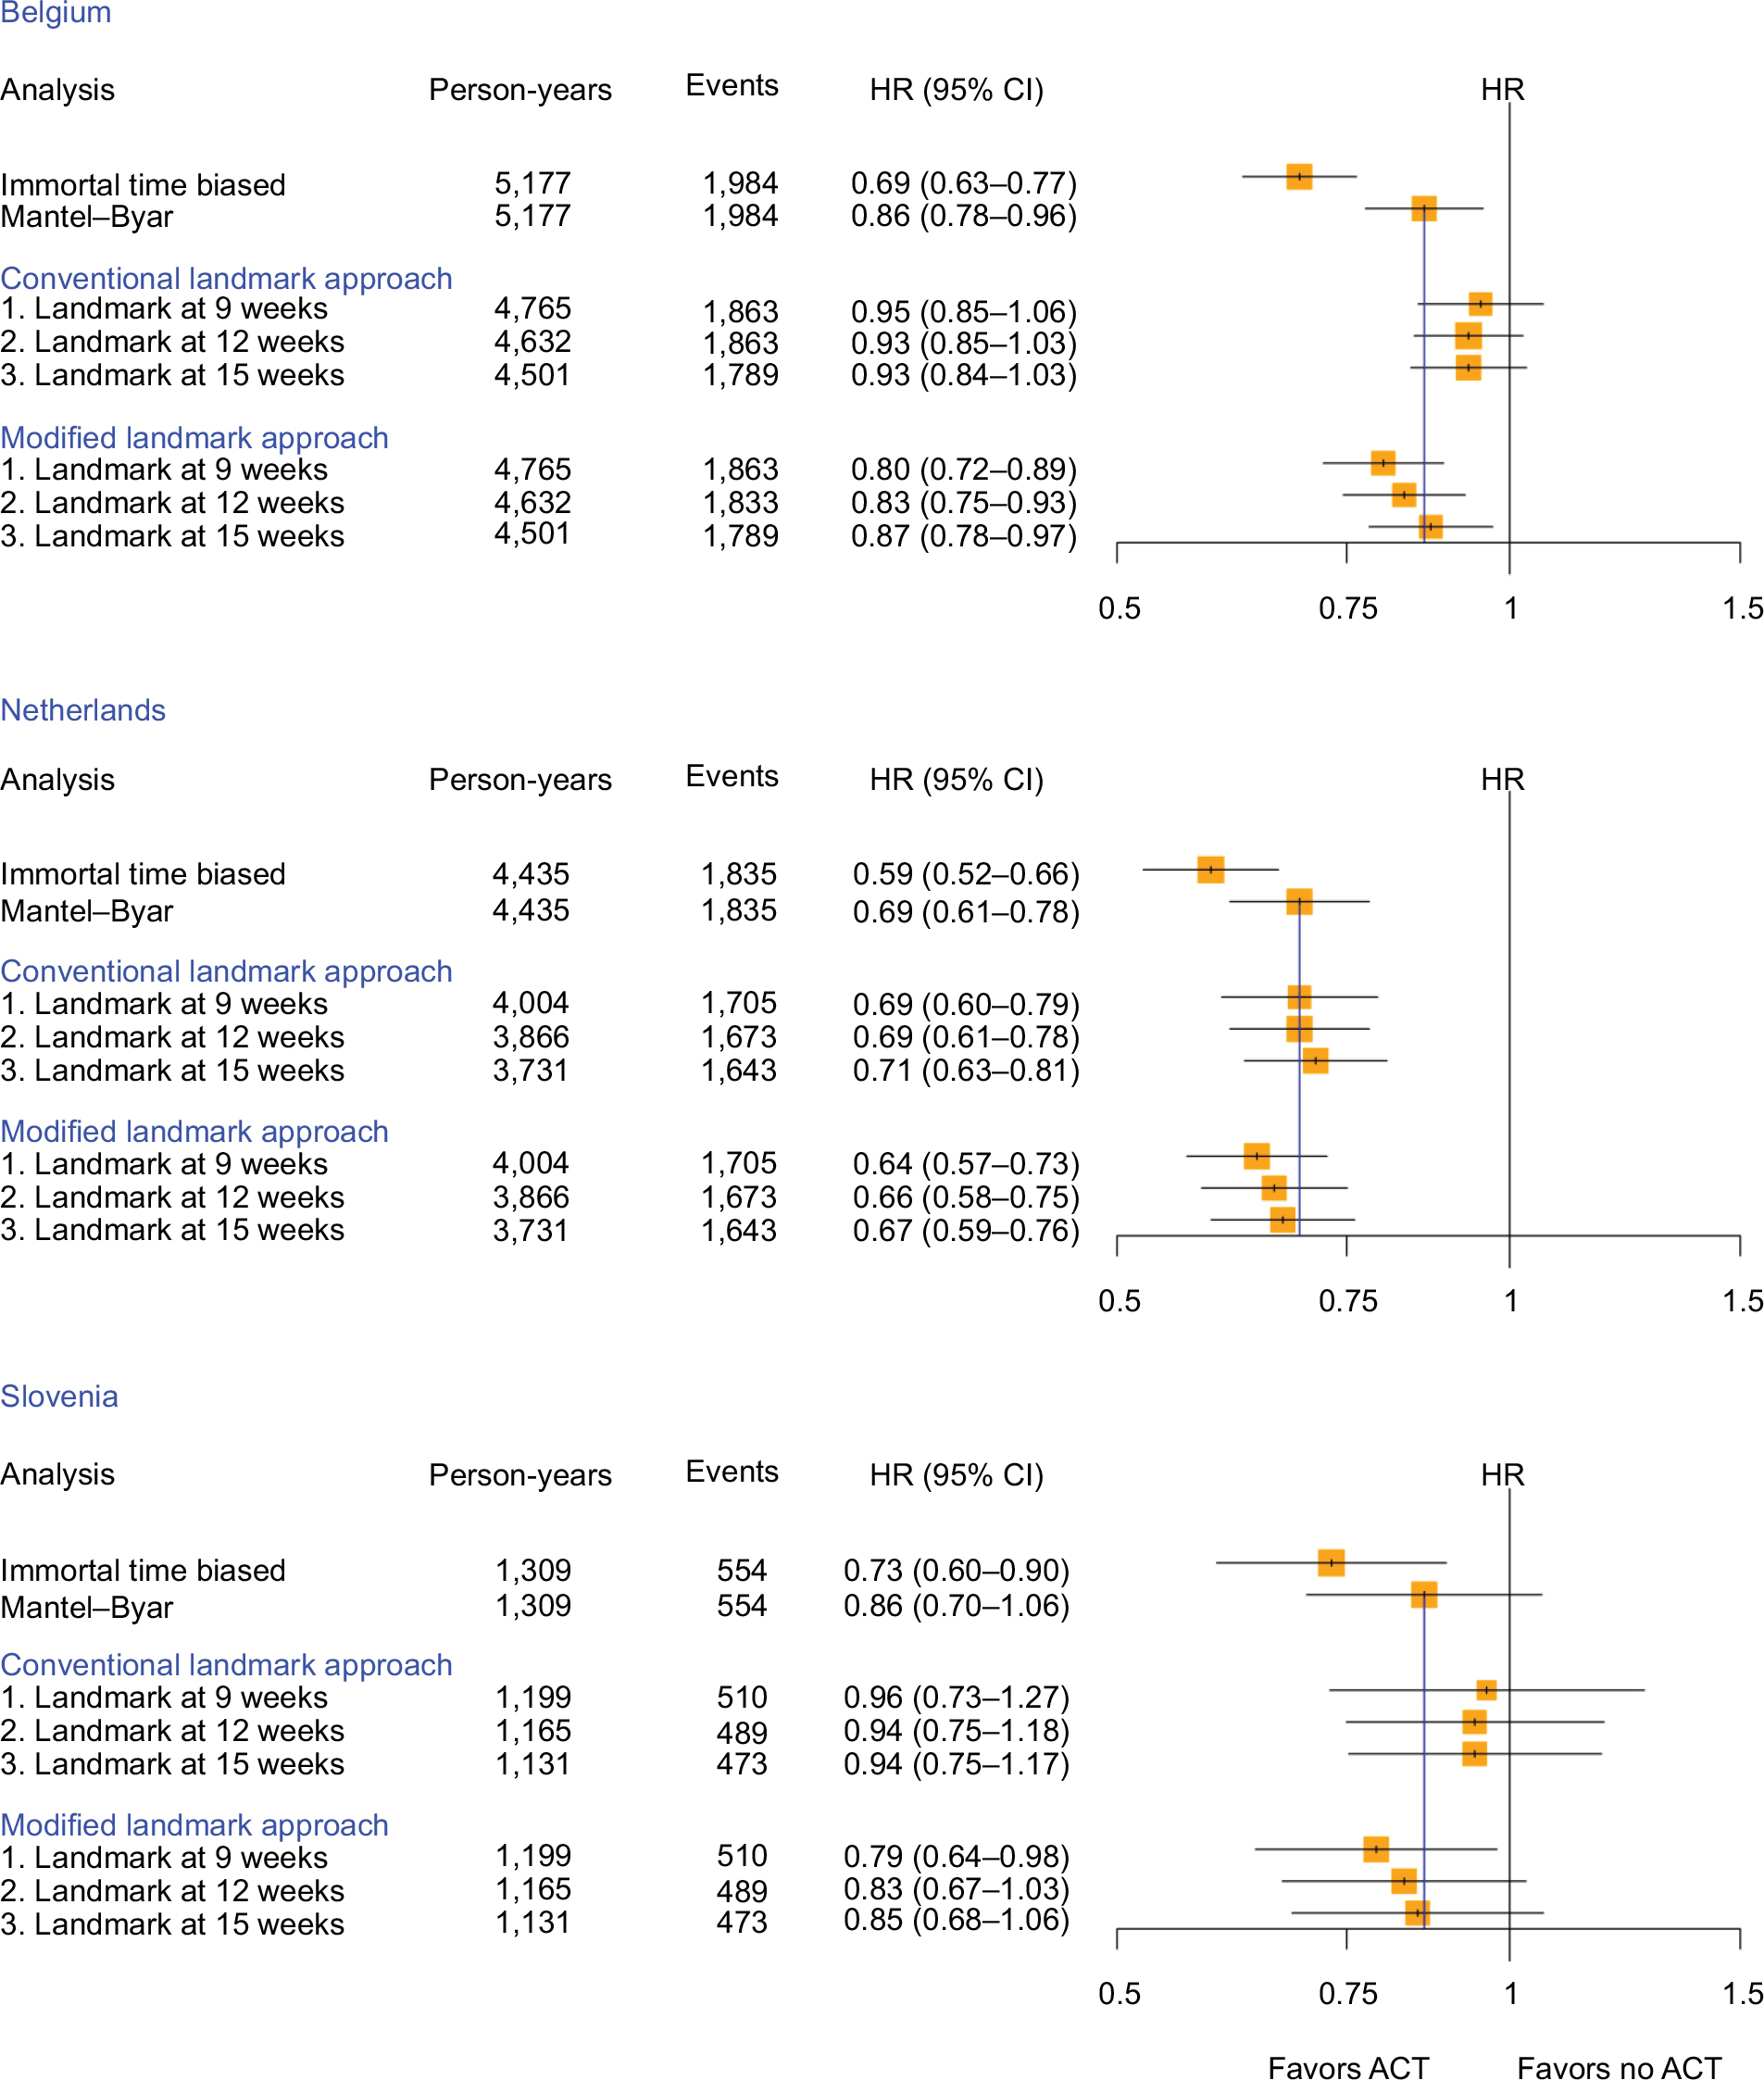 | Figure 3 HR and corresponding 95% CI to assess the association between ACT and overall survival among resected pancreatic cancer patients calculated with different study design choices by country (yellow squares indicate the inverse of the variance of the estimate). Abbreviations: ACT, adjuvant chemotherapy; HR, hazard ratio. |
When the analyses were carried out by country, the HRs (95% CI) were generally lower in the Netherlands compared to Belgium and Slovenia, but the same patterns were observed consistently throughout each country (Figure 3). As expected, the immortal time-biased analyses resulted in much lower HRs than the ones derived using the Mantel–Byar method, with HRs of 0.69 vs 0.86 (Belgium), 0.59 vs 0.69 (the Netherlands), and 0.73 vs 0.86 (Slovenia), thereby overestimating protective effects of ACT approximately two-fold in Belgium and Slovenia. Results derived from the conventional landmark analysis were generally more conservative than the Mantel–Byar method, but performed especially well in the Dutch database and yielded the same result as the Mantel–Byar method when using the landmark time at 12 weeks. In comparison, results derived from the modified landmark approach resulted in HRs (95% CI) which were, in general, marginally smaller but still close to the results from the Mantel–Byar method and increased consistently with increasing landmark cutoff time. Whereas the estimates at 9 weeks were approximately half-way between the immortal time bias and the Mantel–Byar method results, the landmark cutoff time at 15 weeks provided nearly the same results as the Mantel–Byar method (HRs [95% CI] Mantel–Byar method vs modified landmark at 15 weeks of 0.86 [0.78–0.96] vs 0.87 [0.78–0.97] for Belgium, 0.69 [0.61–0.78] vs 0.67 [0.59–0.76] for the Netherlands, and 0.86 [0.70–1.06] vs 0.85 [0.68–1.06] for Slovenia, respectively).
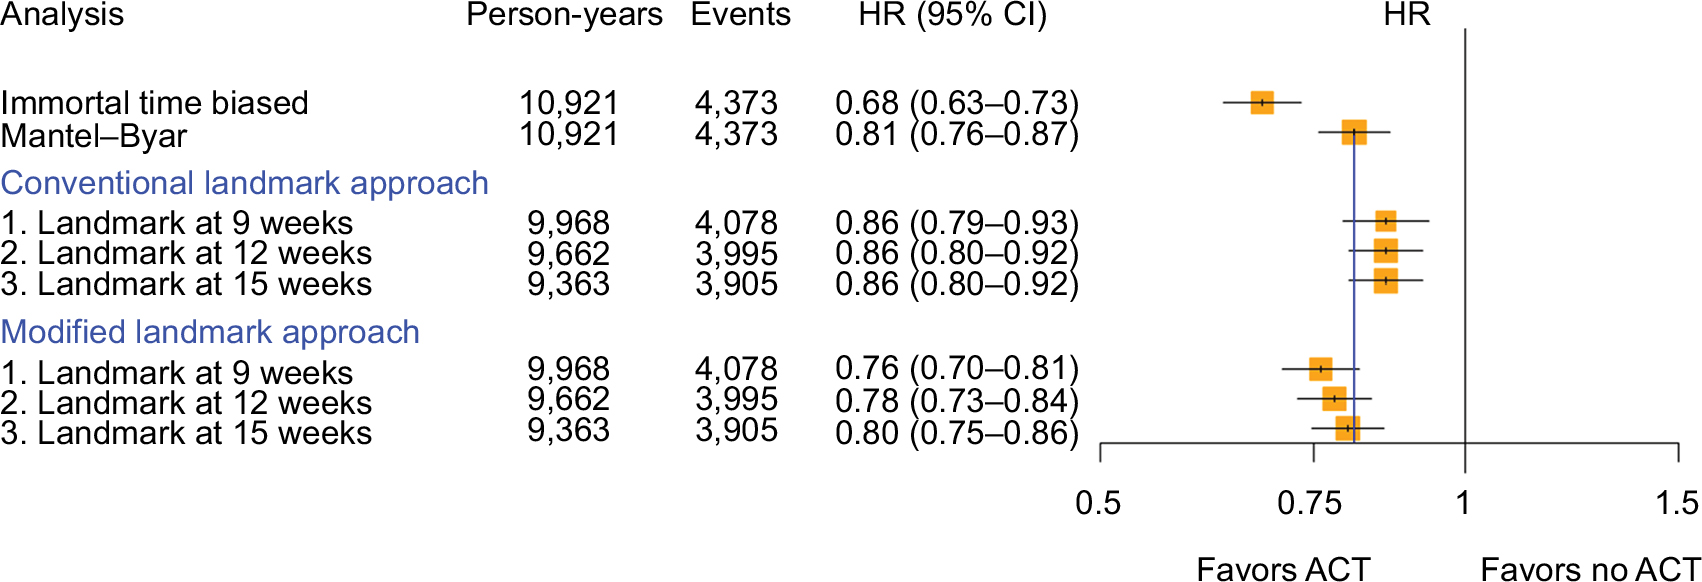
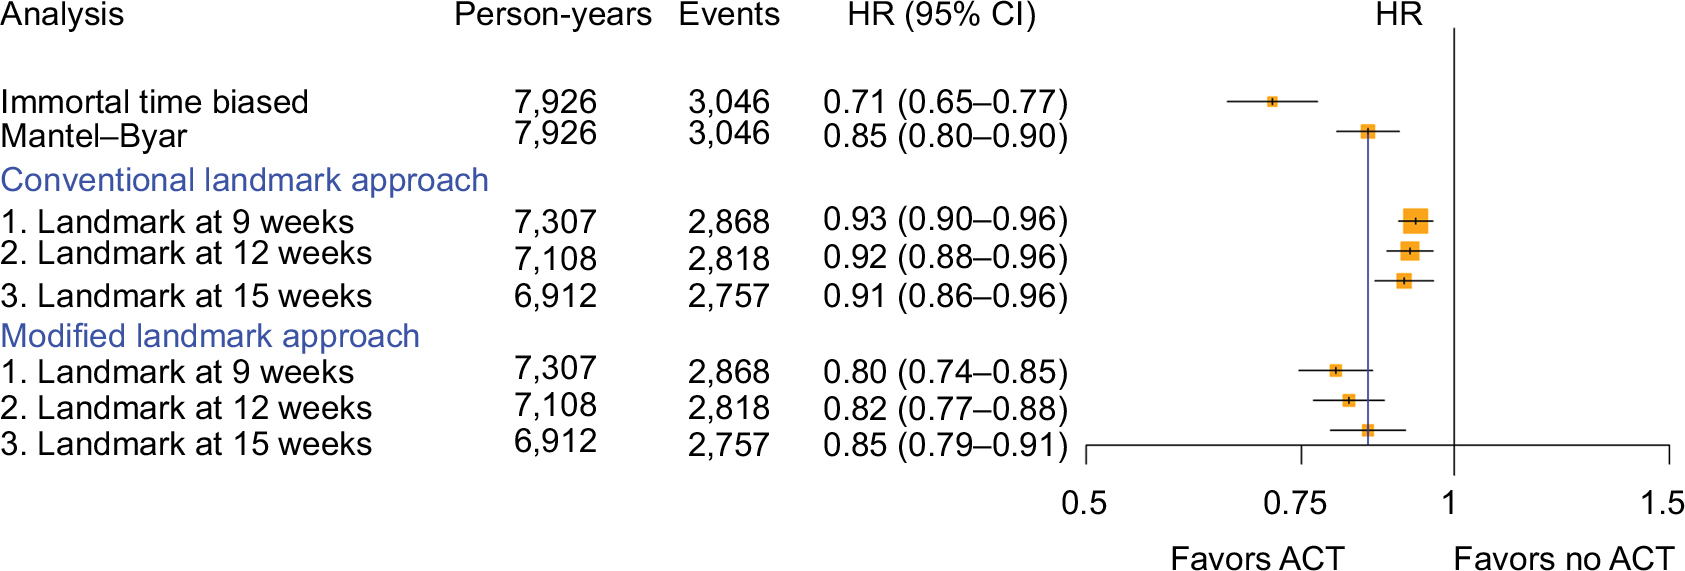
When all countries were analyzed as a pooled dataset, overall the same results and patterns were found (Figure 4). Again, the immortal time-biased analysis provided a much lower HR than the Mantel–Byar method (0.68 vs 0.82) and resulted in a total of 469 misclassified exposed person-years (4.3% of total follow-up time, Table S2). The modified landmark analyses yielded HRs that were much less biased (0.76, 0.78, and 0.81, respectively), especially when setting the landmark cutoff at 15 weeks (HR [95% CI] 0.82 [0.71–0.93] Mantel–Byar vs 0.81 [0.70–0.94]). Here, the amount of misclassified exposed person-years (% of total follow-up) decreased with later landmark cutoff times (97 [1.0%], 48 [0.5%], and 26 [0.3%] with a 9-, 12-, and 15-week cutoff time, respectively). Results derived from the conventional landmark analysis were again found more conservative but with less variance between the chosen landmark times compared to the modified landmark approach. However, with 2,396 (58.8%), 1,161 (12.0%), and 489 (5.2%) person-years (% of total follow-up), the amount of misclassified unexposed person-years exceeded the amount of misclassified exposed person-years in the modified landmark analysis. Repeating the analyses using a shared frailty model or only including patients with a recorded pathological tumor-node-metastasis (pTNM) stage did not meaningfully alter the results (Figures S1 and 2).
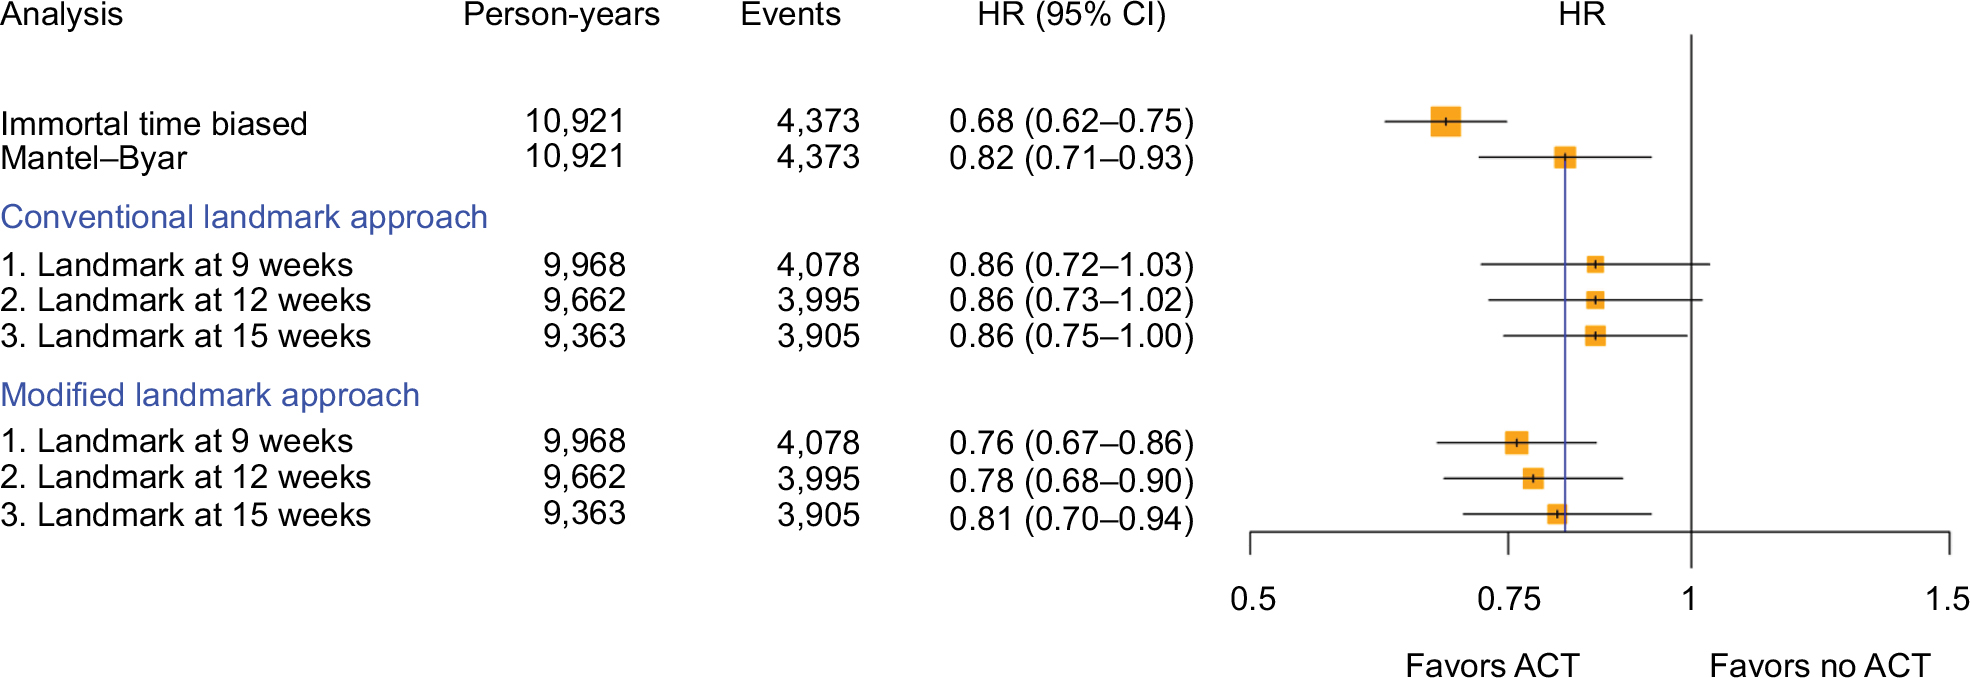 | Figure 4 HR and corresponding 95% CI to assess the association between ACT and overall survival among resected pancreatic cancer patients calculated with different study design choices overall (yellow squares indicate the inverse of the variance of the estimate). Abbreviations: ACT, adjuvant chemotherapy; HR, hazard ratio. |
Discussion
In this methodologically focused population-based cohort study, we aimed to systematically analyze the comparative performance of a modified landmark approach relative to the Mantel–Byar method as the gold standard by applying these analytical approaches to a well-known positive association between ACT among resected PCa patients and overall survival. As expected, all analyses showed a significantly increased survival among resected PCa patients who received ACT relative to surgery only. Compared to the Mantel–Byar method, immortal time-biased analyses overestimated the reduction in mortality for patients treated with ACT almost two-fold, whereas the conventional landmark approach yielded consistent and precise, but more conservative, estimates compared to the Mantel–Byar method. In comparison, results derived from the modified landmark approach resulted in HRs similar to the Mantel–Byar method, and were especially accurate when the landmark cutoff time was set at 15 weeks.
To our knowledge, this is the first methodological study to investigate the comparative performance of a modified landmark approach in a population-based setting. So far, published studies on that topic have rather focused on the conventional landmark approach which, however, requires time of treatment information.6,27–30 Given that this information is often not available and the modified version of the landmark approach is usually intuitively used,31 exploring the performance of the derived results relative to the Mantel–Byar method is of high relevance.
Recently, studies on PCa, which investigated the same or similar research questions as in this study, have been found to be affected by immortal time bias.32–34 Especially, cohort studies in the adjuvant setting are prone to be immortal time biased,35 but studies in the neoadjuvant setting can be biased as well. For example, a recently published study assessed the overall survival among pancreatic head cancer patients who received neoadjuvant treatment followed by surgery as compared to patients with surgery only.34 The authors found a 28% lower mortality among those patients with neoadjuvant chemotherapy followed by resection, which might be a result likely to be influenced by immortal time bias.36 As patients who received neoadjuvant treatment had to remain alive at least until the time of neoadjuvant treatment, they were artificially assigned a survival advantage compared to those who received surgery only. As the authors modeled the exposure as a time-fixed variable, this led to a biased rate ratio in favor of the neoadjuvant treatment. Again, approaches to avoid immortal time bias would have been to model the time between diagnosis and surgery as unexposed and exposed thereafter (Mantel–Byar), or to define a landmark at the time of surgery and follow the patients, who were still alive at that time, from this landmark cutoff.
In this study, the Mantel–Byar method provided results similar to results from RCTs, also indicating a significant survival benefit among resected PCa patients receiving ACT.9 The observed patterns were consistent in all registries, but with lower HRs in the Dutch cohort, which might be likely due to strong changes in treatment rates in the last decade. Expectedly, immortal time-biased analyses led to results which were in comparison to the Mantel–Byar method almost two-fold lower. Given that all eligible patients were chosen conditional on having received surgery, the only possible “immortal” time window was the time between surgery and potential chemotherapy initiation which, from a clinical perspective, is a rather short time window. However, given that the magnitude of immortal time bias is higher the worse a prognosis of the underlying disease is,37 the results presented herein are sensitive even for short time intervals, because survival among PCa patients is low (as displayed in the crude 1- and 5-year survival estimates in Table S3).
However, one has to be aware of limitations coming with a modified landmark approach. A critical decision in conducting a modified landmark analysis is the choice of the landmark cutoff time. In this study, landmark cutoff times of 9, 12, and 15 weeks were chosen based on published literature and information derived from RCTs. It was found that adding a 25% grace period to the cutoff time suggested by RCTs led to the best performance relative to the Mantel–Byar method. Therefore, the choice of the best cutoff time has to be pre-evaluated for every specific research question and cancer entity. Good sources for potential landmark times might be expert opinions, published literature, and guidelines, if available. Methodological studies investigating the conventional landmark approach suggested to present results using a sequential landmark analysis, which means that results from multiple cutoff times are reported.29 Accordingly, the sequential analysis can also be recommended to present results derived from a modified landmark analysis, which should always go along with a critical interpretation of the results.
Moreover, taking the average time of treatment initiation as a landmark cutoff – which could be available on an aggregated data level from cancer registries – might be applicable in the conventional landmark approach due to the generally higher precision, but not recommendable in the modified landmark approach as the results with the average time to ACT initiation (consistently between 9 and 12 weeks) overestimated the potential true association. This might be explained by the right-skewed distribution of the time to ACT initiation which was consistently observed throughout all registries. However, if the time of treatment information is available anyway on an individual patient level, the Mantel–Byar method should always be preferred over the conventional landmark analysis. The only potential advantage of the conventional landmark analysis might be the easier computation compared to the more complex programming of the Mantel–Byar method, but this approach was found to be biased if treatment effects are large.6
When, in the conventional landmark approach, a patient starts the exposure after the landmark time, the patient will be modeled as unexposed throughout the whole follow-up, which explains the conservative estimates in our analyses. Using the modified landmark approach, patients might be modeled as exposed at the landmark time, although the patient’s treatment has, in reality, started sometime later, due to the absence of treatment timing information. This is why it is important to emphasize that the modified landmark approach only mitigates – but does not completely remove – immortal time bias, because the gap of the expected and the actual treatment initiation among some patients still leads to a small immortal time gap. However, the quantification of this possible immortal time interval showed that the amount of misclassified exposed person-time decreased with later landmark cutoff times to an almost negligible proportion of 0.3% of the total follow-up time at the 15-week landmark cutoff, which explains why the HRs derived from the modified landmark approach were generally a bit lower and steadily increased with increasing the landmark time (Table S2). Therefore, a good balance in the choice of the landmark time has to be found, because the later a landmark cutoff time is defined, the less possible it is that “immortal” person-time is included but also that more patients will be excluded (unobserved) from the analysis. This not only leads to decreased statistical power, but may also result in selection bias as many patients with an early event are being excluded, which is problematic (e.g., in cancer entities with a bad prognosis). A recently published simulation study, which investigated the performance of the conventional landmark approach, also found that the bias and the precision depend on the choice of the landmark time as well as the event and treatment rates, given that there is a large treatment effect.6 The authors concluded that with varying landmark times, the differences in results were small; however, in general, longer landmark times performed better but with decreasing precision over time when the treatment rate was high in early follow-up. This once more emphasizes the need of a careful consideration of an appropriate landmark cutoff time and underlines the recommended sequential approach using multiple landmark times.
In other scenarios than the one illustrated in this study, the modified landmark approach might also perform differently, depending on the prognosis of each cancer entity, the effectiveness of the treatment intervention, and the time when the treatment is started during the course of the disease. In a previous study37 it was found that the magnitude of immortal time bias conclusively correlates with the prognosis of each cancer entity; with a larger impact, the worse the prognosis was (with PCa as the cancer entity with the worst prognosis and, hence, the largest bias). This implies that in cancer entities with better prognosis, such as breast cancer or prostate cancer, the residual misclassified exposed person-time in the modified landmark analysis will most likely have less impact on the derived estimates, and the differences between landmark cutoff times will most likely decrease. In another scenario where the treatment effect is rather small, little variations in the landmark time might not reveal the potential treatment association. Additionally, if the landmark cutoff is set very late during the course of the disease, results might not be generalizable anymore as the landmark approach implies a conditional survival to the time of the landmark cutoff.38
This study has strengths and limitations. Firstly, residual confounding by indication cannot be ruled out, because guidelines have increasingly recommended chemotherapy whenever possible among resected PCa patients, which means that resected patients who have not received post-surgical chemotherapy might have been too ill to receive chemotherapy or refused chemotherapy due to other reasons. However, this potential bias would be expected to apply to all of the analytical approaches in a similar manner, and should not have had a major impact on our results. Secondly, there was not sufficient information available to control for comorbidities or concomitantly used drugs, and the results may not be generalizable as no simulations were undertaken. However, due to the bad prognosis of PCa, deaths due to competing risks and further analyses on cancer-specific survival might be negligible.
Nevertheless, it was possible to use data from multiple cancer registries from different countries which was done in order to emulate a multicentric RCT and to decrease the chance of random false-positive findings compared to only using one database. Additionally, with the provided data, the most important confounders and prognostic factors could be controlled for in multivariable regression analysis.
Another strength is that the study question investigated here was undertaken in a very sensitive setting and was, therefore, found ideal due to the following reasons. Firstly, the evidence of major RCTs on this question is quite strong, serving as a good estimate of the “true” treatment association by ACT. Secondly, resected PCa patients represent a small but homogeneous group of patients, which provides a better basis to study treatment associations as there are less influential factors that might distort a potential association.39 Thirdly, the ESPAC-3 trial revealed that survival of PCa patients does not depend on the time of initiation of ACT after surgery, which would have introduced bias had there been a causal relationship.18,19 Finally, recommendations were recently made to combine adjuvant gemcitabine and capecitabine (ESPAC-4 trial); however, in general, PCa unfortunately still has a bad prognosis and no major therapeutic breakthroughs were approved in the last decade, which means that only small time windows can yet cause severe immortal time bias in this setting.37,40 As the modified landmark approach with a landmark time at 15 weeks led to nearly the same results as the Mantel–Byar model, this strengthens confidence in the modified landmark approach as a useful analytical tool which might also be used in studies with cancer entities other than PCa.
In conclusion, this PCa-focused study provides some evidence that a modified landmark approach leads to results that are close to the ones derived by the Mantel–Byar method, which is considered the gold standard analytical approach to avoid immortal time bias. The information on time of exposure initiation is often lacking in many oncological databases, especially in larger cancer registry databases such as those in the US (Surveillance, Epidemiology, and End Results Program [SEER]) or Germany.41 This gap in the linkage to detailed and high-quality treatment data for research purposes might be due to restricted access to such data, logistical difficulties, or data protection policies. The conduct of this study was motivated by the large amount of studies that -although not having detailed information on the time of exposure initiation- tried to investigate treatment associations, which has frequently led to tremendously (immortal time) biased results.42 The modified landmark approach provides a fast and easy to use way to meaningfully mitigate immortal time bias when the time of exposure initiation is not recorded in pertinent databases. If researchers are aware of the potential factors that might influence a modified landmark analysis and critically interpret the derived results, this analytical approach might be a valuable tool to assess treatment associations in databases that do not provide any time of treatment data. Due to the very easy computational realization and application of this method, validation of these findings and more experience with the modified landmark analysis in other cancer entities and indications is of utmost interest for future research.
Acknowledgments
The authors thank Julia Krzykalla and Axel Benner from the Division of Biostatistics, German Cancer Research Center, Heidelberg, Germany, for statistical advice on this study and Tom Børge Johannesen, MD, PhD, from the Cancer Registry of Norway for providing additional data that was not used in this study due to the lack of important variables needed to carry out the analysis.
The authors also thank the staff of the Belgian, Dutch, and Slovenian Cancer Registries and all physicians, pathologists, and data managers involved for their dedicated data collection.
Disclosure
The authors report no conflicts of interest in this work.
References
Hernán MA, Sauer BC, Hernández-Díaz S, Platt R, Shrier I. Specifying a target trial prevents immortal time bias and other self-inflicted injuries in observational analyses. J Clin Epidemiol. 2016;79:70–75. | ||
Weberpals J, Jansen L, Carr PR, Hoffmeister M, Brenner H. Beta blockers and cancer prognosis – the role of immortal time bias: a systematic review and meta-analysis. Cancer Treat Rev. 2016;47:1–11. | ||
Beyersmann J, Gastmeier P, Wolkewitz M, Schumacher M. An easy mathematical proof showed that time-dependent bias inevitably leads to biased effect estimation. J Clin Epidemiol. 2008;61(12):1216–1221. | ||
Wolkewitz M, Allignol A, Harbarth S, de Angelis G, Schumacher M, Beyersmann J. Time-dependent study entries and exposures in cohort studies can easily be sources of different and avoidable types of bias. J Clin Epidemiol. 2012;65(11):1171–1180. | ||
Mantel N, Byar DP. Evaluation of response-time data involving transient states: an illustration using heart-transplant data. J Am Stat Assoc. 1974;69(345):81–86. | ||
Mi X, Hammill BG, Curtis LH, Lai EC, Setoguchi S. Use of the landmark method to address immortal person-time bias in comparative effectiveness research: a simulation study. Stat Med. 2016;35(26):4824–4836. | ||
Suissa S. Immortal time bias in pharmaco-epidemiology. Am J Epidemiol. 2008;167(4):492–499. | ||
Anderson JR, Cain KC, Gelber RD. Analysis of survival by tumor response. J Clin Oncol. 1983;1(11):710–719. | ||
Liao WC, Chien KL, Lin YL, et al. Adjuvant treatments for resected pancreatic adenocarcinoma: a systematic review and network meta-analysis. Lancet Oncol. 2013;14(11):1095–1103. | ||
Ducreux M, Cuhna AS, Caramella C, et al; ESMO Guidelines Committee. Cancer of the pancreas: ESMO Clinical Practice Guidelines for diagnosis, treatment and follow-up. Ann Oncol. 2015;26(Suppl 5):v56–v68. | ||
Khorana AA, Mangu PB, Berlin J, et al. Potentially curable pancreatic cancer: American Society of Clinical Oncology Clinical Practice Guideline. J Clin Oncol. 2016;34(21):2541–2556. | ||
Neoptolemos JP, Dunn JA, Stocken DD, et al; European Study Group for Pancreatic Cancer. Adjuvant chemoradiotherapy and chemotherapy in resectable pancreatic cancer: a randomised controlled trial. Lancet. 2001;358(9293):1576–1585. | ||
Neoptolemos JP, Stocken DD, Friess H, et al; European Study Group for Pancreatic Cancer. A randomized trial of chemoradiotherapy and chemotherapy after resection of pancreatic cancer. N Engl J Med. 2004;350(12):1200–1210. | ||
Oettle H, Post S, Neuhaus P, et al. Adjuvant chemotherapy with gemcitabine vs observation in patients undergoing curative-intent resection of pancreatic cancer: a randomized controlled trial. JAMA. 2007;297(3):267–277. | ||
Oettle H, Neuhaus P, Hochhaus A, et al. Adjuvant chemotherapy with gemcitabine and long-term outcomes among patients with resected pancreatic cancer: the CONKO-001 randomized trial. JAMA. 2013;310(14):1473–1481. | ||
Neoptolemos JP, Stocken DD, Bassi C, et al; European Study Group for Pancreatic Cancer. Adjuvant chemotherapy with fluorouracil plus folinic acid vs gemcitabine following pancreatic cancer resection: a randomized controlled trial. JAMA. 2010;304(10):1073–1081. | ||
Bakens MJ, van der Geest LG, van Putten M, et al; Dutch Pancreatic Cancer Group. The use of adjuvant chemotherapy for pancreatic cancer varies widely between hospitals: a nationwide population-based analysis. Cancer Med. 2016;5(10):2825–2831. | ||
Valle JW, Palmer D, Jackson R, et al. Optimal duration and timing of adjuvant chemotherapy after definitive surgery for ductal adenocarcinoma of the pancreas: ongoing lessons from the ESPAC-3 study. J Clin Oncol. 2014;32(6):504–512. | ||
Xia BT, Ahmad SA, Al Humaidi AH, et al. Time to initiation of adjuvant chemotherapy in pancreas cancer: a multi-institutional experience. Ann Surg Oncol. 2017;24(9):2770–2776. | ||
Lin DY, Wei LJ. The robust inference for the Cox proportional hazards model. J Am Stat Assoc. 1989;84(408):1074–1078. | ||
Vaida F, Xu R. Proportional hazards model with random effects. Stat Med. 2000;19(24):3309–3324. | ||
Grambsch PM, Therneau TM. Proportional hazards tests and diagnostics based on weighted residuals. Biometrika. 1994;81(3):515–526. | ||
R Core Team. R: a language and environment for statistical computing. Vienna: R Foundation for Statistical Computing. 2015. Available from: http://www.R-project.org/. Accessed 31 July, 2018. | ||
Schwarzer G. Meta: meta-analysis with R. R package version 4.3-2. Available from: http://CRAN.R-project.org/package=meta. Accessed December 2, 2015. | ||
Yoshida K, Bohn J. R Package ‘tableone’. https://github.com/kaz-yos/tableone. Accessed November 30, 2016. | ||
Therneau TM. A package for survival analysis in S. version 2.38. Available from: https://CRAN.R-project.org/package=survival. Accessed September 28, 2017. | ||
Jones M, Fowler R. Immortal time bias in observational studies of time-to-event outcomes. J Crit Care. 2016;36:195–199. | ||
Mi X, Hammill BG, Curtis LH, Greiner MA, Setoguchi S. Impact of immortal person-time and time scale in comparative effectiveness research for medical devices: a case for implantable cardioverter-defibrillators. J Clin Epidemiol. 2013;66(8 Suppl):S138–S144. | ||
Park HS, Gross CP, Makarov DV, Yu JB. Immortal time bias: a frequently unrecognized threat to validity in the evaluation of postoperative radiotherapy. Int J Radiat Oncol Biol Phys. 2012;83(5):1365–1373. | ||
Dafni U. Landmark analysis at the 25-year landmark point. Circ Cardiovasc Qual Outcomes. 2011;4(3):363–371. | ||
‘t Lam-Boer J, Van der Geest LG, Verhoef C, Elferink ME, Koopman M, de Wilt JH. Palliative resection of the primary tumor is associated with improved overall survival in incurable stage IV colorectal cancer: a nationwide population-based propensity-score adjusted study in the Netherlands. Int J Cancer. 2016;139(9):2082–2094. | ||
Hu YW. Statins and the risk of pancreatic cancer in Type 2 diabetic patients: immortal time bias in survival analysis? Int J Cancer. 2016;139(1):232. | ||
Hu ZH, Connett JE, Yuan JM, Anderson KE. Role of survivor bias in pancreatic cancer case-control studies. Ann Epidemiol. 2016;26(1):50–56. | ||
Mokdad AA, Minter RM, Zhu H, et al. Neoadjuvant therapy followed by resection versus upfront resection for resectable pancreatic cancer: a propensity score matched analysis. J Clin Oncol. 2017;35(5):515–522. | ||
Gill BS, Flickinger JC, Beriwal S. Caveat for immortal time bias in adjuvant therapy–related population-based analyses. J Clin Oncol. 2015;33(26):2931. | ||
Lai TY, Hu YW. Neoadjuvant therapy in resectable pancreatic cancer: immortal time bias and its correction. J Clin Oncol. 2017;35(14):1623. | ||
Weberpals J, Jansen L, van Herk-Sukel MPP, et al. Immortal time bias in pharmacoepidemiological studies on cancer patient survival: empirical illustration for beta-blocker use in four cancers with different prognosis. Eur J Epidemiol. 2017;32(11):1019–1031. | ||
Giobbie-Hurder A, Gelber RD, Regan MM. Challenges of guarantee-time bias. J Clin Oncol. 2013;31(23):2963–2969. | ||
Franklin JM, Schneeweiss S. When and how can real world data analyses substitute for randomized controlled trials? Clin Pharmacol Ther. 2017;102(6):924–933. | ||
Neoptolemos JP, Palmer DH, Ghaneh P, et al; European Study Group for Pancreatic Cancer. Comparison of adjuvant gemcitabine and capecitabine with gemcitabine monotherapy in patients with resected pancreatic cancer (ESPAC-4): a multicentre, open-label, randomised, phase 3 trial. Lancet. 2017;389(10073):1011–1024. | ||
Zachary I, Boren SA, Simoes E, Jackson-Thompson J, Davis JW, Hicks L. Information management in cancer registries: evaluating the needs for cancer data collection and cancer research. Online J Public Health Inform. 2015;7(2):e213. | ||
van Walraven C, Davis D, Forster AJ, Wells GA. Time-dependent bias was common in survival analyses published in leading clinical journals. J Clin Epidemiol. 2004;57(7):672–682. |
Supplementary materials
 | Figure S1 Hazard ratio (HR) and corresponding 95% confidence interval (95% CI) to assess the association between adjuvant chemotherapy (ACT) and overall survival among resected pancreatic cancer patients calculated with different study design choices overall using a shared frailty model (sensitivity analysis) (yellow squares indicate the inverse of the variance of the estimate). |
 | Figure S2 Hazard ratio (HR) and corresponding 95% confidence interval (95% CI) to assess the association between adjuvant chemotherapy (ACT) and overall survival among resected pancreatic cancer patients calculated with different study design choices when only including patients with pathological TNM staging (sensitivity analysis; yellow squares indicate the inverse of the variance of the estimate). |
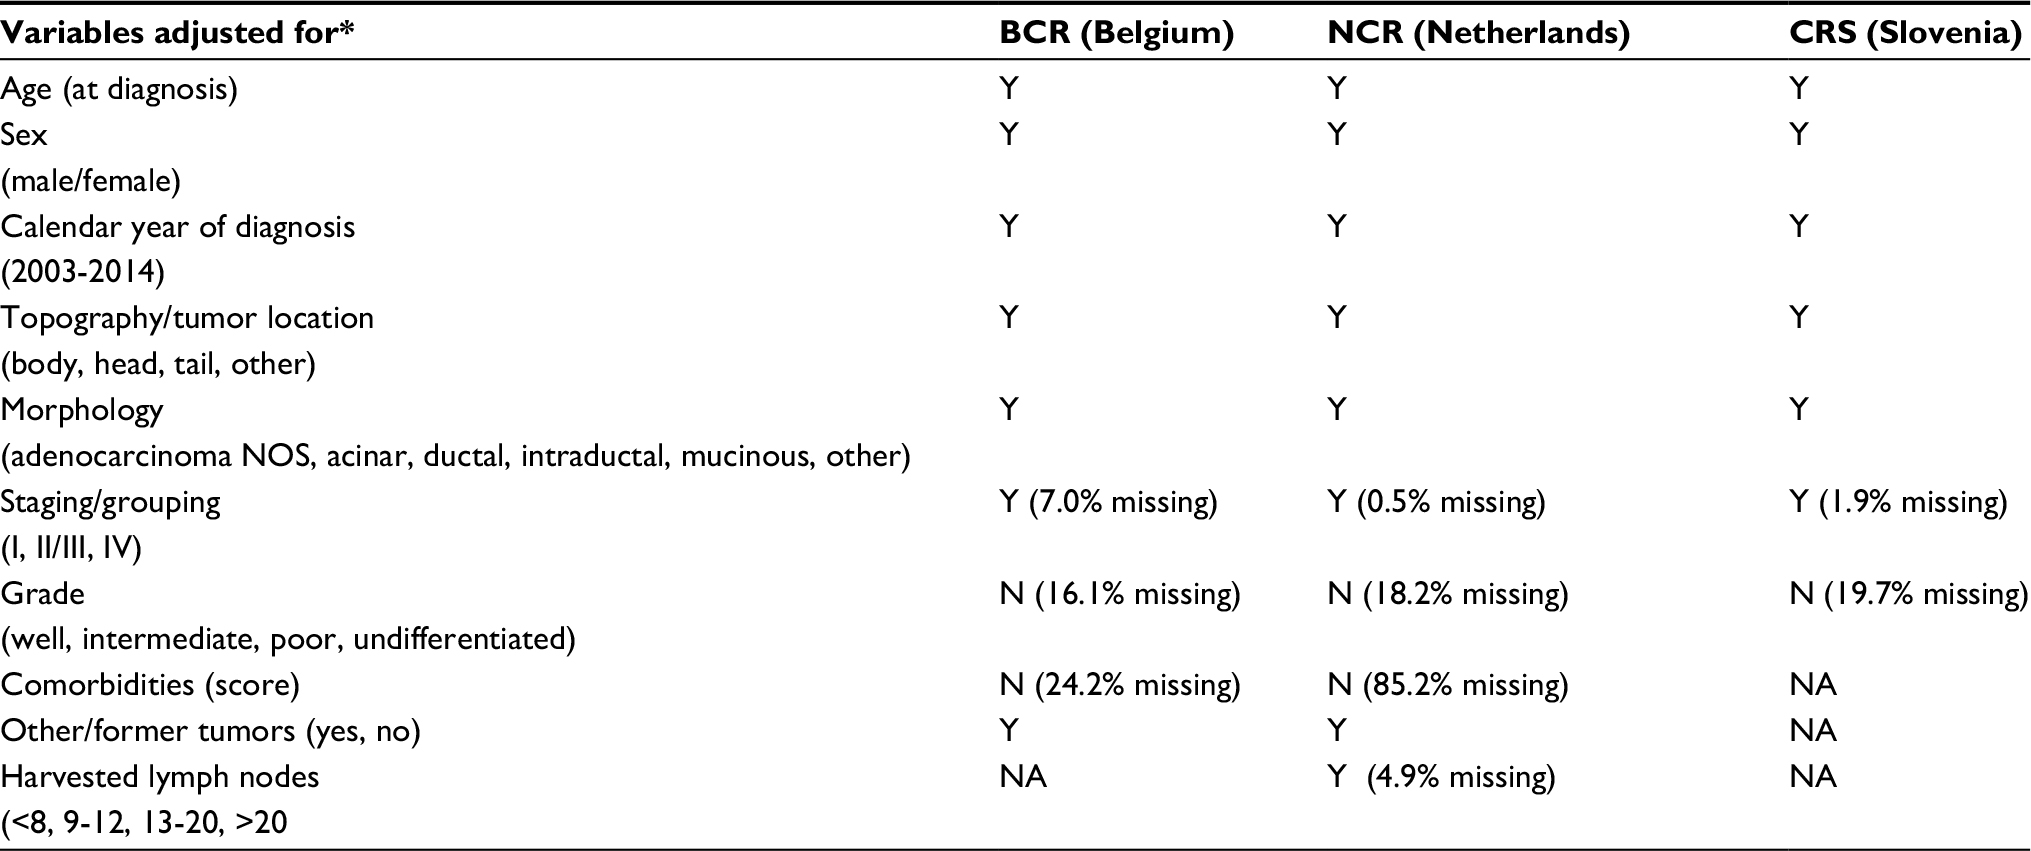 | Table S1 Availability of confounders and important prognostic factors to adjust for in multivariable Cox proportional hazards regression (by country) Notes: *Defined a-priori. Y: adjusted for; patients with missing values were excluded from analysis. N: not available or not adjusted for due to too many missing values. Abbreviations: BCR, Belgium Cancer Registry; CRS, Cancer Registry of Slovenia; NCR, Netherlands Cancer Registry; NOS, not otherwise specified; NA, not available. |
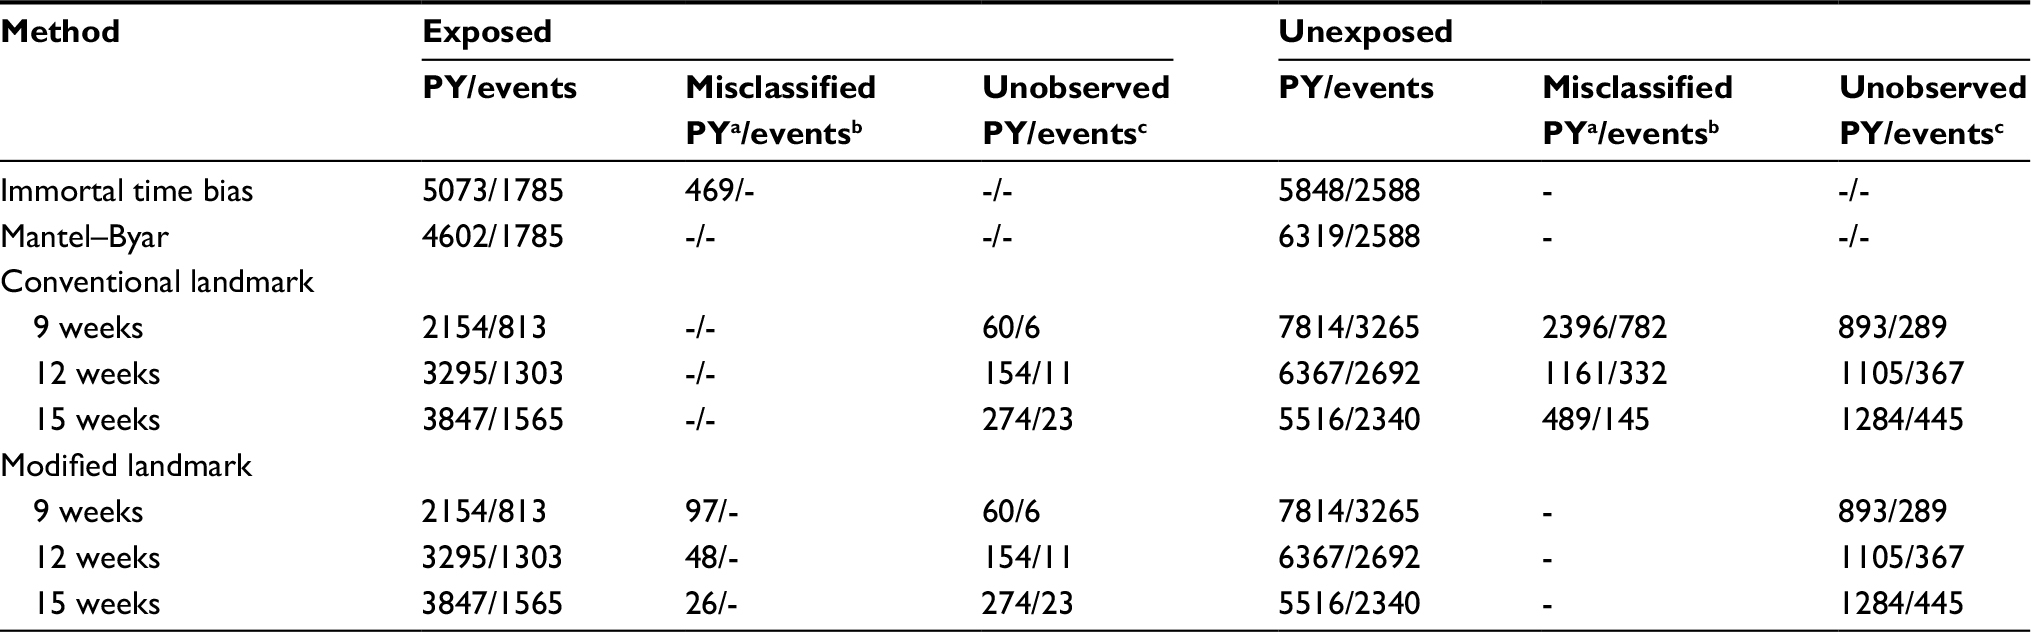 | Table S2 Quantification of potential unobserved and misclassified person-times and events through different analytical approaches. Notes: PY=person-years, aMisclassified (un)exposed person-years were calculated for the exposed person-years that were misclassified as exposed (immortal time bias analysis), or as the unexposed person-years that were misclassified as unexposed between start of chemotherapy and end of follow-up (conventional landmark analysis), or as the person-years that were misclassified as exposed between the landmark time and the actual start of chemotherapy (modified landmark analysis), bMisclassified events were defined as events that occurred during a period of follow-up time where patients were misclassified as unexposed (conventional landmark analysis), cUnobserved person-years/events were calculated as the (un)exposed person-times/events before the respective landmark time (including those patients who deceased before the landmark time). |
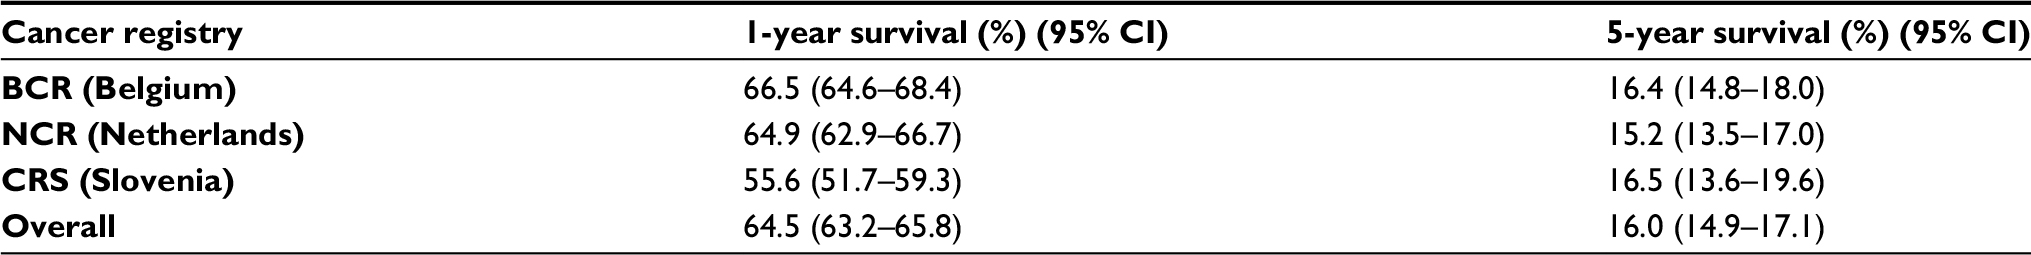 | Table S3 Crude 1- and 5-year survival rates for all resected PaC patients by country, and overall Abbreviations: CI, Confidence interval; PaC, Pancreatic cancer; BCR, Belgium Cancer Registry; CRS, Cancer Registry of Slovenia; NCR, Netherlands Cancer Registry. |
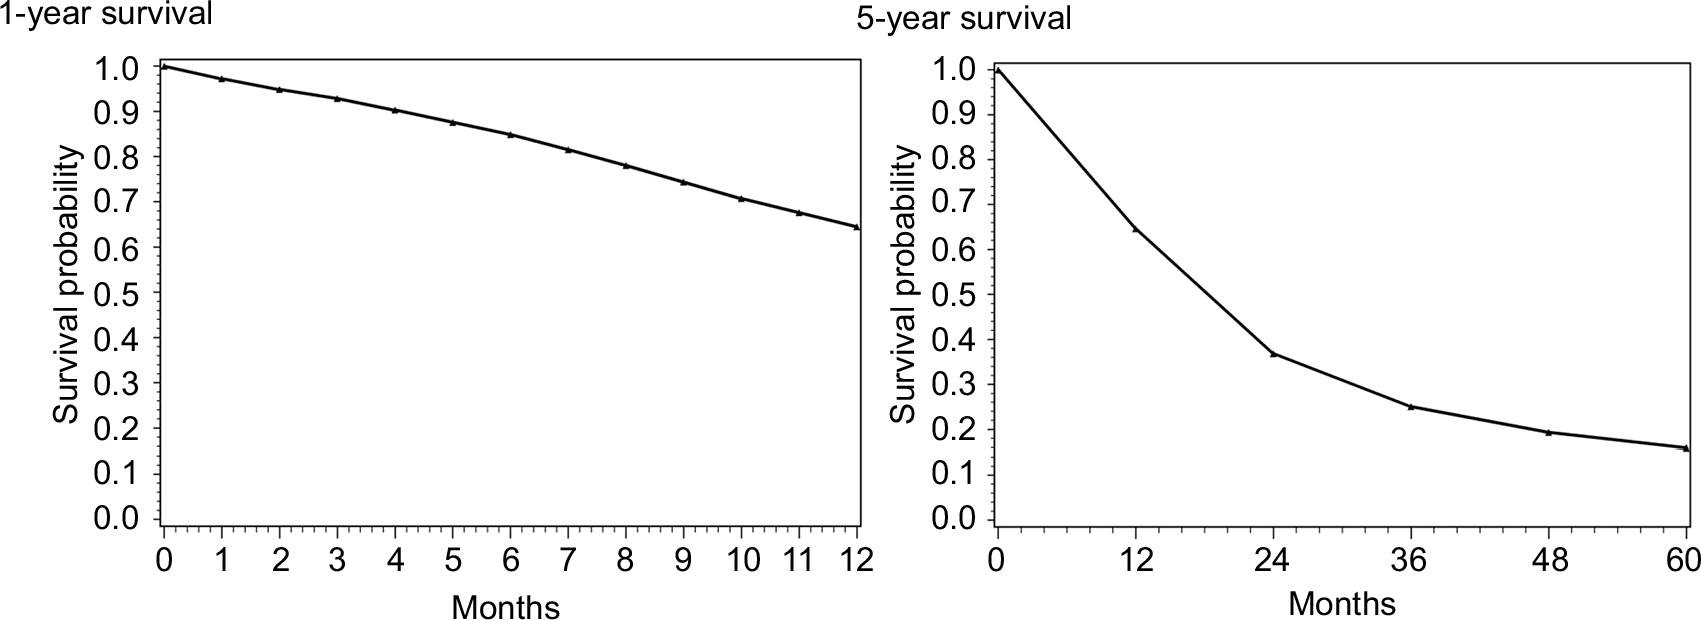 | Figure S3 Kaplan-Meier plots (life-table [acturial] method) for (crude) 1- and 5-year survival among all resected PaC patients. |
Simplified exemplary SAS code for different analytical approaches including conventional landmark approach (A1), modified landmark approach (A2) and time-dependent Mantel–Byar analysis (A3)
/*Documentation exemplary dataset (“cohort”): */
/*The exemplary dataset of resected pancreatic cancer patients with all variables is called “cohort”*/
/*fu_time=follow-up time (in weeks)*/
/*death=event indicator (1=death, 0=censoring)*/
/*t_cx=time from diagnosis to adjuvant chemotherapy start*/
/*start_cx=week of follow-up, in which adjuvant chemotherapy was initiated*/
/*stop_cx=week of follow-up, in which adjuvant chemotherapy was terminated (in this study end of follow-up since the exposure was modeled according to a first-treatment-carried-forward (intention-to-treat) analysis*/
/*cht=chemotherapy (1=yes, 0=no)*/
/*age=age (continuous)*/
/*sex=sex (male, female)*/
/*diag_year=year of diagnosis*/
/*loc=location of tumor (head, body, tail, other)*/
/*hist=histology (adenocarcinoma, ductal, etc.)*/
/*staging=stage at diagnosis (I, II/III, IV)*/
A1. Conventional landmark approach
/*Conventional landmark approach - cut-off time 1 (9 weeks)*/
data conv_landmark1_cohort;
set cohort;
if start_cx ne . and start_cx < 9 then cht=1; else cht=0;
if fu_time < 9 then delete;
fu_time1=fu_time-9;
run;
proc phreg data= conv_landmark1_cohort;
class sex diag_year loc hist staging cht(ref=”0”);
model fu_time1*death(0) = age sex diag_year loc hist staging cht/ ties=efron rl;
run;
/* Conventional landmark approach - cut-off time 2 (12 weeks)*/
data conv_landmark2_cohort;
set cohort;
if start_cx ne . and start_cx < 12 then cht=1; else cht=0;
if fu_time < 12 then delete;
fu_time2=fu_time-12;
run;
proc phreg data= conv_landmark2_cohort;
class sex diag_year loc hist staging cht(ref=”0”);
model fu_time2*death(0) = age sex diag_year loc hist staging cht/ ties=efron rl;
run;
/* Conventional landmark approach - cut-off time 3 (15 weeks)*/
data conv_landmark3_cohort;
set cohort;
if start_cx ne . and start_cx < 15 then cht=1; else cht=0;
if fu_time < 15 then delete;
fu_time3=fu_time-15;
run;
proc phreg data= conv_landmark3_cohort;
class sex diag_year loc hist staging cht(ref=”0”);
model fu_time3*death(0) = age sex diag_year loc hist staging cht/ ties=efron rl;
run;
A2. Modified landmark approach
/*Modified landmark approach - cut-off time 1 (9 weeks)*/
data mod_landmark1_cohort;
set cohort;
if fu_time < 9 then delete;
fu_time1=fu_time-9;
run;
proc phreg data= mod_landmark1_cohort;
class sex diag_year loc hist staging cht(ref=”0”);
model fu_time1*death(0) = age sex diag_year loc hist staging cht/ ties=efron rl;
run;
/*Modified landmark approach - cut-off time 2 (12 weeks)*/
data mod_landmark2_cohort;
set cohort;
if fu_time < 12 then delete;
fu_time2=fu_time-12;
run;
proc phreg data= mod_landmark2_cohort;
class sex diag_year loc hist staging cht(ref=”0”);
model fu_time2*death(0) = age sex diag_year loc hist staging cht/ ties=efron rl;
run;
/*Modified landmark approach - cut-off time 3 (15 weeks)*/
data mod_landmark3_cohort;
set cohort;
if fu_time < 15 then delete;
fu_time3=fu_time-15;
run;
proc phreg data= mod_landmark3_cohort;
class sex diag_year loc hist staging cht(ref=”0”);
model fu_time3*death(0) = age sex diag_year loc hist staging cht/ ties=efron rl;
run;
For the Mantel–Byar analysis there are several approaches in SAS which lead to the same results as long as the variable for the follow-up time is expressed in the same unit and rounded the same way (e.g., in weeks). If one wants to learn more, the following resources are recommended for further reading:
Allison, P. D. (2010). Survival Analysis Using SAS: A Practical Guide: Sas Inst.
Powell T, Bagnell M. Your “Survival” Guide to Using Time‐Dependent Covariates. SAS Global Forum 2012 2012.
A3.1. Time-dependent Mantel–Byar analysis (programming statement approach)
proc phreg data= cohort;
class sex diag_year loc hist staging;
model fu_time*death(0) = age sex diag_year loc hist staging ACT / ties=efron rl;
if cht = 1 and fu_time >= start_cx then ACT=1; else ACT=0 ;
run;
A3.2. Time-dependent Mantel–Byar analysis (array approach)
/*Using the Mantel–Byar array approach some preliminary work has to be performed first*/
/*Let’s assume the longest follow-up for a patient in our dataset “cohort” is 686 weeks*/
*Compute maximum follow-up time to create time intervals;
title “Average/Median time from diagnosis to death/end of fu (in weeks)”;
proc means data=cohort N MEAN MIN MAX MEDIAN Q1 Q3 QRANGE NMISS;
var fu_time;
run;
title;
/*Let’s assume the maximum follow-up was 686 weeks => create 686 (yes/no) variables indicating exposure for each week*/
*Compute statistics for time to adjuvant chemotherapy initiation (optional);
title “Average/Median time from diagnosis to Cx initiation of fu (in weeks)”;
proc means data=cohort N MEAN MIN MAX MEDIAN Q1 Q3 QRANGE NMISS;
var t_cx;
run;
title;
/*Prepare time-dependent variables and initially set all to 0*/
%macro dx_vars(intv);
data cohort;
set cohort;
Cx_t&intv.=0; /*Cx_t&intv. Indicates exposure in each week for every patient for the whole follow-up*/
run;
%mend;
%macro loop_intake();
%do i = 0 %to 686; /*MAX FU was 686 weeks*/
%dx_vars(&i.);
%end;
%mend;
%loop_intake();
/*Check plausibility!*/
data cohort;
set cohort;
if start_Cx ne . and stop_Cx ne . and start_Cx>stop_Cx then start_stop_error=”Yes”;
else start_stop_error=”No”;
label start_stop_error=”Start date after stop date (error)”;
run;
proc freq data= cohort;
table start_stop_error;
run;
/*Set all time intervals to 1 between start and stop date*/
%macro dx_vars(intv);
data cohort;
set cohort;
if start_Cx <= &intv. <= stop_Cx then Cx_t&intv.=1;
run;
%mend;
%macro loop_intake();
%do i = 0 %to 686;
%dx_vars(&i.);
%end;
%mend;
%loop_intake();
/*Now the actual analysis (Cox proportional hazards regression) can be performed*/
proc phreg data= cohort;
class sex diag_year loc hist staging;
model fu_time*death(0) = age sex diag_year loc hist staging cht Cx_time/ ties=efron rl;
array Cx_array(*) Cx_t0-Cx_t686;
Cx_time = Cx_array[fu_time];
run;
 © 2018 The Author(s). This work is published and licensed by Dove Medical Press Limited. The full terms of this license are available at https://www.dovepress.com/terms.php and incorporate the Creative Commons Attribution - Non Commercial (unported, v3.0) License.
By accessing the work you hereby accept the Terms. Non-commercial uses of the work are permitted without any further permission from Dove Medical Press Limited, provided the work is properly attributed. For permission for commercial use of this work, please see paragraphs 4.2 and 5 of our Terms.
© 2018 The Author(s). This work is published and licensed by Dove Medical Press Limited. The full terms of this license are available at https://www.dovepress.com/terms.php and incorporate the Creative Commons Attribution - Non Commercial (unported, v3.0) License.
By accessing the work you hereby accept the Terms. Non-commercial uses of the work are permitted without any further permission from Dove Medical Press Limited, provided the work is properly attributed. For permission for commercial use of this work, please see paragraphs 4.2 and 5 of our Terms.