")
Back to Journals » Clinical Ophthalmology » Volume 14
Comparative Analysis of Swept-Source Optical Coherence Tomography and Partial Coherence Interferometry Biometers in the Prediction of Cataract Surgery Refractive Outcomes
Authors Cummings AB , Naughton S , Coen AM , Brennan E , Kelly GE
Received 9 October 2020
Accepted for publication 15 November 2020
Published 2 December 2020 Volume 2020:14 Pages 4209—4220
DOI https://doi.org/10.2147/OPTH.S278589
Checked for plagiarism Yes
Review by Single anonymous peer review
Peer reviewer comments 2
Editor who approved publication: Dr Scott Fraser
Arthur B Cummings, Stephanie Naughton, Ann-Marie Coen, Elizabeth Brennan, Gabrielle E Kelly
The Wellington Eye Clinic, Dublin, D18 T8P3, Ireland
Correspondence: Arthur B Cummings
The Wellington Eye Clinic, Beacon Court, Level 2, Ste 36 Beacon Hall, Sandyford, Dublin, D18 T8P3, Ireland
Tel +353 1 2930470
Fax +353 1 293 5978
Email [email protected]
Purpose: To compare the accuracy of pre-operative corneal measurements obtained with four devices, and the refractive outcomes of two optical biometers.
Setting: Private practice.
Design: Retrospective.
Methods: Data taken from biometric measurements on 299 consecutive eyes prior to cataract surgery were retrospectively analyzed using the Argos SS-Optical Biometer and the Lenstar LS900 PCI optical biometer. As part of the standard cataract surgery pre-operative exam, patients also underwent placido disk topography and Scheimpflug tomography. Keratometry, anterior chamber depth, corneal diameter, pupil diameter, central corneal thickness and axial length were all measured. The comparable measurements were compared. Finally, for those eyes where cataract surgery was performed, the post-operative refractive results were compared to the predictive results of the two biometers.
Results: The SS-OCT Argos was able to measure all eyes, while five eyes could not be measured with the Lenstar LS900 PCI. Axial length measurements were performed only with the Argos and Lenstar devices. The eyes that could not be measured by the Lenstar LS900 PCI included dense grade IV nuclear sclerosis and large posterior subcapsular cataracts. In the primary endpoints, there was strong correlation between the Argos and the Lenstar devices in eyes with an axial length between 20 and 30 mm.
Conclusion: The predictive accuracies of the Argos Optical Biometer and Lenstar LS900 PCI are similar, except in medium and long eyes, in which the predictive accuracy of Argos SS-OCT biometry was higher. The Argos system was found easier to use by technicians when compared to the other biometry devices.
Keywords: comparative analysis, OCT, partial coherence interferometry biometers, cataract surgery, refractive outcomes
Introduction
Modern cataract surgery enables patients to rapidly recover and regain visual function. Good post-operative visual outcomes are dependent on work done pre-operatively to assess the patient’s eye including biometric measurements, such as axial length (AL) and anterior chamber depth (ACD).1 In particular, accurate axial length measurements are critical in calculating the correct intraocular lens (IOL) power and the tools for measuring axial length have undergone continuous evolution over the past nearly 20 years.2–8 Naturally, as new technology has been introduced to perform biometric measurements, comparisons have been conducted to evaluate accuracy.9–14 This includes the evolution from ultrasound biometry (UBM) to partial coherence interferometry (PCI),9,15 while more recently, swept-source optical coherence tomography (SS-OCT) has been introduced.
With a 1050–1060 nm wavelength, SS-OCT provides for better optical penetration than previous optical biometers with lower wavelengths, such as 780 nm with the IOLMaster 500 (Carl Zeiss Meditec AG, Jena, Germany) and the Lenstar LS900 (Haag-Streit AG, Koeniz, Switzerland) with an 820 nm wavelength. To date, three biometers are commercially available that employ swept-source OCT: the OA-2000 (Tomey Corp, Nagoya, Japan), the IOLMaster 700 (Carl Zeiss Meditec AG) and the Argos Optical Biometer (Movu Inc., Santa Clara, CA).
Previous studies have compared the Argos to the IOLMaster 500, as well as comparing the Argos, the OA-2000 and the IOLMaster 700 to the IOLMaster 500.8 These studies showed that SS-OCT yielded a higher degree of accuracy for measuring axial length.16
In this retrospective analysis, we compared the Argos Optical Biometer to biometric measurements obtained with the Lenstar LS900 PCI, pre-cataract surgery and then a comparison of post-operative refractive results versus the pre-operative predicted refractive result. In addition, because it is standard of care in our practice to routinely use topography and tomography in the pre-operative work-up, these corneal measurements have been included in the corneal data analysis and the results. This includes white-to-white measurements, pupil size, anterior chamber depth and corneal pachymetry.
Materials and Methods
Patients
This retrospective study enrolled consecutive patients who presented to the Wellington Eye Clinic, Dublin, Ireland between July 2017 and August 2018 for cataract assessment including biometry, topography and tomography. The clinic’s standard operating procedure requires that biometry be performed twice, with two different devices, the Lenstar LS900 PCI (Haag-Streit, Koeniz, Switzerland) and Argos SS-Optical Biometer (Movu Inc., Santa Clara, CA).
Both biometry instruments measure AL as the distance from the anterior corneal apex to the retinal pigment epithelium (RPE). The Lenstar LS900 PCI uses an infrared laser (820 nm) with 32 measurement points placed on two concentric rings of 16 points each on the cornea at 1.65 mm and 2.3 mm diameter. This data is used to calculate the toroidal anterior surface curvature. The Argos provides cross-sectional images on the anterior and posterior segments by using a swept-source OCT with a wavelength of 1060 ± 10 nm. The Argos uses 16 infrared light emitting diodes (LEDs) arranged in a 2.1mm diameter ring to capture keratometry. AL and ACD are calculated using the OCT image with 3 images captured per measurement.
The routine cataract workup also included the Topolyzer (WaveLight GmbH, Erlangen, Germany) and the Oculyzer (WaveLight GmbH, Erlangen).
Cataract Surgery
Two surgeons performed all cataract surgeries. Surgeries were performed using clear corneal incisions of 2.2 to 2.4 mm and continuous curvilinear capsulorhexis (CCC) to open the capsule, with an intended diameter of 4.5 to 5.1 mm. Surgeries were performed under topical anaesthesia (topical proxymetacaine) (Minims Proxymetacaine Hydrochloride 0.5% w/v, Bausch + Lomb, Rochester, NY) with intraocular Visthesia 1% viscoelastic (Sodium Hyaluronate & Lidocaine Hydrochloride, Carl Zeiss Meditec AG, Jena, Germany) as well as intravenous sedation where required. Phacoemulsification was performed using the Centurion Vision System (Alcon Laboratories, Ft Worth, TX) using settings specific to the type of cataract and surgeons’ preference. Following phacoemulsification, all patients underwent IOL implantation using a one-piece hydrophobic lens, either the Acrysof IQ IOL (Alcon Labs, Ft Worth, TX) or the EyeCee One IOL (Bausch+Lomb, Rochester, NY). No intraoperative complications occurred.
Measurements and Refractive Outcomes
Refractive outcomes were measured 6 weeks after cataract surgery using a phoropter with manual refraction. Predicted refraction was assessed using the formula deemed to be most suitable by the surgeon for the specific patient: Barrett-Universal True-K for post-refractive surgery eyes, Hoffer Q for short eyes (<22 mm) and SRK/T for longer (>26 mm) and normal length eyes (22 to 26 mm). Personal A-constants were used.
Adverse Events
No adverse events or device deficiencies were observed in this study.
Data Analyses
Summary statistics for measurements carried out on the four devices were computed. Devices were compared on available parameters using an F-test adjusted for the fact that observations made on the same eye are correlated. This was done using a mixed effects model with response variable of the parameter measurement, fixed effect type of device and an unstructured covariance matrix for observations within subjects. Plots of the distribution of the parameters (boxplots) for each device were used to assess non-normality. Then for each parameter, the difference for each eye between two devices was computed and the devices were then compared separately using a paired t-test or, in the case of skewed differences, the Wilcoxon signed rank test. Measurements between devices were said to agree if they were within a mean ± 2 standard deviations (SD) of the difference between device measurements.
Agreement between the different device measurements was further evaluated using Bland-Altman plots where the differences between the measurements (y-axis) are plotted against the mean (x-axis). The 95% limits of agreement were defined as a mean ± 1.96 SD of the differences between the two measurements techniques. Deming regression was used in conjunction with these plots that assumes both measurements are made with errors that have equal variances. The Pearson correlation coefficient for each parameter’s measurements on devices were also used to compare devices, or Spearman correlation coefficient in the case of skewed data.
The eyes were then stratified into three axial length groups using the Argos: short (<22 mm), normal (22 to 26 mm) and long (>26 mm).
All the analyses were repeated for each group separately.
Statistical analyses were performed using SAS/STAT® software (version 9.4, SAS Institute Inc., Cary, NC, USA) and statistical significance was defined as P < 0.05.
The primary endpoints to be compared were AL and corneal curvature (R1, R2), while the secondary endpoints that were analyzed were central corneal thickness (CCT), ACD, white-to-white (WTW), and pupil size. Finally, the tertiary endpoint was a comparison of the pre-operative predictive accuracy of the refractive outcome with the post-operative result.
Two-hundred and ninety-nine eyes were included in the analysis with all undergoing measurements with the four devices.
This retrospective study adhered to the tenets of the Declaration of Helsinki and ICH-GCP. As part of ongoing assessment of clinical outcomes at the site, each patient consented to have their anonymised data used for analysis, clinical audits, publications and presentations. As per local regulations, ethics committee approval was not required for this retrospective analysis.
Results
The SS-OCT Argos was able to obtain measurements in all eyes, while five eyes could not be measured with the Lenstar LS900 PCI. AL measurements were performed only with the Argos and Lenstar devices. The eyes that could not be measured by the Lenstar LS900 PCI included dense grade IV nuclear sclerosis and large posterior subcapsular cataracts. Placido disk topography and Scheimpflug tomography data could be obtained on all 299 eyes.
All four methods were compared on the variables R1, R2 and pupil diameter. This was done in each case using an F-test adjusted for the fact that observations made on the same eye are correlated.
For most variables measured including AL, R1, R2, pupil diameter, CCT, ACD, WTW, and lens thickness (LT), the mean differences on the studies for which they were measured were all statistically significant from zero.
Primary Endpoints: Axial Length Assessment
AL was assessed using the Argos and Lenstar systems and showed that there was a very high correlation between the Argos SS-OCT and the Lenstar LS900 PCI with a 0.9863 correlation coefficient and the Deming plot showed good agreement (Figure 1). There was strong correlation between the two devices in eyes with an AL between 20 and 30 mm. The Argos displayed a tendency to measure long eyes a fraction shorter while the short eyes measured a fraction longer than the LS900 PCI biometer.
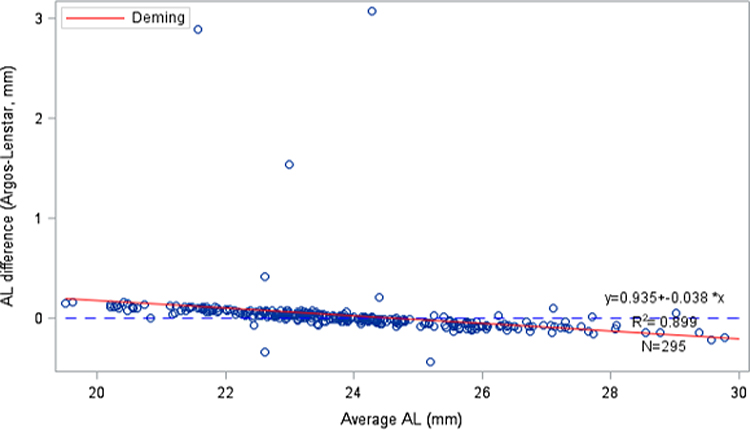 |
Figure 1 Bland-Altman plot of AL for the Lenstar and Argos devices. Horizontal axis is the average of the two device readings in each eye while the vertical axis is the difference in measurements between the devices. Deming regression assumed the variance in measurement difference is four times larger than that in measurement average. Regression line parameters are shown in the bottom right of the graph. |
Table 1 compares the mean, SD, median, minimum and maximum of AL measurements obtained by the Argos and Lenstar systems, demonstrating little difference in the axial lengths obtained, while Figure 2 shows the distribution of AL measurements obtained with the two devices.
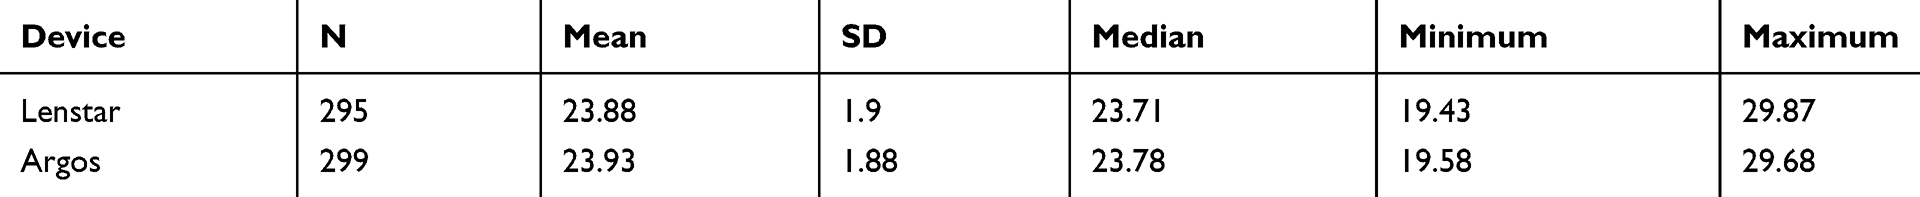 |
Table 1 Comparison of Axial Length Measurements |
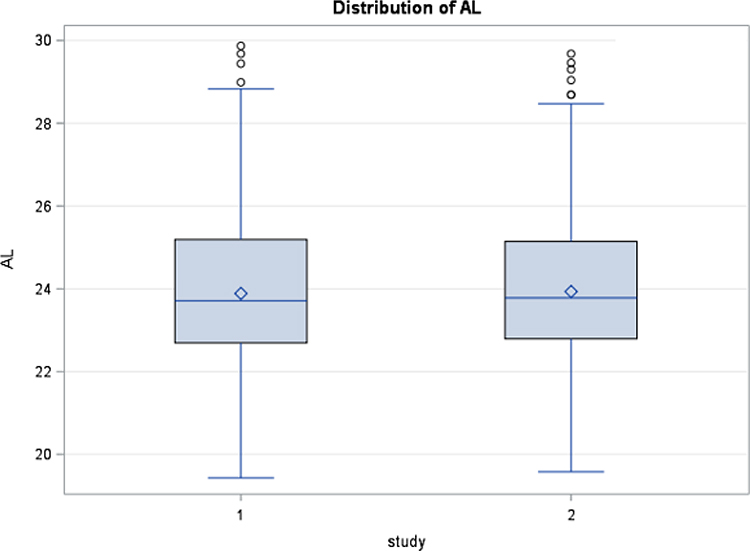 |
Figure 2 Boxplots of axial length (AL) for Lenstar and Argos (1=Lenstar, 2=Argos). Median AL difference between devices=0.0. Wilcoxon signed rank test p-value=0.4797. Spearman correlation coefficient 0.9884 (p<0.0001). |
Table 2 shows the breakdown of eyes stratified into three groups: Long, medium and short, showing that the majority of eyes were of an average axial length.
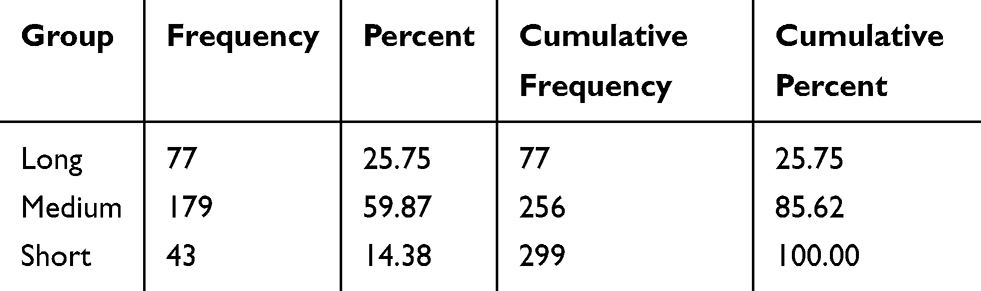 |
Table 2 Eyes Stratified by Group: Short, Normal and Long Eyes Using the Argos |
In long eyes, the Lenstar vs Argos median difference was 0.08, Wilcoxon signed rank with a p-value of <0.0001. Spearman correlation coefficient was 0.9863 (p<0.0001). In medium length eyes the median difference was −0.01, Wilcoxon signed rank with a p-value of =0.0001. Spearman correlation coefficient was 0.9853 (p<0.0001). In short eyes, the median difference was −0.10, Wilcoxon signed rank with a p-value of <0.0001, Spearman correlation coefficient was 0.9986 (p<0.0001).
Corneal Curvature
All four devices were used to compare corneal curvature measurements (R1, R2). This was done in each case using an F-test adjusted for the fact that observations made on the same eye are correlated. The devices were then compared separately using a paired t-test or in the case of skewed differences, the Wilcoxon signed rank test. Figures 3 and 4 show boxplots for R1 and R2 results. The p-value for the F-test was 0.3216 (>0.05). However, we see from Figure 3 that the data is skewed to the right so this result needs to be interpreted with caution. The Topolyzer was less variable than the other devices.
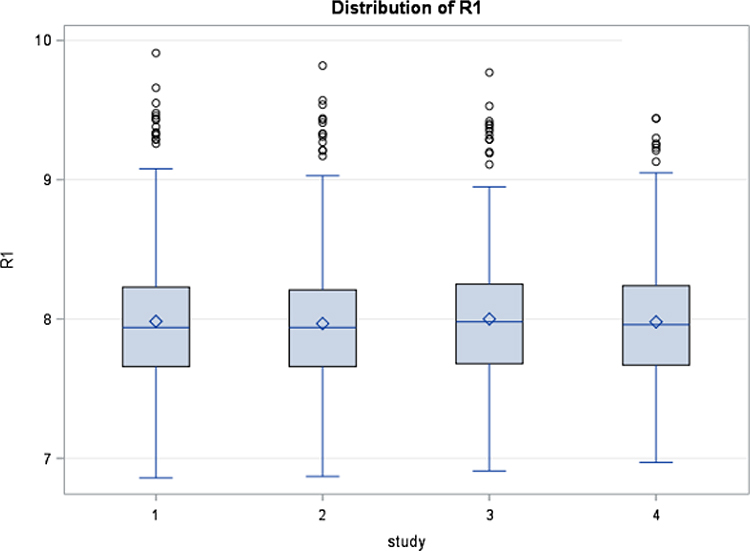 |
Figure 3 Boxplots of corneal curvature (R1) demonstrating distribution of results for each system with 1=Lenstar, 2=Argos, 3=Oculyzer and 4=Topolyzer. The p-value for the F-test comparing all 4 biometers was 0.3216 (>0.05). |
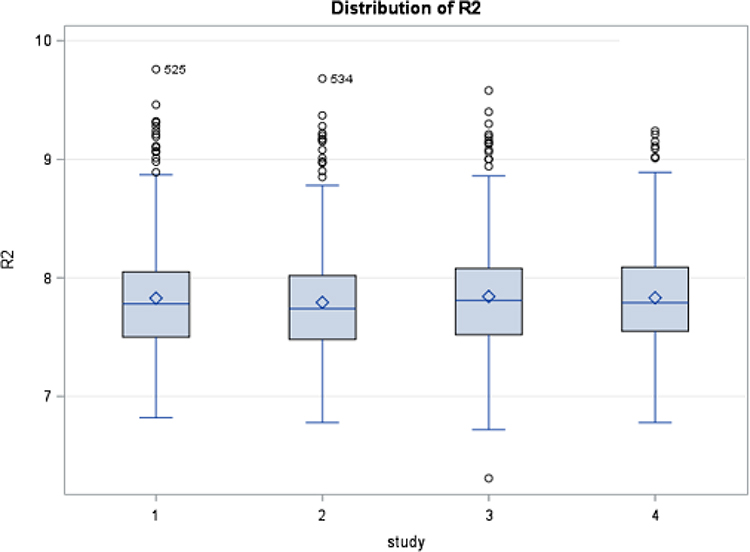 |
Figure 4 Boxplot of corneal curvature (R2) demonstrating distribution of results for each system with 1=Lenstar, 2=Argos, 3= Oculyzer and 4=Topolyzer. The p-value for the F-test comparing all 4 biometers was 0.0037 (<0.05). |
When comparing the corneal curvature results between the types of devices and the length of eyes grouping, the R1 results. Further, differences between the devices were not the same across groups (p<0.0001). Tables 3, 4, and 5 show the results between devices in long eyes, medium eyes and short eyes using a Wilcoxon signed rank test or paired t-test.
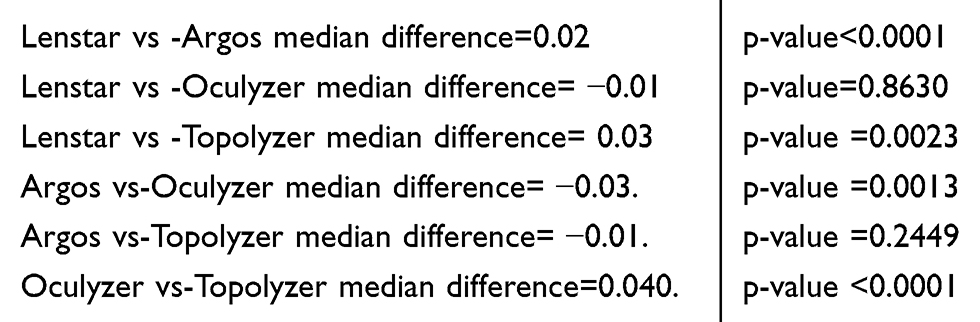 |
Table 3 Long Eyes. In These Eyes, the Results Were Compared Separately Using a Paired t-Test or in the Case of Skewed Data, the Wilcoxon Signed Rank Test |
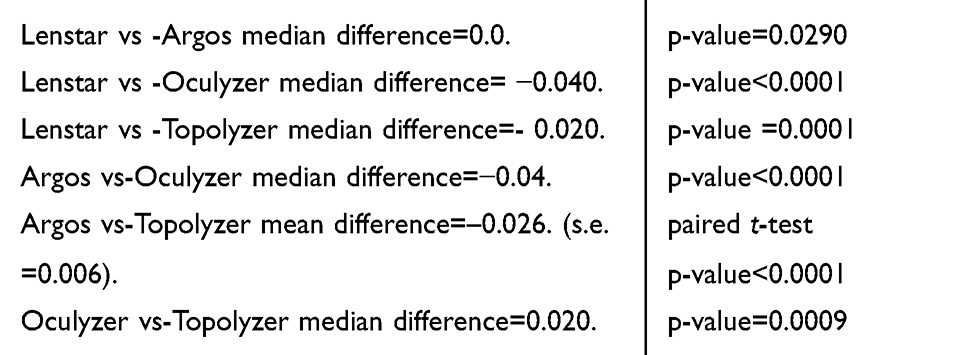 |
Table 4 Medium Eyes. In These Eyes, the Results Were Compared Separately Using a Paired t-Test or in the Case of Skewed Data, the Wilcoxon Signed Rank Test |
Secondary Endpoints
Central Corneal Thickness/Anterior Chamber Depth
Three devices were compared for assessment of central corneal thickness (CCT) and anterior chamber depth (ACD): the Lenstar, Argos and Oculyzer results were compared using an F-test adjusted for the fact that observations made on the same eye were correlated.
Figure 5 boxplot shows the distribution of results between 1 – Lenstar, 2 – Argos and 3 – Oculyzer. The p-value of <0.0001 indicates a difference in results between the three systems. The devices were then compared separately using a paired t-test or in the case of skewed data the Wilcoxon signed rank test. The Lenstar vs Argos median difference was 9.0, Wilcoxon signed rank test p-value < 0.0001; the Lenstar vs Oculyzer median difference was −8.0, Wilcoxon signed rank test p-value < 0.0001; and, the Argos vs Oculyzer mean difference was −17.1171 (s.e.=0.6204), paired t-test p-value<0.0001.
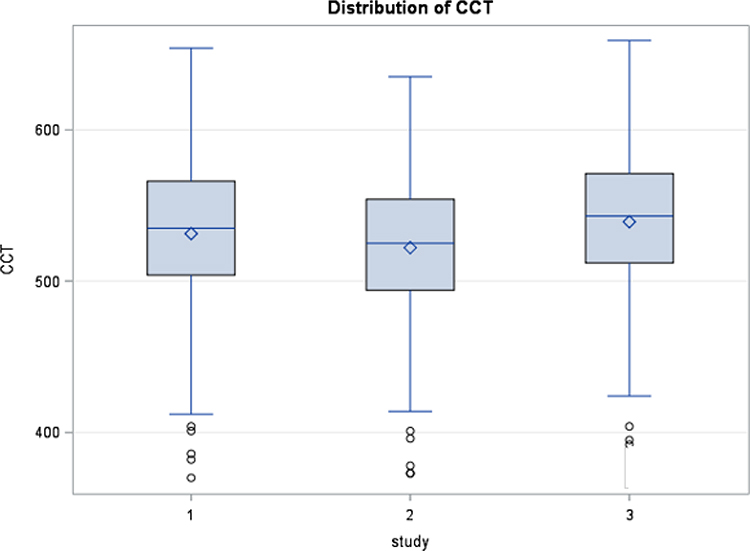 |
Figure 5 Boxplots of central corneal thickness (CCT) demonstrating distribution of results for each system with 1=Lenstar, 2=Argos and 3= Oculyzer. The p-value for the F-test comparing all 3 biometers was <0.0001. |
Anterior Chamber Depth
Similarly, there were differences seen between the three measurement methods when comparing ACD results, with a p-value for the F-test of <0.0001 (Figure 6). The results were then compared separately using a paired t-test or in the case of skewed data, the Wilcoxon signed rank test: The Lenstar vs Argos median difference was −0.09, Wilcoxon signed rank test p-value of <0.0001; the Lenstar vs Oculyzer median difference was 0.07, Wilcoxon signed rank test p-value of < 0.0001; and, the Argos vs Oculyzer median difference was 0.14, Wilcoxon signed rank test p-value of < 0.0001.
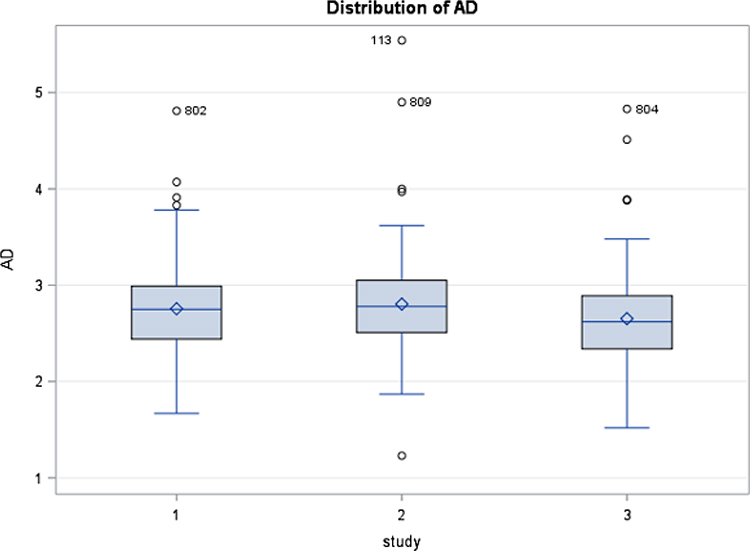 |
Figure 6 Boxplots of anterior chamber depth (ACD) demonstrating distribution of results for each system with 1=Lenstar, 2=Argos and 3=Oculyzer. The p-value for the F-test comparing all 3 biometers was <0.0001. |
Anterior chamber depth between Oculyzer, Argos SS-OCT and Lenstar LS900 PCI also correlated very well (Table 6).
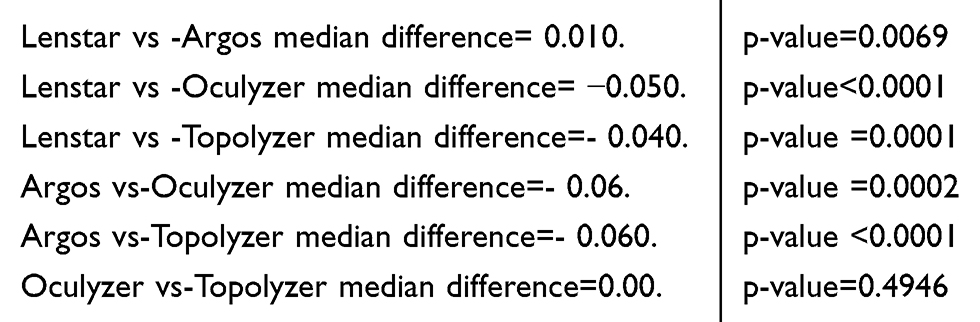 |
Table 5 Short Eyes. In These Eyes, the Results Were Compared Separately Using a Paired t-Test or in the Case of Skewed Data, the Wilcoxon Signed Rank Test |
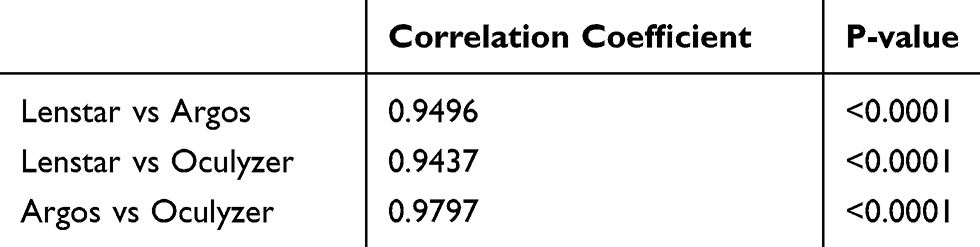 |
Table 6 Anterior Chamber Depth Correlation Coefficients |
White-to-White
As with CCT and ACD, there was a difference in results between the three systems with a p-value of <0.0001 (Figure 7). The results were then compared separately using a paired t-test or in the case of skewed data, the Wilcoxon signed rank test. In comparing the Lenstar vs Argos results, the mean difference was −0.363 (s.e.=0.033), paired t- test p-value < 0.0001; The median difference between the Lenstar and Topolyzer was 0.41, Wilcoxon signed rank test p-value of < 0.0001; and, for Argos vs Topolyzer, the mean difference was 0.749 (s.e.=0.0311), paired t-test p-value < 0.0001.
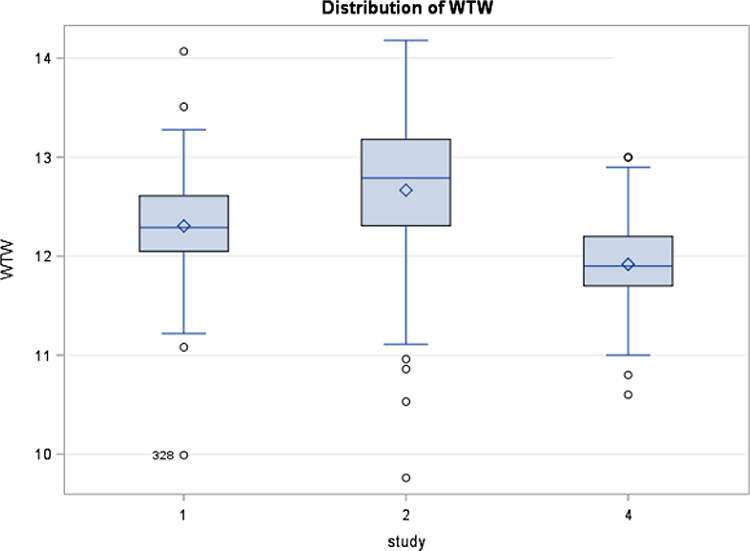 |
Figure 7 Boxplots of white-to-white (WTW) demonstrating distribution of results for each system with 1=Lenstar, 2=Argos and 4=Topolyzer. The p-value for the F-test comparing all 3 biometers was <0.0001. |
Pupil Size
Overall pupil diameter values differed by device (p<0.0001), as well as by axial length groups (p=0.0026). Again here, the differences between studies were not the same across axial length groups (Figure 8).
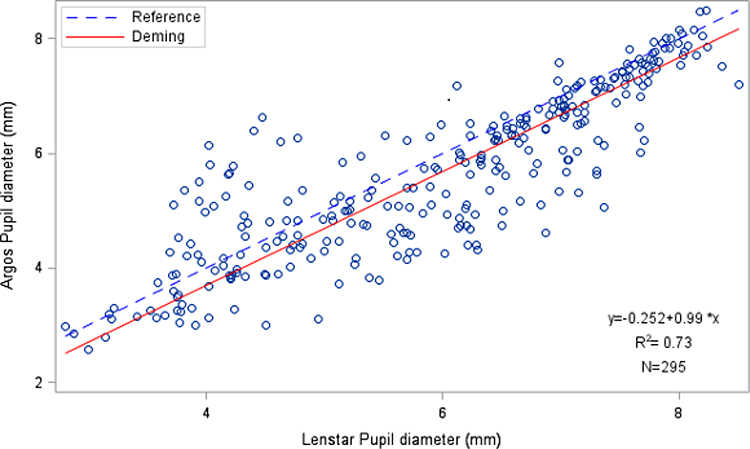 |
Figure 8 Scatter plot showing excellent correspondence between pupil size as measured with Argos and Lenstar. Deming regression assumed that both measurements are made with errors that have equal variances. Regression line parameters are shown in the bottom right of the graph. The correlation is 0.86 with the Argos consistently measuring the pupil slightly smaller. This has no clinical significance. |
In long eyes, the Lenstar vs Argos mean difference was 0.316 (s.e.=0.095), paired t-test p-value =0.0013; the Lenstar vs Oculyzer mean difference was 3.269 (s.e.=0.152), paired t-test p-value <0.0001; the Lenstar vs Topolyzer mean difference was 3.448 (s.e.=0.147), paired t-test p-value <0.0001; the Argos vs Oculyzer mean difference was 2.898 (s.e.=0.164), paired t-test p-value <0.0001; the Argos vs Topolyzer mean difference was 3.073 (s.e.=0.151), paired t-test p-value <0.0001; and, the Oculyzer vs Topolyzer median difference was 0.08, Wilcoxon signed rank test p-value =0.0009.
In normal eyes, Lenstar vs -Argos mean difference= 0.324 (s.e.-.053) paired t- test p-value <0.0001; Lenstar vs -Oculyzer mean difference= 2.942 (s.e.=0.099) paired t-test p-value <0.0001; Lenstar vs -Topolyzer mean difference= 3.022 (s.e.=0.104) paired t-test p-value <0.0001; Argos vs-Oculyzer mean difference= 2.625 (s.e.=0.104) paired t-test p-value <0.0001; Argos vs-Topolyzer mean difference= 2.703 (s.e.=0.103) paired t-test p-value <0.0001 and the Oculyzer vs-Topolyzer median difference=0.110 Wilcoxon signed rank test p-value =0.0124.
In short eyes, Lenstar vs -Argos mean difference= 0.270 (s.e.=0.114) paired t-test p-value =0.0224; Lenstar vs -Oculyzer mean difference= 2.08 (s.e.=0.226) paired t-test p-value <0.0001; Lenstar vs -Topolyzer mean difference= 2.633 (s.e.=0.226) paired t-test p-value <0.0001; Argos vs-Oculyzer mean difference= 1.969 (s.e.=0.227) paired t-test p-value <0.0001; Argos vs-Topolyzer mean difference= 2.383 (s.e.=0.223) paired t-test p-value <0.0001, and; the Oculyzer vs-Topolyzer median difference= 0.36 Wilcoxon signed rank test p-value <0.0001.
Tertiary Endpoints
In the 94 cases where IOL refractive outcomes were available postoperatively, the Argos SS-OCT biometer provided better outcomes when comparing the predictive refractive outcome with a specific power IOL and the actual refractive outcome obtained at 6 weeks postoperative with that same IOL. Of these, 45 eyes were previously untreated hence the measured biometry was used to predict the IOL power directly using the most appropriate formula (the same for both biometers) to predict the IOL power. Of these 45 eyes, 25 were closer to the actual outcome using the Argos and 19 were closer to the actual outcome using the Lenstar. In 1 eye the outcome was identical (Table 7). The other 49 eyes were post-refractive surgery eyes and the measurements were not used directly but rather inputted into the Barrett True-K formula. Because the data were not processed on the device itself, it was not included for analysis. Outcomes were similar however with the Argos enjoying slightly more predictability than the Lenstar.
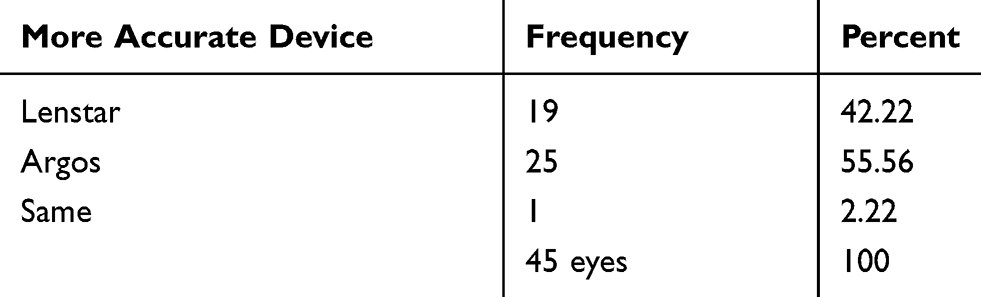 |
Table 7 Device Accuracy |
Further analysis of the refractive outcomes found that the mean and SD of the absolute error from target values for these 45 eyes were 0.239 ± 0.160D for the Lenstar and 0.244 ± 0.247D for the Argos (Figure 9).
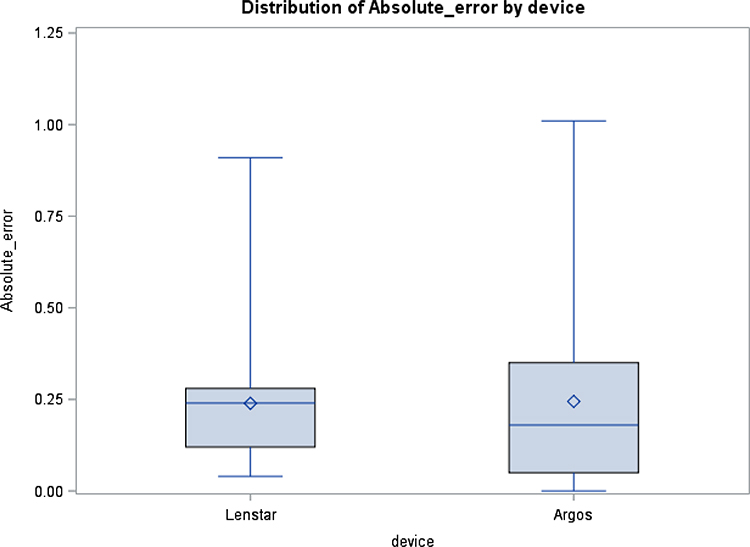 |
Figure 9 Box-Plots of absolute error from the target value for devices Lenstar and Argos. |
Discussion
To the best of our knowledge, this is the first study to evaluate the Argos SS-OCT optical biometer compared to the Lenstar LS900 PCI optical biometer for axial length (AL) and corneal curvature (K). Secondary endpoints of central corneal thickness, anterior chamber depth, lens thickness, WTW and pupil size were compared between Lenstar LS900 PCI and Argos SS-OCT as well as Pentacam tomography and Topography where data was obtainable. Tertiary end points include accuracy and repeatability of the devices.
In this retrospective analysis, 299 eyes were measured, and all could be measured by the Argos SS-OCT. Five eyes could not be measured by the Lenstar LS900 PCI and an IOL power could not be predicted in these cases. In the 94 cases where IOL refractive outcomes were available postoperatively, the Argos SS-OCT provided better outcomes when comparing the predictive refractive outcome with a specific power IOL and the actual refractive outcome obtained at 6 weeks postoperative with that same IOL.
Pupil size was measured with the four devices and showed good correlation between the biometers and good correlation between placido disk topography and Scheimpflug tomography. This is likely because the eye is illuminated during the capture of the placido disk topography and Scheimpflug tomography images, constricting the pupil while the biometry measurements are performed without visible light and hence no pupil constriction.
Optical distance is converted to geometrical distance by biometers. The medium’s refractive index determines the degree of conversion. A single refractive index of 1.3549 is used by the PCI across all media. In contrast, the Argos SS-OCT uses individual refractive indices of 1.376 for the cornea, 1.336 for the aqueous and vitreous, and 1.410 for a cataract.
AL measurement differences are probably due to this difference in application of the refractive indices.
AL increases resulted in shorter AL measurements when measured by the Argos SS-OCT relative to measurements obtained by PCI. This finding concurs with the results published in Higashiyama et al8 Conversely, a previous study found no significant difference between IOLMaster 700 and Argos SS-OCT AL measurements even though the IOL Master 700's AL measurement uses a single composite refractive index.
During data analysis devices were compared on available parameters using an F-test adjusted for the fact that observations made on the same eye are correlated. However, this was not valid in some instances as the data were not normally distributed or variances of the devices were unequal. In these cases pairwise comparisons were possible using nonparametric methods.
Differences between optical biometer AL measurements can significantly affect refractive outcomes. For example, with the SRK/T formula, the AL is multiplied by 2.5 and deducted from the A-constant to provide the IOL power required while the keratometry readings are averaged and then multiplied by 0.9, thereby effectively reducing keratometry errors on IOL power. The AL error is magnified 2.5x if it exists. IOL calculations using Argos SS-OCT measurements resulted in hyperopia in short eyes and myopia in long eyes postoperatively. When the calculations were performed with the Haigis formula, the opposite occurred. This may be due to the number of IOL constants. Current IOL formulae have been retrospectively corrected and enhanced based on the postoperative measurements and results. It is plausible that these findings may be as a result of these retrospective applications. In medium-long eyes, the Argos SS-OCT predictive accuracy was significantly higher than PCI predictive accuracy.
The Argos SS-OCT uses a longer wavelength (1060 nm) than Lenstar LS900 PCI (820 nm). This allows the SS-OCT to obtain deeper images than PCI and, possibly, across lens opacities such as cataract. Shammas et al detailed that AL was successfully measured in 96% and 77% of eyes with a cataract using SS-OCT and PCI, respectively.10
Second, lens thickness was not considered in IOL power calculations. The Barret-Universal II formula requires optional biometric measurements to predict IOL power. As PCI does measure lens thickness, target residual refractions were calculated using only essential biometry measurements.
Future studies should assess the impact of including optional biometry measures (eg, lens thickness and corneal diameter) on predictive accuracy. Third, we did not compare IOL calculation formulas or sequencing IOL formulas for accuracy. The primary objective of this study was to compare measurement accuracy of axial length (AL) and corneal curvature (K). Secondary endpoints included central corneal thickness (CCT), anterior chamber depth (ACD), lens thickness (LT), white-to-white measurements (WTW) and pupil size. Tertiary endpoints captured accuracy and repeatability. The study aimed to study predictive accuracy between two optical biometers and not to compare IOL calculation formula accuracy of AL and K.
Conclusion
The predictive accuracies of the Argos SS-OCT and Lenstar LS900 PCI optical biometers are very similar, except for in medium and long eyes, in which the predictive accuracy of Argos SS-OCT biometry was higher. The Argos SS-OCT was found easier to use by the ophthalmic technicians when compared to the Lenstar LS900 PCI and the IOLMaster 500.
Disclosure
Arthur B Cummings reports that this was an IIT (Investigator Initiated Trial) that Alcon funded; and he is study PI for Allotex, on the MABs of Vivior, TearClear, TearLab, and Scope, outside the submitted work. The authors report no other conflicts of interest for this work.
References
1. Rajan MS, Keilhorn I, Bell JA. Partial coherence laser interferometry vs conventional ultrasound biometry in intraocular lens power calculations. Eye. 2002;16(5):552–556. doi:10.1038/sj.eye.6700157
2. Raymond S, Favilla I, Santamaria L. Comparing ultrasound biometry with partial coherence interferometry for intraocular lens power calculations: a randomized study. Invest Ophthalmol Vis Sci. 2009;50:2547–2552. doi:10.1167/iovs.08-3087
3. Binkhorst RD. The accuracy of ultrasonic measurement of the axial length of the eye. Ophthalmic Surg. 1981;12:363–365.
4. Wolfgang D. Partial coherence interferometry: a novel approach to biometry in cataract surgery. Am J Ophthalmol. 1998;126(4):524–534. doi:10.1016/S0002-9394(98)00113-5
5. Omoto MK, Torii H, Masui S, et al. Ocular biometry and refractive outcomes using two swept-source optical coherence tomography-based biometers with segmental or equivalent refractive indices. Sci Rep. 2019;9:6557. doi:10.1038/s41598-019-42968-3
6. Huang J, Chen H, Li Y, et al. Comprehensive comparison of axial length measurement with three swept-source OCT-based biometers and partial coherence interferometry. J Refract Surg. 2019;35(2):115–120
7. Hussaindeen J, Mariam E, Arunachalam S, et al. Comparison of axial length using a new swept-source optical coherence tomography-based biometer – ARGOS with partial coherence interferometry-based biometer – iOLMaster among school children. PLoS One. 2018;13(12):e0209356. doi:10.1371/journal.pone.0209356
8. Higashiyama T, Mori H, Najajima F, et al. Comparison of a new biometer using swept-source optical coherence tomography and a conventional biometer using partial coherence interferometry. PLoS One. 2018;13(4):e0196401. doi:10.1371/journal.pone.0196401
9. Basu S. Comparison of IOL power calculations by the IOLMaster vs theoretical calculations. Eye. 2006;20:90–97. doi:10.1038/sj.eye.6701800
10. Shammas H, Ortiz S, Shammas M, Kim S, Chong C. Biometry measurements using a new large-coherence-length swept-source optical coherence tomographer. J Cataract Refract Surg. 2016;42(1):50–61. doi:10.1016/j.jcrs.2015.07.042
11. Hoffer KJ, Hoffmann PC, Savini G. Comparison of a new optical biometer using swept-source optical coherence tomography and a biometer using optical low-coherence reflectometry. J Cataract Refract Surg. 2016;42(8):1165–1172. doi:10.1016/j.jcrs.2016.07.013
12. Hoffer KJ, Savini G. Comparison of AL-scan and IOLmaster 500 partial coherence interferometry optical biometers. J Refract Surg. 2016;32(10):694–698. doi:10.3928/1081597X-20160712-03
13. Savini G, Hoffer KJ, Shammas HJ, Aramberri J, Huang J, Barboni P. Accuracy of a new swept-source optical coherence tomography biometer for IOL power calculation and comparison to IOLMaster. J Refract Surg. 2017;33(10):690–695. doi:10.3928/1081597X-20170721-05
14. Vogel A, Dick HB, Krummenauer F. Reproducibility of optical biometry using partial coherence interferometry: intraobserver and interobserver reliability. J Cataract Refract Surg. 2001;27.
15. Whang W-J, Yoo Y-S, Kang M-J, Joo C-K. Predictive accuracy of partial coherence interferometry and swept-source optical coherence tomography for intraocular lens power calculation. Sci Rep. 2018;8(1):13732. doi:10.1038/s41598-018-32246-z
16. Chen H, Li Y, Chen Z, et al. Comprehensive comparison of axial length measurement with three swept-source OCT-based biometers and partial coherence interferometry. J Refract Surg. 2019;35:115–120.
 © 2020 The Author(s). This work is published and licensed by Dove Medical Press Limited. The full terms of this license are available at https://www.dovepress.com/terms.php and incorporate the Creative Commons Attribution - Non Commercial (unported, v3.0) License.
By accessing the work you hereby accept the Terms. Non-commercial uses of the work are permitted without any further permission from Dove Medical Press Limited, provided the work is properly attributed. For permission for commercial use of this work, please see paragraphs 4.2 and 5 of our Terms.
© 2020 The Author(s). This work is published and licensed by Dove Medical Press Limited. The full terms of this license are available at https://www.dovepress.com/terms.php and incorporate the Creative Commons Attribution - Non Commercial (unported, v3.0) License.
By accessing the work you hereby accept the Terms. Non-commercial uses of the work are permitted without any further permission from Dove Medical Press Limited, provided the work is properly attributed. For permission for commercial use of this work, please see paragraphs 4.2 and 5 of our Terms.