")
Back to Journals » Clinical Epidemiology » Volume 9
Comorbidity index in central cancer registries: the value of hospital discharge data
Authors Lichtensztajn DY , Giddings BM, Morris CR, Parikh-Patel A, Kizer KW
Received 14 July 2017
Accepted for publication 26 September 2017
Published 20 November 2017 Volume 2017:9 Pages 601—609
DOI https://doi.org/10.2147/CLEP.S146395
Checked for plagiarism Yes
Review by Single anonymous peer review
Peer reviewer comments 2
Editor who approved publication: Professor Henrik Sørensen
Daphne Y Lichtensztajn,1 Brenda M Giddings,2 Cyllene R Morris,2 Arti Parikh-Patel,2 Kenneth W Kizer2
1Greater Bay Area Cancer Registry, Cancer Prevention Institute of California, CA, USA; 2California Cancer Reporting and Epidemiologic Surveillance Program, Institute for Population Health Improvement, UC Davis Health, CA, USA
Background: The presence of comorbid medical conditions can significantly affect a cancer patient’s treatment options, quality of life, and survival. However, these important data are often lacking from population-based cancer registries. Leveraging routine linkage to hospital discharge data, a comorbidity score was calculated for patients in the California Cancer Registry (CCR) database.
Methods: California cancer cases diagnosed between 1991 and 2013 were linked to statewide hospital discharge data. A Deyo and Romano adapted Charlson Comorbidity Index was calculated for each case, and the association of comorbidity score with overall survival was assessed with Kaplan–Meier curves and Cox proportional hazards models. Using a subset of Medicare-enrolled CCR cases, the index was validated against a comorbidity score derived using Surveillance, Epidemiology, and End Results (SEER)-Medicare linked data.
Results: A comorbidity score was calculated for 71% of CCR cases. The majority (60.2%) had no relevant comorbidities. Increasing comorbidity score was associated with poorer overall survival. In a multivariable model, high comorbidity conferred twice the risk of death compared to no comorbidity (hazard ratio 2.33, 95% CI: 2.32–2.34). In the subset of patients with a SEER-Medicare-derived score, the sensitivity of the hospital discharge-based index for detecting any comorbidity was 76.5. The association between overall mortality and comorbidity score was stronger for the hospital discharge-based score than for the SEER-Medicare-derived index, and the predictive ability of the hospital discharge-based score, as measured by Harrell’s C index, was also slightly better for the hospital discharge-based score (C index 0.62 versus 0.59, P<0.001).
Conclusions: Despite some limitations, using hospital discharge data to construct a comorbidity index for cancer registries is a feasible and valid method to enhance registry data, which can provide important clinically relevant information for population-based cancer outcomes research.
Keywords: administrative health care data, data linkages, population-based, validation, cancer registry, hospital discharge data, survival
Plain language summary
Population-based cancer registries collect information about cancers that occur in residents of geographically defined areas. These data are used to assess whether cancer-related outcomes differ for certain groups within the population. Many registries do not collect information on the presence of medical conditions other than cancer. Yet, these underlying medical conditions often affect the types of treatments offered and the patient’s life expectancy. This study demonstrated the feasibility and accuracy of obtaining information on underlying medical conditions by linking cancer registry data to hospital discharge reports, leveraging a procedure already routinely performed by registries to update each patient’s follow-up information. This study used hospital discharge data to derive a score that represented the presence of serious coexisting medical conditions in cancer patients. Higher scores were associated with higher probability of death, and the scores derived from hospital discharge data were stronger predictors of mortality than those from a more costly and time-consuming linkage with Medicare. The addition of this comorbidity score to registry data adds minimal cost to the operation of the registry, but is extremely valuable because it allows researchers to have a more accurate picture of the underlying health of the population and to take it into account when studying cancer-related outcomes.
Introduction
Population-based cancer registries are an invaluable resource for cancer outcomes research. Their population-based nature enables the assessment of “real world” outcomes and ensures broad generalizability of findings. However, while these registries capture detailed cancer data and patient demographics, they often lack data on other important factors, hampering the translation of population-based research to clinical patient care, and limiting the utility of registry data in comparative effectiveness research. The lack of information on the presence of coexisting medical conditions, which influence treatment options, quality of life, and survival, is one of the greatest shortcomings of population-based cancer registry data. These data are often used to identify disparities in care and outcomes, yet findings may be confounded by unrecognized differences in the underlying health of the population subgroups. Additionally, in order to apply the findings of population-based studies to clinical care, physicians need to be able to assess the comparability of the study population to their patient population, which may bear significantly different comorbidity burdens. The routine addition of comorbidity data to cancer registry data should greatly enhance the value of registry data for research and increase its relevance to clinicians, health care administrators, and policy makers.
In population-based cancer research, data on comorbidity usually come from linkages with other sources of administrative health care data, and several measures have been developed to quantify the burden of comorbid disease using administrative data.1 The Charlson Comorbidity Index is one of the most widely used measures and has been validated in many settings, including cancer.1–6 The National Cancer Institute (NCI)’s Surveillance, Epidemiology, and End Results (SEER) program has routinely linked its database of SEER-affiliated cancer registries with Medicare data. While the value of the SEER-Medicare linked data is unparalleled as a source of detailed information of treatment and comorbidities, files are limited to SEER registries and patients who are mostly 65 years and older. Another limitation of the SEER-Medicare files is the lack of detailed claims data for Medicare beneficiaries enrolled in health maintenance organizations compared to those enrolled in fee-for-service plans.7 Accordingly, a method that can be used by cancer registries to capture comorbidity information for all patients on a routine basis would be desirable.
Specialized large-scale linkages to external health care databases that are conducted on a project-specific basis can be costly, time-consuming, resource-intensive, and fraught with regulatory and legal challenges.7,8 However, some central cancer registries already have mechanisms in place to conduct routine linkages to large administrative databases, including hospital discharge data, to obtain passive follow-up for vital status. Leveraging these linkages to obtain additional data could substantially enhance the value of standard data collected by cancer registries. The purpose of this study was to construct and validate a comorbidity index based on hospital discharge data that could be replicated by other registries. To accomplish this purpose, we specifically sought to 1) derive a Charlson comorbidity score for cancer patients in California and 2) validate this index by comparing overall survival estimates obtained through its use with estimates from a SEER-Medicare-derived index.
Methods
The California Cancer Registry (CCR) is the state-mandated cancer surveillance system that has been collecting data on all cancers diagnosed in residents of the state since 1988.9–12 Data are collected through a network of regional registries, which are also affiliated with the SEER program. As part of routine passive follow-up activities, the CCR annually links its database to the Office of Statewide Health Planning and Development (OSHPD) patient data. OSHPD is California’s source for hospital discharge data and includes hospital inpatient discharge reports as well as emergency department and ambulatory surgery encounters. OSHPD provides International Classification of Diseases diagnosis codes for the principal diagnosis and up to 24 other diagnoses for all inpatient admissions from 1991 forward, and for all ambulatory surgery and emergency department encounters from 2005 forward.13–15
All patients in the CCR database who were diagnosed with cancer between 1991 and 2013 were linked to OSHPD patient discharge data (PDD), emergency department data (EDD), and ambulatory surgery data (ASD) using probabilistic matching on social security number, date of birth, sex, and zip code. Patients in the CCR data may have multiple cancer diagnoses. With the objective of quantifying the comorbidity burden at the time of each cancer diagnosis, for every linked patient, all admissions that occurred from a year prior to each cancer diagnosis through 6 months (180 days) following the diagnosis were selected. A list of diagnostic codes relevant for the calculation of the Charlson Comorbidity Index was compiled (Table S1).16 Using the freely available SAS macro from the NCI, the Deyo and Romano adapted Charlson Comorbidity Index was calculated.17–19 This index is a weighted score based on the presence of 16 medical conditions: congestive heart failure, myocardial infarction (acute and old), peripheral vascular disease, cerebrovascular disease, dementia, chronic pulmonary disease, rheumatologic disease, peptic ulcer disease, mild liver disease, moderate/severe liver disease, diabetes, diabetes with chronic complications, hemi- or paraplegia, renal disease, and acquired immune deficiency syndrome. A score of 0 indicates that no relevant comorbidities were recorded for that patient. For each cancer patient, admissions occurring within the defined time period were searched for the presence of any of these diagnoses.
The association of the comorbidity score with overall survival was assessed. Survival time was calculated from date of a cancer diagnosis to date of death or last follow-up, with missing day imputed as 15. Cases with unknown month of last contact (n=579) were excluded from the survival analysis. Cases alive on December 31, 2014, were censored on this date. Overall survival following a cancer diagnosis was calculated for all cases using the Kaplan–Meier method and the log-rank test was used to compare survival by comorbidity score. A Cox proportional hazards model was also constructed to assess the association of comorbidity score with the cancer patients’ overall survival. Hazard ratios (HRs) were obtained, both crude and adjusted for the following potential confounders: age, sex, race/ethnicity, cancer stage at diagnosis, and a previously described neighborhood-level measure of socioeconomic status (SES).20,21
In the 2013 Annual Report to the Nation, Edwards et al reported on the comorbidity burden of SEER cancer patients calculated using the linked SEER-Medicare database.6 Via a special data request made to NCI’s SEER program, the Medicare-based comorbidity index was obtained for those SEER patients that were originally reported by CCR registries.22,23 These data were utilized to further validate our comorbidity measure. For each cancer case, the indexes derived from each source – hospital discharge data and SEER-Medicare – were compared and, using the Cox model described above, the strength of association of each index with overall mortality in our population was compared. Additionally, Harrell’s concordance index24 (C index) was calculated for the models. The C index measures the proportion of pairs where the predicted and observed outcomes are concordant and can be interpreted as a measure of the model’s predictive performance; a higher C index indicates better predictive performance. C indexes were calculated using the “survival” package25 in R version 3.2.2 (R Foundation for Statistical Computing, Vienna, Austria), and compared using the “compareC” package.26 All other statistical analyses were conducted in SAS version 9.4 (SAS Institute, Cary, NC, USA).
This study was covered under the protocol for the Greater Bay Area Cancer Registry approved by the Cancer Prevention Institute of California’s Institutional Review Board. Informed consent was not required as the analysis was conducted as a part of the CCR routine activities under the California state mandate for cancer reporting.
Results
Of the 3,634,058 cases in the CCR database diagnosed between 1991 and 2013, 3,294,586 (90.7%) had a match in at least one of the three OSHPD files. Of those, 2,583,704 (78.4%) had an admission during the time period of interest that could be used to calculate the comorbidity index. The proportion of cases with a matching OSHPD admission that had comorbidity data varied by year of diagnosis, patient demographics, and cancer site.
The availability of comorbidity data was higher for women (81.1%), cases at the extremes of age (83.3% for persons aged 0–19 years, and 81.7% for persons aged 80 years and older), and for Asian/Pacific Islander patients (83.1%), and lower for men (75.7%), young adults aged 20–29 years (71.4%), non-Hispanic whites (77.4%), and patients with unknown race/ethnicity (45.4%). Comorbidity data were available for a higher proportion (87.5%) of cases diagnosed in 2005–2013, the years for which the ASD and EDD files were available, than those diagnosed in years for which only PDD files were available, 1991–2004 (71.3%) (Table 1). Overall, the proportion of cases with comorbidity data ranged from a high of 95.9% for uterine cancers to a low of 46.7% for melanomas, but this varied by year of diagnosis (Table 2). The effect of the availability of ASD and EDD files was greater for cancer sites where treatment is less often provided in inpatient settings, such as for melanoma, testicular, bladder, and breast cancers.
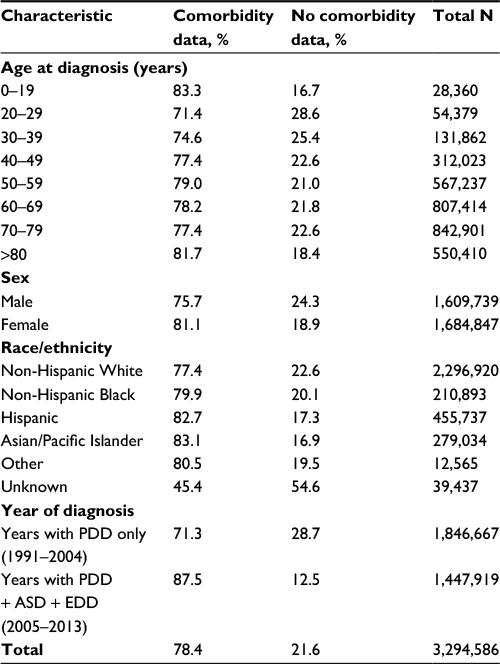 | Table 1 Characteristics of cancer cases with comorbidity data in California hospital discharge files Note: Percentages may add up to >100 due to rounding. Abbreviations: ASD, ambulatory surgery data; EDD, emergency department data; PDD, patient discharge data. |
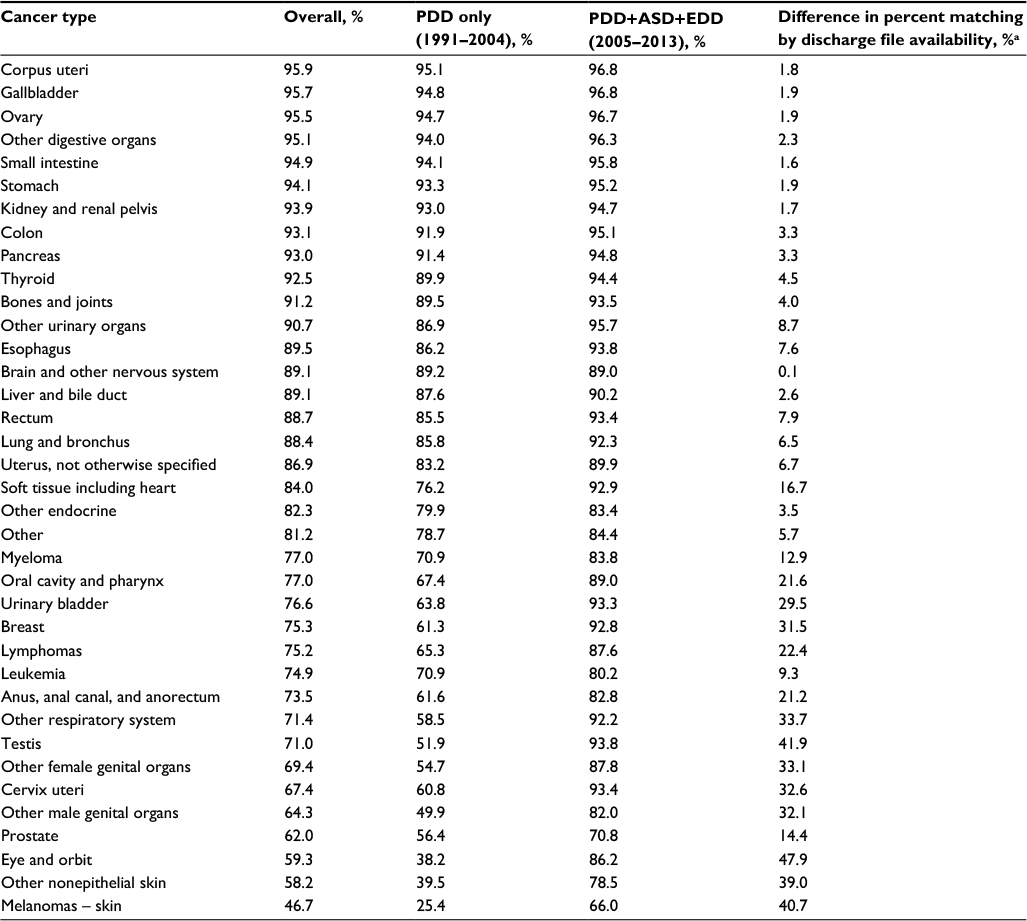 | Table 2 Proportion of cancer cases with comorbidity data by cancer type and hospital discharge file Note: aMay not be equal to Column 3 (PDD+ASD+EDD) - Column 2 (PDD only) due to rounding. Abbreviations: ASD, ambulatory surgery data; EDD, emergency department data; PDD, patient discharge data. |
Of the cases with comorbidity data, the majority (60.2%) had a comorbidity score of 0, indicating no relevant comorbid conditions, and less than a quarter (22%) had a score of 1. Only 9.2% had a score of 3 or higher, reflecting a heavy comorbidity burden.
As can be seen in Figure 1, an increasing comorbidity score was significantly associated with poorer overall survival. Without adjusting for potential confounders, the risk of overall mortality was approximately double for cases with a comorbidity score of 1 (HR 1.99, 95% CI: 1.99–2.00) compared to those with no comorbidity, almost triple for a comorbidity score of 2 (HR 2.82, 95% CI: 2.81–2.84), and quadruple for a score of 3 or higher (HR 3.95, 95% CI: 3.93–3.98) (Table 3). Although attenuated after adjusting for age, sex, race/ethnicity, SES, and cancer stage at diagnosis, there was still a significant independent association of comorbidity score with overall mortality (Table 3). Compared to cases with no comorbidities, those with a comorbidity score of 1 had a 50% higher risk of death (HR 1.50, 95% CI: 1.49–1.50). A score of 2 conferred a 79% higher risk (HR 1.79, 95% CI: 1.78–1.80) and a score of 3 or higher was associated with more than double the mortality risk (HR 2.33, 95% CI: 2.32–2.34).
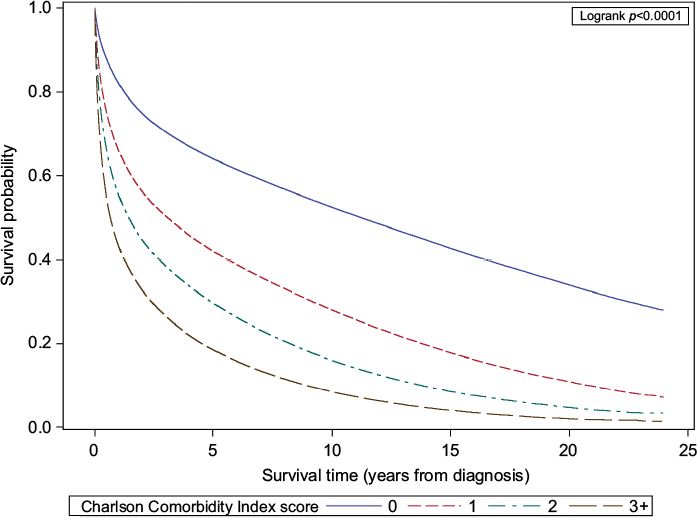 | Figure 1 Overall survival by comorbidity score for California cancer cases. |
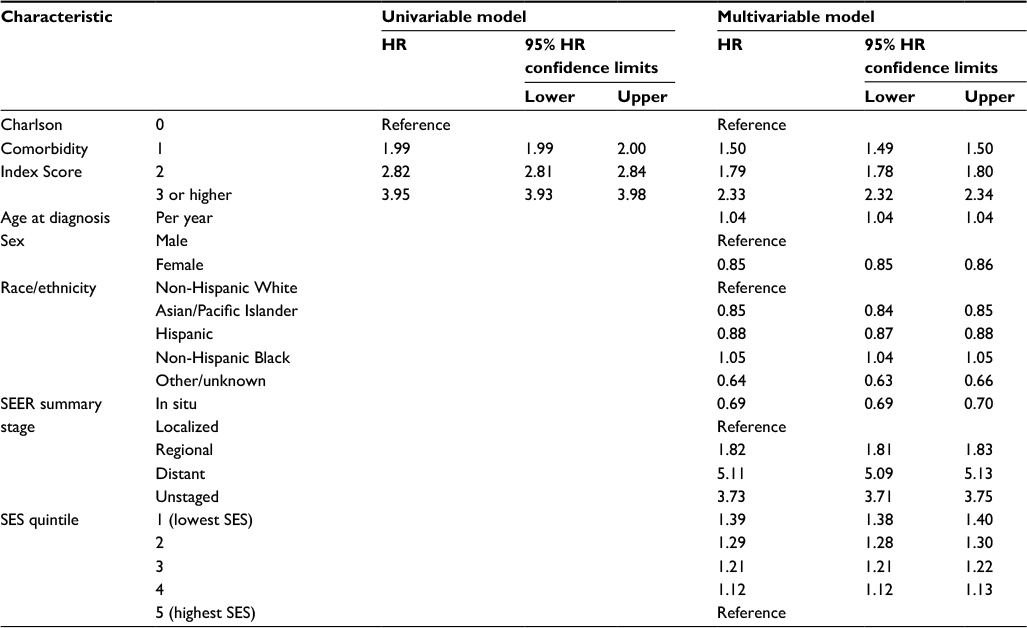 | Table 3 Association of Charlson Comorbidity Index with overall mortality among California cancer patients Abbreviations: SES, socioeconomic status; HR, hazard ratio; SEER, Surveillance Epidemiology and End Results. |
The comorbidity score derived using hospital discharge data was compared to that derived using SEER-Medicare data in the subset of patients for which this datum was available in both sources. Although our methods differed from those used by NCI, both measures were intended to be a reflection of comorbidity burden at the time of cancer diagnosis. The comorbidity score based on hospital discharge data was the same as the Medicare claims-based score in 55.4% of cases, and within 1 point for 85% of cases. The discrepancy in score was not due to hospital discharge data consistently over- or undercapturing Charlson comorbidities; the comorbidity score based on hospital discharge data was lower in 54% and higher in 46% of cases when the scores were different.
Using SEER-Medicare as the gold standard, the sensitivity of hospital discharge data for detecting any comorbidity versus none was 76.5, and the sensitivity for detecting moderate/high comorbidity (score of 2 or more) was 61.6. While the concordance between the two measures was >90% for all specific comorbid conditions except chronic pulmonary disease (85.2%) and congestive heart failure (89.6%), the sensitivity of the hospital discharge-based measure for detecting specific comorbid conditions varied greatly (Table S2). For conditions with a prevalence of ≥10%, however, the sensitivity was generally good. Additionally, the negative predictive value of the hospital discharge measure was ≥90% for all conditions.
In both univariable and multivariable Cox models, the comorbidity score derived from hospital discharge data proved to be a stronger predictor of overall mortality than the comorbidity scores derived with SEER-Medicare data. Both the C indexes and the estimated HRs were higher in the hospital discharge-derived model (Table 4).
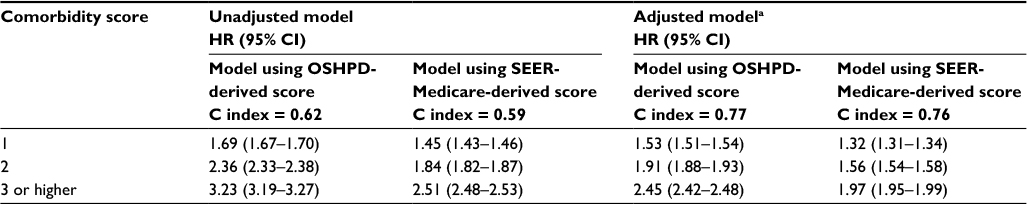 | Table 4 Association of hospital discharge- and Medicare-derived Charlson indexes with overall mortality Notes: aModel adjusted for age, sex, race/ethnicity, cancer stage, and quintile of neighborhood SES. Abbreviations: HR, hazard ratio; OSHPD, Office of Statewide Health Planning and Development; SES, socioeconomic status; SEER, Surveillance, Epidemiology, and End Results. |
Discussion
Almost all states in the US maintain statewide hospital discharge databases,27 and the North American Association of Central Cancer Registries has published guidelines on the use of information from hospital discharge databases to enhance the data collected by central cancer registries.28 Some states, such as California, have incorporated linkage to hospital discharge data as part of routine registry operating procedures. Using data available through routine central cancer registry follow-up activities, a comorbidity index was calculated, which can be used in health outcomes research to quantify the burden of comorbid conditions at the time of the patient’s cancer diagnosis. For cancer registries that already conduct routine linkage to state hospital discharge data, this comorbidity measure has clear advantages. It creates minimal additional burden to registry operations because the data used to derive this index come from an established routine linkage process. Additionally, it has the advantage of being available for the majority of the cancer population represented in the registry database, regardless of age, cancer type, or insurance coverage. This is in contrast to SEER-Medicare, the primary population-based linked database containing comorbidity information, which is limited by patient age (e.g. age 65 years for Medicare eligibility), SEER affiliation, and health plan participation (e.g. Medicare fee-for-service versus Medicare Advantage), as well as health care network-based linked data, such as The Oncoshare Project, which is limited by cancer site (e.g. breast cancer) and treating institution.29
However, the index derived from hospital discharge data does have some limitations. Although a comorbidity index was calculated for the majority (71%) of cancer cases in the CCR, the availability of data did vary significantly by cancer site and year of diagnosis. In California, hospital discharge data are only available for patients who had an inpatient admission or an encounter at an ambulatory surgery center or emergency department. For most cancer patients this will occur at the time of cancer-directed surgery. Therefore, the nature of this data source dictates that cancers managed surgically will be more completely represented than those primarily treated with systemic or radiation therapy.
To compensate for the lack of data on routine outpatient care, the time window around the date of diagnosis used to identify comorbid conditions was extended. We felt that limiting the encounters used in the calculation of the index to the year prior to diagnosis, as is often done, would have biased our data toward capturing only the sickest patients – those with medical conditions serious enough to require hospital-based care independent of their cancer diagnosis. Cancer-related care is increasingly provided on an outpatient basis and contact with a hospital facility (including ambulatory surgery centers) during the peri-diagnostic period may only occur at the time of cancer-related surgery.30–32 With potential treatment delays and the increasing use of neoadjuvant therapy, the time between diagnosis and surgery can be prolonged well beyond the month of diagnosis.33 In the CCR, the mean time from diagnosis to surgery for patients who had neoadjuvant therapy was 132 days, and the 75th percentile was 174 days, which is ~6 months. By extending the time window to 6 months postdiagnosis, we were able to maximize our ability to capture comorbidity data while minimizing the potential for the misclassification of treatment-related conditions as preexisting comorbidities. Sensitivity analysis revealed that the inclusion of encounters occurring up to 6 months after diagnosis did not significantly affect results compared to using a comorbidity index based on only the 12 months prior to diagnosis (Tables S3A–D).
The Charlson Comorbidity Index consists of a limited number of conditions, and most of the common adverse effects resulting from cancer therapy are not conditions that contribute to the index. Some conditions, such as heart failure and renal disease, are associated with cancer treatment and could potentially be misclassified as preexisting comorbid conditions using our index. However, treatment-related cardio- and nephrotoxicity are treatment- and agent-specific and occur in only a fraction of patients receiving that particular treatment. Thus, the number of potentially misclassified cases is multiplicatively reduced by the proportion of patients receiving a particular treatment within 6 months of diagnosis, the proportion of those patients that develop a condition included in the Charlson index, and the proportion of those developing that condition who develop it within 6 months of diagnosis. For example, anthracyclines are chemotherapeutic agents that have been associated with cardiac toxicity in up to 1.6%–2.1% of patients.34 In our data, the potential misclassification of anthracycline-induced heart failure as a preexisting comorbidity would be limited to cases diagnosed with a cancer for which anthracycline chemotherapy is indicated, multiplied by the proportion of those cancers that received an anthracycline, multiplied by the proportion that began their anthracycline-based treatment within 6 months of diagnosis, multiplied by the proportion that developed cardiotoxicity acutely. Compared to the gain in the number of cases we were able to link by extending the time window (N=1,022,768), the number of cases with potentially misclassified comorbidities should be small. Reassuringly, no excess of codes for congestive heart failure or chronic renal disease was noted in encounters from the 6 months following diagnosis; the prevalence of specific comorbid conditions identified by our algorithm was similar between the encounters preceding diagnosis and those following diagnosis (Table S3C).
As with any measure based primarily on inpatient administrative data, there is potential to under-ascertain conditions that are commonly managed on an outpatient basis. Detection of these conditions in our data relied primarily on their coding as secondary diagnoses during an episode of hospital-based care. Because most of the conditions in the Charlson Comorbidity Index would affect patient management, and potentially affect hospital billing and reimbursement, they would likely be captured in the secondary diagnoses.35,36 We tried to assess the degree of under-ascertainment of these conditions by comparing our comorbidity score to one derived using both inpatient and outpatient Medicare claims. The agreement between the two sources was fairly good. The score based on hospital discharge data was not consistently higher or lower than the Medicare-based score. While we did find that our index under-ascertained some conditions that are generally managed as an outpatient, such as diabetes, the false-negative rate for these conditions using our index was only about 5%–6%. Because our comorbidity index was intended to measure the overall comorbid burden, not specific medical conditions, we did not feel that this compromised the interpretation of our score. The validity of our hospital discharge-based index as a measure of underlying health status was confirmed by its association with overall mortality, which was significantly stronger for our index than for the Medicare-based index, and by its performance in predicting overall mortality, which was better than that of the Medicare-based index. Thus, while the comorbidity scores based on different sources of administrative data may not be identical, we are confident that our measure adequately captures significant comorbidity.
Conclusion
Despite some limitations, the comorbidity score derived from hospital discharge data provides an important enhancement to population-based cancer research. By leveraging routine registry operation activities, we derived a valid measure of the burden of comorbid disease among cancer patients. This comorbidity index can potentially be implemented by other cancer registries to increase the relevance and usefulness of cancer registry data for clinicians, researchers, health care administrators, and policy makers.
Acknowledgments
The collection of cancer incidence data used in this study was supported by the California Department of Public Health as part of the statewide cancer reporting program mandated by the California Health and Safety Code Section 103885; the National Cancer Institute’s Surveillance, Epidemiology and End Results Program under contracts awarded to the Cancer Prevention Institute of California, the University of Southern California, and the Public Health Institute; and the Centers for Disease Control and Prevention’s National Program of Cancer Registries, under agreement awarded to the California Department of Public Health. The ideas and opinions expressed herein are those of the author(s), and endorsement by the State of California, Department of Public Health, the National Cancer Institute, the Centers for Disease Control and Prevention, or their Contractors and Subcontractors is not intended nor should be inferred.
This work was supported in part by the National Cancer Institute’s Surveillance, Epidemiology and End Results Program under contract HHSN261201000140 awarded to the Cancer Prevention Institute of California.
DL receives funding from the National Cancer Institute’s Surveillance Epidemiology and End Results (SEER) program.
Disclosure
The authors report no conflicts of interest in this work.
References
Sarfati D. Review of methods used to measure comorbidity in cancer populations: no gold standard exists. J Clin Epidemiol. 2012;65(9):924–933. | ||
Klabunde CN, Legler JM, Warren JL, Baldwin LM, Schrag D. A refined comorbidity measurement algorithm for claims-based studies of breast, prostate, colorectal, and lung cancer patients. Ann Epidemiol. 2007;17(8):584–590. | ||
Newschaffer CJ, Bush TL, Penberthy LT. Comorbidity measurement in elderly female breast cancer patients with administrative and medical records data. J Clin Epidemiol. 1997;50(6):725–733. | ||
Quan H, Li B, Couris CM, et al. Updating and validating the Charlson comorbidity index and score for risk adjustment in hospital discharge abstracts using data from 6 countries. Am J Epidemiol. 2011;173(6):676–682. | ||
Baldwin LM, Klabunde CN, Green P, Barlow W, Wright G. In search of the perfect comorbidity measure for use with administrative claims data: does it exist? Med Care. 2006;44(8):745–753. | ||
Edwards BK, Noone AM, Mariotto AB, et al. Annual Report to the Nation on the status of cancer, 1975–2010, featuring prevalence of comorbidity and impact on survival among persons with lung, colorectal, breast, or prostate cancer. Cancer. 2014;120(9):1290–1314. | ||
Warren JL, Klabunde CN, Schrag D, Bach PB, Riley GF. Overview of the SEER-Medicare data: content, research applications, and generalizability to the United States elderly population. Med Care. 2002;40(8 Suppl):IV-3–18. | ||
Bradley CJ, Penberthy L, Devers KJ, Holden DJ. Health services research and data linkages: issues, methods, and directions for the future. Health Serv Res. 2010;45(5 Pt 2):1468–1488. | ||
California Cancer Reporting System Standards, Volume I: Abstracting and Coding Procedures for Hospitals. Sacramento, CA: California Department of Public Health, Chronic Disease Surveillance and Research Branch; November 2016. | ||
California Cancer Reporting System Standards for 2016, Volume II: Standards for Automated Reporting. Sacramento, CA: California Department of Public Health, Chronic Disease Surveillance and Research Branch; December 2015. | ||
California Cancer Reporting System Standards, Volume III: Data Standards for Regional Registries and California. Cancer Registry. Sacramento, CA: California Department of Public Health, Chronic Disease Surviellance and Research Branch; 2016. | ||
California Cancer Reporting System Standards, Volume IV: Physician Requirements for Cancer Reporting in California. Sacramento, CA: California Department of Public Health, Chronic Disease Surviellance and Research Branch; 2016. | ||
California Office of Statewide Health Planning and Development, Patient Discharge Data; 1991–2014. | ||
California Office of Statewide Health Planning and Development, Emergency Department Data; 2005–2014. | ||
California Office of Statewide Health Planning and Development, Ambulatory Surgery Data; 2005–2015. | ||
Schmidt A, Schmidt K, editors. ICD-9-CM Professional for Hospitals –Volumes 1, 2 and 3. USA: Optum; 2014. | ||
Charlson Comorbidity SAS Macro [computer program]. National Cancer Institute; 2014. | ||
Deyo RA, Cherkin DC, Ciol MA. Adapting a clinical comorbidity index for use with ICD-9-CM administrative databases. J Clin Epidemiol. 1992;45(6):613–619. | ||
Romano PS, Roos LL, Jollis JG. Adapting a clinical comorbidity index for use with ICD-9-CM administrative data: differing perspectives. J Clin Epidemiol. 1993;46(10):1075–1079; discussion 1081–1090. | ||
Yost K, Perkins C, Cohen R, Morris C, Wright W. Socioeconomic status and breast cancer incidence in California for different race/ethnic groups. Cancer Causes Control. 2001;12(8):703–711. | ||
Yang J, Schupp C, Harrati A, Clarke C, Keegan T, Gomez S. Developing an Area-based Socioeconomic Measure from American Community Survey Data. Fremont, CA: Cancer Prevention Institute of California; 2014. | ||
Mariotto AB, Wang Z, Klabunde CN, Cho H, Das B, Feuer EJ. Life tables adjusted for comorbidity more accurately estimate noncancer survival for recently diagnosed cancer patients. J Clin Epidemiol. 2013;66(12):1376–1385. | ||
Surveillance, Epidemiology, and End Results (SEER) Program SEER*Stat Database: Incidence – California Custom Data (with SEER-Medicare Fields and Patient ID). November 2016, based on November 2104 submission. | ||
Harrell FE Jr, Califf RM, Pryor DB, Lee KL, Rosati RA. Evaluating the yield of medical tests. JAMA. 1982;247(18):2543–2546. | ||
Therneau T. A Package for Survival Analysis in S. (version 2.38). 2015. | ||
Kang L, Chen W, Petrick N, Gallas B. Comparing two correlated C indices with right-censored survival outcome: a one-shot nonparametric approach. Stat Med. 2015;34(4):685–703. | ||
Andrews RM. Statewide hospital discharge data: collection, use, limitations, and improvements. Health Serv Res. 2015;50(Suppl 1):1273–1299. | ||
NAACCR Discharge Data Work Group, editors. Discharge Data Best Practices Guide. Springfield, IL: North American Association of Central Cancer Registries; 2015. | ||
Kurian AW, Mitani A, Desai M, et al. Breast cancer treatment across health care systems: linking electronic medical records and state registry data to enable outcomes research. Cancer. 2014;120(1):103–111. | ||
The state of cancer care in America, 2014: a report by the American Society of Clinical Oncology. J Oncol Pract. 2014;10(2):119–142. | ||
Williamson TS. The shift of oncology inpatient care to outpatient care: the challenge of retaining expert oncology nurses. Clin J Oncol Nurs. 2008;12(2):186–189. | ||
Lamkin L, Rosiak J, Buerhaus P, Mallory G, Williams M. Oncology Nursing Society Workforce Survey. Part I: Perceptions of the nursing workforce environment and adequacy of nurse staffing in outpatient and inpatient oncology settings. Oncol Nurs Forum. 2001;28(10):1545–1552. | ||
Trimble EL, Ungerleider RS, Abrams JA, et al. Neoadjuvant therapy in cancer treatment. Cancer. 1993;72(11 Suppl):3515–3524. | ||
Yeh ET, Bickford CL. Cardiovascular complications of cancer therapy: incidence, pathogenesis, diagnosis, and management. J Am Coll Cardiol. 2009;53(24):2231–2247. | ||
Hospital Acute Inpatient Services Payment System; 2016. Available from: http://www.medpac.gov/docs/default-source/payment-basics/medpac_payment_basics_16_hospital_finalecfc0fadfa9c665e80adff00009edf9c.pdf?sfvrsn=0. Accessed April 3, 2017. | ||
Acute Care Hospital Inpatient Prospective Payment System; 2016. Available from: https://www.cms.gov/Outreach-and-Education/Medicare-Learning-Network-MLN/MLNProducts/downloads/AcutePaymtSysfctsht.pdf. Accessed April 3, 2017. |
 © 2017 The Author(s). This work is published and licensed by Dove Medical Press Limited. The full terms of this license are available at https://www.dovepress.com/terms.php and incorporate the Creative Commons Attribution - Non Commercial (unported, v3.0) License.
By accessing the work you hereby accept the Terms. Non-commercial uses of the work are permitted without any further permission from Dove Medical Press Limited, provided the work is properly attributed. For permission for commercial use of this work, please see paragraphs 4.2 and 5 of our Terms.
© 2017 The Author(s). This work is published and licensed by Dove Medical Press Limited. The full terms of this license are available at https://www.dovepress.com/terms.php and incorporate the Creative Commons Attribution - Non Commercial (unported, v3.0) License.
By accessing the work you hereby accept the Terms. Non-commercial uses of the work are permitted without any further permission from Dove Medical Press Limited, provided the work is properly attributed. For permission for commercial use of this work, please see paragraphs 4.2 and 5 of our Terms.