")
Back to Journals » Clinical Interventions in Aging » Volume 12
Common methods of biological age estimation
Authors Jia L , Zhang W, Chen X
Received 16 February 2017
Accepted for publication 18 April 2017
Published 11 May 2017 Volume 2017:12 Pages 759—772
DOI https://doi.org/10.2147/CIA.S134921
Checked for plagiarism Yes
Review by Single anonymous peer review
Peer reviewer comments 2
Editor who approved publication: Dr Zhi-Ying Wu
Linpei Jia,1–3 Weiguang Zhang,2,3 Xiangmei Chen1–3
1Department of Nephrology, Second Hospital of Jilin University, Changchun, Jilin Province, 2Department of Nephrology, Chinese People’s Liberation Army General Hospital, Beijing, 3State Key Laboratory of Kidney Disease, Chinese People’s Liberation Army General Hospital, Beijing, People’s Republic of China
Abstract: At present, no single indicator could be used as a golden index to estimate aging process. The biological age (BA), which combines several important biomarkers with mathematical modeling, has been proposed for >50 years as an aging estimation method to replace chronological age (CA). The common methods used for BA estimation include the multiple linear regression (MLR), the principal component analysis (PCA), the Hochschild’s method, and the Klemera and Doubal’s method (KDM). The fundamental differences in these four methods are the roles of CA and the selection criteria of aging biomarkers. In MLR and PCA, CA is treated as the selection criterion and an independent index. The Hochschild’s method and KDM share a similar concept, making CA an independent variable. Previous studies have either simply constructed the BA model by one or compared the four methods together. However, reviews have yet to illustrate and compare the four methods systematically. Since the BA model is a potential estimation of aging for clinical use, such as predicting onset and prognosis of diseases, improving the elderly’s living qualities, and realizing successful aging, here we summarize previous BA studies, illustrate the basic statistical steps, and thoroughly discuss the comparisons among the four common BA estimation methods.
Keywords: chronological age, statistical method, aging biomarker, statistical model
Introduction
Aging is a complicated process characterized by progressive decline in physical, mental, and reproductive capacities, leading to a loss of function, increased susceptibility to disease, and ultimately the end of life.1,2 At this time, the world is facing increasing life expectancy and population aging trend.3 It is important to increase our understanding on the mechanism of aging and improve the living quality of elderly people.4,5 Chronological age (CA) is a commonly used indicator for aging. However, life expectancy shows considerable variation among individuals with equal or similar CAs due to diversity in genotypes and in living habits and environments.6 A 50-year-old individual may have 60-year-old body functions, and many people look older or younger compared to others at the same CA (even in twins).7 Therefore, CA is not an optimal indicator for the aging progress.
Considering the lack of a golden index for aging, researchers have established various statistical models based on cognitive age,8 physical fitness age,9,10 biological age (BA),11–13 perceived age,14,15 work ability index,16 and the frailty index,17–19 combining physical, physiological, or biochemical parameters using mathematical methods. Among these, BA is a commonly used aging estimation on an individual basis.20 BA is used to measure an individual’s level of damage accumulation, and when measured longitudinally, BA can be used to track the trajectory of damage over time.12 However, in clinical practice, we found that different organs may age at different rates. For example, a person may be physically in good shape, but not so cognitively, or vice versa. Thus, it is necessary to obtain various aging biomarkers from multiple systems and to combine them with efficient statistical models for reflecting overall aging of an individual.21 The statistical method employed plays an important role in BA estimation studies, determining the validity, specificity, and limitations of the BA model. At this time, various mathematical methods have been constructed and used for BA estimation, including the multiple linear regression (MLR),22,23 the principal component analysis (PCA),24–28 the Hochschild’s method,29,30 and the Klemera and Doubal’s method (KDM).16,31 Each method has its own advantages and disadvantages. In this report, we summarize the common methods for BA estimation and discuss the advantages and disadvantages of BA estimation methods.
Criteria for aging biomarker selection
CA, an independent variable or a benchmark
The core concept of BA estimation is factor analysis,13 and the goal of factor analysis is to select biomarkers of aging according to specific criteria. Thus, aging biomarkers are the basis for estimating BA,12,32 and differences in selection criteria drive the choice of statistical methods. Actually, when it comes to the criteria of aging biomarkers, whether the selected markers are based on CA or not may depend on what questions researchers want to answer. If the study aims at discussing how CA and BA can differ, then perhaps a low correlation between biomarkers of BA and CA can be selected. While if aging biomarkers are focused on reflecting the changes with CA, then perhaps a high correlation should be selected.
Costa and McCare33,34 noted that a general aging factor has to account for the majority of changes that occur with age. This concept is reflected in the MLR and PCA methods, in which aging biomarkers are selected according to their correlation with CA.35 However, the association with CA is not a rational criterion for selection, validation, or weighting aging biomarkers.36 Many indicators that are moderately correlated with CA may be irrelevant to aging.29 Thus, previous studies attempted to identify novel markers of aging, such as genetic indicators.28 Other studies are attempting to update the criterion of aging biomarkers and investigate methods of BA estimation. Here, we summarize the standards for aging biomarkers developed based on studies in humans (Table 1).25,28,37–75
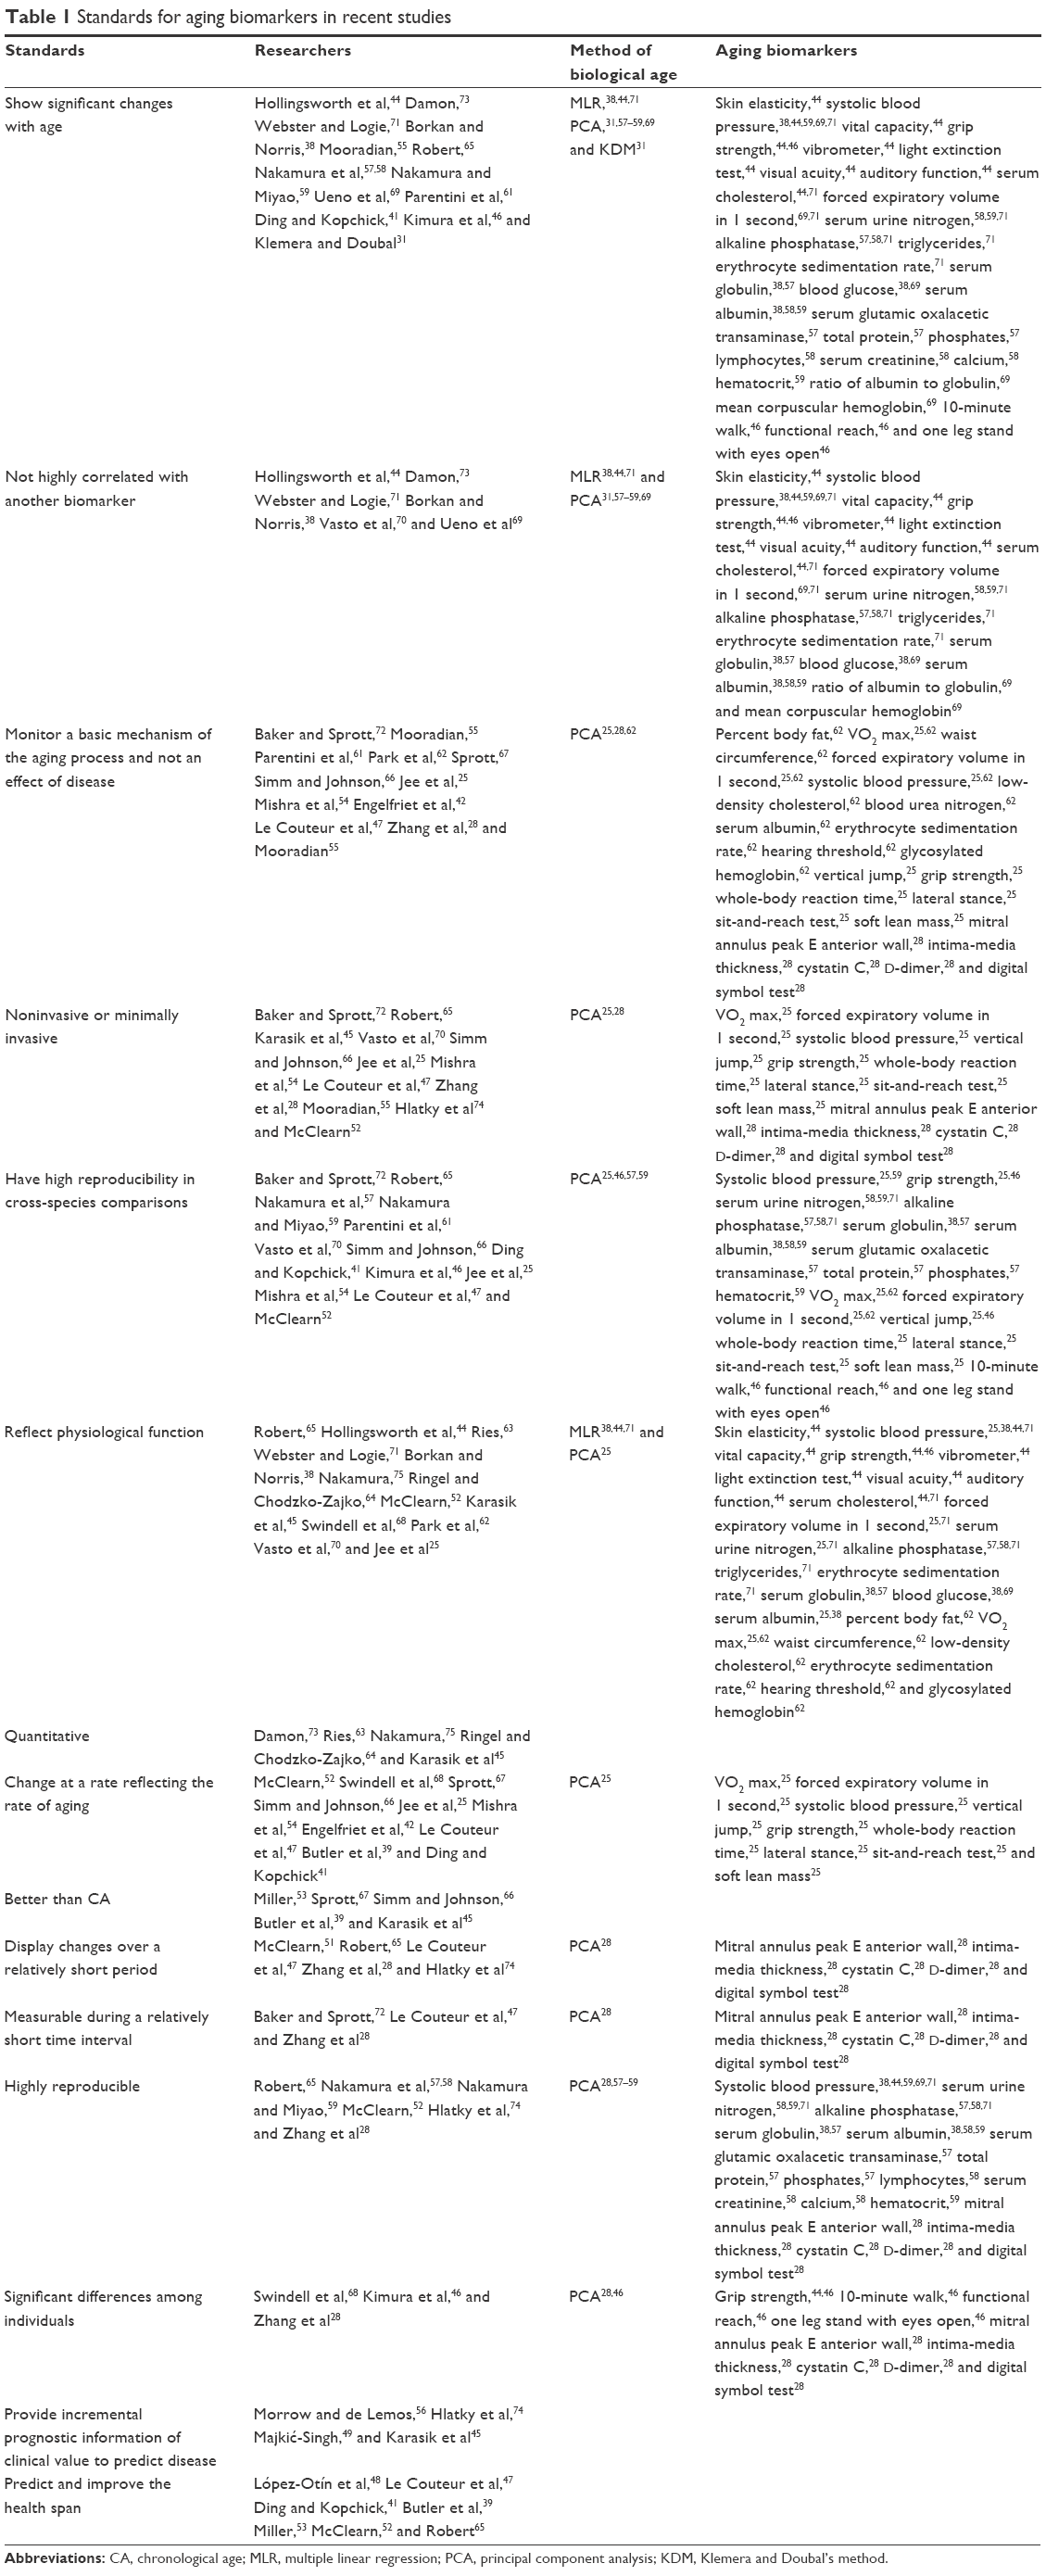 | Table 1 Standards for aging biomarkers in recent studies |
Klemera and Doubal31 had the same hypothesis as Hochschild,76 advocating for evaluating aging biomarkers according to their impact on life expectancy and granting CA a similar role to other biomarkers. Klemera and Doubal31 argued that their calculation was an improvement over MLR, PCA, and the Hochschild’s method. Comparisons between KDM and other methods confirmed this hypothesis.12,16
Specific aging biomarkers
Traditionally, aging biomarkers are often selected based on common clinical laboratory tests for the easy application in the clinical practice21 as well as the limitations of technology.9,60 However, clinical biomarkers may lower the accuracy of the BA formula.28 In recent years, various specific aging biomarkers have been found and used in BA estimation, such as genetic indicators,26,28,77–80 molecular indicators,81,82 and environmental factors.83–85
Genetic factors play an important role in the aging process.86 Approximately 20%–50% of the biological variations are caused by genetic factors.87,88 Telomere is located at the end of human chromosomes and consists of highly conserved sequences with repeated nucleotides (G-rich).89 The average lengths of human telomeres are 5–15 kb.89,90 Many researchers have reported that telomere lengths decrease during aging process, which points to the telomere length as a potential aging biomarker.91–93 We previously found a decrease of telomere length in both a cross-sectional study and a follow-up study.80,94 The telomere length decreases at a speed of 46 bp/year in a Chinese Han population.80 However, this decrease is not present in all the populations. In our study, ~27% of participants have unchanged or increasing telomere.80 Based on the benchmarks of telomere lengths and CA, we have successfully built a BA model by using the PCA method.28 Besides the telomere length, some other genetic indicators were also found to be aging biomarkers, including T-cell DNA rearrangement82 and DNA methylation.95 Zubakov et al82 demonstrated that human individual aging could be estimated accurately by using the T-cell rearrangement. They measured signal joint T-cell receptor excision circles (sjTRECs) and found a linear decline in sjTRECs with increasing age.82 However, whether the accuracy of sjTRECs may be influenced by immune system diseases is unknown. Of note is that Weidner et al95 discovered DNA methylations of three age-related CpGs located in genes ITGA2B, ASPA, and PDE4C to facilitate age prediction. Methylations of these CpGs showed a higher precision than telomere length.95 These findings in genetic aging biomarkers support that genetic factors may be the expansion of clinical indicators in aging studies.
Other attempts to find specific biomarkers are also fascinating, such as dental indicators81,96–98 and electroencephalography.99 Assessment of tooth development to estimate the age of living subjects has a long history.98 Jankauskas et al97 evaluated the use of counting incremental lines of dental root cementum for BA estimation and concluded that incremental lines count could be used as an independent verification of conventional methods. However, some attempts of estimation of BA by dental features usually require tooth sampling81,97 and limit the application among the general population. Other assessments of teeth, such as dental age, could only be used to assess age of children and emerging adults.98 New noninvasive methods with a wide range of target subjects are urgent to be discovered in the BA estimation for clinical use.
Methods for BA estimation
The MLR method
The MLR approach is a basic and preliminary method of BA estimation used for >50 years.44,100,101 Using the MLR model, aging biomarkers are determined based on their correlation with CA using following the equation:
|
|
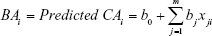
Here, BAi represents the BA of certain individuals, and m represents the number of aging biomarkers in the MLR model. xji (i =1… n, j =1… m) represents the ith biomarker of jth individual,16,29 and b is the coefficient of each biomarker. In formula (1), BA is interpreted as the linear correlation of several aging biomarkers, and each aging biomarker is weighted depending on the contribution to the BA.
The MLR approach is simple to perform and understand. In this case, because BA is constructed linearly with CA, we cannot determine whether CA is an aging biomarker or a selection criterion. At the same time, MLR distorts BA at the regression edge and does not account for the discontinuity of the aging rate over the individual’s lifetime (Table 2).22,60,71 Thus, MLR can only be used for basic studies under specific conditions, such as limited statistical capacity and software and computer programming skills, and MLR should be gradually replaced by PCA and even KDM if conditions permit.
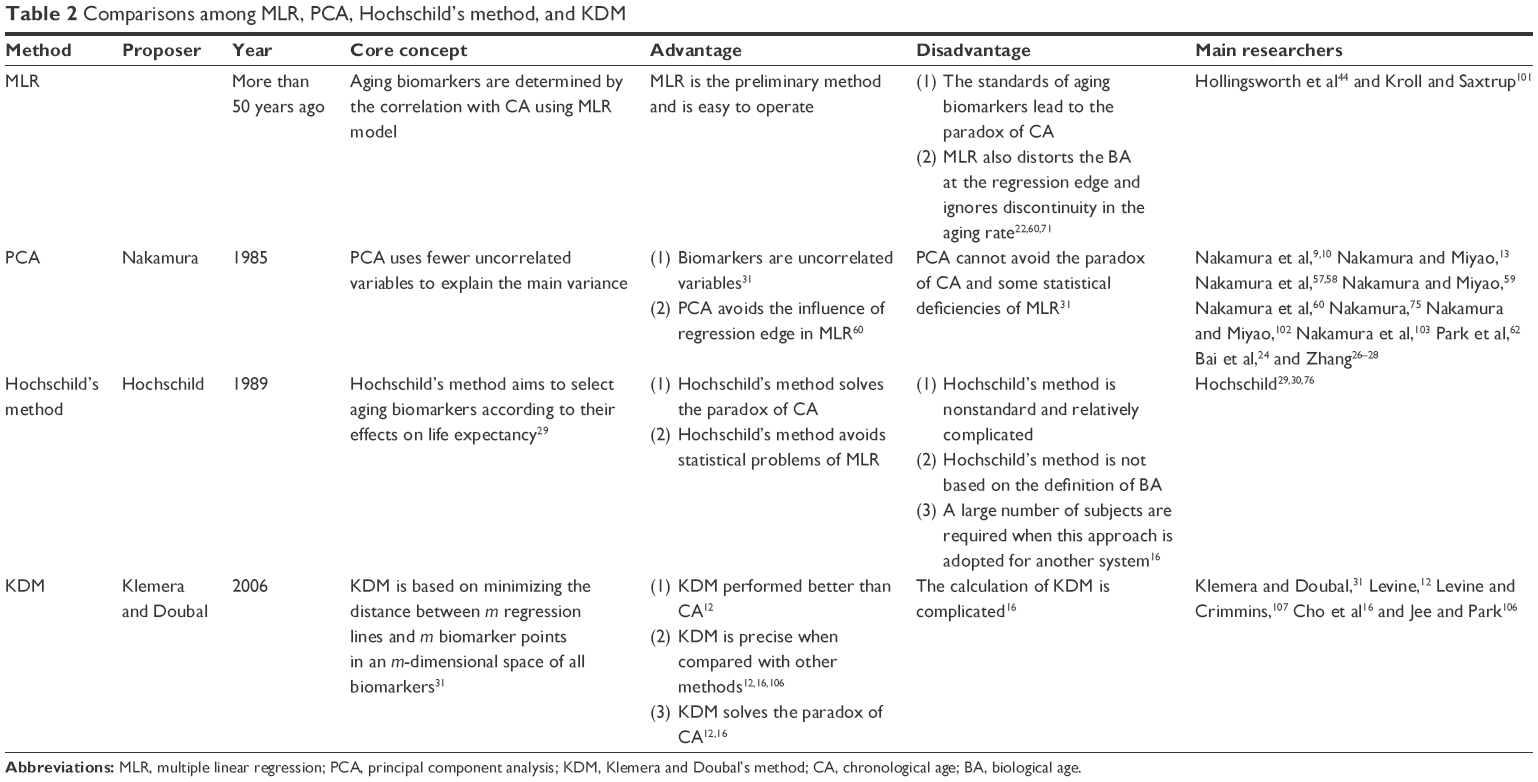 | Table 2 Comparisons among MLR, PCA, Hochschild’s method, and KDM |
The PCA method
The PCA method was proposed by Nakamura et al and is mainly used in Asian countries.9,10,13,24,25,27,28,60,62,69,102,103 In China, our team has been dedicated to BA estimations by PCA and to the investigation of new aging biomarkers for >13 years. We have constructed the BA formula based on data from a single research center24,27,28 and data from multiple centers of five major cities.104 By using the constructed BA formula, we further discussed the aging trends of Chinese. For the first time, we reported that aging speed as reflected by BA was not consistent during the lifetime. Before 75 years of age, the aging speed was accelerating, while after 75 years of age, the speed remained relatively stable.24,104 Although we added new parameters in building the BA model each time, by comparing our different BA models, some biomarkers such as cystatin C and carotid artery intima-media thickness were consistently used,24,28,104 which may prove the stability of PCA in selecting aging biomarkers.
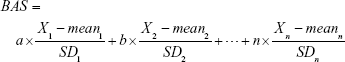
The basic steps of the PCA approach include correlation analysis, redundancy analysis, PCA, and equation construction (Figure 1).24,27 First, parameters closely related to CA are chosen based on correlation analysis. After redundancy analysis is performed to ensure that the selected parameters are not correlated, PCA is performed using uncorrelated parameters to identify the minimum biomarkers that can explain the majority of BA variance, ie, the principal component. The biological age score (BAS) equation was constructed as follows:
|
|
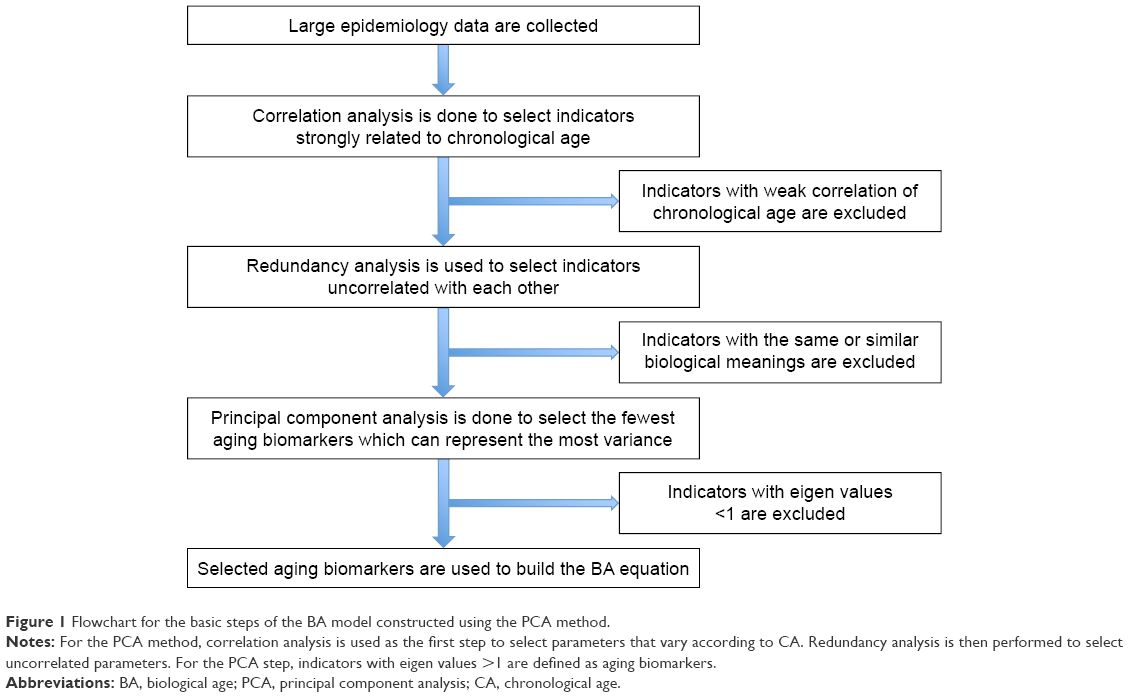 | Figure 1 Flowchart for the basic steps of the BA model constructed using the PCA method. |
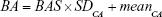
Here, n is the coefficient of the selected aging biomarker, which can be directly calculated in PCA by statistical software. Xn is the aging biomarker selected by the PCA method, and meann and SDn represent the mean and standard deviation of Xn. BAS represents the physiological function of an individual. In other words, BAS is the standardized BA. Thus, in formula (2), all the aging biomarkers Xn are transformed into standardized form  . Standardized aging biomarkers are weighted and linear combined according to the PCA results to represent BAS.
Because BAS is not expressed in years, it is difficult to directly compare BAS and CA. As we stated in formula (1), BA is considered as the predicted CA in an ideal aging process. We aim to calculate BA depending on subjects’ CA. In other words, we calculate predicted CA according to subjects’ CA. Now we get the mean of subjects’ CA, standard deviation of subjects’ CA and BAS (standard deviation of subjects’ predicted CA). Thus, Nakamura et al9,10 transformed BAS to BA using the retransformation of T-score:
|
|
In formula (3), SDCA is the standard deviation of subjects’ CA and meanCA is the mean value of subjects’ CA.
The PCA method is derived from MLR, and narrowing effects of under- or overestimated BA can be observed.25 The systematical error is caused by deviation of BA from mean population by formula (2). To eliminate the end effect of the BA formula, some researchers have corrected BA by adding the Z score into the equation22:
|
|
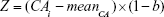
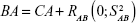
In equation (4), CAi means the individual’s CA and b is a coefficient obtained from the linear regression analysis between BA and CA. Then, we use the following equation to correct BA24,27:
|
|

The PCA approach uses fewer uncorrelated variables to explain the optimizing variance, and this method avoids some of the statistical deficiencies of MLR, such as distortion at the regression edge and discontinuity of the aging rate over the lifespan.20 However, PCA is still based on linear regression. At the same time, because the PCA method applies aging biomarkers based on their correlation with CA, the method itself cannot address the paradox proposed by Hochschild76 where a hypothetical biomarker approaching perfect correlation with CA should be replaced by CA and be insensitive to differences of aging among individuals (Table 2). Due to the easy operation and superiority to MLR, PCA is used by researchers with limited computer technology and statistical capacity. In our recent review, we have introduced in detail the criteria of subjects, biomarker selection, basic steps, and some other important points of BA estimation using PCA.20 We also summarized the aging biomarkers selected in the previous researches and explained about the genetic factors as a reference for future studies.20
Hochschild’s method
Hochschild29 noted major problems with MLR in BA estimation, especially when pulmonary function and height were included. He considered it inappropriate to define CA as the selection criterion, arguing that it is not a rational criterion.29 However, completely avoiding the use of CA does not improve the results and causes an overall loss of important information.105 To avoid such problems with MLR, Hochschild proposed a novel method to select aging biomarkers according to their effects on life expectancy.12
Hochschild collected physical data and risk factors for mortality and aggregated the parameters into composite validation variables (CVVs). The standardized BA was constructed with the weighting coefficients analyzed based on correlation analysis between CVVs and standardized test ages. Next, standardized BA was transformed to BA with year as the unit. In the Hochschild method, the reverse regression technique was used to replace the weighting score of CA in multiple linear equation scores for the relation of aging biomarkers to CA, which made CA an independent variable.
The Hochschild’s method is not commonly used for BA estimation because it is a nonstandard and relatively complicated approach (Table 2). However, the Hochschild’s method provides us with a novel view of BA.
KDM
KDM is a graphing method proposed by Klemera and Doubal31 in 2006. They described it as the optimal method for BA estimation, even in young adults.11 The following studies verified that BA constructed by KDM was a more reliable predictor of mortality than was any other methods in multiple age cohorts.12,16,106,107 KDM was constructed based on four presumptions of correspondence among BA, CA, and aging biomarkers: 1) the speed of aging is different among various species and for different individuals of the same species; 2) the relationship between BA and CA can be described as
|
|
where  is a random variable with mean zero and variance
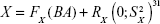
  ; 3) any measurable indicators changing systematically with CA should be defined as aging biomarkers; 4) the actual value of aging biomarkers X should be governed by BA FX (BA) and affected by BA-independent transient random effects
  at the same time using the following equation:
|
|
Based on these four points, Klemera and Doubal used computer-generated stimulations to build BA equations. Detailed steps of KDM are carried out by computer programming. By entering the data of indicators into the program, KDM model can be generated directly.
Then Cho et al16 improved the calculation program of original KDM model, and the reformulation by Cho et al makes KDM much easier to calculate. The reformulated KDM is known as KDM2 (the original is KDM1).12 KDM was proposed based on minimizing the distance between m regression lines and m biomarker points in an m-dimensional space of all biomarkers.31 The advanced concept makes KDM the optimal method for BA estimation. However, the application of KDM is complicated, making it suitable for a research team with strong computer and statistical support. In addition, whether CA should be included as an aging biomarker remains controversial. Mitnitski et al108 proposed that BA estimations without CA are optimal.
Though KDM is now generally accepted as the optimal method of BA estimation evaluated by predicting mortality and diseases,12,106 the conclusion is not accurate, because the mortality and diseases only reflect certain aspects of effectiveness in BA estimations. When it comes to the evaluation of lifespan and longevity, comparisons among the four BA estimation methods are still unavailable. Biomarkers to predict mortality and those of longevity may not necessarily be reciprocal, and they may be different biomarkers altogether, such as telomere.109 Lifespan and longevity are determined by many factors, including environment, living habits, genetic factors, etc.110 All the comparisons among the four BA models are based on cross-sectional studies.12,16,106,107 Longitudinal studies are necessary to evaluate each method effectively.
Structural equation modeling (SEM), future perspectives of BA estimation
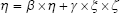
Along with attention to mental and environmental factors, SEM has been used in aging studies that mainly focus on the mental health of elderly individuals.111–117 SEM measures the co-variance of indicators, grouped into indicators and presented in a matrix.111 This method combines factor analysis and MLR to obtain the fit of the model, which could describe more complex relationships among factors.118 The model is described using path diagrams, where circles represent latent variables and residuals and rectangles represent indicators (Figure 2). The coefficients of each pair of variables are noted on the path.119 Typically, SEM includes three equations:
|
|

|
|

|
|
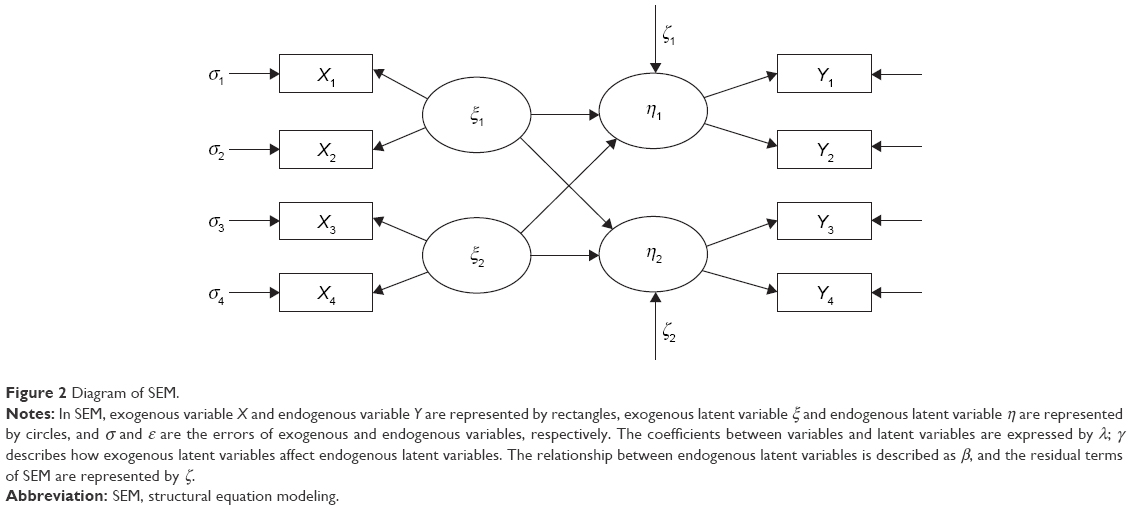 | Figure 2 Diagram of SEM. |
In equations (8), (9), and (10), X represents exogenous variable and Y represents endogenous variable. ξ is the exogenous latent variable, and η is the endogenous latent variable. σ and ε are the errors of exogenous and endogenous variables, respectively. The coefficients between variables and latent variables are expressed by λ; γ describes how exogenous latent variables affect endogenous latent variables. The relationship between endogenous latent variables is described as β, and the residual terms of SEM are represented by ζ.
At present, SEM has not been used for BA estimation because SEM itself only builds the latent concept of BA and not the specific variables that could be compared directly with CA, whereas SEM could be combined with other models for BA estimation. Since SEM provides a novel direction for the analysis of latent variables and interpretation of complex relationship among candidate biomarkers, SEM could be used for the selection of aging biomarkers instead of correlation analysis, which only shows the simple univariate linear relationship between indicators. At the same time, social and psychological indicators could also be used in SEM to fill in the gaps of no psychological aging biomarkers in BA estimation now. Then aging biomarkers chosen by SEM could be analyzed by MLR, PCA, the Hochschild’s method, or KDM. Perhaps, it is a novel approach for the BA estimation.
Comparisons of methods for BA estimation
The concept of BA and BA equations has been developed for >50 years.44 Each method has its own advantages and limitations (Table 2). Based on previous reports, KDM is the best available method.31 However, this does not mean that we should abandon other methods. Every researcher should choose the most suitable approach according to the subjects, research conditions, funds, statistical methods, and even computer skills. MLR is the simplest method that can detect the stabilization and multi-collinearity of empirical data.16,20 However, the edge distortion and paradox of CA cannot be avoided in MLR.22,60 PCA corrects for the edge distortion of MLR. But PCA retains the CA paradox because all biomarkers are selected based on CA.16 In both Hochschild’s method and KDM, CA is transformed into independent variables.12,29,31 These two methods share similar concepts (Table 2), although Hochschild’s method is elusive because it is not based on a statistical definition of BA, and it was based on a single group of people and therefore cannot be generalized.16 Because BA estimations are used to display how CA and BA may differ and evaluate the aging process individually, the KDM model has been found to outperform CA and other models accounting for the association with mortality, working ability, and disease prediction.12,16,31,106 Hence, KDM is considered as the best method for BA estimation at present, even though its complicated calculation limits application of KDM by medical researchers lacking in-depth mathematical and computer skills.
Here, we also compared the aging biomarkers in BA estimation models (Table 3) to discuss whether the selection of biomarkers would impact the effectiveness of each method. It is worth noting that the selected aging biomarkers in each study depend on the test items chosen at the beginning of the study and researchers’ different recognition of aging influence factors. Thus, it is difficult to tell what is the specific aging biomarker of each method. For example, some researchers focused on the laboratory tests,13,38,57–59,71,102 some emphasized the importance of social and physical factors,29,30,76 and the others attempted to carry out test items as many as possible to collect data of the whole body.27,28,104 According to previous studies, indicators from Doppler echocardiography, pulmonary function, and the nervous system, including systolic blood pressure, pulse pressure, intima-media thickness, forced expiratory volume in 1 second, forced vital capacity, and digital symbol test (Tables 1 and 3), often showed closer relations with CA and were easier to be selected in the BA estimation models.28,104,106 Further studies are needed to compare the effectiveness of BA models with and without these indicators in each method. In the few studies covering multiple methods, the aging biomarkers collected from the same population by different methods are almost the same.12,16,106 This may suggest that aging biomarkers are decided by themselves instead of methodology. Hence, the selection of test items is important.
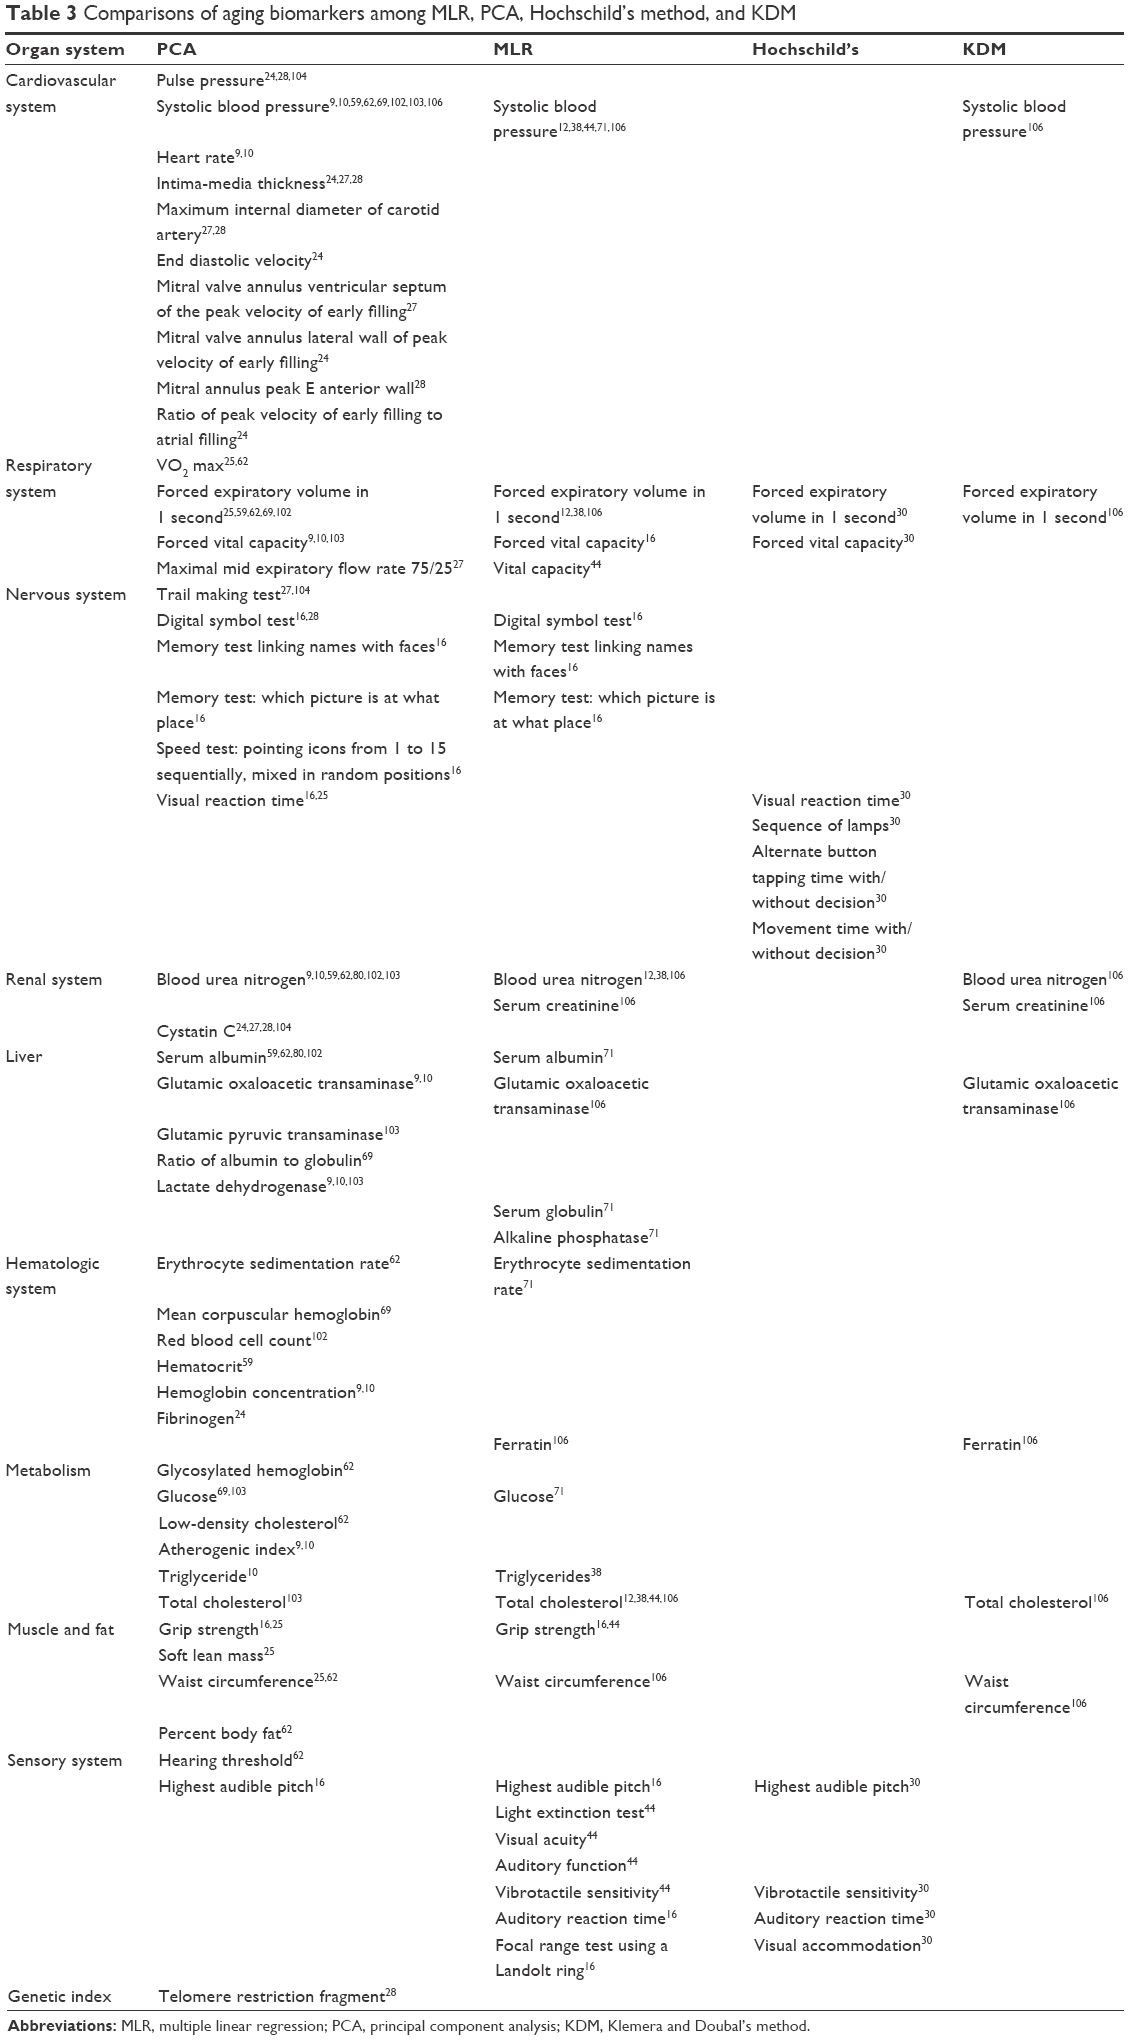 | Table 3 Comparisons of aging biomarkers among MLR, PCA, Hochschild’s method, and KDM |
Prospects
For both MLR and KDM, the main issue remains the character of CA. The role of CA in BA estimation remains unknown, and selection criteria or aging biomarkers remain important. This question has troubled researchers for decades. At this time, the majority of researchers consider CA as an important biomarker,31,46,57 as they believe that the relationship between CA and mortality is reliable and widely described the lifespan as the Gompertz law.120 However, Mitnitski et al108 proposed that CA may not be an aging biomarker. We analyzed CA based on mathematical methods. In the future, it remains important to focus on aging biomarkers, which are more closely related to the essence of heterogeneity, such as genetic indicators, and properly handle the role of CA in BA studies. In addition, internationally recognized BA criteria are still required.
Conclusion
Numerous studies have explored the aging process. With the development of statistical technology and the acknowledgment of aging, researchers estimate BA in a more precise way, such as by MLR, PCA, the Hochschild’s method, and KDM. However, further studies are required to refine the clinical applications of BA estimation. At this time, few studies have generated a BA equation applicable to a wide range of populations, and formulas have been restricted to specific populations with no information on the external validity of BA estimation. In this way, no matter which approach was used, BA formulas have been statistically determined rather than clinically determined. Thus, further studies are required to improve the accuracy of BA and to validate its clinical use.
Acknowledgments
The study was supported by grants from the Major State Basic Research Development Program of China (2013CB530800), the National Natural Science Foundation of China (81601211), and the National Clinic Research Center for Kidney Diseases (2013BAI09B05).
Disclosure
The authors report no conflicts of interest in this work.
References
Fontana L, Partridge L, Longo VD. Extending healthy life span – from yeast to humans. Science. 2010;328(5976):321–326. | ||
Zhang G, Li J, Purkayastha S, et al. Hypothalamic programming of systemic ageing involving IKK-beta, NF-kappaB and GnRH. Nature. 2013;497(7448):211–216. | ||
Steculorum SM, Bruning JC. Die another day: a painless path to longevity. Cell. 2014;157(5):1004–1006. | ||
Riera CE, Huising MO, Follett P, et al. TRPV1 pain receptors regulate longevity and metabolism by neuropeptide signaling. Cell. 2014;157(5):1023–1036. | ||
Yee C, Yang W, Hekimi S. The intrinsic apoptosis pathway mediates the pro-longevity response to mitochondrial ROS in C elegans Cell. 2014;157(4):897–909. | ||
Yabuta S, Masaki M, Shidoji Y. Associations of buccal cell telomere length with daily intake of beta-carotene or alpha-tocopherol are dependent on carotenoid metabolism-related gene polymorphisms in healthy Japanese adults. J Nutr Health Aging. 2016;20(3):267–274. | ||
Gunn DA, Rexbye H, Griffiths CE, et al. Why some women look young for their age. PLoS One. 2009;4(12):e8021. | ||
Harris SE, Deary IJ, MacIntyre A, et al. The association between telomere length, physical health, cognitive ageing, and mortality in non-demented older people. Neurosci Lett. 2006;406(3):260–264. | ||
Nakamura E, Moritani T, Kanetaka A. Biological age versus physical fitness age. Eur J Appl Physiol Occup Physiol. 1989;58(7):778–785. | ||
Nakamura E, Moritani T, Kanetaka A. Biological age versus physical fitness age in women. Eur J Appl Physiol Occup Physiol. 1990;61(3–4):202–208. | ||
Belsky DW, Caspi A, Houts R, et al. Quantification of biological aging in young adults. Proc Natl Acad Sci U S A. 2015;112(30):E4104–E4110. | ||
Levine ME. Modeling the rate of senescence: can estimated biological age predict mortality more accurately than chronological age? J Gerontol A Biol Sci Med Sci. 2013;68(6):667–674. | ||
Nakamura E, Miyao K. Further evaluation of the basic nature of the human biological aging process based on a factor analysis of age-related physiological variables. J Gerontol A Biol Sci Med Sci. 2003;58(3):196–204. | ||
Harnsberger JD, Shrivastav R, Brown WS Jr, Rothman H, Hollien H. Speaking rate and fundamental frequency as speech cues to perceived age. J Voice. 2008;22(1):58–69. | ||
Rippon I, Kneale D, de Oliveira C, Demakakos P, Steptoe A. Perceived age discrimination in older adults. Age Ageing. 2014;43(3):379–386. | ||
Cho IH, Park KS, Lim CJ. An empirical comparative study on biological age estimation algorithms with an application of Work Ability Index (WAI). Mech Ageing Dev. 2010;131(2):69–78. | ||
Goggins WB, Woo J, Sham A, Ho SC. Frailty index as a measure of biological age in a Chinese population. J Gerontol A Biol Sci Med Sci. 2005;60(8):1046–1051. | ||
Jones DM, Song X, Rockwood K. Operationalizing a frailty index from a standardized comprehensive geriatric assessment. J Am Geriatr Soc. 2004;52(11):1929–1933. | ||
Searle SD, Mitnitski A, Gahbauer EA, Gill TM, Rockwood K. A standard procedure for creating a frailty index. BMC Geriatr. 2008;8:24. | ||
Jia LP, Zhang WG, Jia RF, Zhang HL, Chen XM. Construction formula of biological age using the principal component analysis. Biomed Res Int. 2016;2016(2016):4697017. | ||
Bae CY, Kang YG, Piao MH, et al. Models for estimating the biological age of five organs using clinical biomarkers that are commonly measured in clinical practice settings. Maturitas. 2013;75(3):253–260. | ||
Dubina TL, Dyundikova VA, Zhuk EV. Biological age and its estimation. II. Assessment of biological age of albino rats by multiple regression analysis. Exp Gerontol. 1983;18(1):5–18. | ||
Voitenko VP, Tokar AV. The assessment of biological age and sex differences of human aging. Exp Aging Res. 1983;9(4):239–244. | ||
Bai X, Han L, Liu Q, et al. Evaluation of biological aging process – a population-based study of healthy people in China. Gerontology. 2010;56(2):129–140. | ||
Jee H, Jeon BH, Kim YH, et al. Development and application of biological age prediction models with physical fitness and physiological components in Korean adults. Gerontology. 2012;58(4):344–353. | ||
Zhang WG, Bai XJ, Chen DP, et al. Association of Klotho and interleukin 6 gene polymorphisms with aging in Han Chinese population. J Nutr Health Aging. 2014;18(10):900–904. | ||
Zhang WG, Bai XJ, Sun XF, et al. Construction of an integral formula of biological age for a healthy Chinese population using principle component analysis. J Nutr Health Aging. 2014;18(2):137–142. | ||
Zhang WG, Zhu SY, Bai XJ, et al. Select aging biomarkers based on telomere length and chronological age to build a biological age equation. Age (Dordr). 2014;36(3):9639. | ||
Hochschild R. Improving the precision of biological age determinations. Part 1: a new approach to calculating biological age. Exp Gerontol. 1989;24(4):289–300. | ||
Hochschild R. Improving the precision of biological age determinations. Part 2: automatic human tests, age norms and variability. Exp Gerontol. 1989;24(4):301–316. | ||
Klemera P, Doubal S. A new approach to the concept and computation of biological age. Mech Ageing Dev. 2006;127(3):240–248. | ||
Bernardes de Jesus B, Vera E, Schneeberger K, et al. Telomerase gene therapy in adult and old mice delays aging and increases longevity without increasing cancer. EMBO Mol Med. 2012;4(8):691–704. | ||
Costa P, McCrae R. Concepts of Functional or Biological Age: A Critical View. New York, NY: McGraw-Hill; 1985. | ||
Costa P, McCrae R. Functional Age: A Conceptual and Empirical Critique. Washington: US Government Printing Office; 1980. | ||
Anstey KJ, Lord SR, Smith GA. Measuring human functional age: a review of empirical findings. Exp Aging Res. 1996;22(3):245–266. | ||
Ingram DK. Key questions in developing biomarkers of aging. Exp Gerontol. 1988;23(4–5):429–434. | ||
Barak B, Schiffman LG. Cognitive age: a nonchronological age variable. Adv Consum Res. 1981;8:602–606. | ||
Borkan GA, Norris AH. Assessment of biological age using a profile of physical parameters. J Gerontol. 1980;35(2):177–184. | ||
Butler RN, Sprott R, Warner H, et al. Biomarkers of aging: from primitive organisms to humans. J Gerontol A Biol Sci Med Sci. 2004;59(6):B560–B567. | ||
Crews DE. Human Senescence: Evolutionary and Biocultural Perspectives. New York: Cambridge University Press; 2003. | ||
Ding J, Kopchick JJ. Plasma biomarkers of mouse aging. Age (Dordr). 2011;33(3):291–307. | ||
Engelfriet PM, Jansen EH, Picavet HS, Dolle ME. Biochemical markers of aging for longitudinal studies in humans. Epidemiol Rev. 2013;35:132–151. | ||
Furukawa T, Inoue M, Kajiya F, Inada H, Takasugi S. Assessment of biological age by multiple regression analysis. J Gerontol. 1975;30(4):422–434. | ||
Hollingsworth JW, Hashizume A, Jablon S. Correlations between tests of aging in Hiroshima subjects – an attempt to define “physiologic age”. Yale J Biol Med. 1965;38(1):11–26. | ||
Karasik D, Demissie S, Cupples LA, Kiel DP. Disentangling the genetic determinants of human aging: biological age as an alternative to the use of survival measures. J Gerontol A Biol Sci Med Sci. 2005;60(5):574–587. | ||
Kimura M, Mizuta C, Yamada Y, Okayama Y, Nakamura E. Constructing an index of physical fitness age for Japanese elderly based on 7-year longitudinal data: sex differences in estimated physical fitness age. Age (Dordr). 2012;34(1):203–214. | ||
Le Couteur DG, Simpson SJ, de Cabo R. Are glycans the Holy Grail for biomarkers of aging? J Gerontol A Biol Sci Med Sci. 2014;69(7):777–778. | ||
Lopez-Otin C, Blasco MA, Partridge L, Serrano M, Kroemer G. The hallmarks of aging. Cell. 2013;153(6):1194–1217. | ||
Majkić-Singh N. What is a biomarker? From its discovery to clinical application. J Med Biochem. 2011;30:186–192. | ||
Malkin I, Kalichman L, Kobyliansky E. Heritability of a skeletal biomarker of biological aging. Biogerontology. 2007;8(6):627–637. | ||
McClearn GE. Biomarker Characteristics and Research on the Genetics Aging. New Jersey: The Telford Press; 1990. | ||
McClearn GE. Biomarkers of age and aging. Exp Gerontol. 1997;32(1–2):87–94. | ||
Miller RA. Biomarkers of aging. Sci Aging Knowledge Environ. 2001;2001(1):e2. | ||
Mishra MV, Showalter TN, Dicker AP. Biomarkers of aging and radiation therapy tailored to the elderly: future of the field. Semin Radiat Oncol. 2012;22(4):334–338. | ||
Mooradian AD. Biomarkers of aging: do we know what to look for? J Gerontol. 1990;45(6):B183–B186. | ||
Morrow DA, de Lemos JA. Benchmarks for the assessment of novel cardiovascular biomarkers. Circulation. 2007;115(8):949–952. | ||
Nakamura E, Lane MA, Roth GS, Cutler RG, Ingram DK. Evaluating measures of hematology and blood chemistry in male rhesus monkeys as biomarkers of aging. Exp Gerontol. 1994;29(2):151–177. | ||
Nakamura E, Lane MA, Roth GS, Ingram DK. A strategy for identifying biomarkers of aging: further evaluation of hematology and blood chemistry data from a calorie restriction study in rhesus monkeys. Exp Gerontol. 1998;33(5):421–443. | ||
Nakamura E, Miyao K. A method for identifying biomarkers of aging and constructing an index of biological age in humans. J Gerontol A Biol Sci Med Sci. 2007;62(10):1096–1105. | ||
Nakamura E, Miyao K, Ozeki T. Assessment of biological age by principal component analysis. Mech Ageing Dev. 1988;46(1–3):1–18. | ||
Parentini I, Cavallini G, Donati A, Gori Z, Bergamini E. Accumulation of dolichol in older tissues satisfies the proposed criteria to be qualified a biomarker of aging. J Gerontol A Biol Sci Med Sci. 2005;60(1):39–43. | ||
Park J, Cho B, Kwon H, Lee C. Developing a biological age assessment equation using principal component analysis and clinical biomarkers of aging in Korean men. Arch Gerontol Geriatr. 2009;49(1):7–12. | ||
Ries W. Problems associated with biological age. Exp Gerontol. 1974;9(3):145–149. | ||
Ringel RL, Chodzko-Zajko WJ. Vocal indices of biological age. J Voice. 1987;1:31–37. | ||
Robert A. Biology of Aging: Observations and Principles. New Jersey: Prentice Hall Inc; 1991. | ||
Simm A, Johnson TE. Biomarkers of ageing: a challenge for the future. Exp Gerontol. 2010;45(10):731–732. | ||
Sprott RL. Biomarkers of aging and disease: introduction and definitions. Exp Gerontol. 2010;45(1):2–4. | ||
Swindell WR, Harper JM, Miller RA. How long will my mouse live? Machine learning approaches for prediction of mouse life span. J Gerontol A Biol Sci Med Sci. 2008;63(9):895–906. | ||
Ueno LM, Yamashita Y, Moritani T, Nakamura E. Biomarkers of aging in women and the rate of longitudinal changes. J Physiol Anthropol Appl Human Sci. 2003;22(1):37–46. | ||
Vasto S, Scapagnini G, Bulati M, et al. Biomarkers of aging. Front Biosci. 2010;2:93. | ||
Webster IW, Logie AR. A relationship between functional age and health status in female subjects. J Gerontol. 1976;31(5):546–550. | ||
Baker GT, Sprott RL. Biomarkers of aging. Exp Gerontol. 1988;23(4–5):223–239. | ||
Damon A. Predicting age from body measurements and observations. Int J Aging Hum Dev. 1972;3:169–173. | ||
Hlatky MA, Greenland P, Arnett DK, et al. Criteria for evaluation of novel markers of cardiovascular risk: a scientific statement from the American Heart Association. Circulation. 2009;119(17):2408–2416. | ||
Nakamura E. The assessment of physiological age based upon a principal component analysis of various physiological variables. J Kyoto Pref Univ Med. 1985;94:757–769. | ||
Hochschild R. Validating Biomarkers of Aging-Mathematical Approaches and Results of a 2462-Person Study. Boca Raton: CRC Press; 1994. | ||
Cawthon RM. Telomere measurement by quantitative PCR. Nucleic Acids Res. 2002;30(10):e47. | ||
Cawthon RM. Telomere length measurement by a novel monochrome multiplex quantitative PCR method. Nucleic Acids Res. 2009;37(3):e21. | ||
O’Callaghan N, Dhillon V, Thomas P, Fenech M. A quantitative real-time PCR method for absolute telomere length. Biotechniques. 2008;44(6):807–809. | ||
Zhang WG, Linpei J, Jie M, et al. Peripheral blood leukocyte telomere length is associated with age but not renal function: a cross-sectional follow-up study. J Nutr Health Aging. 2017. doi:10.1007/s12603-017-0905-4. | ||
Ritz-Timme S, Rochholz G, Schutz HW, et al. Quality assurance in age estimation based on aspartic acid racemisation. Int J Legal Med. 2000;114(1–2):83–86. | ||
Zubakov D, Liu F, van Zelm MC, et al. Estimating human age from T-cell DNA rearrangements. Curr Biol. 2010;20(22):R970–R971. | ||
Anisimov VN, Bartke A. The key role of growth hormone-insulin-IGF-1 signaling in aging and cancer. Crit Rev Oncol Hematol. 2013;87(3):201–223. | ||
Huffman DM. Exercise as a calorie restriction mimetic: implications for improving healthy aging and longevity. Interdiscip Top Gerontol. 2010;37:157–174. | ||
Roth GS, Lane MA, Ingram DK, et al. Biomarkers of caloric restriction may predict longevity in humans. Science. 2002;297(5582):811. | ||
Guarente L, Kenyon C. Genetic pathways that regulate ageing in model organisms. Nature. 2000;408(6809):255–262. | ||
Mitchell BD, Hsueh WC, King TM, et al. Heritability of life span in the Old Order Amish. Am J Med Genet. 2001;102(4):346–352. | ||
Yashin AI, Iachine IA, Harris JR. Half of the variation in susceptibility to mortality is genetic: findings from Swedish twin survival data. Behav Genet. 1999;29(1):11–19. | ||
Verdun RE, Karlseder J. Replication and protection of telomeres. Nature. 2007;447(7147):924–931. | ||
Young NS. Telomere biology and telomere diseases: implications for practice and research. Hematology Am Soc Hematol Educ Program. 2010;2010:30–35. | ||
Aviv A, Chen W, Gardner JP, et al. Leukocyte telomere dynamics: longitudinal findings among young adults in the Bogalusa Heart Study. Am J Epidemiol. 2009;169(3):323–329. | ||
Epel ES, Merkin SS, Cawthon R, et al. The rate of leukocyte telomere shortening predicts mortality from cardiovascular disease in elderly men. Aging (Albany NY). 2008;1(1):81–88. | ||
Sanders JL, Newman AB. Telomere length in epidemiology: a biomarker of aging, age-related disease, both, or neither? Epidemiol Rev. 2013;35:112–131. | ||
Zhang WG, Wang Y, Hou K, et al. A correlation study of telomere length in peripheral blood leukocytes and kidney function with age. Mol Med Rep. 2015;11(6):4359–4364. | ||
Weidner CI, Lin Q, Koch CM, et al. Aging of blood can be tracked by DNA methylation changes at just three CpG sites. Genome Biol. 2014;15(2):R24. | ||
Sengupta A, Whittaker DK, Shellis RP. Difficulties in estimating age using root dentine translucency in human teeth of varying antiquity. Arch Oral Biol. 1999;44(11):889–99. | ||
Jankauskas R, Barakauskas S, Bojarun R. Incremental lines of dental cementum in biological age estimation. Homo. 2001;52(1):59–71. | ||
Roberts GJ, Parekh S, Petrie A, Lucas VS. Dental age assessment (DAA): a simple method for children and emerging adults. Br Dent J. 2008;204(4):E7; discussion 192–193. | ||
Belozerova LM. Oценки биологического возраста посредством электроэнцефалография. [Biological age estimation by means of electroencephalography]. Adv Gerontol. 2013;26(4):666–670. | ||
Bae CY, Kang YG, Kim S, et al. Development of models for predicting biological age (BA) with physical, biochemical, and hormonal parameters. Arch Gerontol Geriatr. 2008;47(2):253–265. | ||
Kroll J, Saxtrup O. On the use of regression analysis for the estimation of human biological age. Biogerontology. 2000;1(4):363–368. | ||
Nakamura E, Miyao K. Sex differences in human biological aging. J Gerontol A Biol Sci Med Sci. 2008;63(9):936–944. | ||
Nakamura E, Moritani T, Kanetaka A. Effects of habitual physical exercise on physiological age in men aged 20–85 years as estimated using principal component analysis. Eur J Appl Physiol Occup Physiol. 1996;73(5):410–418. | ||
Zhang WG, Jia LP, Cai GY, et al. Model construction for biological age based on a cross-sectional study of a healthy Chinese Han population. J Nutr Health Aging. 2017. doi:10.1007/s12603-017-0874-7. | ||
Chodzko-Zajko WJ, Ringel RL. Physiological fitness measures and sensory and motor performance in aging. Exp Gerontol. 1987;22(5):317–328. | ||
Jee H, Park J. Selection of an optimal set of biomarkers and comparative analyses of biological age estimation models in Korean females. Arch Gerontol Geriatr. 2017;70:84–91. | ||
Levine ME, Crimmins EM. A comparison of methods for assessing mortality risk. Am J Hum Biol. 2014;26(6):768–776. | ||
Mitnitski A, Howlett SE, Rockwood K. Heterogeneity of human aging and its assessment. J Gerontol A Biol Sci Med Sci. Epub 2016 May 23. | ||
Blackburn EH, Epel ES, Lin J. Human telomere biology: a contributory and interactive factor in aging, disease risks, and protection. Science. 2015;350(6265):1193–1198. | ||
Bulpitt CJ. Assessing biological age: practicality? Gerontology. 1995;41(6):315–321. | ||
Doyle YG, Mc Kee M, Sherriff M. A model of successful ageing in British populations. Eur J Public Health. 2012;22(1):71–76. | ||
Foong HF, Hamid TA, Ibrahim R, Haron SA, Shahar S. Predicting cognitive function of the Malaysian elderly: a structural equation modelling approach. Aging Ment Health. 1–12. Epub 2016 Oct 12. | ||
Penke L, Deary IJ. Some guidelines for structural equation modelling in cognitive neuroscience: the case of Charlton et al’s study on white matter integrity and cognitive ageing. Neurobiol Aging. 2010;31(9):1656–1660; discussion 1561–1656. | ||
Piguet O, Grayson DA, Tate RL, et al. A model of executive functions in very old community dwellers: evidence from The Sydney Older Persons Study. Cortex. 2005;41(1):27–37. | ||
Raykov T. Reserve capacity of the elderly in aging sensitive tests of fluid intelligence: a reanalysis via a structural equation modelling approach. Z Psychol Z Angew Psychol. 1989;197(3):263–282. | ||
Yang T, Shen YM, Zhu M, et al. Effects of co-worker and supervisor support on job stress and presenteeism in an aging workforce: a structural equation modelling approach. Int J Environ Res Public Health. 2015;13(1):ijerh13010072. | ||
Bentler PM, Stein JA. Structural equation models in medical research. Stat Methods Med Res. 1992;1(2):159–181. | ||
Spazzafumo L, Olivieri F, Abbatecola AM, et al. Remodelling of biological parameters during human ageing: evidence for complex regulation in longevity and in type 2 diabetes. Age (Dordr). 2013;35(2):419–429. | ||
Stein CM, Morris NJ, Nock NL. Structural equation modeling. In: Elston RC, editor. Statistical Human Genetics: Methods and Protocols. Vol. 850. New York: Springer; 2012:495–512. | ||
Kirkwood TB. Deciphering death: a commentary on Gompertz (1825) ‘On the nature of the function expressive of the law of human mortality, and on a new mode of determining the value of life contingencies’. Philos Trans R Soc Lond B Biol Sci. 2015;370(1666):20140379. |
 © 2017 The Author(s). This work is published and licensed by Dove Medical Press Limited. The full terms of this license are available at https://www.dovepress.com/terms.php and incorporate the Creative Commons Attribution - Non Commercial (unported, v3.0) License.
By accessing the work you hereby accept the Terms. Non-commercial uses of the work are permitted without any further permission from Dove Medical Press Limited, provided the work is properly attributed. For permission for commercial use of this work, please see paragraphs 4.2 and 5 of our Terms.
© 2017 The Author(s). This work is published and licensed by Dove Medical Press Limited. The full terms of this license are available at https://www.dovepress.com/terms.php and incorporate the Creative Commons Attribution - Non Commercial (unported, v3.0) License.
By accessing the work you hereby accept the Terms. Non-commercial uses of the work are permitted without any further permission from Dove Medical Press Limited, provided the work is properly attributed. For permission for commercial use of this work, please see paragraphs 4.2 and 5 of our Terms.